
Introduction
Both political media and the character of public meetings have changed radically over the past half-century. The media of the 1960s were dominated by the largely interchangeable news coverage of CBS, ABC, and NBC; today the opposing positions of Fox and MSNBC are a major media presence, as are the myriad internet sites individuals can and do self-select in order to reinforce a given position (Iyengar & Hahn 2009; Sunstein 2009; Stroud 2011; Pew Research Center 2012; Prior 2013). At the same time, there has been a dramatic decline in the role of fraternal and other groups that afforded face to face discussion among local groups in ways that often cross-cut economic and political differences—the Rotary Club, Elks, Lions, American Legion, Masons, and Order of the Eastern Star (Skocpol 2003; Bishop 2008). There have been a range of contemporary appeals for increased group deliberations in the form of citizen forums, ‘public spheres,’ or ‘mini-publics’ (Habermas 1996; Fishkin 1991, 1995, 2009; Bryan 2004; Fung 2006; Warren & Pearse 2008; Warren 2009; Niemeyer 2011; Grönlund, Bächtiger & Setälä 2013).
Prospects for individual self-selection of belief-tailored media have increased. Prospects for deliberative group discussion in the tradition of town meetings have seemed to decrease, with arguments that it should be revived. What consequences can we expect for political polarization from changes in these two variables? What effects can we expect self-selected media sources have on opinion polarization in a population? What effects can we expect town meetings to have? The focus of our study here: in what ways might we expect these two opinion-shaping forces to work together or in opposition, either moderating or amplifying opinion polarization across a population?
We construct an agent-based model in the search for some insight into dynamics that may be operational in our contemporary political environment. The basic mechanisms of that model are patterned on established psychological principles. Its core is in the tradition of Axelrod’s model of cultural assimilation and dissociation, directly targeting polarization in terms of the basic psychological principles of homophily and imitation (Axelrod 1997; Castellano. Marsili & Vespignani 2000; Klemm, Eguíluz, Toral & San Miguel 2003b, 2003c; Flache & Macy 2006). By homophily, people are more likely to interact with those who share many of their cultural attributes (McPherson, Smith-Lovin, & Cook 2011). By imitation, interactions between people tend to increase the number of attributes they share (Festinger 1954).
To those mechanisms we add self-selected media and the force of group consensus as social reinforcers. Scheduled reinforcement is a stalwart of behavioral psychology (Ferster & Skinner 1957; Zeiler 1977; Morgan 2010). The effectiveness of a reinforcer in strengthening or weakening a particular behavior depends not merely on how many times it has been given but on the schedule of reinforcement. The effectiveness with which a target behavior is shaped or eliminated can depend not only on whether reinforcers are negative or positive but on patterns of multiple combinatory reinforcers given before and/or after the target behavior (Madden 2013; Morgan 2010; Zeiler 1977). Skinner was clear that reinforcers may well be cultural, evolved in a social environment in precisely the sense employed here: "Human behavior is the joint product of (i) the contingencies of survival responsible for the natural selection of the species and (ii) the contingencies of reinforcement responsible for the repertories acquired by its members, including (iii) the special contingencies maintained by an evolved social environment, culture" (Skinner 1981, p.502).
It is undoubtedly true both that culture is the product of individual decisions and that individual decisions are often the product of cultural forces. The social dynamics may well be complex (Mason, Conrey & Smith 2007). In this paper we focus on mechanisms of scheduled and multiple social reinforcement in order to track the impact on polarization of interaction effects between self-selected media and the influence of group consensus within town meetings, ‘public spheres,’ or ‘mini-publics’ (Habermas 1996; Fishkin 1991; 1995; 2009; Fung 2006; Warren & Pearse 2008; Niemeyer 2011; Grönlund, Bächtiger & Setälä 2013).
It is well known that the effect of superimposed schedules of reinforcement can differ significantly from the effect of individual schedules alone and from any simple linear addition of effects (Ferster & Skinner 1957; Wilkie 1972; Brechner 1977; Brechner & Linder 1981; Williams 1983, 1994). But to our knowledge the interaction effects of superimposed reinforcement schedules have not been broached in social modeling. Our results indicate complex interaction effects between self-selected media and town meetings that would not have been expected from considering either alone.
The Model
The model we use is a variation and extension of Axelrod (1997) that also incorporates selected features from Deffuant et. al. (2000, 2002, 2004). We offer a condensed characterization followed by explanation of the motivation for particular features and ties to background literature. Model code is available here.
Agents on a lattice each have a set of political beliefs, modelled as a list of 5 real-valued numbers from 1 to 10. Three types of interactions occur which may shift an agent’s political beliefs: neighbor interactions, media interactions, and the group interactions we term 'town meetings.' Interaction of each type occurs with a probability calculated from the over-all similarity between an agent and the target (neighbor, media source, or average view of agents in town meeting). Similarity is found by summing the difference of each political belief, normalizing by dividing by the maximum possible difference, then subtracting from 1. Using integer values for a simple example, given that belief values range from 1 to 10, the belief sets [1 3 5 4 3] and [5 5 5 5 5] have a similarity 1 – [(5-1 + 5-3 + 5-5 + 5-4 + 5-3) / ((10-1) * 5)] = 0.80. The sets [1 2 1 2 1] and [5 5 5 5 5] are less similar, and have a similarity of 1 - (5-1 + 5-2 + 5-1 + 5-2 + 5-1) / ((10-1) * 5) = 0.60. If the similarity between an agent and the target is X, the agent has an X% chance of shifting one of its political beliefs. We randomly choose a single political belief that differs between the agent and the target, shifting that belief of the agent halfway to that of the target. For example, if the agent's belief is 2.07 and the other belief is 6.89, the agent's political belief value is set to 2.07 + (6.897 – 2.07) * 0.5 = 4.48. For computational simplicity, values are rounded to the nearest hundredth.
The first form of interaction we investigate is between neighbors. At each step or 'tick' of the simulation, each agent chooses a random one of its 8 neighbors. Given a similarity of X to that neighbor, as outlined above, the agent has an X% probability of changing one of its political beliefs to match a different belief of its neighbor[1]. The second form of interaction is between agents and polarized media. Here we use two constant agents at opposite extremes of the political spectrum, one with all values at 1.00, another with all values at 10.00. Given a similarity X to a media source, agents interact with probability X with that media source that is over-all most similar, updating a randomly chosen belief as in the case of neighbor interaction. The third form of interaction is in town meetings, simulated by choosing a random position in the array and a distance radius of cells. Agents within that radius are identified as meeting participants. The political beliefs of the participants are averaged together and each participant then adjusts each of its values halfway toward the values of that group prototype.
Baseline simulations use ‘word of mouth’ interactions with neighbors. At sampling intervals we record the distribution of agents’ averaged belief values, allowing us to use standard deviation in order to track the pattern of belief distribution over time. Against a background of neighbor interactions at each tick of the simulation, we then independently record the changes in belief distributions produced by (i) polarized media interaction of a fixed 10% of the population at different time intervals, and (ii) 'town meetings' of different radii at different time intervals. Because our main interest is in the interaction of media and town meetings, we report different interval settings for the two that show clear interactive effects on polarization.
Our final analysis attempts to gauge the scope of these effects. In our initial simulations it difficult to separate scheduling effects—how often town meetings occur, for example — from population proportion effects — what proportion of the population is involved in town meetings. In our final analysis we eliminate the scheduling effect by enforcing the selected interaction mechanisms each tick, varying only the proportion of the population affected. With neighbor interaction as a constant background, the proportion of the population interacting with media sources can vary from 0 to 100% as the proportion of the population interacting in town-meeting style varies from 0 to 100% as well. Using standard deviation together with the global average of agents’ beliefs we are able to graph different polarization patterns across combinations of percentage parameters, confirming in greater definition the scope of the interaction effects identified in the earlier simulations.
Opinion Updating: Adapting the Axelrod model
In Axelrod’s model of cultural diffusion, agents in a bordered lattice (initially 10 x 10) are characterized by a representation of ‘traits’ on each of a small number of 'features' (see Figure 1). Axelrod thinks of traits, represented as digits 0 through 9, as alternative cultural choices within, say, five cultural categories: alternative choices of color for particular items of clothing, for example. A series 8 7 3 0 5 is intended to represent a 'culture' of different trait choices on a given set of features. We incorporate the multiple features of the Axelrod model as a major feature of our own, though reinterpreted in terms of suites of political opinions rather than aspects of a culture.
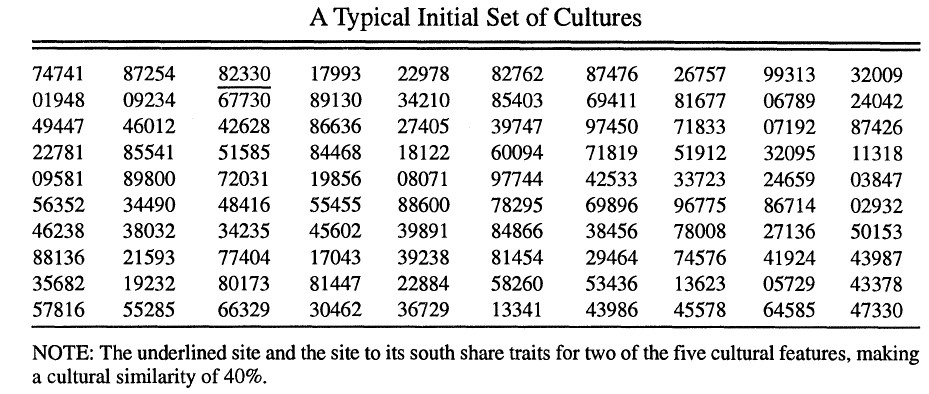
Axelrod attempts to capture two simple psychological principles of social influence: that people interact more with those who are like them, and that people come to hold views more like the views of those with whom they interact (Festinger 1954; McPherson, Smith-Lovin & Cook 2011). His core mechanism is one in which agents interact with bordering neighbors in the array with a probability proportionate to the number of features on which they share identical traits. On each round, a random agent and one of its neighbors are chosen for possible interaction. A pair with codes 8 7 3 0 5 and 8 7 3 9 2 will have a 60% chance of interaction; neighbors with codes 8 7 3 0 5 and 8 9 2 4 6 will have only a 20% chance. Should interaction take place, the original agent changes one of its mismatched traits (randomly chosen) to match that of its neighbor. If 8 7 3 0 5 is the original agent and 8 7 3 4 2 is its chosen neighbor, for example, the original agent may change its code to 8 7 3 4 5.
Using homophily and imitation as basic principles of social influence, we follow Axelrod in using sets of multiple values. We reinterpret these as modeling sets of political views rather than cultural features, with belief dynamics modeled as change across the multiple elements of those belief suites. In this respect the model contrasts with models written in terms of single values, whether discrete or continuous, characteristic of virtually all other traditions in the literature (Galam 1997; Kacpersky & Holyst 2000; Hegselmann & Krause 2002; 2000, 2002, 2004). In contrast with Axelrod, we model those multiple values in line with the intuitions regarding graduated opinion that guide the Deffuant tradition (2000, 2002, 2004; McKeown & Sheehy 2006). Features are treated as opinion topics rather than aspects of a culture, with trait values conceived as a spectrum of real values from 1 to 10 representing alternative positions on those topics.
We adapt rules for interaction and updating accordingly. In Axelrod’s model, features are taken as aspects of a culture and distinct traits function simply as distinct alternatives. An agent’s trait value on feature 5 is either distinct from that of its neighbor or not: a trait value of 8 is no closer to an alternative of 9 than is a trait value of 2. In our more sociopolitical interpretation, a series 8.02 7.56 3.19 0.61 5.97 will represent a particular configuration of shaded positions on, say, gun control, abortion, foreign policy, gay marriage, and immigration, ranging perhaps from conservative to liberal. In our modeling, a position of 3.07 on gun control is closer to 2.67 than it is to 9.56 (see also Flache & Macy 2006).
Agents interact with a probability that matches their similarity, but that similarity is measured not in terms of full trait matches on features, as in Axelrod, but on trait proximity across the set of features as a whole. As outlined above, we sum the total differences in trait values across the entire set of features, dividing that by the maximum possible difference. In Axelrod’s model, the probability of interaction between individuals will be zero when they match on no features—an aspect crucial to his modeling of polarization. In our model, because dissimilarity is measured by belief distance rather than trait match, probability of interaction virtually never reaches absolute zero. When agents do interact, moreover, the alteration of a randomly chosen point of disagreement will not be a sudden jump to the opinion value of the target. Our updating uses a slide of 50% instead: on the randomly chosen position, the agent’s opinion will move halfway toward that of the target. Unlike bounded confidence models (Dittmer 2001; Hegselmann & Krause 2002; McKeown & Sheehy 2006), but in line with relative agreement variations (Deffuant 2004), we think it most realistic to avoid any sharp threshold for influence: any degree of similarity across belief suites allows for some probability of interaction and graduated belief change.
We follow both the Axelrod and Deffuant traditions in modeling agent interaction on a lattice, with the influence of immediate neighbors as a component. In modeling the influence of deliberative group discussion, however, we also expand areas of influence beyond immediate neighbors to larger ‘town meeting’ patches in the lattice. With the precedent of McKeown and Sheehy (2006) we also introduce polarized media influence, but with a mechanism intended to model self-selected exposure. Our focus over all is on the combined influence of these forces when taken together: interaction effects of self-selected media together with town meetings as social reinforcers.
The configuration of the model, incorporating these features, is shown in Figure 2. Agents start with randomized traits, interacting with probabilities geared to over-all similarity and updating as a half-way approximation on a randomly chosen feature. Background histograms using intervals of 0.25 show the basic shape of aggregate values on features individually and combined, with color coding for liberal (red) or conservative (blue) leanings of agents averaged over all features.
Schedules of social reinforcement: Town meetings and self-selected media
We expand the model in our more explicitly political interpretation to explore two forms of social influence, acting either independently or together. We model self-chosen media influence as interaction with unchanging external opinion configurations chosen on the basis of similarity to an agent’s beliefs. We model town meetings as influence within larger clusters of neighbors. How does each of these forces shape public opinion? Most importantly, we want to explore what kind of interaction effects appear when both media influences and town meetings are in play simultaneously.
Models intended to include the effect of mass media have used both Axelrod’s and Deffuant’s bounded confidence models as a base (Shibanai, Yasuno & Ishiguro 2001; González-Avella, et. al. 2007), with some attention to both extremity of media influences and scheduling or ‘broadcast ratio’ (McKeown & Sheehy 2006). What has not been well modeled is the well-recognized sociological effect of self-selected media (Sunstein 2002, 2009; Bennett & Iyengar 2008; Iyengar & Hahn 2009; Stroud 2011; Levendusky 2013, 2014; Leeper 2014).
A clear feature of the contemporary broadcast and cable environment is the existence of politically polarized media sources: Fox News and MSNBC are prime players, showing a clear conservative and liberal slant respectively in their news reporting, their editorializing, and the combination of the two. It is to be expected that individuals will seek out those media sources that echo and support their own political leanings (Iyengar & Hahn 2009; Sunstein 2009; Stroud 2011; Pew Research Center 2012; Prior 2013). The predictable result will be a strengthening of the initial leaning and reinforcement of those views that correspond to the slant of the media source chosen. Given a small number of media sources that are themselves polarized, self-selection of media can be expected to have a polarizing effect on public opinion at large[2].
We follow McKeown & Sheehy (2006) in modeling two polarized media sources, though with continuous influence across elements in a suite of beliefs rather than a threshold cut-off of influence in a single belief[3]. One media source has opinions at 1.00 on the scale of all topics; the other has opinions at 10.00 for all topics. Like McKeown & Sheehy (2006) we explored variations in degrees of polarization between media sources, but found the simple fact that media sources are symmetrically polarized is what proves crucial, rather than the specific points of polarization. Because results are similar at different separations we report just the extreme case here.
Individuals 'self-select' that media source that is most similar to their belief set over all, interacting with that media source with a probability based on over-all similarity. The fact that individuals most similar in opinion to a media source will have the highest probability of interaction and thus influence by that source accords perfectly with recent results on the effect of polarized media. Both Fiorina and Levendusky (2006), Levendusky (2013, 2014) and Leeper (2014) offer experimental evidence that it is individuals with opinions at extremes that are those most influenced by extreme media.
Previous work has not included the effect of citizen forums, ‘public spheres,’ or ‘mini-publics’ in the tradition of town meetings, much touted in aspects of political science (Habermas 1996; Fishkin 1991, Fishkin 1995, Fishkin 2009; Bryan 2004; Fung 2006; Warren & Pearse 2008; Warren 2009; Niemeyer 2011; Grönlund, Bächtiger & Setälä 2013). The psychological processes of social influence and attitude change within a group have been well documented (Turner 1985). Typically, a group is cognitively represented in terms of a group prototype, a set of attributes taken not only to describe the group but to prescribe how people should feel, think, and behave as group members, and how they should evaluate themselves and others. Social influence occurs as people assimilate themselves to the prototype of the group they belong to. Drawing on this psychological principle, we have each agent in a modeled group or town meeting interact with a prototypical position constructed by averaging values on each opinion topic across the whole, shifting a value to a point halfway between theirs and the prototypical position on each feature.
Word of mouth influence is restricted to each cell’s immediate neighbors. We model group influence in the town meeting tradition using larger areas of the array in which each cell is influenced by a prototypical position that consists of values on each opinion topic that are simply the average for all members of the group. As a participant in a group meeting, a cell updates values for each of its opinion topics by shifting to a point halfway between its original position on that topic and the group average represented in the prototype. We also explore how the size of group meetings may affect public opinion formation. Within an array of 400 cells we treat a small group as one in which individuals within a radius of 4 of that point interact, giving a group of 49 individuals. A medium group meeting is set at a radius of 7, with 149 individuals. A large citizen forum takes a radius of 10, incorporating 317 individuals. With larger arrays using groups of the same population percentage we have found comparable results.
What we consider most significant in the model offered here are prospects for studying the interaction of self-selected media and group influence in social communication and opinion change. It is clear from the psychological literature that superimposing schedules of reinforcement from different stimuli can produce results that are importantly different from the individual stimuli schedules by themselves and from any linear addition of their effects (Ferster & Skinner 1957, Wilkie 197, Brechner 1977, Brechner & Linder 1981; Williams 1983, 1994). Here we broach the interaction effects of superimposed reinforcement schedules in the context of social modeling. What the results show are complex interaction effects between self-selected media and group or town meetings that would not have been expected from considering either alone.
Results
We first examine how each of three social reinforcers (word of mouth, self-selected media, and town meetings) shapes public opinions when operating individually. We next explore interaction effects of the social reinforcers by applying different reinforcement schedules. We conclude by testing the robustness of observed effects across a full range of parameter combinations.
Word of mouth
Agents across a 20 x 20 array start with randomized traits 1 through 10 in each of 5 feature slots[4]. A random agent and one of his neighbors are chosen each generation, with a probability of interaction given by their trait proximity across all features, as outlined above. If the two do interact, one randomly chosen trait of the agent is moved by a slider of 50% toward that of its neighbor.
Where agents update merely by word of mouth communication, interacting with their more similar neighbors and becoming more similar as a result, opinion across the population as a whole converges to an increasingly tight and increasingly uniform central position on the opinion scale.
Figure 3 shows the evolution of a typical random array. Background histograms indicate convergence at a central value for each of 5 features. The aggregate histogram and color coding show that convergence in terms added values for each agent across all 5 features.
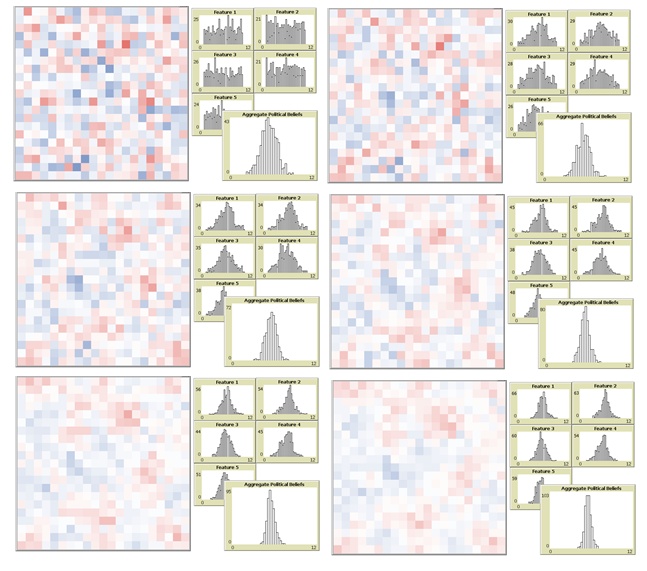
Standard deviation can be used as a simple measure of histogram configuration. Simple convergence at the middle, as here, is indicated by the move to low standard deviation shown in Figure 4.
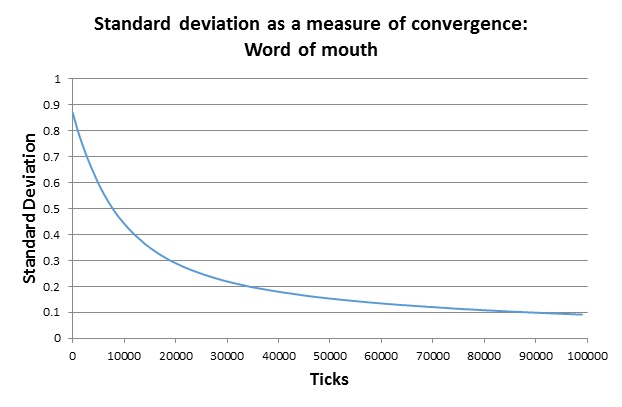
In our model, as in Axelrod’s and other predecessors, one can often see the development of local color regions, light blue for one side of the spectrum and pink for the other, for example. In our model, however, because dissimilarity is measured by trait distance rather than trait match and without any sharp threshold at which influence is cut off, probability of interaction virtually never reaches absolute zero. Interaction therefore continues, as does the growth of consensus and similarity[5].
Town meetings
We retain word of mouth as a background social mechanism, adding group or town meetings as outlined above at a schedule of specific intervals: for every 25 ticks at which individuals interact by word of mouth with immediate neighbors, for example, a town meeting will occur in the radius of a randomly chosen point in the array. At a radius of 4, a small group includes 49 individuals of a 400 cell array. At a radius of 7, a medium group consists of 149. A large group, at radius 10, incorporates 317. When group influence of this form is added, of any radius, the result is still convergence to the center (Figure 5). Changes in other parameters result only in a difference in speed. The larger the meetings, and the more frequently they occur, the faster the population comes to a central consensus. Using standard deviation as a simple measure of distribution, Figure 6 shows the correlation between size of town meetings and speed to consensus.

To this point, using either word of mouth or town meetings, the lesson of the model is simply a lesson in opinion convergence. Both word of mouth and town meetings are forces toward agreement of opinion across a population[6]. Results turn out to be importantly different with self-selected media.
Self-selected media
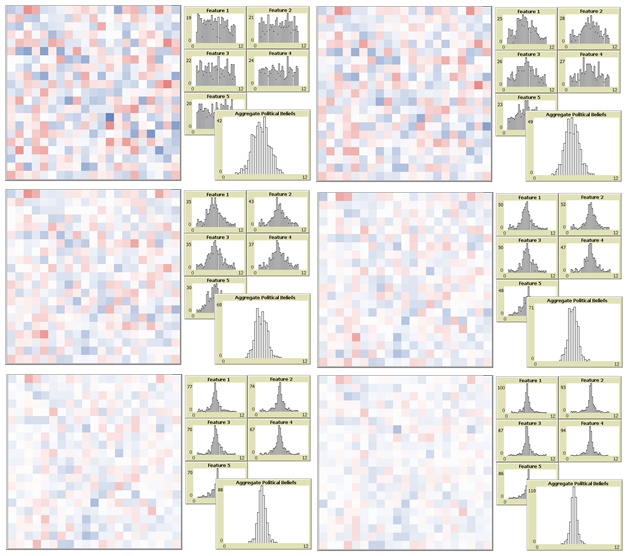
Given self-selection of polarized media sources as outlined above, results show opinion bifurcation across the population, with each side drifting toward the closest media source (Figure 7)[7]. Simulation results are in line with empirical evidence (Pew Research Center 2012;Prior 2013) and follow precisely the pattern background intuitions would suggest.

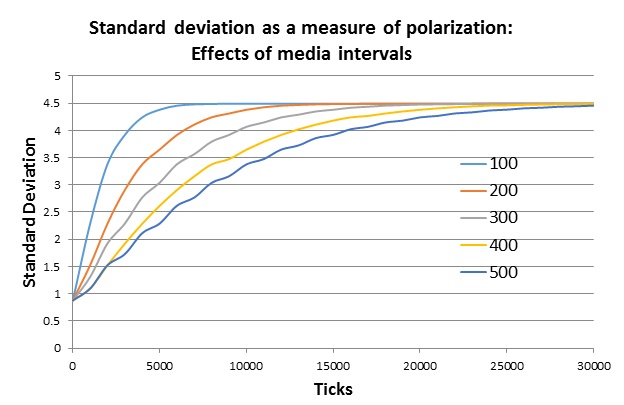
The reinforcement schedule for the possibility of media exposure, like for group meetings, can be set at various intervals. For every 100, 200, or 300 ticks at which individuals interact with neighbors, a certain percentage of the population—here set at an arbitrary 10%—is exposed to the similarity-based probability of interaction with the closest media source. Like word of mouth influence from immediate neighbors, probability of interaction is determined by similarity between opinion configurations in the individual and the closest media source[8]. Figure 8 shows standard deviation as a measure for polarization over time for different intervals of media exposure.
Interaction of Media and Town Meetings
The most interesting and complex results appear when we put both influences into play. Results for the interaction of the two social reinforcers acting together are shown in Figure 9. With media influence as outlined every 50 ticks and medium-sized town meetings at the same rate, standard deviation remains high: a sign of sustained polarized bifurcation at the ends of the spectrum. As media influence appears at longer intervals—after only every 100 ticks, 150, or 200—effects of convergence slowly overpower polarized bifurcation over the course of a run. With media accessed at 100 ticks or above, the dominant effect of town meetings results in a convergence of opinion across the community.
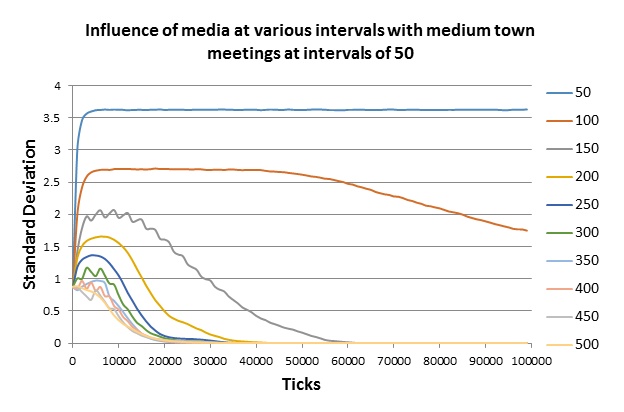
Hidden in standard deviation as a single measure, however, is an important interference effect between our two social reinforcers. What is particularly worthy of note is a dynamic involving two successive movements in the pattern of development. Consider for example the development of standard deviation in Figure 9 at a media rate of 150, 200, or 250. Here standard deviation first rises—indicating a polarized bifurcation in opinion—and only then converges[9].
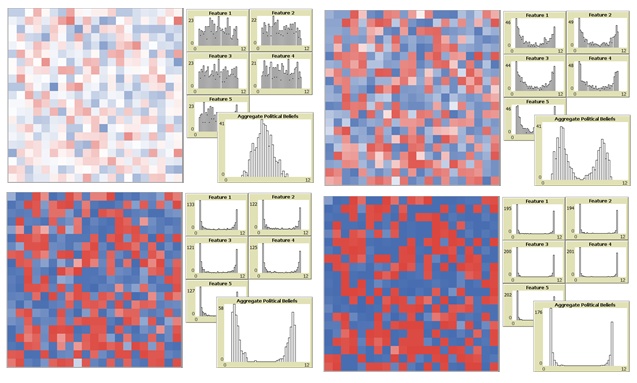
What is happening is illustrated in the successive frames and histograms of Figure 10. What first appears is a polarized bifurcation of opinion, familiar from the pattern of media influence. This is then followed by opinion convergence, on the pattern of town meetings. But with the media influence in place, the convergence that results is not at the center of the opinion spectrum but rather at one of the extremes defined by the media sources.
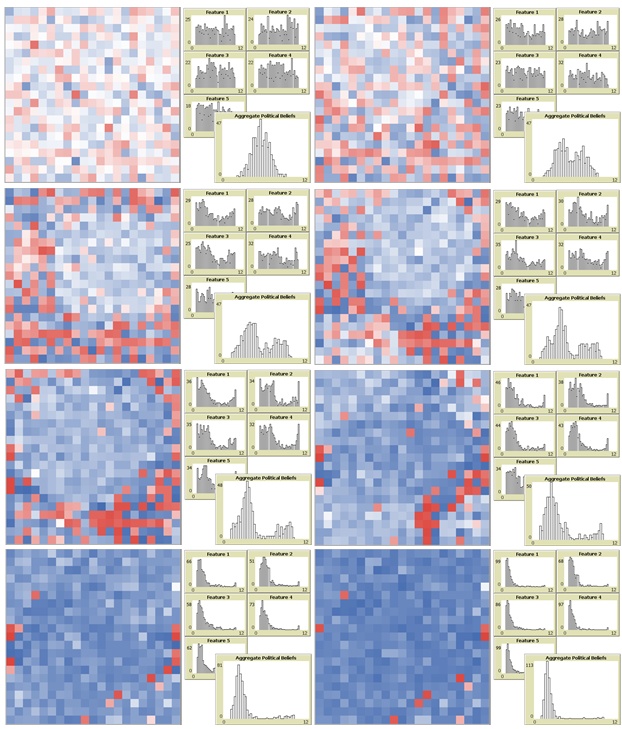
The influences of self-selected media and of town meetings are thus not merely competitive. It is not merely that one will dominate, with the result being either central convergence or bifurcated polarization. Where influence via town meetings is more frequent than that of self-selected media, holding constant meetings of medium size, the modelled social dynamics produces neither central convergence nor bifurcated polarization. The result is indeed convergence, as in the effect of town meetings alone, but convergence at one end of the spectrum of opinion—an effect clearly influenced by polarized media, but not one that is an effect of media alone.
The Scope of Interaction Effects
How pervasive is the interaction effect of media and town meetings observed above? In order to understand which parameter sets yield which outputs, we enlarge our array and re-tool the model to standardize the effects of media and town hall meeting interactions. In this form the variable for each influence is not the tick-interval of exposure but percentage of the population exposed to an influence at each tick of the simulation. At each tick, individuals in a 200 x 200 array interact with neighbors in terms of similarity as before. At each tick, however, Y% of the population is also involved in a clustered town hall meeting. At each tick, with probability based on over-all similarity, X% of the population also interacts with their closest media source: our modeling for self-selected media exposure. By varying the percentage of the population involved at each tick in town meetings and self-selected media exposure we can explore interaction effects without some of the complexities tracked with temporal scheduling. Standard deviation was used above as a means of judging the end state of opinion across the population. Here we attempt a more complete view. Using measures for global average belief values and standard deviation together, we distinguish the range of possible outcomes shown in Figure 11.
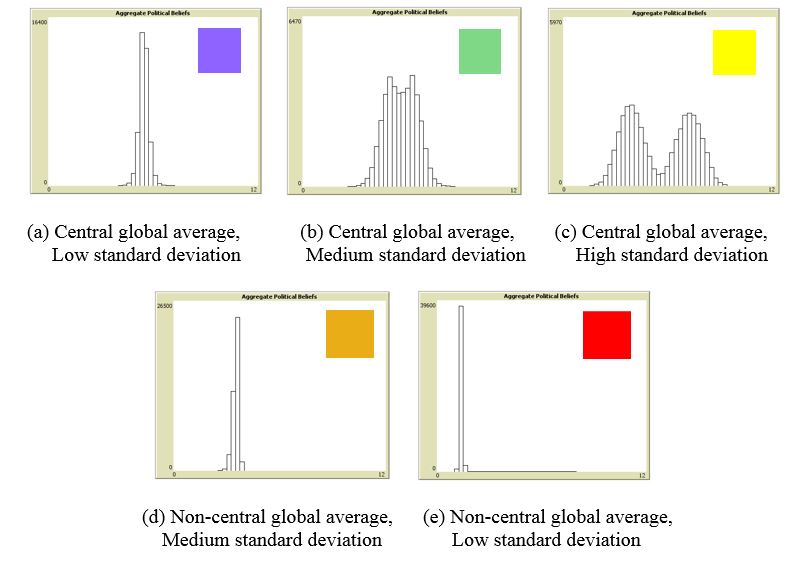
The outcome (a) in which there is a close convergence of belief at the center of the political spectrum will have an approximately central value for global average belief and a very small standard deviation. That outcome will be coded in purple. An outcome (b) with central convergence that is somewhat less pronounced will have a central value for global average and a moderate standard deviation, coded in green. Outcome (c) in which there is polarized bifurcation on each side of the center will retain a central value for global average but have wide standard deviation, coded in yellow. The remaining two cases mark convergence at one end of the spectrum. Case (d), indicating moderate movement to one side in terms of a non-central average and moderate standard deviation, is indicated in a light brown. Case (e) is of particular interest: strong convergence on one extreme of the spectrum, indicated by non-central average and low standard deviation. This is the case we mark in red.
With color coding for these outcomes, we construct a heat map of interaction results using (i) percentages of the population involved in a town meeting each tick and (ii) percentages of the population which may be interacting with self-selected media each tick, each measured from 0 to 100% in steps of 1%. The six images of Figure 12 show the belief distributions for 10,000 200 x 200 arrays at six stages of development.

At 25 ticks of development, belief distribution shows polarized bifurcation (yellow) for most of the sampled arrays. Arrays characterized by a high enough percentage involved in town hall meetings, however, still show the central consensus indicated by green. The rough distribution of green and yellow across parameter combinations that is evident at 25 ticks remains as something of a background to further stages of development—a background against which another pattern plays out.
Starting at 50 ticks in the evolution, increasing numbers of arrays show a pattern of non-centralized convergence. First brown (non-central consensus with medium standard deviation) and then red (non-central consensus with low standard deviation) invade the heat map from the top. Red represents consensus at an opinion extreme, which over time appears in arrays with progressively smaller percentages involved in town meetings and self-selected media. Consensus at an extreme appears first for arrays that previously showed a centralized consensus (green), indicating a movement of consensus from the center to the extreme. But the same extreme consensus also eventually appears for arrays that previously showed a bimodal polarization (yellow), indicating a movement from opinion bifurcation to consensus at one end of the opinion spectrum.
Consider for example a single array from the 10,000 shown in each of the heat maps in Figure 12. At roughly the black spot in the first frame is an array in which 15% of the population is involved each tick in the self-selected media interaction outlined, with 40% of the population involved in a town-hall meeting. At 25 ticks, this array shows centralized consensus. By 100 ticks, it shows conversion to a non-central consensus (brown) to one side. By 150 ticks it shows a convergence at one extreme of the opinion scale (red). Indeed by 150 ticks the majority of arrays in the heat map, representing the majority of parameter combinations, show consensus at an extreme.
What the heat maps of parameter sweeps demonstrate is the robust pervasiveness of the effect outlined in the specific examples of earlier sections. Town hall meetings have a consensus effect: updating on the common wisdom of the group brings views together. Where media are themselves polarized, self-selected media show a polarizing effect on belief patterns. But where the two operate together, progressively across a wide range of parameter values for each, the result is neither polarized bifurcation nor central consensus. The effect of interaction between town meetings and self-selected media is opinion convergence at an extreme of the belief scale—an extreme that is itself set by one of the media sources in play. A number of model modifications remain for further exploration. Here, for example, percentages of the population involved in a town meeting are percentages included in a single town meeting; a percentage of 40% indicates a single town meeting in which 40% of the population participates. An alternative worth exploration is one in which the same proportion of the population is involved in some meeting or other, but in which that proportion may represent a sum of smaller meetings.
A number of model parameters have been set arbitrarily, including the amount that a numeric belief value changes as a result of an interaction. Variation of many such parameters remains to be explored, tied perhaps to experimental values from social psychology.
Discussion
Drawing on Axelrod’s culture model (1997), with modifications in line with Deffaunt et. al. (2000, 2002, 2004), the topic of the current work is how interaction effects between two social reinforcers—town meetings and self-selected media—can shape public opinion. Simulation results follow background intuitions: town meetings produce a convergence of opinion at the center, while self-selected media polarize opinion at distinct media points. When the two reinforcers operate together, however, the result can be convergence at one of the extremes defined by media.
Viewed in terms of schedule, a clear example is the case of middle levels of meeting size (140 of 400 individuals) with meetings at intervals of 50 ticks and self-selected media influence tied to similarity at intervals of 150. Here opinion first shows polarized bifurcation, a clear effect of polarized media. At a later stage opinion converges, a clear influence of town meetings. Final convergence, however, is not central but at one extreme of the media-defined poles of opinion (Figure 9).
The same effect appears clearly is clearly in a parameter sweep for percentages between 0 and 100 of the population involved in (i) town meetings and (ii) self-selected media in large (200 x 200) arrays. Results show a robust tendency developing over time for a majority of arrays to converge to consensus opinion at one of the media-defined poles. The effect is clear and defined at 150 ticks for arrays in which town-meeting percentage equals or exceeds the percentage of individuals exposed to media influence with a probability geared to similarity (Figure 12).
One way of putting the result, phrased in terms of media influence, is this: Polarized media clearly have an effect on public opinion in the model, but have a very different effect depending on the presence or absence of town meetings. Without town meetings, polarized media result in polarized bifurcation of opinion. With town meetings, bifurcation is not a final result. Because of polarized media, however, the place at which consensus occurs is not central but toward an extreme. The results can also be phrased in terms of town meetings. Town meetings clearly have a consensus effect on public opinion in the model, but have a very different effect depending in the presence or absence of polarized media. Without polarized media, town meetings produce a central consensus. With polarized media they continue to have a consensus effect, but a consensus at one of the extremes defined by the media.
An intuitive mechanism can be seen to be driving these results. Individuals, initially with randomly assigned opinions, self-select toward different media sources. As individuals at different ends are pulled farther apart, the result is a distribution with wide standard deviation, either because it forms a broadened normal curve or an initial bimodal distribution. That wide distribution, however, will rarely be perfectly balanced. Given an unbalanced distribution, the convergence effect of town hall meetings will form a concentration of opinion at either one side of the center of the opinion spectrum or the other. Once the center of opinion is even slightly to one side or the other of the center, the pull of media on that side will continue, moving any established central consensus progressively toward one of the poles of media-defined opinion.
Ours is a modeling result, and as such is merely suggestive. What it suggests, however, is the intriguing hypothesis that the effects of (a) self-selected media and (b) group or town meeting deliberations should not be expected to function independently. There is clear psychological evidence that self-selected media polarize individual opinion in a community (Iyengar & Hahn 2009; Sunstein 2009; Stroud 2011; Pew Research Center 2012; Prior 2013). Common wisdom, at least, is that group discussion on the model of town hall meetings will promote convergence of opinion (Fishkin 1991, 1995, 2009; Fung 2006; Warren & Pearse 2008; Niemeyer 2011; Grönlund, Bächtiger & Setälä 2013). When the two social reinforcers are acting together, however, it should not be expected that they will simply balance each other out. Group or town meetings can be expected to have a consensus effect on opinion. Given constant enough influence from self-selection of polarized media, opinion bifurcation will be the rule. Where both forces are in play, the resulting pattern is often community consensus, but community consensus at one of the extremes defined by media. What our results suggest is that polarized media can shape the opinion landscape—‘define the question,’ as it were—against which even convergence effects in group discussion, citizen forums, ‘public spheres,’ or ‘mini-publics’ will play out.
Notes
- We have considered both Von Neumann and Moore neighborhoods, finding no important difference. We report Moore neighborhood results for word of mouth throughout.
- Intuitively, one might expect the entrenchment of opinion fragmentation to be even more severe with more than a few self-selected media sources, of a greater variety—websites, discussion groups, and blogs. Empirical evidence seems to suggest this is a more complex and nuanced question than might at first sight appear (Adamic & Glance 2005; Hargittai & Gallo 2007; Gilbert, Bergstrom, & Karahalios 2009).
- McKeown & Sheehy (2006) do not include town hall or interaction effects. It should be noted, however, that one of the regimes they describe is that we document here with a combination of media and town meetings: opinion convergence at one extreme after a period of persistent opinion exchange.
- We have found essentially the same effects starting with a normally distributed distribution of initial opinions.
- The crucial fact in both this model and others is that probabilities for interaction never reach absolute zero. That is the fundamental reason why Axelrod diversity disappears with the addition of noise in Klemm, Eguíluz, Toral & San Miguel (2003b). The fact that interaction probabilities can reach zero when bounded confidence levels are added also explains how diversity can reappear in Flache & Macy (2006).
- We have noted above that our model tracks psychological work on meeting influence in terms of a group prototype (Turner 1985). We have also explored an alternative interaction rule for town meetings in which each agent has a single interaction with each of all other agents in the group, acting with more distant agents in the meeting as if they were immediate neighbors. Results for this alternative showed no significant difference
- Convergence at each end of the polarization is on the position of the media sources. Here we have used extreme positions, giving convergence is at those extremes. In cases where we position media at .25 and .75, say, we get polarized convergence to those points.
- Experimentation with different population percentages shows only predictable results: exposing 20% of the population at intervals of 100 ticks gives results essentially identical to exposing 10% at intervals of 200.
- The visible oscillation at an interval of 350 is due to the fact that our sampling is at 1000 ticks. At an interval of 350, one of our forces (town meetings or self-selected meetings) may be dominant at one sampling point, with the other dominant at the next.
Appendix
Here is the model pseudocode.References
ADAMIC, L., & Glance, N. (2005). 'The political blogosphere and the 2004 U.S. election: Divided they blog'. In J. Adibi, M. Grobelnik, D. Mladenic, and P. Pantel (Eds.), LinkKDD 05: Proceedings of the Third International Workshop on Link Discovery. New York: Association for Computing Machinery, pp. 36-43. [doi:10.1145/1134271.1134277]
AXELROD, R. (1997). The dissemination of culture: A model with local convergence and global polarization. Journal of Conflict Resolution, 41(2), pp. 203-226.
BENNETT, W. L. & Iyengar, S. (2008). A new era of minimal effects? The changing foundations of political communication. Journal of Communication, 58, pp. 707-731. [doi:10.1111/j.1460-2466.2008.00410.x]
BRECHNER, K. C. (1977). An experimental analysis of social traps. Journal of Experimental Social Psychology, 13, pp. 552-564.
BRECHNER, K. C. & Linder, D. E. (1981). 'A social trap analysis of energy distribution systems'. In A. Baum & J. E. Singer (Eds.), Advances in Environmental Psychology, Vol. 3. Hillsdale, NJ: Lawrence Erlbaum & Associates, pp. 27-52.
BISHOP, B. (2008). The Big Sort: Why the Clustering of Like-Minded America is Tearing Us Apart. Boston: Houghton Mifflin.
BRYAN, F. M. (2004). Real democracy: The New England town meeting and how it works. Chicago: University of Chicago Press.
CASTELLANO, C., Marsili, M. & Vespignani, A. (2000). Nonequilibrium phase transition in a model for social influence. Physical Review Letters, 85, pp. 3536-3539.
DEFFUANT, G., Neu, D., Amblard, F., & Weisbuch, G. (2000). Mixing beliefs among interacting agents. Advances in Complex Systems, 3, pp. 87-98. [doi:10.1142/S0219525900000078]
DEFFUANT, G., Amblard, F., Weisbuch, G. & Faure, T. (2002). How can extremism prevail? A study based on the relative agreement interaction model. Journal of Artificial Societies and Social Simulation, 5 (4), 1: https://www.jasss.org/5/4/1.html
DEFFUANT, G., Amblard, F., & Weisbuch, G. (2004). Modeling group opinion shift to extreme: The smooth bounded confidence model. European Social simulation Association, 2nd Annual Conference, Valladolid, Spain 2004. Available at: http://arxiv.org/ftp/cond-mat/papers/0410/0410199.pdf
DITTMER, J. C. (2001). Consensus formation under bounded confidence. Nonlinear Analysis, 47. pp. 4615-4621.
FERSTER, C. B. & B. F. Skinner (1957). Schedules of Reinforcement. Appleton-Century-Crofts. [doi:10.1037/10627-000 ]
FESTINGER, L. (1954). “A Theory of Social Comparison Processes. Human Relations, 7, pp. 117-140.
FIORINA, M. P., & Levendusky M. S. (2006). 'Disconnected: The Political Class versus the People'. In R. S. Nivola & D. W. Brady (Eds.) Red and Blue Nation: Characteristics, Causes, and Consequences of America's Polarized Politics. Washington, DC: Brookings Institution Press and the Hoover Institution, pp. 49-71.
FISHKIN, J. S. (1991). Democracy and Deliberation: New Directions for Democratic Reform. New Haven, CT: Yale Univ. Press.
FISHKIN , J. S. (1995). The Voice of the People: Public Opinion and Democracy. New Haven, CT: Yale Univ. Press.
FISHKIN , J. S. (2009). When the People Speak: Deliberative Democracy and Public Consultation. New York: Oxford University Press.
FLACHE, A. & M. Macy (2006). What Sustains Cultural Diversity and What Undermines It? Available at: http://arxiv.org/ftp/physics/papers/0604/0604201.pdf.
FUNG, A. (2006). 'Democratizing the Policy Process'. In R. Goodin, M. Moran & M. Rien (Eds.), The Oxford Handbook of Public Policy. New York: Oxford Univ. Press, pp. 669-685.
GALAM, S. (1997). Rational group decision making: a random field Ising Model at T=0. Physica A, 238, pp.66-80 [doi:10.1016/S0378-4371(96)00456-6]
GILBERT, E., T. Bergstrom, & K. Karahalios (2009). 'Blogs Are Echo Chambers: Blogs Are Echo Chambers'. In R. H. Sprague, Jr., ed., Proceedings of the Hawaii International Conference on System Sciences. Washington, D.C.: IEEE Computer Society, pp. 1-10.
GONZALEZ-AVELLA, J. C., Cosenza, M. G., Klemm, K., Eguíluz, V. M., & San Miguel, M. (2007). Information feedback and mass media effects in cultural dynamics. arXiv preprint arXiv:0705.1091.
GRÖNLUND, K., A. Bächtiger & M. Setälä (Eds.)(2013). Deliberative Mini-Publics: Practices, Promises, Pitfalls. New York: Columbia University Press.
HABERMAS, J. (1996). Between Facts and Norms: Contributions to a Discourse Theory of Law and Democracy (Trans. T. Berger). Cambridge, MA: MIT Press.
HARGITTAI, E., & J. Gallo (2007). Cross-ideological Discussions among Conservative and Liberal Bloggers. Public Choice, 134, pp. 67-86.
HEGSELMANN, R., & Krause, U. (2002). Opinion dynamics and bounded confidence: models, analysis, and simulation. Journal of Artificial Societies and Social Simulation, 5 (3), 2: https://www.jasss.org/5/3/2.html.
IYENGAR, S., & K. S. Hahn (2009). Red Media, Blue Media: Evidence of Ideological Polarization in Media Use. Journal of Communication, 59, pp. 19-39.
KACPERSKI, K, & Holyst, J. A. (2000). Phase transitions as a persistent feature of groups with leaders in models of opinion formation. Physica A, 287:631-643. [doi:10.1016/S0378-4371(00)00398-8]
KLEMM, M., V. M. Eguíluz, R. Toral, & M. San Miguel (2003a). Nonequilibrium Transition in Complex Networks: A Model of Social Interaction. Physical Review E, 67, p. 026120.
KLEMM, M., V. M. Eguíluz, R. Toral, & M. San Miguel (2003b). Global Culture: A Noise-Induced Transition in Finite Systems. Physical Review E, 67, p. 045101. [doi:10.1103/PhysRevE.67.045101]
KLEMM, M., V. M. Eguíluz, R. Toral, & M. San Miguel (2003c). Role of Dimensionality in Axelrod’s Model for the Dissemination of Culture. Physica A, 327, pp. 1-5.
LEEPER, T. J. (2014). The Informational Basis for Mass Polarization. Public Opinion Quarterly, 78, pp. 27-46. [doi:10.1093/poq/nft045]
LEVENDUSKY, M. S. (2013). Partisan News That Matters: How Partisan News Impacts American Politics. Chicago: University of Chicago Press.
LEVENDUSKY, M. S. (2014). Why Do Partisan Media Polarize Viewers? American Journal of Political Science, 57, pp. 611-623. [doi:10.1111/ajps.12008]
MADDEN, G. J. (2013). APA Handbook of Behavioral Analysis. Washington, DC, US: American Psychological Association.
MASON, W. A., F. R. Conrey, & E. R. Smith (2007). Situating Social Influence Processes: Dynamic, Multidirectional Flows of Influence Within Social Networks. Personality and Social Psychology Review, 11 (3), pp. 279-300. [doi:10.1177/1088868307301032]
McKEOWN, G., & N. Sheehy (2006). Mass Media and Polarisation Processes in the Bounded Confidence Model of Opinion Dynamics. Journal of Artificial Societies and Social Simulation, 9(1), 11: https://www.jasss.org/9/1/11.html.
McPHERSON, M., L. Smith-Lovin, & J. M. Cook (2001). Birds of a feather: Hompohily in Social Networks. Annual Review of Sociology, 27, pp. 415-444. [doi:10.1146/annurev.soc.27.1.415]
MORGAN, D. L. (2010). Schedules of Reinforcement at 50: A Retrospective Appreciation. Psychological Record, 60, pp. 151-158.
NIEMEYER, S., (2011). The Emancipatory Effect of Deliberation: Empirical Lessons from Mini-Publics. Politics & Society, 39, p. 103. [doi:10.1177/0032329210395000]
PEW RESEARCH CENTER (2012). News Consumption Survey. Available at: http://www.people-ress.org/files/legacy-pdf/2012%20News%20Consumption%20Report.pdf
PRIOR, M. (2013). Media and Political Polarization. Annual Review of Political Science, 16, pp. 101-127. [doi:10.1146/annurev-polisci-100711-135242]
SAN MIGUEL, M., V. M. Eguíluz, R. Toral, & K. Klemm (2005). Binary and Multivariate Stochastic Models of Consensus Formation. Computing in Science and Engineering, 7, pp. 67-73.
SHIBANAI, Y., Yasuno, S., & Ishiguro, I. (2001). Effects of global information feedback on diversity. Journal of Conflict Resolution, 45(1), pp.80-96. [doi:10.1177/0022002701045001004]
SKINNER B. F. (1981). Selection by consequences. Science, 213(4507), pp. 501-504.
SKOCPOL, T. (2003). Diminished Democracy: From Membership to Management in American Civic Life. Norman, OK: University of Oklahoma Press.
STROUD, N. J. (2011). Niche News: The Politics of News Choice. New York: Oxford University Press.
SUNSTEIN, Cass R. (2002). Republic.com. Princeton, NJ: Princeton University Press.
SUNSTEIN, Cass R. (2009). Going to Extremes. New York: Oxford University Press.
TURNER, J. C. (1985). Social categorization and self-concept: A social cognitive theory of group behavior. Advances in Group Process, 2, pp. 77-122.
WARREN, M. E. (2009). Two Trust-Based Uses of Minipublics in Democracy. American Political Science Association Annual Meeting, Toronto, September 2009.
WARREN, M. E. & H. Pearse (Eds.) (2008). Designing Deliberative Democracy: The British Columbia Citizens’ Assembly. Cambridge MA: Cambridge University Press. [doi:10.1017/CBO9780511491177]
WILKIE, D. M. (1972) Variable-time Reinforcement in Multiple and Concurrent Schedules. Journal of the Experimental Analysis of Behavior, 17(1), pp. 59-66.
WILLIAMS, B. A . (1983). Another Look at Contrast in Multiple Schedules. Journal of the Experimental Analysis of Behavior, 39(2), pp. 345-384. [doi:10.1901/jeab.1983.39-345]
WILLIAMS, B. A. (1994). Conditioned reinforcement: Neglected or outmoded explanatory construct? Psychonomic Bulletin & Review, 1(4), pp. 457-475.
ZEILER, M. (1977). 'Schedules of Reinforcement: The Controlling Variables'. In W. K. Honig & J. E. R. Staddon (Eds.), Handbook of Operant Behavior. Englewood Cliffs: Prentice Hall.