©Copyright JASSS

JASSS logo ----

Hans-Joachim Mosler (2006)

Better Be Convincing or Better Be Stylish? a Theory Based Multi-Agent Simulation to Explain Minority Influence in Groups Via Arguments or Via Peripheral Cues

Journal of Artificial Societies and Social Simulation vol. 9, no. 3
<https://www.jasss.org/9/3/4.html>

For information about citing this article, click here

Received: 05-Jan-2006    Accepted: 05-Apr-2006    Published: 30-Jun-2006

PDF version


* Abstract

Very often in the history of mankind, social changes took place because a minority was successful in persuading the dominant majority of a new idea. Social psychology provides empirically well-founded theories of social influence that can explain the power of minorities at individual level. In this contribution, we present an agent-based computer simulation of one such theory, the Elaboration Likelihood Model (ELM). After introducing the theoretical background and our agent model, we present three simulation experiments that confirm past laboratory research but also go beyond its findings by adopting the method of computer simulation. First, we found that even a minority with low argument quality can be successful as long as it has positive peripheral cues. Second, our results suggest that a higher personal relevance of a topic for the majority led it to be more receptive to minority influence only when the minority showed neutral peripheral cues and very good arguments. Third, we found evidence that a neutral or only slightly biased majority is influenced more easily than a strongly biased one. To sum up, we consider these results to illustrate the notion that a well-presented, comprehensible and valid computer simulation provides a useful tool for theory development and application in an exploratory manner as long as it is well founded in terms of the model and theory.

Keywords:
Social Influences, Persuasion Processes, Group Processes, Minority Influence, Computer Simulation, Modelling, Theory Verification, Simulation Experiments

* Introduction

1.1
A group of people does not always agree unanimously on a topic. If attitudes are not distributed equally among the members of the group, a minority and a majority are created. A minority is defined as a group lacking power, status, competence, or just an adequate number of group members. When such disagreement arises in a group, it is experienced as undesirable, as a tension and a threat. Such disagreements also lead an individual to doubt his or her own beliefs and reduce confidence in him or herself and in stable frames of reference, which makes the individual reconsider a given topic.

1.2
Wood, Lundgren, Ouellette, Busceme and Blackstone (1994), in a review of 97 studies, found that minorities may exert influence over majority recipients and that this impact tends to vary with the type of influence assessed. Basically, there are two main ways for a minority to influence a majority: they may use convincing arguments regarding the topic at hand or else use those implicit, stylistic features of their endeavours which are generally called peripheral cues (Moscovici 1980).

1.3
We will model the social influence of minorities in order to illustrate the advantage of using social psychology theories when simulating social behaviour. Social influence is a daily component of interactions between individuals. It consists of a variety of changes in physiological states and subjective feelings, motives and emotions, cognitions and beliefs, values and behaviour that occur in an individual as a result of the real, implied or imagined presence or actions of another individual (Latané 1981). In this paper we focus on the change of attitudes in groups consisting of a majority and a minority.

1.4
In recent years, the social sciences have embraced simulation techniques as a new and powerful tool for exploring the dynamics of social systems. Often, very simple agent rules are used in simulation models. This is a fruitful approach for exploring the minimal conditions under which certain phenomena become manifest. However, the mimicking of behaviour in a social system does not always yield knowledge that has a clear link to real-world social dynamics. A modeller planning the rules for building agents may be predisposed to a biased view since the rules he or she develops will make sense from his or her personal perspective on the issue at hand. But if a tested theory is used as the basis of the agent model, a certain objectivity can be guaranteed.

1.5
Social psychology theories may provide valuable insights that may fundamentally improve the architecture of agents. The goal of the present study is to show that simulation of these theories leads to results that are very close to those obtained in laboratory experiments with human participants and that new hypotheses can be derived from simulation experiments.

1.6
In the following sections of the introduction, we review relevant literature on minority influence and present the Elaboration Likelihood Model (ELM), a social psychology theory formulated by Petty and Cacioppo (1986) that has the proven capacity to explain group processes related to persuasion and decision-making, and therefore also minority influence. We then proceed to our methods by introducing our agent model based on the ELM and present results of three simulated group experiments with a multi-agent simulation. We conclude by discussing our findings in the light of social psychological theory and the agent-based modelling methodology.

* Theoretical Background

2.1
Minorities are often divided into two basic types that have different positions and possibilities to apply influence. Out-group minorities differ from the majority not only in the position they advocate but also in their membership of a social category, for example skin colour, racial background, or gender. In-group minorities on the other hand differ only by their opinion from the rest of the group. Different theories explain how a minority may be more or less successful in influencing the majority. In the following, we will present some of them, in particular the ELM model, which represents the basis of our agent model.

2.2
According to Moscovici (1980) in his two-process model of conversion and conformity, minorities are successful because they are different. The minority thus induces a private process in each member of the majority, who may still officially proclaim the majority's attitude but has privately changed his or her opinion (i.e. conversion). On the other hand, the majority almost compels its members to conform to the official attitude of the majority (i.e. conformity).

2.3
Self-categorisation theory (Turner 1991), in contrast, assumes that minorities are successful because they are similar to the majority. It postulates that humans only expect to have the same opinion as others when these individuals appear similar to themselves. A deviant opinion of a group that is perceived as similar destroys expectations and produces insecurity. In order to reduce this insecurity, the individual can re-categorise the group or him/herself, or can change his/her attitude, and this is where social influence takes place.

2.4
Research has shown that minorities that are not only different because of their opinion but also because of their social category generally have a harder time convincing the majority of their opinion (seeMaass and Clark 1984). This phenomenon is explained by the fact that an in-group minority and the majority share a consensually similar assessment of reality, whereas the out-group minority does not (Turner 1991). Recent laboratory research generally uses double minorities, where for example white or heterosexual subjects are confronted with differing opinions of blacks or homosexuals (e.g.Petty, Fleming and White 1999).

2.5
The Elaboration Likelihood Model (ELM) by Petty and Cacioppo (1986) provides a clearly formulated theoretical reference system designed to organise, categorise, and understand the underlying processes of persuasive communication (seeStahlberg and Frey 1993). The observation that the stability of attitudes and the predictability of behaviour based on these attitudes can vary widely led the authors to develop the idea that there are different ways of influencing attitudes. The ELM distinguishes two basic ways of attitude formation.

2.6
The first is the central route, which is used when the person is motivated and able to treat information and arguments cognitively. The likelihood of cognitive elaboration increases with a person's increasing motivation and ability to evaluate the communication presented.

2.7
The second option is the peripheral route, which is on the other side of the elaboration continuum. When elaboration is low, people engage in less thoughtful analyses of arguments or take their orientation from peripheral cues, such as the trustworthiness of the source, sympathy, number of arguments or argument length and many more. As long as processing is superficial, argument quality will have little effect and attitude change will be determined mostly by peripheral cues.

2.8
When the individual has no prior opinion regarding the issue at hand, he or she remains objective and recognizes good or bad arguments as such and is able to treat them accordingly. However, where the individual is biased toward or against a topic, the cognitive processing of the information is also influenced. The individual will then treat the information received in such a way that it does not contradict his or her preconceived opinion.

2.9
Faced with a positively biased person (i.e. in favour of one's own opinion), even low-quality arguments and slightly negative peripheral cues will be effective because the person evaluates them more positively in order to fit them into his or her preconceived attitude. On the other hand, attempting to influence a negatively biased person (i.e. predisposed against one's own opinion) is all the harder, because all arguments and peripheral cues will be devalued and the recipient of the influence will react with counter-arguments and negative thoughts.

2.10
The motivation to treat information centrally depends on several factors, including the personal relevance of a topic, because the more involved a person is in the topic the readier he or she is to expend the energy and time necessary to treat the issue cognitively. Generally it can be said that attitude changes resulting mainly from central processing will show greater temporal persistence, greater prediction of behaviour, and stronger resistance to counter-arguments than attitude changes resulting mainly from peripheral processing.

* The Agent Model

3.1
As mentioned above, the agent model is based on a theory of social psychology by Petty and Cacioppo (1986) known as the Elaboration Likelihood Model, which explains the information processing inside an individual. The rules for each process inside the agent were derived from the ELM's seven core statements (seeMosler, Ammann and Gutscher 1998). Given that the simulation is based on laboratory experiments, the direction of the influence is inferred easily and the parameters for the transition functions can also be deduced.

3.2
The agent model is shown in Figure 1. It reduces the complexity of the theoretical knowledge and the empirical findings that we have of the Elaboration Likelihood Model to a comprehensible extent, and only the most important and most thoroughly tested variables were used to generate the different types of elaboration. Certain aspects were also summarised in a more general construct. The variable 'peripheral cues', for example, stands for source expertise, but also for credibility and further peripheral cues. Following the conventions of systems theory (seeBischof 1995), variables are represented as arrows showing the direction of their effects. The blocks contain the transition functions in which the entry variables are computed to obtain the exit variable.

Figure 1
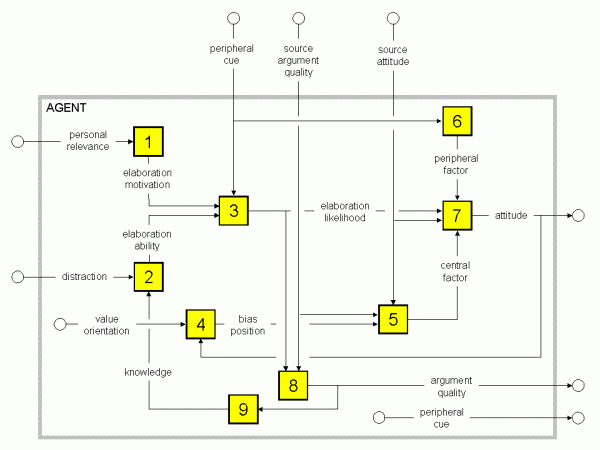
Figure 1. Block diagram of the Elaboration Likelihood Model (Petty and Cacioppo 1986). The variables are labelled on the arrows. The transition functions are found in the numbered yellow blocks and explained in the text

3.3
The dimensions of all variables lie between 0 and 10. We distinguish one and two-poled variables. One-poled variables represent one-dimensional concepts such as personal relevance, distraction, elaboration motivation, elaboration ability and elaboration likelihood. The values of the one-poled variables are minimal at 0 and maximal at 10. Two-poled variables represent two-dimensional concepts such as attitude, value orientation, peripheral cues, argument quality and bias position. They have a point of indifference at 5 (e.g. no particular attitude towards a certain issue), whereas 10 and 0 represent an extremely positive and extremely negative value respectively (e.g. an extreme attitude for or against a certain issue). The scales of the model variables used in the present research are listed in Table 1.

Table 1: Scaling of independent and dependent variables in alphabetical order indicating the terminology used in this paper

Variable / Scale012345678910
(Source) Argument QualityLow Indifferent High
(Source) AttitudeDisagreement Neutral Agreement
Bias PositionNegative bias Neutral Positive bias
DistractionNone Maximum
Elaboration AbilityNone Maximum
Elaboration LikelihoodLow High
Elaboration MotivationNone Maximum
KnowledgeNone Maximum
Peripheral CueNegative Indifferent Positive
Personal RelevanceNone Indifferent Maximum
Value OrientationDisagreement Neutral Agreement

3.4
The following treatment describes the transition functions for each block of the model (see alsoMosler, Schwarz, Ammann, and Gutscher 2001). The algorithms for the computer program were designed in accordance with the preceding formulations of the relating functions. When processing the model, the temporary values of the variables are rounded off but analyses showed that the number of digits on the right-hand side of the comma made no qualitative difference to the model's outcome.

3.5
Block 1: Elaboration motivation is determined by personal relevance. With increasing personal relevance, the agent's motivation to process arguments increases (see Equation 1). Personal relevance stands for all variables that can influence elaboration motivation (e.g. self-responsibility, need for cognition).

Elaboration motivation = Personal relevance (1)

3.6
Block 2: Elaboration ability is determined by knowledge and distraction. Knowledge stands for objective knowledge as an ability-promoting variable (Petty, Priester, and Wegener 1994;Wood, Rhodes, and Biek 1995). Increasing distraction reduces the ability-promoting effect of knowledge (see Equation 2).

Elaboration ability = Knowledge × {1 - (distraction / 10)} (2)

3.7
Block 3: A variable known as the 'intrinsic elaboration likelihood' (IEL) is calculated by multiplying the variables 'elaboration motivation' and 'elaboration ability' (see Equation 3a). This multiplicative relation ensures that no elaboration takes place when either motivation or ability equal zero. For example, arguments presented in an unknown foreign language cannot be processed even in the presence of motivation, because the person lacks the ability to do so. The elaboration likelihood (EL) is further influenced by the peripheral cue of the communication source. A highly positive peripheral cue has an enhancing effect, while a very negative one has a reducing effect on the elaboration likelihood. This influence is at its maximum with moderate values of elaboration likelihood and decreases continuously at both higher and lower values (see Equation 3b).

IEL = (Elaboration Motivation * Elaboration Ability) 0.5 (3a)

EL = IEL + {[(peripheral cue - 5) / 2] * [1 - |IEL - 5| / 5]} (3b)

3.8
Block 4: A bias position is calculated from the attitude and value orientation of the agent. The formula considers the direction of the bias as well as the amount of bias (see Equation 4). Bias refers not only to an agent's attitude position, but also to the person's underlying value orientation (Johnson and Eagly 1989). The value orientation stands for all variables that can produce bias (e.g. prior knowledge, prior warnings) and may of course also include peripheral cues, such as the mood and expertise of the source.

Bias position = (Attitude + Value orientation) / 2 (4)

3.9
Block 5: The central factor is made up of both objective (i.e. source-argument quality [SAQ]) and biased (i.e. bias position [BP]) processing (see Equation 5). Strong arguments bring about attitude change in the intended direction, whereas weak arguments have a counterproductive effect (seePetty and Cacioppo 1994, p. 70). Biased processing manifests itself in such a manner that a bias factor overlays objective processing. When the bias position of the agent and the attitude advocated by the source are both either favourable or unfavourable, the central factor is increased by the bias factor in accordance with the argument quality of the source. When the positions of the agent and source diverge, the bias factor has a reducing effect on the central factor. How strongly the central factor will be overlaid by the bias factor depends upon the bias position of the agent. If this is moderate, the bias strength is minimal, but it increases continuously both up and down from the midpoint. Thus the more extreme the bias position, the more strongly will the agent counter-argue communications opposing his or her position and cognitively bolster congruent messages (Petty and Cacioppo 1986b).

Central factor = [(SAQ - 5) / 2.5] + {[(5 - SAQ) / 5 + d] * (|BP - 5| / 5) 2}
where d = +2, if (BP ≥ 5 and source attitude ≥ 5) or if (BP ≤ 5 and source attitude ≤ 5)
where d = -2, if (BP > 5 and source attitude < 5) or if (BP < 5 and source attitude > 5)
(5)

3.10
Block 6: The peripheral factor gains a positive value through a highly positive peripheral cue of the source, while a very negative peripheral cue results in a negative value (see Equation 6). The parameter 1.65 has been estimated through sensitivity analyses.

Peripheral factor = (peripheral cue) / 1.65 (6)

3.11
Block 7: An agent's attitude after persuasion results from the sum of the previously held attitude (attitudet-1; t-1 = prior to persuasion) and the attitude change generated by the persuasion. For the attitude change, the difference is first calculated between the source's attitude (SA) and the agent's attitudes (IA). At this point, the attitude difference expresses the extent and direction of the attitude change (see Equation 7). The ultimate modification of the attitude is then calculated on the basis of the computation of the central factor (CF) and the peripheral factor (PF).

3.12
For example, assuming that an agent's elaboration likelihood (EL) reaches a value of 8, 80% of his or her attitude change will be determined to by the central factor and 20% of it by the peripheral factor because the agent will treat the information more centrally than peripherally. The more central the agent's processing of the information, the less peripheral it is, since these two factors demonstrate additive interference.

IA = IAt-1 + [(SA — IAt-1) / 3] * {[(EL / 10) * CF] + [(1 — EL / 10) * PF]} (7)

3.13
Block 8: This block introduces a change of argument quality (AQ) in the recipient of the communication in relation to his/her processing of the source's arguments (see Equation 8c). The arguments of the source become integrated into one's own argumentation depending on the degree of elaboration. The calculation of argument quality, changed by persuasion, is performed in analogy to that of attitude change. Proportionately to the elaboration likelihood (EL), a central portion (CP) and a peripheral portion (PP) of the treatment of the source's arguments are added to the prior argument quality (AQ t-1). The central portion increases the agent's argument quality only when the source's argument quality (SAQ) is higher than that of the agent (see Equation 8b). Even if peripheral processing dominates, there can still be a change in the agent's argument quality, because central processing is clearly never completely absent. The agent's argument quality cannot only be enhanced by the peripheral portion, it may also be reduced if the source's argument quality is low (see Equation 8a).

PP = (SAQ — AQt-1) / 10 (8a)

CP = (SAQ — AQ t-1) / 10 (8b)

AQ = AQt-1 + [(EL / 10) * CP] + [(1 — EL / 10) * PP] (8c)

3.14
Block 9: Our model assumes that there is a relationship between argument quality and an agent's knowledge. This assumption represents an extension of the ELM and is based on a statement by Petty and Cacioppo (1986) that the agent's prior knowledge guards against persuasive messages. This means that agents develop their arguments based on their prior knowledge, which leads us to conclude that the agent's argumentation scheme is integrated into his or her knowledge (similar considerations are found in Petty et al. 1994).

Knowledge = Argument quality (9)

3.15
Validation of a computer simulation model is principally concerned with the comparison of the simulation model with the reality. Since the present model is based on a theory of social psychology that has been validated in turn by laboratory research, the experimental settings of published studies are translated and entered into the simulation. The simulation results are compared to the original study findings (Whicker and Sigelman 1991) and the various elaboration processes of the ELM are compared with empirical findings. To be valid, the model must replicate the findings from the research performed with individuals. However, complete quantitative replication is not possible because information on certain variables will be missing in any given study. Potential measurement errors must also be taken into consideration. Replication of a study by the simulation model is considered successful if the pattern of original findings can be replicated.

3.16
Mosler et al. (2001) carried out detailed validations of the presented model. They showed that several studies on attitude change based on the ELM can be replicated using the simulation model. In their paper, the authors conclude that the model can be justifiably assumed to adequately represent the processes described in the ELM, i.e. the agents react as real human beings to stimuli in certain settings. Furthermore, a sensitivity analysis has shown that the model's outcome does not change qualitatively when the parameters in the equations are varied to a modest degree.

* Simulation Experiments

4.1
The simulated group consisted of five agents, all of which are described by the agent model described above (see Figure 1). Each agent receives three social and three internal input variables. The social input variables are obtained from the source of the persuasion; these are peripheral cues, source argument quality, and source attitude. The three internal input variables that describe the agent's original state are: personal relevance, distraction and value orientation. After the processing inside the agent is completed, three output variables are emitted which influence the next agent as external input variables, namely source argument quality, source attitude and peripheral cues. The last of these is unaffected by the processing and was therefore constant.

4.2
The agents interact sequentially, i.e. only one agent influences all the others at any time. Social influence is achieved by using the output values (attitude, argument quality and peripheral cues) of an agent, for example A (A1 in Figure 2), as the values for the input variables of the other agents. Their output values are determined according to the model (B1 turns into B2, C1 into C2, etc.). The new output values of agent B (B2) then become the input values for the other agents and so on. At the end of a round of persuasion, every agent has influenced all the others once. This is comparable to a group discussion in which every participant is allowed to speak in turn and every participant is heard once. Each person starts with certain arguments and a position regarding the topic being discussed. Eventually, through the discussion with the other participants, the agent's attitude may change and this shift will be communicated to the other agents in the next round until the end of the experiment.

Figure 2
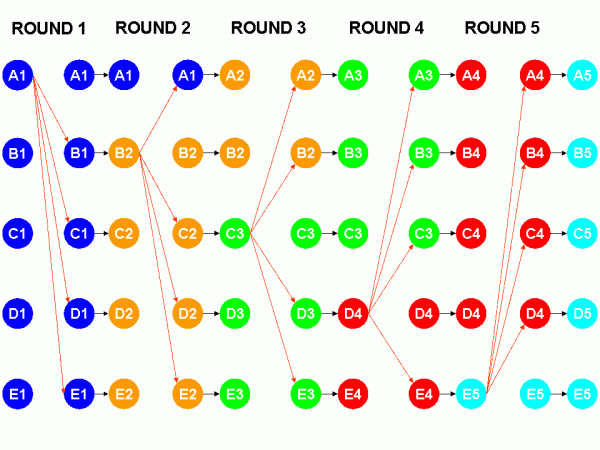
Figure 2. Sequence of social influence in a group of five agents (A, B, C, D, and E). Red arrows represent social influence. Black arrows represent transitions of agent states (e.g. attitudes)

4.3
In order to initialize the simulation, certain variables need to be given starting values. Because the study looks at the influence of minorities, the five agents are divided into two unequal groups. Each group is entirely homogeneous in order to maintain a clear difference between the majority and the minority. This means that all members of a group, be it the majority or the minority, are assigned the same starting values. It would certainly be closer to reality to have each agent start with different values, but this leads to difficulties when trying to explain the results.

4.4
The ELM agent-based model was transposed into a computer program, written using the THINK PASCAL 4.0 language on a Macintosh operating system. Each simulation experiment consisted of 20 runs. This number was chosen because as a rule there are no further unexpected about-turns or changes in attitude of the members of a group after 20 runs. In fact, after 20 runs the groups almost always have either exactly the same or a maximally different attitude, which allows the experimenter to observe clearly how successful the minority influence was.

4.5
Three simulation experiments are carried out in this paper, the minority's argument quality and peripheral cues being independent variables in each one. In the model, however, they appear as a constant that is not influenced by the processes taking place inside the agent according to the ELM model. This manipulation is necessary to obtain different situations in which to observe their respective weight in the minority's influence. On top of the two independent variables that are always modified, there are other variables according to the objective of each simulation experiment.

4.6
The change in the majority's attitude calculated between its starting value and the value at the end of the persuasion effort is used as the dependent variable. This change allows the success of the minority in its quest to convince the majority of their attitude to be estimated. In the following, we present the design of each of the three simulation experiments and the respective results.

Simulation Experiment 1 — Varying Argument Quality and Peripheral Cues

4.7
For the first simulation experiment, the objective is to observe the influence of argument quality as well as peripheral cues on the persuasion attempt by the minority. On the basis of the theory of the ELM it is to be expected that a high argument quality in combination with strongly positive peripheral cues will lead to the greatest success by the minority. As an additional aspect, the ratio between the minority and the majority is also manipulated. In one condition, the simulation experiment is carried out with one member in the minority and four agents as part of the majority, in another condition of the experiment the proportion is two to three. We expect the larger minority to be better at influencing the majority, since more agents will be promoting the minority's attitude.

4.8
In line with the study goals mentioned above, the design of the first simulation experiment consists of three manipulated factors: The minority's argument quality has five levels (1, 3, 5, 7, 9), the minority's peripheral cue also has five levels (1, 3, 5, 7, 9), and the minority/majority ratio has two levels (one to four vs. two to three). This results in an experimental design with 50 cells (5 × 5 × 2). Furthermore, the minority has an initial attitude of eight and initial personal values of eight whereas all starting values are set to five for the majority. The results for a one-person minority in Table 2 show two clearly different reaction patterns of the majority.

4.9
If the peripheral cues of the minority are negative or neutral, and if they coincide with a low argument quality, the distance between the attitude of the majority and that of the minority increases (see green cells in Table 2). This distance is a maximum (= -5) in all conditions with one exception (= -2.9). Furthermore, the minority's attitude has also changed from 8 to 10 in these conditions (not shown in Table 2). This is known as bipolarisation and occurs because the two groups process their data in a biased way.

4.10
The second general reaction pattern occurs when the peripheral cue is positive, very positive or neutral, and when it coincides with high or very high argument quality (yellow cells in Table 2). After 20 runs of the experiment, all five members of the group have the same attitude that lies somewhere between the original attitude of the minority (=8) and that of the majority (=5). This pattern is similar to consensus building efforts between a majority and a minority. The minority has successfully influenced the majority, since the new attitude of the majority is closer to that of the minority than the original attitude was.

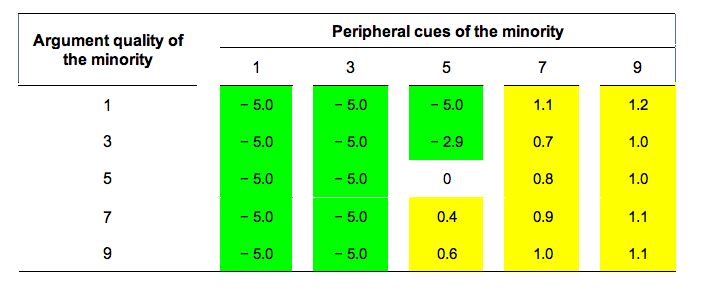
Table 2. Attitude change (attitude at the end — attitude at the beginning [= 5]) of the majority in simulation experiment 1 with a minority/majority ratio of one to four. The green cells represent conditions where bipolarisation has occurred, the yellow cells represent conditions where a consensus has occurred
Table 2

4.11
Table 3 shows the results from the same experimental settings as Table 2 above, with the difference that the ratio between the minority and the majority is two to three. Thus the influence of the minority was significantly higher than in the situation where there was only one member of the minority and four members of the majority.

4.12
Under certain circumstances, strong bipolarisation took place in both settings. Some conditions (see green cells) show that the minority has no way of persuading the majority if it has negative peripheral cues. Instead of persuasion, the contrary occurs, namely the minority causes the majority to reject their attitude and to distance itself even further. The same situation occurs when the minority has neutral peripheral cues but low argument quality.

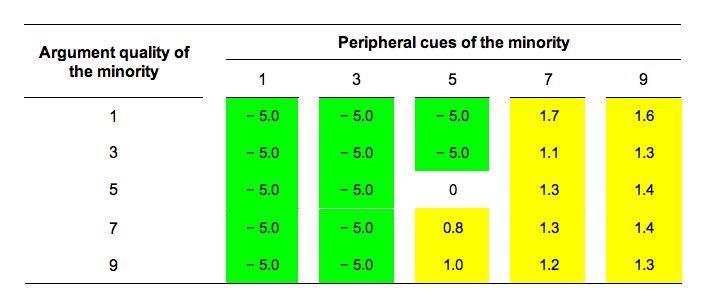
Table 3. Attitude change (attitude at the end — attitude at the beginning [= 5]) of the majority in simulation experiment 1 with a minority/majority ratio of two to three. The green cells represent conditions where bipolarisation occurred, the yellow cells represent conditions where consensus occurred
Talbe 3

Simulation Experiment 2 — Varying Processing Depth

4.13
In the second simulation experiment, the goal is to study the influence of the depth of processing so that the variable of 'personal relevance' is manipulated. According to Petty and Cacioppo (1986), the processing depth determines whether the central or peripheral route is taken to treat the information received from a source. When the processing is deep, the information is treated cognitively or centrally by the agent, who will be more interested in arguments than in peripheral clues. In contrast, when the processing depth is shallow, the agent is more easily influenced by peripheral cues, not wishing to invest a lot of energy in the cognitive processing of the information. Personal relevance influences the depth of processing, since the more important an issue is to the agent the readier he or she is to invest time and energy in considering the topic cognitively. The results of the present experiment are expected to show that the higher the personal relevance and consequently the more important the depth of processing, the more successful is a minority with a high argument quality. When the processing depth is shallow, peripheral cues become more successful than arguments at convincing the majority. The design of the second simulation experiment is identical to that of the first experiment, with the following exceptions: The personal relevance of both the minority and the majority has three levels in each case: low (=2), medium (=5), and strong (=8). The argument quality and peripheral cues were only neutral (=5), positive (=7) or highly positive (=9). This results in an experimental design with 81 cells (3 × 3 × 3 × 3). The minority/majority ratio was one to four as in the first condition of the first simulation experiment.

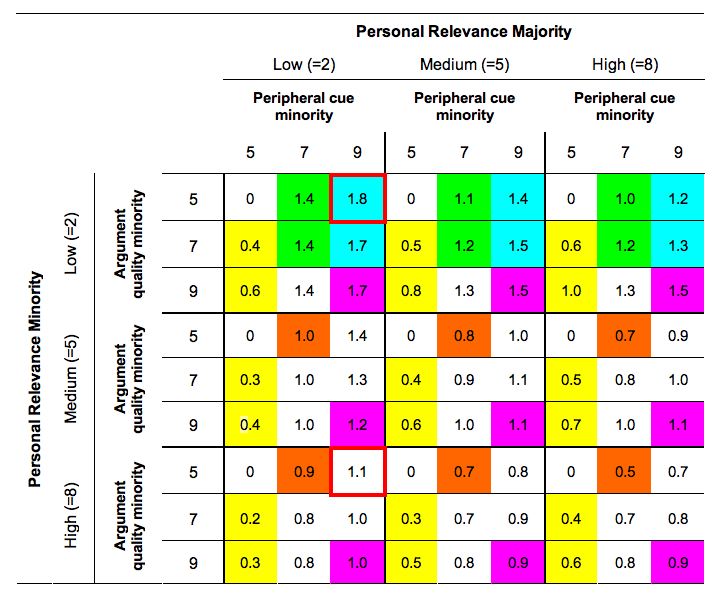
Table 4. Attitude change of the majority in simulation experiment 2. The coloured or framed cells are referred to in the text
Table 4

4.14
Our expectation that a higher personal relevance of the majority and therefore greater depth of processing lead to a more successful influence by a minority using arguments is not fully substantiated in the results (see Table 4). A significant incidence between a high personal relevance of the majority and a positive influence by the minority only occurs when the peripheral cues of the minority are neutral with a value of 5 (see the yellow coloured cells in Table 4, for example).

4.15
If the minority's peripheral cue is positive or even highly positive, a higher personal relevance of the majority has a negative influence on the success of the minority in persuading the majority. The higher the personal relevance of the majority, the less it is influenced by the minority (for peripheral cues at 7, see the green coloured cells, for example — for peripheral cues at 9, see the blue coloured cells in Table 4).

4.16
This negative outcome is all the more important the lower the minority's argument quality (see the variations of argument quality in orange cells of Table 4, for example). When the minority's argument quality is high and its peripheral cues are positive or highly positive, the degree of personal relevance of the majority hardly influences the success of the minority at all (compare the pink coloured cells in Table 4, for example).

4.17
Given that every single experiment consists of 20 runs, the evolution of the attitude can also be recorded at each step instead of only looking at the change between the initial and final attitude. Figure 3 shows the evolution of the attitude over the course of two conditions (see the two cells with red frames in Table 4), indicating the attitude of both majority and minority in each case. Figure 3 permits a closer look at why a minority that has a low personal relevance is more successful at influencing the majority.

4.18
The majority's final attitude is closer to that of the minority when the latter has a high personal relevance than when it has a low one. Looking at the evolution of the minority attitude, it becomes clear that the minority with a high personal relevance is already influenced more strongly by the majority in the first round of persuasion. This minority, due to its high personal relevance, treats the information received from the majority in greater depth and is therefore influenced more strongly. This, in turn, reduces the minority's success at convincing the majority of its own standpoint because the minority's attitude has already become closer to that of the majority.

Figure 3
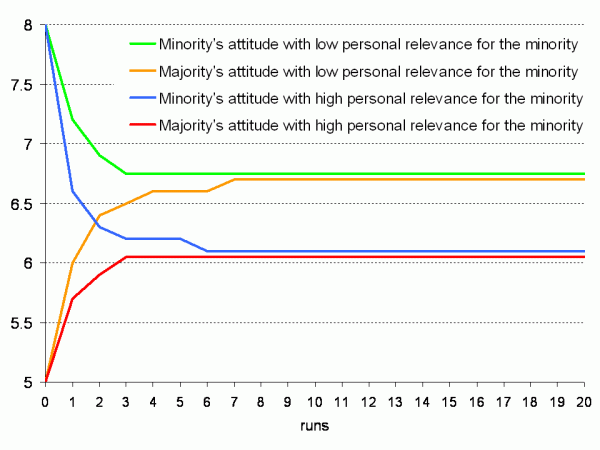
Figure 3. Development of attitudes in the two conditions with red-framed cells in Table 4. The two conditions are identical with the exception of the personal relevance of the minority (high vs. low)

Simulation Experiment 3 — Varying Bias Positions of the Majority

4.19
In the third and last simulation experiment, the objective is to gain some insight into the importance of a positive or negative bias position prior to persuasion. This means that the agents will have preconceived attitudes toward the issue at hand before any persuasion attempts take place. If this biased attitude is negative, it should be more difficult to influence them than if their attitude is positive.

4.20
In research with stigmatized minorities (for example Petty et al. 1999), a biased attitude of a majority regarding a minority is studied. A common example is the biased attitude of whites or heterosexuals towards blacks or homosexuals. These groups can also be called out-groups since they do not only differ from the majority in their opinions but also in other aspects.

4.21
A positively biased attitude will lead the majority to appreciate the value of minority arguments and to have more positive thoughts and associations in connection with them. If the majority is negatively biased toward the source, it will be more critical of its arguments and will react with negative thoughts and the formulation of counter-arguments (Petty and Cacioppo 1986). It is to be expected that a negatively biased majority would be less receptive to influence by the minority than a neutral or positively biased one.

4.22
The bias position is determined in the model by the average of attitude and personal values. Since the attitude is the relevant dependent variable, it is better to keep its value stable. Therefore, the majority's personal values will vary between 0, 4, and 8 whilst the starting value of the attitude is slightly negative (=4). The minority's argument quality and peripheral cues vary between 3, 5, 7, and 9. This leads to an experimental design with 48 cells (3 × 4 × 4). The minority's attitude starts at 8 and the minority's personal values are also set to 8. All other variables are set constant to 5 and the minority/majority ratio is again one to four.

4.23
On the basis of these initial settings, the simulation allows the influence of a biased attitude of the majority on the success of a minority influence to be studied. Table 5 shows three experiments in each column that are identical with the exception of the bias position of the majority. According to the hypothesis that a negative bias position of the majority makes it more difficult for a minority to convince it of their attitude, the effect should become smaller down the column as the bias becomes more positive. Table 5 shows the overall change in attitude after a totality of 20 runs.

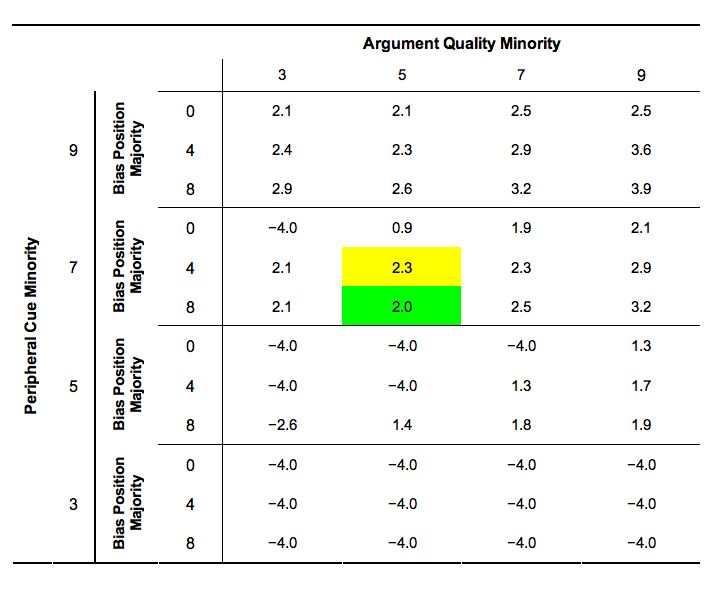
Table 5. Average change of majority attitude in simulation experiment 3
Table 5

4.24
The results in most conditions accord with our expectations. Some, however, fail to conform. Exceptions are the conditions with coloured cells in Table 5. Here, a slightly negative bias position of the majority (see yellow coloured cell in Table 5) leads to a slightly more successful influence by the minority than a clearly positive bias (see green coloured cell in Table 5).

4.25
To explain this phenomenon, the evolution of the attitudes in these two conditions is depicted in Figure 4. In both experiments, the minority attitude shows a rise to a value of 10. Such a biased reaction by the minority is present in every first round of this experimental plan, since the minority starts with a value of 8 and is negatively biased toward the attitude of the majority (4). The positively biased majority approaches the minority more strongly than the slightly negatively biased one. This means that the minority is more easily convinced by the majority in the first case, whereas it maintains its own attitude longer in the second case, and is therefore more successful at convincing the majority.

Figure 4
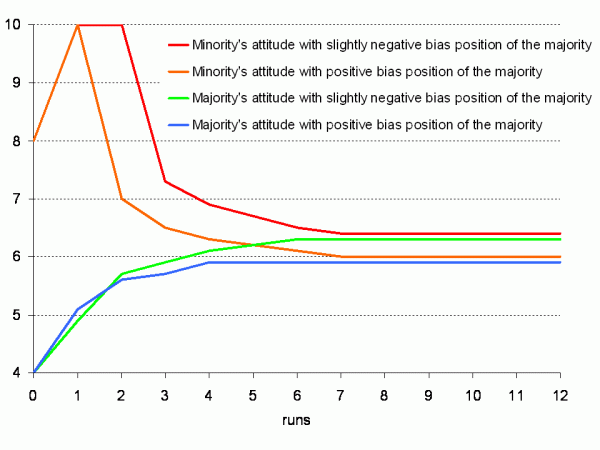
Figure 4. Development of minority and majority attitudes with a slightly negative bias position of the majority and a positive bias position of the majority

* Discussion

5.1
The first simulation experiment studying the effect of peripheral cues and argument quality on the influence of a minority yielded very interesting results. Contrary to the expectation that a high argument quality will be most important, positive peripheral cues turned out to be central. Even a minority with a low argument quality can be successful as long as it has positive peripheral cues. Negative peripheral cues of a minority mean that the minority is not only different in its opinions but also in its external attributes.

5.2
In the literature, such a double difference defines an out-group (Petty et al. 1994). The results of our simulations coincide with Clark and Maass (1984) who have shown that out-group minorities are less successful in persuading a majority than in-group minorities that only differ from the majority in their attitude. Given that the majority originally has a neutral attitude in our starting values, it has no motivation to defend its own opinion or to treat counter-arguments centrally, so that the peripheral route becomes all the more important (Crano and Hannula-Bral 1994). The over-estimation of the importance of peripheral cues may be in part attributable to the starting values, but the results nonetheless suggest that the minority's external attributes are considered first in order to decide whether the arguments will be heard or not.

5.3
Another aspect of the first simulation was the influence of a two-person minority instead of one with a single member. The expectation that a larger minority will be more successful was confirmed. The reaction by the majority was always stronger to the persuasive efforts of the two-member minority. If the persuasion was successful, the attitude at the end was closer to the minority attitude than when only one minority member attempted the persuasion. However, when the reaction of the majority was negative, the end result was more negative for the two-member minority. It seems that if the majority was bothered by the opinion of the minority, having two members defend this opinion made matters worse. These results coincide with those found by Latané (1981) or Tanford and Penrod (1984) in their laboratory experiments.

5.4
The results of the effects of personal relevance on minority influence are only partly in keeping with the hypothesis. A higher personal relevance for the majority only led it to be more receptive to influence when the minority showed neutral peripheral cues and good or very good arguments. It seems that these attributes allow a minority to influence a majority that treats the information centrally. As predicted by Petty and Cacioppo (1986), the influence of the minority is reduced when the topic has a high personal relevance for the majority. A second finding was that a minority is more successful when the topic is not personally relevant to it. This is due to the fact that the majority then manages to influence the minority to a greater degree before the minority can influence the majority, which in turn reduces its success.

5.5
The expectation was that the more negatively biased a majority is, the less it is open to persuasion by the minority. The majority in the simulation often does not behave synchronically and reacts more slowly when negatively biased, which leads to results that are slightly different from those found in the literature. This is, in part, due to the method used and the order in which members were allowed to influence others. The results do show, however, that in general a neutral or only slightly biased majority is influenced more easily than a strongly biased one. The attitude of a minority with negative peripheral cues is always rejected, even by a positively biased majority. A minority's low argument quality alone does not suffice for rejection by the majority, unless it also has negative peripheral cues.

5.6
As regards personal relevance, the results confirm the postulates of the ELM theory (Petty and Cacioppo 1986). In the case of a topic with high personal relevance for the majority, the minority needs to produce arguments of high quality in order to be successful. When both peripheral cues and argument quality are high, almost no differences are observed in successful persuasion under different degrees of personal relevance. This suggests a confirmation of the postulate proposed by Petty and Cacioppo (1986), which predicts a co-presence of both central and peripheral routes in the processing of information at any time.

5.7
The influence of a minority on a majority with a biased attitude is not unequivocal. It is not quite clear whether external attributes or arguments are more successful at influencing a biased majority. After the first round of persuasion, the findings correspond to the hypotheses of the ELM, as they do in laboratory experiments. The results of later rounds, however, are not consistent. This deviation from traditional theory suggests a more dynamic process, and several rounds of persuasion may in fact create a different situation where the results are not equivocal. This may be an interesting topic to pursue further with simulations as well as laboratory research, which has so far used only a single cycle of persuasion.

5.8
The results obtained in the different simulations show that in general out-group minorities are less successful than those that differ from the majority only by their opinion but are otherwise similar. In their meta-analysis of 97 studies on minority influence, Wood et al. (1994) found that individuals not only want to be similar to attractive (in-group) minorities, but that they also perceive a normative pressure to differentiate themselves from minorities with a low social status (out-group). The lower the status, the stronger is the incentive to be distanced from the group. The meta-analysis concludes that the behavioural style of a minority is a key factor in its success, which is what we also observed in our results.

5.9
Self-categorisation theory (Turner 1991) postulates that the peripheral cues of a minority determine a successful minority influence. A minority seen as similar to the majority exerts normative pressure, whereas a dissimilar minority does not. The results of this simulation study suggest that the success of a minority at persuading a majority depends considerably on their peripheral cues. This conclusion contradicts Moscovici's (1980) theory that minorities are successful because they are different. It seems that more similar minorities, i.e. those with high peripheral cues, are more successful at influencing a majority.

* Strengths, Limitations and Future Directions

6.1
The research presented here shows that the simulation of a theory of social psychology that explains the social influence by a minority, namely the Elaboration Likelihood Model, yields valid results. The agents in the simulation demonstrate similar behaviours to those of human beings in laboratory experiments carried out in the past. The results of the simulation often reproduce similar outcomes to those in real situations. The results obtained can be explained by the internal processes of the agents which are observable thanks to the simulation. This shows that theory-guided modelling is closer to the reality because the theories are based on real findings and the results are consequently also more applicable to reality. It is an advantage to use theories for simulation because it is easier to test their validity by using existing data from laboratory research to test the computer model. Validity is very important and often neglected in social simulation (van Dijkum, de Tombe and van Kuijk 1999).

6.2
Simulations also help to advance theories, so that a need for formalisation helps develop a theory, for example. Specifications and possibly also extensions in the simulation framework can then be tested by traditional methods such as laboratory experiments. Another advantage of using theories is that they generally integrate many findings and are quite general, which means that tried and tested theories are rich in implications. This means that theory-based simulations can also reveal the most diverse implications. Finally, theory-guided knowledge and modelling of the 'inner' workings of the individual allow processes of social influence to be better understood. For real-world problems, this means that attempts to change the behaviour of groups or populations can be improved.

6.3
There are also some disadvantages to using social psychology theories, such as their high degree of specification, which makes them difficult to understand for those who do not work in this field. Another disadvantage is that each theory has a number of components and further developments that cannot be taken into account by a given simulation in a complete and differentiated manner. These two aspects make it difficult to crystallise the core statements from a theory and make it necessary to model these theories in cooperation with an expert from the relevant field.

6.4
The advantages of modelling processes of social influence on the basis of social psychological theories strongly outweigh the disadvantages. A large number of theories exist, and their use will bring great benefit to the simulation while simultaneously advancing theoretical research.

6.5
The agent model may be extended, since an individual not only has processes "inside" that can be explained by the elaboration likelihood of a topic. In the case of social influence, these processes may, for example, include the theory of social comparison processes by Festinger (1954), the theory of normative and informational influences (Deutsch and Gerard 1955), or the heuristic systematic model by Chaiken (1980) (see also Mosler and Brucks 2001).

6.6
The group model can also be improved by using more than just five agents. A group of ten agents with a minority of one to four members is definitely feasible and interesting. This could lead to more information on the influence of the proportion of minority members on its success in persuading a majority. As was shown in this paper, acceptance is higher when the minority has good arguments and positive peripheral cues and when the minority is bigger, but its rejection is also more important when it shows low argument quality and negative peripheral cues. In this light, it may be interesting to explore the influence of size further. Since the order of influence may have led to some artefacts, a random interaction pattern could be advantageous.

* Concluding Remarks

7.1
The fact that simulation models are sometimes able to reproduce reality without actually allowing any interpretation that is close to the problem studied is an often-criticised aspect of these models. Social psychology and its theories can help to improve this weakness in simulation models concerned with human behaviour and interaction. Such theories are generally based on observable facts and have been widely tested in various settings with human participants. They therefore provide a solid basis for modelling human behaviour.

7.2
Simulations allow new hypotheses to be set up for social psychology theories, which then need to be tested in real-life experiments. A simulation permits the exploration of situations that would often be too complicated or extensive to realise in the laboratory and therefore gives the researcher a clear advantage. Fruitful hypotheses have been generated by using a simulation model for the optimum design of campaigns to change ecologically relevant behaviour among the public, for example (e.g. Mosler, Ammann, & Gutscher 1998). A well-presented, comprehensible and valid computer simulation provides a useful impetus and tool for theory development and application in a manner that is exploratory as long as it is well founded in model and theory.

* Acknowledgements

The author thanks Anne-Marie Altherr, Nicola Nübold and Wernher M. Brucks for their contributions to this paper.

* References

BISCHOF N (1995) Struktur und Bedeutung - Einführung in die Systemtheorie [Structure and meaning — an introduction to systems theory]. Bern: Hans Huber.

CHAIKEN S (1980) Heuristic versus systematic information processing and the use of source message cues in persuasion. Journal of Personality and Social Psychology, 39, 752 — 766.

CLARK R and Maass A (1988) The role of social categorisation and perceived source credibility in minority influence. European Journal of Social Psychology, 18, 381 — 394.

CRANO W and Hannula-Bral K (1994) Context — Categorisation Model of social influence: Minority and majority influence in the formation of a novel response form. Journal of Experimental Social Psychology, 30 (3), 247 — 276.

DEUTSCH M and Gerard H B (1955) A study of normative and informational social influences upon individual judgment. Journal of Abnormal and Social Psychology, 51, 629 — 636.

FESTINGER L (1954) A theory of social comparison processes. Human Relations, 7, 117 — 140.

JOHNSON B T and Eagly A H (1989) Effects of involvement on persuasion: A meta-analysis. Psychological Bulletin, 106, 290 — 314.

LATANÉ B (1981) The psychology of social impact. American Psychologist, 86 (4), 343 — 356.

MAASS A and Clark III R (1984) Hidden impact of minorities: Fifteen years of minority influence research. Psychological Bulletin, 95, 428 — 450.

MOSCOVICI S (1980) Towards a theory of conversion behavior. In L. Berkowitz (Ed.) Advances in Experimental Social Psychology. New York: Academic Press.

MOSLER H-J, Ammann F and Gutscher H (1998) Simulation des Elaboration Likelihood Model (ELM). Ein Beispiel zur Entwicklung und Analyse von Umweltinterventionen [Using simulation of the Elaboration Likelihood Model (ELM) to develop and analyse environmental interventions]. Zeitschrift für Sozialpsychologie, 29, 20 — 37.

MOSLER H-J, Schwarz K, Ammann F and Gutscher H (2001) Computer simulation as a method of further developing a theory: Simulating the elaboration likelihood model. Personality and Social Psychology Review, 5(3), 201 — 215.

MOSLER H-J and Brucks W (2001) Social influence among agents. The simulation of social psychological theories. In N J Saam and B Schmidt (Eds.), Cooperative agents. Applications in the social sciences (125 — 147). Amsterdam: Kluwer.

PETTY R E and Cacioppo J T (1986) Communication and persuasion: central and peripheral routes to attitude change. New York: Springer.

PETTY R E and Cacioppo J T (1986b) The Elaboration likelihood model of persuasion. In L. Berkowitz (Ed.) Advances in experimental social psychology (pp. 123 — 205). New York: Academic Press.

PETTY R E and Cacioppo J T (1994) The effects of involvement on responses to argument quantity and quality: central and peripheral routes to persuasion. Journal of Personality and Social Psychology, 46, 69 — 81.

PETTY R E, Fleming M, and White P (1999) Stigmatized sources and persuasion: prejudice as a determinant of argument scrutiny. Journal of Personality and Social Psychology, 76(1), 19 — 34.

PETTY R E, Priester J R and Wegener D T (1994) Cognitive processes in attitude change. In R S J Wyer and T K Srull (Eds.), Handbook of Social Cognition (pp. 69 — 142). Hillsdale, NJ: Lawrence Erlbaum Associates, Inc.

STAHLBERG D and Frey D (1993) Das Elaboration-Likelihood-Modell [The elaboration likelihood model]. In D Frey and M Irle (Eds.) Theorien der Sozialpsychologie. Band I: Kognitive Theorien (pp. 327 — 359). Bern: Hans Huber.

TANFORD S and Penrod S (1984) Social influence model: A formal integration of research on majority and minority influence process. Psychological Bulletin, 95 (2), 189 — 225.

TURNER J C (1991) Social influence. Bristol: Open University Press.

VAN DIJKUM C, de Tombe D and van Kuijk E (1999) Validation of simulation models. Amsterdam: SISWO.

WHICKER M L and Sigelman L (1991) Computer simulation applications. An introduction. London: Sage.

WOOD W, Lundgren S, Quellette J, Busceme S and Blackstone P (1994) Minority influence: a meta-analytic review of social influence processes. Psychological Bulletin, 115 (3), 323 — 345.

WOOD W, Rhodes N and Biek M (1995) Working knowledge and attitude strength: An information-processing analysis. In R E Petty and J A Krosnick (Eds.), Attitude Strength: Antecedents and Consequences (pp. 283 — 313). Mahwah, NJ: Lawrence Erlbaum Associates, Inc.

----

ButtonReturn to Contents of this issue

© Copyright Journal of Artificial Societies and Social Simulation, [2006]