© Copyright JASSS

JASSS logo ----

Victor Palmer (2006)

Simulation of the Categorization-Elaboration Model of Diversity and Work-Group Performance

Journal of Artificial Societies and Social Simulation vol. 9, no. 3
<https://www.jasss.org/9/3/3.html>

For information about citing this article, click here

Received: 28-Oct-2005    Accepted: 17-Apr-2006    Published: 30-Jun-2006

PDF version


* Abstract

The relationship between the diversity of work-groups and their performance continues to be a key concern in the study of organizational behavior. Several models have been proposed to explain this relationship, generally concentrating on the interplay between two main factors: diversity as a source of varied knowledge and viewpoints that a group can draw upon to increase its performance, and diversity as a source of dissention in groups, causing group fracturing and bias, leading to decreases in performance. Recently a model called the categorization-elaboration model (CEM) (van Knippenburg et. al. 2004) was proposed which integrates existing research in diversity and group performance into a unified framework. We perform an agent-based simulation of the CEM where groups are modeled as coalitions of rational agents which draw from distinct experience pools and which collectively try and solve a simple forecasting problem. We simulate how the performance of the coalition varies with the diversity of the agents' background experiences, and find that the resulting performance/diversity relationship is curvilinear in nature (specifically, inversely u-shaped), as predicted anecdotally in the van Knippenburg work. Additionally, we find a point of unstable equilibrium in the performance/diversity curve at the no-diversity point, such that at the no-diversity point, small increases in diversity have little or no effect on performance. We point out a connection between the existence of this feature, which would seem to highlight the importance of external diversity-encouraging efforts such as affirmative action-type initiatives and early economic work which suggests that market-based forces should be sufficient to ensure high levels of diversity in organizations.

Keywords:
Workgroup Performance, Diversity, Categorization-Elaboration Model, Multi-Agent System, Market Forces

* Introduction

1.1
The diversity of work-groups continues to be a key concern in the study of organizational behavior. Organizational workgroups have become increasingly diverse (demographically and functionally) over the years, and by all indications, this trend will continue in years to come (Jackson 1992; Triandis, Kurowski, & Gelfand 1994; Williams & O'Reilly 1998). Many studies have shown diversity to impact the performance of work-groups, but the exact nature of the relationship between diversity and performance is not at all straightforward as both positive and negative correlations between diversity and performance have been found (e.g. Guzzo & Dickson 1996; Milliken & Martins 1996; Williams & O'Reilly 1998), and as such, understanding the underlying principles behind the diversity-performance link continues to be an interesting problem in organizational theory and behavioral psychology.

1.2
Historically, the psychological and management sciences literature has defined diversity as any attribute which may lead to the perception that another person is different from self (e.g.Jackson 1992; Triandis et al. 1994; Williams & O'Reilly 1998). As such, diversity can potentially refer to a staggeringly large, very arbitrary, number of dimensions, though researchers have generally concentrated on examining the effects of differences along readily visible dimensions such as gender, race, age, seniority, education, training, etc. (Milliken & Martins 1996; Williams & O'Reilly 1998). Even more conveniently, many researchers have suggested that diversity can be grouped into two distinct classes: social category diversity, which comprises differences such as age, race, gender, etc., and informational/functional diversity, in which are grouped more job-related differences such as functional and educational background (Jackson 1992; Jehn, Northcraft, & Neale 1999; Milliken & Martins 1996; Tsui, Egan, & O'Reilly 1992).

1.3
Almost in the spirit of this binary diversity classification, there have generally been two traditions of research on the diversity/performance link (Williams and O'Reilly 1998): the social categorization perspective and the information/decision-making perspective. The social categorization tradition focuses on how similarities and differences are used by group members to place each other into categories, with members generally preferring to interact with other members perceived to be in their own category over members perceived to be in foreign categories (Brewer 1979; Tajfel & Turner 1986; Turner, Hogg, Oakes, Reicher, & Wetherell 1987). If a work-group is extremely diverse, then this school of thought says that the work-group will tend to fracture into many sub-groups, and problems encountered in the interaction of these sub-groups may result in an overall decrease in performance for the workgroup. On the other hand, under this perspective a relatively homogenous group should experience relatively greater levels of member commitment (Riordan & Shore1997; Tsui et al. 1992), greater group cohesion (O'Reilly, Caldwell, & Barnett 1989), fewer relational conflicts (Jehn et al. 1999; Pelled, Eisenhardy, & Xin 1999), and less turnover (Wagner, Pfeffer, & O'Reilly 1984), such that one would expect homogenous groups to perform better than their heterogeneous counterparts (as evidenced in Jehn et al. 1999; Murninghan & Conlon 1991; Simons, Pelled, & Smith 1999).

1.4
In contrast, if the diversity-performance link is analyzed from the information/decision-making perspective, the opposite conclusion (that heterogeneous groups should outperform homogeneous groups) is reached. Broadly, the idea here is that diverse groups should collectively possess a wider range of knowledge, and generally benefit from a larger number of contributing perspectives than homogeneous groups, and will thus be able to make better collective decisions and produce more collaborative, creative work. As group members discuss their disparate perspectives, task conflict may occur where group members argue over which viewpoint is better. Such conflict is thought to foster the creation of innovative solutions and creativity in general (Ancona & Caldwell 1992; Bantel & Jackson 1989; De Dreu & West 2001), and there is some evidence to support this point of view (Jehn et al. 1999; Pelled et al. 1999; Bantel & Jackson 1989; Cox, Lobel & McLeod 1991).

Figure 1
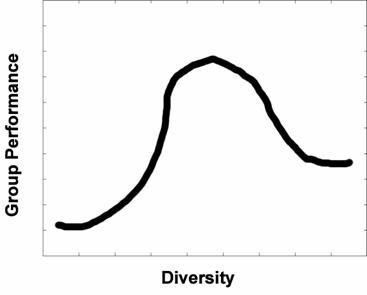
Figure 1. The CEM predicts a curvilinear relationship between diversity and group performance like the one sketched above. Starting from the minimal-diversity point, increasing diversity should increase group performance … but eventually these performance increases will taper off, and performance may even decrease as diversity is increased to higher and higher levels

1.5
Finally, there has been some very recent efforts to unify these two fairly discrete viewpoints into a more modern view that acknowledges the coexistence of both informational and social/categorical group responses to diversity, and specifically, that any given dimension of diversity is capable of both positively and negatively impacting performance (e.g. the CEM (Categorization-Elaboration Model) by van Knippenberg et al. 2004). Such models anticipate no linear relationship between diversity and performance, but instead predict a curvilinear relationship such as the kind sketched in Figure 1. For example, in describing their model, the authors of the CEM predicted that they would see "diversity stimulating elaboration and enhancing performance … up to a point, beyond which more diversity no longer benefits performance and might even be detrimental to performance (i.e., an inverted U-shape)" (van Knippenberg et al. 2004), and in fact, there is already some early experimental support for this new class of model (Gonzalez-Roma, West, and Borril 2003; Brodbeck 2003).

1.6
In this present work we will perform an agent-based simulation of the CEM as defined in the van Knippenberg work. Although the CEM provides a good psychologically-founded theory for how diversity impacts efficiency, we hope to gain additional insights into how this relationship works from an objective, information-based standpoint. We will model groups as collections of rational agents, each drawing from a distinct experience pool. We present our agent groups with a simple prediction problem where the group must use its past experience to perform an evaluation of a proposed future event, and measure performance in terms of the accuracy of the group's predictions as a function of the number of distinct experience pools represented in the group. We simulate a number of variations of the CEM and find that in all cases, we observe the kind of curvilinear 'U-shaped' performance curve predicted by the van Knippenberg work. Finally, we note that our simulations feature a point of unstable-equilibrium at the no-diversity point, such that starting at the no-diversity point, the slope of the performance/diversity curve is very small, and as such very small changes to workgroup diversity yield little change in workgroup performance. We point out that the existence of this feature would make it difficult for organizations at the minimal-diversity point to see significant performance improvements in response to small, exploratory increases in organizational diversity, and that in the context of this simulation, the existence of this feature would seem to emphasize the importance (both economically and socially) of extra-organizational diversity-increasing efforts such as affirmative action. Finally, we draw a connection between the existence of this unstable-equilibrium point and a historical economic theory by Becker (1971), which says that in a competitive marketplace, market forces should be sufficient to coerce organizations into diversifying their work force. Many researchers have proffered explanations as to why the Becker model might fail or not apply in certain economic circumstances (in other words, explaining why diversity-hampering forces such as gender wage gaps still exist at all, e.g., Fuchs 1988; O'Neill 1994), and our findings offer a unique perspective on the potential failure modes of this theory.

* The Categorization-Elaboration Model

2.1
The Categorization-Elaboration Model (van Knippenburg et al. 2004) provides an explanation of the link between diversity and group performance which integrates the social/categorization viewpoint and the informational-decision making viewpoint as described earlier. Specifically, the CEM suggests that two main factors (elaboration and categorization) affect workgroup performance's relation to diversity. The first factor, elaboration, refers to the process of a group collectively processing the knowledge possessed by each individual group member. The theory is that through elaboration, a workgroup can combine and improve upon the discrete viewpoints held by its members to produce results that are more informed, more creative, and otherwise superior to what could be produced by each member working in isolation. In the information-decision making viewpoint, the benefits of elaboration are similar to the benefits of task conflict, where group members argue about which viewpoint is best, and in the process, come up with viewpoints superior to those possessed by any single group member. However, there is evidence that conflict itself is not likely to improve group performance (De Dreu & Weingart 2003), and the notion of elaboration refers purely to group members discussing and improving on each other's ideas and viewpoints to come up with a superior solution without any particular negative interactions, and certainly, there is evidence that workgroups which focus on sharing and processing diverse information and member viewpoints show an increase in performance (Cannon-Bowers & Salas 2001).

2.2
Working against elaboration is the process of social categorization and the associated presence of inter-group bias. Social categorization simply means the tendency of a group of individuals to form a mental model of the group such that some members are 'in-category' to themselves and others are 'out-of-category' to themselves (van Knippenburg et. al 2004). As social categorization increases, there is the danger of inter-group bias manifesting such that individuals rely on the opinions and viewpoints of in-category members more than those of out-of-category members, and such bias is thought to hamper the group's collective ability to integrate the knowledge of its members in the elaboration process. It is worthy of note that inter-group bias is a secondary associated process to social categorization — a variety of factors affect the exact relationship between categorization and bias (for example, groups which attempt to suppress or ignore the existence of categorization (e.g., Hornsey & Hogg 2000) may actually induce inter-group bias), and simulating this relationship is well beyond our intent here. We will be far more interested in the overall nature of the interplay between categorization, elaboration, and bias. As such, we will generally say that some level of bias is produced from categorization, and as we will see, in the end this will be sufficient for the level of detail we will want in our simulations.

2.3
As far as the relationship between diversity and categorization, several models have been proposed (Oakes, Haslam, & Turner 1994; Turner et al. 1987), and along these lines, van Knippenberg, et. al., mention several factors which impact the salience of various categorizations such as comparative fit, normative fit, and cognitive accessibility. As cognitive accessibility and normative fit refer to the beliefs and social norms of the group members, we will graciously pass over these two factors as non-simulatable in this work. Comparative fit, however, is more informational in nature and refers to the extent to which a categorization provides high between-category differences and high in-category similarities, and the higher a categorization's comparative fit, the more salient it is, and the more likely it is to be a factor in group social categorization (van Knippenburg et al. 2004). Interestingly, diversity interacts in a non-linear way with comparative fit, where the low-diversity regime results in low comparative fit (in the extreme case of a single-category homogenous group, there are no differences, for example), the mid-diversity regime will results high comparative fit, and the high-diversity regime also results in low comparative fit since there are so many categories that between-group differences become blurred. An example of this effect, as argued by Earley and Mosakowski (2000), is transnational teams which are composed of members from many different countries. Earley and Mosakowski argued that in such a team, categorization into same-nationality subgroups would be extremely difficult (simply because of the number and variety of nationalities represented), whereas in teams consisting of, for example, only two or three nationalities, such categorization would be much more salient. With this in mind, we will explore the effects of two different models relating diversity to social categorization. The first will be the comparative fit model, as just discussed, where categorization will first increase and then decrease with increasing diversity, and the second will be a simple linear model, where categorization strictly increases with diversity.

* Simulating the CEM

Introduction

3.1
We want to perform an agent-based simulation of the CEM to investigate the effects of diversity on group efficiency. We will perform this simulation much as the theory itself is organized — in two parts — one part simulating the effects of elaboration, where distinct group member viewpoints come together to form more informative views, and a second part simulating the effects of social categorization and bias on the elaboration process. While the CEM is a very complete modern theory, it is phrased in terms of psychological concepts - by performing an agent-based objective simulation, we hope to gain insights into the objective informational underpinnings of the CEM.

3.2
We will represent the different viewpoints as the following: Imagine that we have N agents Ai, each of which possesses some set of sensors Si. These sensors are the agent's link to the outside world, and may be vastly distinct, giving each agent a unique perspective. This collection of agents is exposed to a series of n events Ei, and each agent observes the event sequence independently, gathering information about the proceedings through their respective sensors. Specifically, we will say that agent Ai's sensors give off a reading of Si(Ek) when exposed to event Ek. Further, we will say that associated with each event is a scalar reward R(Ek) which measures how positive (or negative) each event was for the agents. Note that we implicitly assume that all agents have the same reward function R. Although this might not be the case for some hypothetical situations, and although it might be interesting to examine the effects of diversity on groups of agents with different priorities and event valuations R, for simplicity we will here stay with a uniform reward function R across all agents. We will call the ordered list of rewards associated with the events that the agents observe the reward vector, denoted R = {R(E1), R(E2),…., R(En)}, and call the ordered list of an agent's sensor outputs for the same series of events an agent's experience vector Si = {Si(E1),…, Si(En)}.

3.3
The task we will require our agents to perform is the following: Given some hypothetical future event EF, predict the associated reward R(EF) using only the sensor readings Si(EF), and the record R and Si of past rewards and experiences. This task easily generalizes to the multi-agent (group) domain: Given the output of the sensors of all the agents in a group for some hypothetical event (and given R and Si for each member of the group), all agents collectively predict the associated reward for that event. At this point the reader may question how the size of the memory of the system agents will impact their performance. In other words, intuitively we should expect that a very experienced agent (with access to a very large n number of events) might do better than an agent who has not had much experience. This question is very much related to the subject of classifier training in traditional machine learning research, where one expects a classifier to perform better the more training points it has access to. Unfortunately, delving into this subject is well beyond the scope of this paper - for those interested readers however, we will say that such questions won't have much relevance for our simulations in this paper because we will only make our agents estimate rewards for their past experiences … which is very similar to testing a classifier on its training data.

3.4
This task is intended to simulate a group using its past experiences to come up with a decision regarding future action. That is, we imagine that a group of commerce agents, for example, is presented with a question - "Should we proceed with Proposal A?" The agents must use their respective experiences to predict whether Proposal A will be an overall profitable venture to pursue. For a single rational agent, this problem would reduce to searching its experience vector for a similar experience - and assuming a close match was found, the predicted reward for Proposal A would just be the corresponding entry in the agent's reward vector.

3.5
This strategy may lead to bad results, however, if an agent's sensors convey to it incomplete information about its environment. For example, imagine that the agent was witness to two events - one resulting in an extremely positive reward, and the other resulting in an extremely negative reward - but that these two events registered identically on the agent's sensors. Of course then, this agent would have no way to appropriately determine exactly the future reward of events that produced similar sensor readings. We can analytically capture this uncertainty effect by speaking of an agent's predicted reward Pi - the reward of an event as predicted by an agent using only its own experience and reward vectors.

Pi(E) = < R(Ek) > Si(Ek)=Si(E) (1)

Where <> refers to expectation in the above equation. That is, to determine its predicted reward for an event, an agent searches through its experience vector, finds all events with identical sensory outputs, and then averages the true reward of those events. A particularly interesting measure for us will be an agent's predicted reward vector Pi>, which will simply be a vector of predicted rewards for the events the agent was originally exposed to:

Pi = { Pi(E1), Pi(E2),…, Pi(En) } (2)

3.6
We can then construct a predicted reward error vector Ji such that

Ji = { | Pi(E1) - R(E1) |, | Pi(E2) - R(E2) |, … ,| Pi(En) - R(En) | } (3)

Elaboration and Diversity in the Group Setting

3.7
This formulation extends to the group (multi-agent) setting very naturally: we will simply imagine the group as a super-agent possessing the union of the sensors of its member agents. The entire group super-agent calculates a predicted reward vector, and afterward, each member agent simply adopts this group predicted reward vector as its own. The predicted reward error vector would then be calculated as in the single-agent setting. We will denote the predicted reward vector for a group PG, and in the context of the CEM, this should be considered to be a post-elaboration representation of group opinion, since all the member agent's sensors went into computing PG. In such multi-agent situations, we would hope that J-error effects can be lessened. Because the group can rely on the superset of the sensor outputs of the entire group, the group is more able to collectively disambiguate events, and thus should have lower group predicted reward error J.

3.8
Finally, in this setting, it might be tempting to simply say that diversity should be defined as the number of agents in a group. However, one immediate concern is how to account for the effect of some agents potentially possessing a large number of sensors (the analogue of group members with individually extremely diverse backgrounds, and one would expect the contribution of such agents to the group's prediction accuracy to be large) while other agents possess very few sensors (with expectedly smaller group accuracy contributions). We will later find it convenient to assign each agent a fixed number of sensors (we will end up assigning them exactly one in fact), such that it will be much more appropriate to talk of diversity in terms of sensor count. Thus, for the rest of this work, the diversity of a group will simply be the number of sensors collectively possessed by the group's member agents.

3.9
We want to say a word about the appropriateness of simply equating diversity with the number of group sensors. Earlier we defined diversity to be any attribute which may lead to the perception that another person is different from self (as in Jackson 1992; Triandis et al., 1994; Williams & O'Reilly 1998). It is beyond the scope of this paper to model the internal psychological processes of our simulation agents that would allow them to view agents as 'different from self'. Instead, we simply equate the number of sensors in a group to the group's diversity — and admittedly, this is somewhat unsatisfying since it doesn't explicitly model this 'different from self' aspect psychologically. However, we believe that defining diversity in terms of sensor inputs is still useful since 1) it is very straightforward to model, and 2) different sensors represent agents having different viewpoints or experiences of their world. This definition makes some intuitive sense - a person with a different viewpoint or experience will probably be viewed as different from self, and a group with ten people with different viewpoints should be more diverse than a group with only nine different viewpoints.

A Simple Example

3.10
To illustrate the simulation environment we are building and the terms we have just defined, let us work through a quick example. In particular, we will analyze the case of a group of agents try to analyze the safety of various events. We will assume that each of the agents has a set of past experiences with safe and unsafe events, and Table 1 lists the set of experiences and how each experience registers on various sensors, along with the safety rating (or reward) associated with each event.

Table 1

EventsDescriptions of events (for us)Sensor Names (all possible sensors)(TRUE) REWARD R
VISIBILITYENEMIESWAS I HUNGRY?TEMPERATURE
Event 1fighting many enemiesexcellentmanynohot-300
Event 2on vacationexcellentnonenohot100
Event 3stranded in Antarcticapoornoneyescold-25
Event 4cooking dinnerexcellentnoneyeshot100

3.11
Let us consider what would happen if one of our group's member agents (call it Agent X) was exposed to these same set of experiences, but only had access to the TEMPERATURE sensor (Table 2):

Table 2

EventsDescriptions of events (for us)Sensor Names (for X)TRUE
REWARD R
PREDICTED REWARD
PX
TEMPERATURE
Event 1fighting many enemieshot-300-33.3
Event 2on vacationhot100-33.3
Event 3stranded in Antarcticacold-25-25
Event 4cooking dinnerhot100-33.3

3.12
The reader can see that the reduced sensor information will have an impact on how X sees the world. Since X does not have access to more complete information about the environment, X must base its decisions on its predicted reward vector PX calculated by using only X's sensors. For example, imagine that X was presented with a choice of a hot or cold environment. Since on average PX (hot) = (-300 + 100 + 100)/3 = -33.3, and PX (cold) = -25, X, being rational, would choose the cold environment. However, we see, since we have access to information which X does not, that this is really a bad choice. Only a single hot event resulted in a negative reward, whereas twice that many hot situations resulted in a positive reward. In all cases however, cold situations were negative. However, X had only limited information about the environment, and this had an effect on the quality of the choices X would make. Let us now look at another group member Y:

Table 3

EventsDescriptions of events (for us)Sensor Names (for Y)TRUE
REWARD R
PRED. REWARD
PY
ENEMIES
Event 1fighting many enemiesMany-300-300
Event 2on vacationNone10058.3
Event 3stranded in AntarcticaNone-2558.3
Event 4cooking dinnerNone10058.3

3.13
Without boring the reader, Table 3 shows that while Y will not make the same egregiously bad decisions as X (note that, if given the choice, it would choose a 'no enemies' event over an 'enemies' event), this agent still lacks a significant amount of information about the environment. As the experience table shows, some 'no enemy' situations are better than others, but Y is unable to tell these experiences apart. Finally, we imagine that X and Y are placed in a group together (Table 4).

Table 4:

EventsDescriptions of events (for us)Sensor Names (for G = X & Y)TRUE
REWARD R
PRED.
REWARD
PG
ENEMIESTEMPERATURE
Event 1fighting many enemiesmanyhot-300-300
Event 2on vacationnonehot100100
Event 3stranded in Antarcticanonecold-25-25
Event 4cooking dinnernonehot100100

3.14
The reader should note that now, X and Y have, between the two of them, all the information needed to distinguish uniquely between all four experiences such that the predicted reward for the group equals the true reward for all events (zero predicted reward error, in other words). Actually, this occurrence is a little fortuitous … notice that all the events have their true reward only because Event 2 and Event 4 had the same reward. That is, even with two sensors there is not enough information to tell Event 2 and Event 4 apart, and if they had had different true rewards, we would still need more sensors to disambiguate the two.

A Simulation Model of Categorization

3.15
In the CEM, categorization refers to the tendency of a group to form sub-groups, the existence of which can promote bias, which in turn can hamper the group's ability to effectively share information and perform elaboration. In our simulation context, we will model the effect of categorization and bias as the tendency of an agent to not adopt the group's predicted reward vector PG as its own, but instead to adopt its own local predicted reward vector. Specifically, we will define a parameter f which measures the extent of categorization/bias effects such that an agent's effective predicted reward vector is:

Fi = f Pi + ( 1 - f ) PG (4)

3.16
To get an intuitive idea of what the parameter f is doing, think about the following: When f is 0, the agent's effective reward vector Fi is equal to PG and the agent assigns rewards to events using the information generated by all the group's sensors. That is, when f is zero, the agent has no bias toward using its own sensors. When f is 1 however, Fi is equal to Pi and uses only its own sensors to assign rewards to events. This models the case where the agent is heavily biased to consider the output of its own sensors.

3.17
Continuing, we will redefine the error vector J to be simply,

Ji = { | Fi(E1) - R(E1) |, | Fi(E2) - R(E2) |, … ,| Fi(En) - R(En) |} (5)

which of course reduces to our earlier expression in the absence of bias effects (f = 0).

3.18
Thus f represents the degree to which an agent is unable to adopt the post-elaboration group-reward vector, much resembling the anticipated effects of group bias in the CEM. According to the CEM, this effect should vary with diversity, although as we discussed earlier, exactly how this variation occurs is extremely dependent on the nature of the group, the nature of the group's diversity, etc. As promised, we will evaluate the effects of two different models of how f (bias effect) varies with diversity - the first will be a simple linear model, and the second will be the comparative fit model as discussed earlier.

* Simulation

Methods

4.1
For our first experiment, we performed a simulation of how group performance and bias varied with diversity under our model as defined above. Our test-bed consisted of 10,000 events with randomly generated reward values (uniformly between -100 and +100). Events were sequentially presented to all agents (each event was presented to every agent). Each event was measured by 100 binary sensors such that each sensor could produce a reading of 0 or 1 for each event. Sensor outputs were also randomly generated (uniform probability of 0 and 1), for each event, which made each sensor statistically independent and its informational contribution unique from all the others. A group with diversity D was constructed by randomly choosing D of these sensors and constructing a group experience table much as in Section 3.9. This is equivalent to considering a set of 100 agents, each one possessing one of the 100 sensors, and groups simply being formed by selecting D of these agents. For each group, a group predicted reward vector PG was calculated over the 10,000 events using all the agent sensors in the group, and from that, group predicted reward error |JG| was then computed. Consistently, we reported error as the magnitude of the error vector relative to the maximum magnitude of any error vector encountered over a particular set of events. We generated 100 sets of 10,000 events, each with generated reward and sensor readings, and evaluated groups for diversity D (sensor count) between 1 and 40, where, for each value of D, we built and evaluated 250 groups. To evaluate the effects of categorization and inter-group bias, we computed an effective predicted reward vector Fi and associated error Ji for each agent and reported the magnitude of <J>, the error vector averaged over all the group agents. The MATLAB code for the simulator is available here. Note that although in results we report here reward was effectively a random function of sensor readings, other functions which depended deterministically on sensor outputs were tried, but resulted in nearly identical numerical results and certainly in no qualitative differences in the shape of the performance/diversity curve.

Results

Figure 2
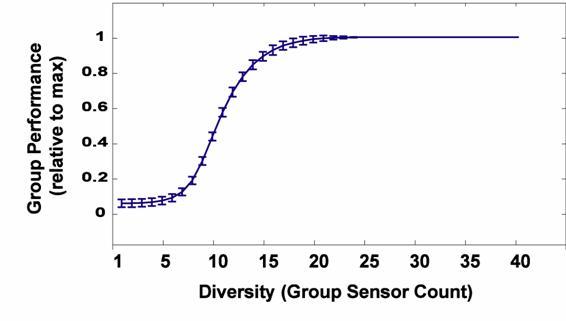
Figure 2. Relative group performance (1 - group predicted reward error / max error) as a function of diversity (no categorization effects considered)

Figure 3
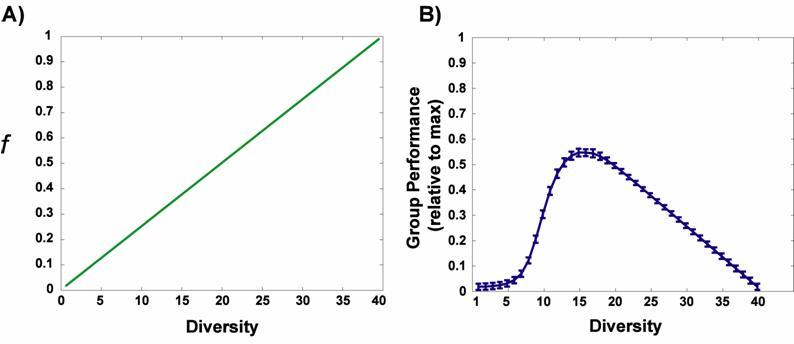
Figure 3. Average, per-agent predicted reward error for the linear diversity/bias model. (A) shows the assumed relationship between diversity and the bias parameter f (which represents a group's negative reaction to diversity), and (B) plots group performance (1 - average error / max possible error) as a function of diversity

Figure 4
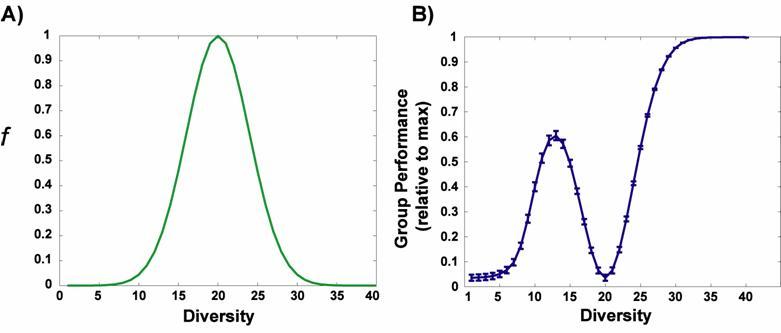
Figure 4. Average, per-agent predicted reward error for the comparative fit diversity/bias model. (A) represents the relationship between diversity and the bias parameter f (which represents a group's negative reaction to diversity), and (B) plots group performance (1 - average error / max possible error) as a function of diversity

4.2
In Figures 2-4 we plot group performance as a function of diversity for various situations. Group performance was defined here to be (1 - error / maximum possible error). We plot predicted group performance as a function of diversity for no categorization effects considered (Figure 2), categorization effects computed with under a linear categorization/diversity model (Figure 3), and categorization effects computed with the 'comparative fit' categorization/diversity model (Figure 3). Note that we have used a simple Gaussian to represent the relationship between categorization and diversity under the comparative fit model (simply to represent a function which first increases, and then decreases with diversity), and that this is more than adequate for this simulation.

4.3
Notice that in the absence of bias effects (Figure 2) … which happens if agents always use all the sensors of the group (if we clamp f at 0) — that the group performance exhibits a sigmoidal form with respect to diversity. Starting from the point of minimum diversity, adding diversity to a group slowly increases group performance, but this rate of increase speeds up as more and more diversity is added. Computationally what is happening is that agents are being given access to more sensors and can better differentiate past experiences and provide increasingly accurate reward estimates. Eventually however, the agents have enough sensors to differentiate most experience events, and increasing diversity further by adding more sensors really doesn't help the reward estimate accuracy that much. In this regime the performance/diversity curve flattens out (right side of Figure 2).

4.4
Categorization effects occur when agents don't trust/work-well/etc. with agents viewed as different from themselves. In our system, when categorization effects are high, agents are more apt to use their own sensors and disregard the information produced by the sensors of other group agents. We introduced a parameter f to represent the magnitude of these categorization effects. When f is zero the agent uses all the information from all the sensors of the group agents, and when f is unity the agent only uses the information from its own sensors. We simulated group performance as a function of diversity when these categorization effects were considered.

4.5
First we assumed a linear model of categorization/diversity where the agent is more and more likely to use its own sensors the more diverse the group becomes. Figure 3a plots how f varies with the group diversity (it simply increases linearly). The result of adding in these categorization effects was that the group performance/diversity graph exhibited a definite inverse-u shape, first increasing with diversity, then reaching a fairly sharp maximum, then rapidly falling off (Figure 3b). This is consistent with the curvilinear form of the performance/diversity graph predicted by the van Knippenburg et al. (2004) theory.

4.6
We then assumed a 'comparative fit' model of categorization effects / diversity (Figure 4a). Under this model categorization effects first increase, then decrease with increasing diversity. We chose a to model f with a conveniently-centered Gaussian. Note that the comparative fit model only says that categorization effects must first increase and then decrease with diversity … not specifically that they conform to a Gaussian form, or that they max out at any particular point. Here we have centered the Gaussian in our simulation domain for convenience and because it produces results which are more easily understandable. We found the same sort of inverted-u shape in the group performance/diversity plot, only this time the performance one again increased in the high-diversity domain. Simulation-wise, what is going on here is that at first, agents have access to more and more sensors, which results in an increase in group performance. At a certain point however, categorization effects start to play a dominant role and agents begin to rely more and more on their own sensors, which decreases group performance. As diversity increases even further however, there are so many different sensors represented in the group that the 'comparative fit' model says that categorization effects should once again drop off. When this happens agents once again begin to use the sensors of other agents in the group, and group performance once again increases (right side of Figure 4b).

* Practical Implications

5.1
In all cases, we observed that the elaboration process resulted in a signature sigmoid-type curve in the performance plot (as in Figure 2), with the effects of categorization and bias being more or less 'overlaid' on top of this sigmoid effect (as in Figures 3 and 4). One of the most interesting features that we observed from these results is that in all cases considered, the performance/diversity plot has a point of zero-derivative at the minimal-diversity point (look at the left side of Figure 2). Consider for a moment what this would mean to an organization attempting to maximize workgroup performance with respect to diversity. That is, imagine that an organization starts at some point on the performance/diversity plot and increases or decreases diversity until some maximum level of performance is reached (essentially performing gradient ascent on the performance/diversity surface). If the organization in question began at a point of significant diversity, then this strategy clearly works, since no matter where this initial point is, the gradient of the performance plot will suggest an appropriate, performance-enhancing modification to group diversity. Furthermore, this strategy is very much a low-risk strategy: the organization can make small exploratory changes to diversity, and immediately see an increase in performance. Thus, management would be able to see a clear justification for diversity changes and no 'leap of faith'-type management decisions (where policies are changed without direct performance benefits) would be required to reach the optimal diversity point.

5.2
However, if the organization in question began at a state of minimal diversity (in our framework, a group consisting of only one agent/sensor … a homogenous group, in other words), this low-risk, gradient-following strategy will not be as effective. That is, from our simulations, the minimal-diversity point appears to be a point of zero-gradient - or, more technically, a point of unstable equilibrium - no impetus (under a gradient following scheme) is provided to move away from the point, but once away, movement will continue in that direction. Increasing diversity from the zero point will certainly not decrease performance, but for small diversity increases, any performance increase will be slight at best since, again, the slope of the performance plot is by all appearances zero at this point. One can easily imagine the case of an organization starting out at this minimal-diversity point and attempting to evaluate whether increasing diversity makes business sense for the organization. In contrast to the case where the organization is already at a point of some diversity, here our simulations predict that small, exploratory increases in diversity would result in little observed performance improvement, which is unfortunate, since this might encourage the minimal-diversity organization to conclude that increasing diversity is not an effective means of improving workgroup performance. For such an organization, increasing diversity enough to see a performance improvement would involve making a policy decision not strictly motivated by productivity (or at least there would be no way for the organization to know that increasing diversity would increase productivity via safe, incremental policy exploration). It seems that for such an organization, other, possibly external, factors (or a strong internal tendency to significantly experiment with management policies) would be needed to catalyze the move away from the minimal-diversity point.

5.3
From these results, efforts such as affirmative-action-type initiatives would seem to provide a useful impetus to force organizations near the minimal-diversity point father out on the performance/diversity curve. This observation is somewhat related, and in contrast to, some historical work done by the economic community which postulates that market-based forces should be sufficient to coerce organizations (or at least commercial organizations which are under competitive commercial pressures) to self-diversify (Becker 1971). Broadly, Becker's reasoning was that diverse organizations are more efficient, and as such diverse companies would receive a competitive edge over their less-diverse competitors, with the eventual result that only the most diverse organizations would survive. Obviously, this theory has not always been obeyed historically, and several authors have proffered explanations as to why Becker's theory is not strictly obeyed, and why diversity-hampering forces such as gender wage gaps still exist (e.g., Fuchs 1988; O'Neill 1994). Interestingly, our results here are consistent with an idea proposed by Becker himself for a possible failure mode of the market-driven diversification theory. Specifically, Becker suggested that the market-based promotion of highly diverse companies might not happen if there was a widespread lack of entrepreneurial spirit (with regards to diversity issues at least) in a given market (Becker 1968; Donohue 2005). Becker envisioned a market where all competitors were at the minimal-diversity point, and no one company stepped up to the plate to gain a competitive edge by significantly increasing internal diversity. Our results are consistent with this view, since we just showed anecdotally how a minimal-diversity point organization must possess some brave, entrepreneurial spirit (or at least be willing to take the risk of increasing diversity beyond incremental, 'test-the-waters'-type levels) to increase diversity, since small, safe, diversity increases would show no immediate significant gains in productivity. In order to gain a performance advantage, the minimal-diversity organization needs to believe that there is a peak in the performance/diversity curve 'somewhere ahead' and take the 'risk' of a more substantial diversity increase. If all players in a market lacked this experimental/entrepreneurial drive, it is certainly foreseeable that entire markets could be stable at the minimal-diversity point.

5.4
It becomes harder and harder to find examples of minimal-diversity organizations in modern times. To today's organizations, which generally reside away from the minimal-diversity point, the benefits of diversity are apparently more obvious, and in fact, there is evidence that in such (non-minimal-diversity) environments, Becker's theory is obeyed more rigorously (e.g., Hellerstein 1998).

* Conclusions

6.1
We have implemented an agent-based simulation of the Categorization-Elaboration Model of the relationship between diversity and group performance. Our simulation consisted of a group of rational agents, which drew from distinct experience pools to solve a common prediction problem. Our simulations measured the agent coalition's performance on the prediction problem when the effects of elaboration and categorization/bias were considered. As predicted by van Knippenburg et al. (2004) we found a curvilinear relationship between performance and diversity (even in the absence of categorization effects), and with the inclusion of categorization effects, our simulation produced the predicted "U-shaped" curve.

6.2
Additionally, we found that the performance/diversity curve had a zone of unstable-equilibrium at the minimal-diversity point such that small increases to diversity starting from this minimal-diversity point had little effect on group performance. We pointed out how this would discourage 'test-the-waters'-type evaluations of the performance impacts of diversity, and drew a parallel with historical economic-based work which suggested that market-forces could directly encourage organizational diversity.

6.3
In order to keep our simulation reasonably simple, we chose here to only investigate the group performance of the agents from a strictly informational standpoint - no attempt was made to model the agents' internal mental states, etc. As a result, we had to phrase the effects of categorization/bias in terms of data-based effects (specifically, the tendency of an agent to adopt its own local predicted reward vector over that of the group's). However, the CEM also provides a framework for relating performance to group members' mental states (culture, expectations, background, etc.), mainly through relating these variables to the salience of various social categorizations. It would be interesting to perform a much larger simulation involving the belief states of our agents, and accurately model effects such as normative fit and cognitive accessibility (maybe assign the agents some initial levels of racist/xenophobic tendencies, and perhaps even observe how these tendencies vary with time) on the salience of various social categorizations and to examine the resulting impact on group performance. This present work certainly lays a foundation for a simulation of this nature, and we hope to pursue research along these lines in future works.

* Acknowledgements

This work was supported by a Fannie and John Hertz Foundation fellowship.

* References

ANCONA, D. G., & Caldwell, D. F. (1992). Demography and design: Predictors of new product team performance. Organization Science (3), 321-341.

BANTEL, K., & Jackson, S. (1989). Top management and innovations in banking: does the composition of the team make a difference? Strategic Management Journal (10) 107-124.

BECKER, G. S. (1968). Discrimination, Economic, in Sills, D.L. (ed.), International Encyclopedia of the Social Sciences, vol. 4, New York, Macmillan and Free Press, 208-210.

BECKER, Gary S. (1971). The Economics of Discrimination, Second Edition (Chicago: University of Chicago Press).

BREWER, M.B. (1979). In-group bias in the minimal inter-group situation: A cognitive-motivational analysis. Psychological Bulletin, 86, 307-324.

BRODBECK, F. (2003). Contradiction as an inhibitor and facilitator of group performance. Paper presented at the 11th European Congress of Work and Organizational Psychology, Libson, Portugal.

CANNON-BOWERS, J.A., & Salas, E. (2001). Reflections on shared cognition. Journal of Organizational Behavior (22), 195-202.

COX, T. H., Lobel, S. A., & McLeod, P. L. (1991). Effects of ethnic group cultural differences on cooperative and competitive behavior on a group task. Academy of Management Journal (34) 827-847.

DE DRUE, C. K., & Weingart, L. r. (2003). Task and relationship conflict, team performance, and team member satisfaction: a meta-analysis. Journal of Applied Psychology (88), 741-749.

DONOHUE, J. (2005). The Law and Economics of Antidiscrimination Law. Yale Law School John M. Olin Center for Studies in Law, Economics, and Public Policy Working Paper Series. Paper 290.

EARLEY, P. C., & Mosakowski, E. (2000). Creating hybrid teams cultures: An empirical test of transnational team functioning. Academy of Management Journal (43), 26-49.

FUCHS, Victor R. (1998). Women's Quest for Economic Equality (Cambridge, MA: Harvard University Press).

GONZALEZ-ROMA, V., West, M. A., Borrill, C.S. (2003). Demographic diversity and team innovation: Testing a curvilinear relationship model. Unplished manuscript, University of Valencia.

GUZZO, R. & Dickson, M. (1996). Teams in organizations: Recent research on performance and effectiveness. Annual Review of Psychology, 47, 307-338.

HELLERSTEIN, J.K., Neumark, D., Troske, K.R. (1998). Market Forces and Sex Discrimination, Labor and Demography 9807002, Economics Working Paper Archive at WUSTL.

HORNSEY, M. J., & Hogg, M. A. (2000). Assimilation and diversity: an integrative model of subgroup relations. Personality and Social Psychology Review (4) 447-472.

JACKSON, S. E. (1992). Team composition in organizational settings: Issues in managing an increasingly diverse workforce. In S. Worchel, W. Wood, & J.A. Simpson (Eds.), Group processes and productivity (pp. 136-180). Newbury Park, CA: Sage.

JEHN, K.A., Northcraft, G.B., & Neale, M.A. (1999). Why differences make a difference: A field study of diversity, conflict, and performance in workgroups. Administrative Science Quarterly, 44, 741-763.

MILLIKEN, F., & Martins, L. (1996). Searching for common threads: Understanding the multiple effects of diversity in organizational groups. Academy of Management Review, 21, 402-433.

MURNINGHAN, J. K., & Conlon, D. E. (1991). The dynamics of intense work groups: A study of British string quartets. Administrative Science Quarterly (36), 165-186.

OAKES, P. J., Haslam, S. A., & Turner, J. C. (1994). Stereotyping and social reality. Malden, MA: Blackwell.

O'NEILL, J. (1994). Discrimination and Income Differences. In Susan F. Feiner, ed. Race and Gender in the American Economy. (Englewood Cliffs, NJ: Prentice-Hall, Inc.), pp. 13-17.

O'REILY, C. A., Caldwell, D. F., & Barnett, W. P. (1989). Work group demography, social integration, and turnover. Administrative Science Quarterly (34), 21-37.

PELLED, L. H., Eisenhardt, K. M., & Xin, K. R. (1999). Exploring the black box: An analysis of work group diversity, conflict, and performance. Administrative Science Quarterly (44), 1-28.

POSNER, R.A. (1987). The Efficiency and the Efficacy of Title VII, University of Pennsylvania Law Review, (136) 513-521.

RIORDAN, C., & Shore, L. (1997). Demographic diversity and employee attitudes: Examination of relational demography within work units. Journal of Applied Psychology, 82, 342-358.

SIMONS, T., Pelled, L. H., & Smith, K. A. (1999). Making use of difference: Diversity, debate, and decision comprehensiveness in top management teams. Academy of Management Journal (42) 662-674.

TAJFEL, T., & Turner, J. (1986). The social identity of intergroup behavior. In W.A.S. Worchel (Ed.), Psychology and intergroup relations. Chicago: Nelson-Hall.

TRIANDIS, H.C., Kurowski, L. L., & Gelfand, M. J. (1994). Workplace diversity. In H.C. Triandis, M. P. Dunnette, & L. M. Hough (Eds.), Handbook of Industrial and Organizational Psychology (2nd ed., Vol. 4, pp. 769-827). Palo Alto, CA: Consulting Psychologists Press.

TSUI, A.S., Egan, T.D., & O'Reilly, C.A. (1992). Being different: Relational demography and organizational attachment. Administrative Science Quarterly, 37, 549-579.

TURNER, J.C., Hogg, M.A., Oakes, P.J., Rieicher, S.D., & Wetherell, M.S. (1987). Rediscovering the social group: A self-categorization theory. Oxford, United Kingdom: Blackwell.

VAN KNIPPENBERG, D., De Dreu, C., Homan, A.C. (2004). Work Group Diversity and Group Performance: an Integrative Model and Research Agenda. Journal of Applied Psychology, 89(6), 1008-1022.

WAGNER, W., Pfeffer, J., & O'Reilly, C. (1984). Organizational demography and turnover in top management groups. Administrative Science Quarterly (29), 74-92.

WILLIAMS, K.Y., & O'Reilly, C.A. (1998). Demography and diversity in organizations: A review of 40 years of research. Research in Organizational Behavior, 20, 77-140.

----

ButtonReturn to Contents of this issue

© Copyright Journal of Artificial Societies and Social Simulation, [2006]