
Petter Holme and Andreas Grönlund (2005)
Modelling the Dynamics of Youth Subcultures
Journal of Artificial Societies and Social Simulation
vol. 8, no. 3
<https://www.jasss.org/8/3/3.html>
For information about citing this article, click here
Received: 05-Feb-2005 Accepted: 25-Apr-2005 Published: 30-Jun-2005
 Abstract
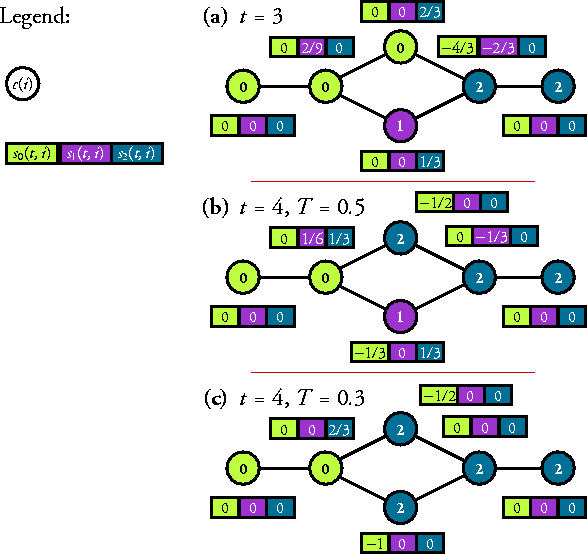
| sc(t,i)
= (k/ki) ni(c) [t(c)-t(ci)]/[t-t(ci)] , |
(1) |
BRAKE M (1985) Comparative Youth Culture: The Sociology of Youth Cultures and Youth Subcultures in America, Britain and Canada, London: Routledge & Kegan Paul.
BUCKLEY F and Harary F (1989) Distance in graphs, Redwood City, CA: Addison-Wesley.
CONGER J J (1973) Adolescence and Youth: Psychological development in a changing world, New York, NY: Harper & Row.
DAMRELL J (1978) Search for Identity: Youth, Religion and Culture, Beverly Hills, CA: Sage Publications.
DEGENNE A and Lebeaux M O (2005) The dynamics of personal networks at the time of entry into adult life, Social Networks, (to be published).
DODDS P S and Watts D J (2004) Universal behavior in a generalized model of contagion, Physical Review Letters, 92: 218701.
ERDŐS P and Rényi A (1959) On random graphs I, Publicationes Mathematicae Debrecen, 6: 290-297.
ERIKSON E H (1968) Identity: Youth and crisis, New York, NY: Norton.
GRÖNLUND A and Holme P (2004) Networking the seceder model: Group formation in social and economic systems, Physical Review E, 70: 036108.
HALL T and Jefferson T (eds.) (1979) Resistance through rituals, London: Hutchinson.
LILJEROS F (2001) The Complexity of Social Organizing, PhD thesis, Stockholm University, Stockholm, Sweden.
MCPHERSON J M (1983) An ecology of affiliation, American Sociological Review, 48: 519-532.
NEWMAN M E J (2003) Ego-centered networks and the ripple effect, Social Networks, 25(1): 83-95.
NEWMAN M E J (2004) Fast algorithm for detecting community structure in networks, Physical Review E, 69: 066133.
POLSKY N (1971) Hustlers, Beats and Others, Harmondsworth: Penguin.
RAPOPORT A (1957) Contribution to the theory of random and biased nets, Bulletin of Mathematical Biophysics, 19: 257-277.
RINEHART R E and Sydnor S (eds.) (2003) To the Extreme: Alternative Sports, Inside and Out, Albany, NY: State University of New York Press.
SCHELLING T C (1978) Micromotives and macrobehavior, New York, NY: W. W. Norton & Company.
SZNAJD-WERON K and Sznajd J (2000), Opinion evolution in closed community, International Journal of Modern Physics C, 11: 1157-1165.
THORNTON S (1995) Club Cultures: Music,
Media and Subcultural Capital, Cambridge: Polity Press.
UPAL M A (2005)
Simulating the emergence of new religious movements,
Journal of Artificial Societies and Social Simulation, 8(1).
WATTS D J (2002) A simple model of global cascades on random networks, Procedings of the National Academy of Sciences of the United States of America, 99: 5766-5771.
 Return to Contents of this issue
© Copyright Journal of Artificial Societies and Social Simulation, [2005]