©Copyright JASSS

JASSS logo ----

* Appendix I: Parameter estimation

This appendix is divided into two major groups of parameters: i) parameters directly and inversely estimated from data, and ii) parameters directly estimated and inversely estimated from assumptions. Most of the ranges have been found by performing Monte Carlo data sampling. One Monte Carlo sampling consisted of 36,000 model runs using the currently optimal guesses of the parameter ranges. The statistical parameters from each Monte Carlo data sampling were then compared with the available data or the assumptions presented in the Appendix. To improve the match between the input parameters and the statistical characteristics of the Monte Carlo data, additional data samplings with slightly different input parameters were performed again and again. Lacking an automatic parameter fitting procedure, corrections in the parameter ranges have been done manually (equivalent an inverse trial-and-error process). All the parameters were estimated running the model with intermediate degree of campaign resource accumulations (Ψ = 8, 16, or 32) that are considered to be closest to the real world practice (Finkel and Schrott 1995).

* Directly and inversely estimated parameters from data

A.1
Turn out On voting day, only the T percent of the citizens with strongest attitudes will participate in the simulated election. The turn out T is dependent on the average attitude strength αavg of the citizens. The boundary condition for the function T = f(αavg) are four estimated points. In the first row of table A1 the observed range of αavg is indicated after 36'000 model runs with all the other model parameters estimated before. Table A1:.

Table A1: Data points required for the functional relationship between turn out and average attitude strength

minavgmaxasymptotic behavior
αavg 00.150.4 1000 (extreme value)
T 0.65 0.810.95 1.00 (extreme value)

A.2
The value of 1000 is a hypothetical extreme which is never reached. The second row contains two educated guesses of the minimal (65%) and the maximal (95%) turn out that are expected for all the future General German Elections.

A.3
The average turn out of 81% is equivalent to the average turnout in the German General Elections between 1949 and 1998. The four estimated points describing a convex asymptotic trend are best fitted (r2=0.9998) with an exponential function (see eq. A1):

Eqn A1
(1)

A.4
"Speed" of memory decay There is only one study which is adequate for estimating the decay speed of political information perceived under low involvement and under non-laboratory settings. This study investigated the temporal change of the saliences of two unobtrusive issues (foreign policy in Iran and the Soviet Union) in relation to the temporal change of the intensity of coverage on each issue (Watt et al. 1993). The authors developed a simple exponential decay model based on a single forgetting parameter k that sufficiently matches the data.

Figure A1
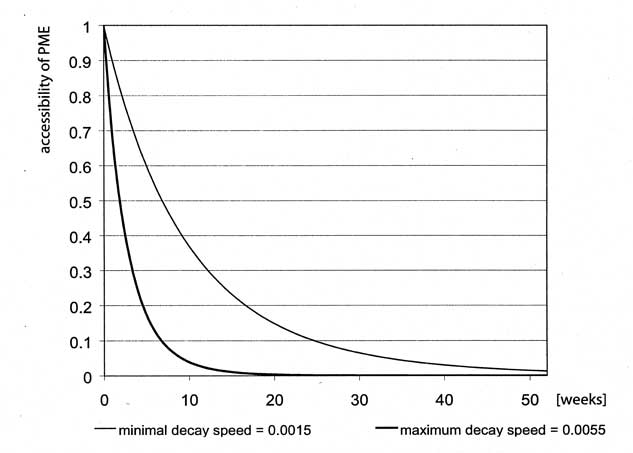
Figure A1. Remaining accessibility of a persuasive message extract (PME) after some weeks. The involvement at the moment of perception is set at 0.1 (very low)

A.5
They find k at a level of 0.05 (dimensionless scaling parameter) which is similar to former studies (Salwen 1988; Eaton 1989). We have reproduced this model with the slightly different power law of forgetting (match of r2=0.9981 between the two models) and get an equivalent decay speed parameter value of 0.0055 with the involvement Ic(tp,m) = 0.1 (very low) at the moment tp,m of perceiving a certain original persuasive message m (see figure A1). Due to the lack of similar non-laboratory studies in the political sciences, we had to estimate additional memory decay speeds using data from two studies in a marketing context. The data were collected in non-laboratory settings and the recipients were in the very low involved mind-set of watching TV ads. In the first study (Zielske and Henry 1980), subjects were asked to remember ads (free recall) that were broadcast on TV some weeks ago. In the second study, the effects of a cereal brand's weekly advertising schedule on advertising awareness was measured during 72 weeks (West and Harrison 1997). Again with Ic(tp,m) = 0.1, the estimation yielded comparable high decay speeds of 0.004266 for the West study and a relatively low value of 0.0015 for the Zielske study.

A.6
Sizes of Ego-Networks There are two studies on the frequency distribution of different sizes of political discussion networks. One of them was conducted in West Germany (Schenk 1995). In 1990, Schenk found an average size of 2.4 (N=899) in political discussion networks. The other study (Schmitt-Beck 2000) found an average network size of 1.9 (N=1335) in the same year and also in West Germany. Since the particular name generator applied in the Schmitt-Beck study tended to overlook spouses as important discussants, we build on the distribution of ego-network sizes found in the Schenk study where this problem did not arise.

A.7
Network heterogeneities The model distinguishes between partisans of party A, partisans of party B and apartisans. If citizens with |A0,c| < 0.2 after the distribution of initial attitudes (see citizen initialization in main text) are categorized as apartisans, approximately 28 citizens from the model electorate belong to this group. This number matches the percentage of apartisans found in empirical studies conducted in West Germany between 1990 and 1998 (Falter et al. 2000; Schmitt-Beck 2000). The remaining citizens are divided into 36 partisans of party A and 36 partisans of party B. Data on heterogeneities within networks of political discussants were taken from the Comparative National Elections Project (CNEP) data for West Germany in 1990 (Schmitt-Beck 2000). The 100 citizens are linked according to the heterogeneity reference table of a "naturally heterogeneous" network derived from data provided by Schmitt-Beck (Weigelt 2001) (see table A2). Starting from the CNEP data, a second reference table can be derived (Weigelt 2001) presenting the percentage of different linkage classes within the network (see table A3). At the beginning of each model run, the linkages of a random network are optimized until the network matches these numbers (Weigelt 2001). Data derived from CNEP (Schmitt-Beck 2000). ,

Table A2: The numbers in the cells denote the number of partisans A, partisans B, and apartisans with a particular composition of network neighbors in the simulated electorate of 100 citizens. Reading example: 16 partisans of party B have homogeneous and concordant discussant networks

party identification of the discussants within ego-networks
no discussantonly
partisans A
only
partisans B
only apartisansboth partisans A and B
partisan A317358
partisan B321669
apartisan344107


Table A3: Percentages of different linkage classes within the simulated citizen networks

partisan A - partisan Apartisan B - partisan Bpartisan A - partisan Bapartisan - partisan Aapartisan - partisan Bapartisan - apartisan
20%20%17%15%15%13%

A.8
Initial account accessibilities and the general need for confirmation The average percentage of converted citizens during the ongoing campaigns was found in two different panel studies to be around 10%. During the last six months before voting day, Finkel and Schrott (1995) discovered 11.4% of the electorate changing their vote intention in the context of the German General Election 1990. In the same year, another study (Schmitt-Beck and Schrott 1994) found 8.6% of the electorate switching their vote intention between the CDU/CSU/FDP and the SPD/Grüne (Lagerwechsel) in the period from October until voting day at 2nd December. Varying the maximum of the initial account accessibilities a0A,c and a0B,c between 0.0 and 9.0 and the general need for confirmation «c between 0.0 and 0.5, the average percentage of converted citizens was at 7.7% for the six month period of the first study and at 4.3% for the two month period of the second study. The percentages of converted citizens from the German General Election in 1990 are expected to be relatively high due to the special circumstances of the first elections after the unification of East and West Germany (Finkel and Schrott 1995). Therefore, for the estimation, we have chosen target values which are slightly below the empirical values.

A.9
Probability of beginning attitude exchange Two studies measured the percentage of persons in the electorate that report to have recently met somebody who tried to persuade them to vote for a certain party (Noelle-Neumann and Reitzle 1991; Noelle-Neumann 1999). The question was asked every week during the last two months before the voting days of the five German General Elections between 1983 and 1998 (see table A4). For the estimation of the probability of beginning an attitude exchange, we selected the averages of the percentages yielded at two months, one month, and one week before voting day.

Table A4: Average percentage of citizens who were recently the target of somebody trying to convince them to vote for a particular party (Noelle-Neumann et al. 1991; Noelle-Neumann 1999)

time before voting daymeansdevN
2 months 15.63.65
1 month16.42.95
1 week20.25.75

A.10
Defining "recently" as a time window of one month and varying the probability of beginning attitude exchange between 0.0125 and 0.0225, we found the percentage of citizens reporting persuasion attempts at 17.9% for two months, at 19.5% for 1 month, and at 21.5% for 1 week before voting day. These settings yielded an average accumulated number of deliberately initiated attitude exchanges at the plausible value of 2.5 per citizen over the simulated year before voting day.

A.11
Judgmental weights of different information sources Starting from data on the relative weights of different information sources during the revision of the attitude, several parameters can be estimated inversely (see table A5). As a measure for the relative weight of a particular source we use the explanatory power given by the measurements of the perception of that source (independent variable) for the prediction of the voting behavior (dependent variable). For the Logit Model applied in the analysis of the CNEP data, the explanatory power was captured by the corrected Pseudo-R2 index KPR2 (Andress, Hagenaars, and Kühnel 1997). Since the weights of the different sources are simply added in the formation of the judgmental responses, we have to use the KPR2 values yielded from putting each source as the only independent variable for predicting voting behavior.

Table A5: Relative explanatory power of information perceived from different sources for the prediction of the voting decision. Data from Schmitt-Beck (2000)

sourceKPR2relative response weightparameter inversely estimatedestimate
party identification0.4552%maximum of the initial account accessibilities a0A,c and a0B,c[0.0 .. 9.0]
interpersonal communication0.245 (for CDU/CSU and SPD citizens)28%the weight of interpersonal communication ...IPC[30.0 .. 40.0]
party advertising0.14 (interpolated)16%credibility of the strategists[0.06 .. 0.14]
mass media0.034 (for CDU/CSU and SPD citizens)4%relative "activity budget" YM of the mass media: percentage of the total activity budget of both parties[10 .. 15%]

A.12
The KPR2 for the strategist advertising was interpolated from values of interpersonal communication and mass media. If asked for the most important information sources during election campaigns, most of the citizens place the party advertising between interpersonal communication and the mass media (Schulz and Blumler 1994; Semetko and Schönbach 1994; Zeh and Hagen 1999). The resulting non-minimal response weight is consistent with the evidence from empirical studies that political campaigns significantly affect the citizen's votes (Finkel et al. 1995; Shaw and Roberts 2000). The assumption that the mass media are less effective in shaping citizen preference formation as interpersonal communication has been formulated in several studies before (Chaffee and Mutz 1988; Lenart 1994), but was never tested with satisfying methodological scrutiny.

* Directly and inversely parameters estimated from assumptions

A.13
Table A6 presents the assumptions about the lower and upper bounds of parameters where there is no data from the literature. The boundaries of these parameters had to be estimated directly or inversely from the estimation of another parameter.

Table A6: Directly and inversely estimated parameters from assumptions

Parameterestimate
Total spending of the of the parties A and B with YA = YB365.0
Level of the baseline advertising activity of the parties
Assumption
The true level of the baseline could not be estimated from empirical studies. Even the very detailed campaign reports of the German parties (e.g. CDU 1987) do not provide sufficient data.
0.5
Initial involvement of citizens
Assumption 1
The initial citizen involvements are normally distributed. Data: Aggregated ALLBUS dataset 1980-1998 (GESIS 1996).
Assumption 2
The initial citizen involvement varies between 0 for the least involved citizens and twice the population average for the most involved citizens. Ad hoc assumption, no data available.
Assumption 3
"What has happened three weeks ago, is practically forgotten"
One year before voting day, the average involvement of the citizens has to be so low that the accessibilities of PMEs with an age of three weeks falls beyond 0.5, i.e. they are only half as accessible as PMEs just perceived. Ad hoc assumption, no data available.

Using the data sampling from 36000 model runs with different memory decay speeds for each run (choosing randomly between 0.0015 and 0.0055 and attaching this value to all the citizens), the assumptions 1-3 are met if in each run the initial involvements of the citizens are normally distributed around a mean of 0.125 and with s2=0.054. The average accessibility of three week old PMEs is then 0.496 with s2=0.207.
normally distributed (μ = 0.125; s2=0.054)
Threshold of accessibility βatt at the inflexion point of the involvement growth curve (see figure 6 in the main text).
Assumption
"What has happened one week ago is just like yesterday":
The citizen involvements at voting day has to grow from the initial involvements so that the accessibilities of PMEs with an age of one week or less are above 0.90, i.e. they are approximately as accessible in memory as PMEs perceived just one day ago. Ad hoc assumption, no data available.

This assumption is met if the accessibity threshold is varied between 60.0 and 70.0. Sampling the data from 36'000 runs (varying the memory decay speed between 0.0015 and 0.0055), these thresholds yield average citizen involvements at voting day of 0.375 (s2=0.213). These increased involvements cause the slower target rate of accessibility decay postulated in assumption 1. After 7 days, the average accessibility of a PME is 0.901 with s2=0.146).
[60.0 .. 70.0]
Reference credibility for the mass media (given a priori just as a reference).
Assumption
It is assumed to be between the credibility of the parties (maximally 0.14, see above) and the credibility of a maximally involved communication partner (maximally 1.0).
0.5
Qualitative differentiation between extremely smooth (max) and extremely sharp (min) threshold of attention (see figure 6 in the main text)
Assumption
Complete uncertainty about the "true" threshold. The range of this parameter has therefore been choosen very broad.
[-8.0 .. 0.0]


* References

ANDRESS,H.-J., Hagenaars, J., and Kühnel, S. (1997). Analyse von Tabellen und kategorialen Daten. Log-lineare Modelle, latente Klassenanalyse, logistische Regression und GSK-Ansatz. Berlin: Springer.

CDU. (1987). Wahlkampfbericht der Bundesgeschäftsstelle zum Bundestagswahlkampf 1986/87.: Christlich Demokratische Union (CDU) Deutschland.

CHAFFEE, S. H., and Mutz, D. C. (1988). Comparing Mediated and Interpersonal Communication Data. In R. Hawkins and J. Wiemann and S. Pingree (Eds.), Advancing Communication Science: Merging Mass and Interpersonal Processes (pp. 19-43). Newbury Park: Sage.

EATON, H. (1989). Agenda-setting with biweekly data on content of three national media. Journalism Quarterly, 66, 942-949.

FALTER, J. W., Schoen, H., and Caballero, C. (2000). Dreissig Jahre danach: Zur Validierung des Konzepts 'Parteiindentifikation' in der Bundesrepublik. In M. Klein and W. Jagodzinski and E. Mochmann and D. Ohr (Eds.), 50 Jahre Empirische Wahlforschung in Deutschland. Entwicklung, Befunde, Perspektiven, Daten. Wiesbaden: Westdeutscher Verlag.

FINKEL, S. E., and Schrott, P. (1995). Campaign Effects on Voter Choice in the 1990 German Bundestag Elections. British Journal of Political Science, 25(July), 349-377.

LENART, S. (1994). Shaping Political Attitudes. The Impact of Interpersonal Communication and Mass Media. Thousand Oaks: Sage.

NOELLE-NEUMANN, E. (1999). Die Wiederentdeckung der Meinungsführer und die Wirkung der persönlichen Kommunikation im Wahlkampf. In E. Noelle-Neumann and H. M. Kepplinger and W. Donsbach (Eds.), Kampa. Meinungsklima und Medienwirkung im Bundestagswahlkampf 1998 (pp. 181-214). Alber, S.: Freiburg, München.

NOELLE-NEUMANN, E., and Reitzle, M. (1991). Was man aus der Budestagswahl von 1987 lernen kann. In H.-J. Veen and E. Noelle-Neumann (Eds.), Wählerverhalten im Wandel (Vol. 16). Paderborn (etc.): Ferdinand Schöningh.

SCHENK, M. (1995). Soziale Netzwerke und Massenmedien. Tübingen: Mohr.

SCHMITT-BECK, R. (2000). Politische Kommunikation und Wählerverhalten. Ein internationaler Vergleich. Wiesbaden: Westdeutscher Verlag.

SCHMITT-BECK, R., and Schrott, P. (1994). Dealignment durch Massenmedien? Zur These der Abschwächung von Parteibindungen als Folge der Medienexpansion. In H.-D. Klingemann and M. Kaase (Eds.), Wahlen und Wähler - Analysen aus Anlaß der Bundestagswahl 1990 (pp. 543-572). Opladen: Westdeutscher Verlag.

SCHULZ, W., and Blumler, J. G. (1994). Die Bedeutung von Kampagnen für das Europa-Engagement der Bürger. Eine Mehr-Ebenen-Analyse. In O. Niedermayer and H. Schmitt (Eds.), Wahlen und europäische Einigung (pp. 199-223). Opladen: Westdeutscher Verlag.

SEMETKO, H., and Schönbach, K. (1994). Germany's 'unity election'. Voters and the media. Cresskill: Hampton Press.

SHAW, D. R., and Roberts, B. E. (2000). Campaign events, the media and the prospects of victory: The 1992 and 1996 US presidential elections. British Journal of Political Science, 30(April), 259-289.

WATT, J. H., Mazza, M., and Snyder, L. (1993). Agenda-Setting Effects of Television News Coverage and the Effects Decay Curve. Communications Research, 20(3), 408-435.

WEST, M., and Harrison, J. (1997). Bayesian Forecasting and Dynamic Models. New York (etc.): Springer.

ZEH, R., and Hagen, L., M. (1999). "Nun zum Sport..." und andere kurzfristige Effekte von Fernsehnachrichten auf die Wahlabsicht im Bundestagswahlkampf 1998. In C. Holtz-Bacha (Ed.), Wahlkampf in den Medien - Wahlkampf mit den Medien (pp. 188-217). Opladen: Westdeutscher Verlag.

ZIELSKE, H. A., and Henry, W. A. (1980). Remembering and Forgetting Television Ads. Journal of Advertising Research, 20(2), 7-13.

----

ButtonReturn to Contents of this issue

© Copyright Journal of Artificial Societies and Social Simulation, [2004]