© Copyright JASSS

  JASSS logo ----

Javier Pajares, Adolfo López and Cesáreo Hernández (2003)

Industry as an Organisation of Agents: Innovation and R&D Management

Journal of Artificial Societies and Social Simulation vol. 6, no. 2
<https://www.jasss.org/6/2/7.html>

To cite articles published in the Journal of Artificial Societies and Social Simulation, please reference the above information and include paragraph numbers if necessary

Received: 30-Sep-2002      Accepted: 16-Feb-2003      Published: 31-Mar-2003


* Abstract

We present a model of the dynamics of the industry for innovation and R&D management. It is a novel view of the evolution of industry, both in theoretical and computational terms. Industries are seen as organisations of firms and consumers, and the aggregated behaviour is the consequence of the decisions taken by the individual firms. A multi-agent system is designed and programmed to model the industry. The agents are the individual firms and the consumers are represented by the group demands for two products: a new and an old one. The strategic decisions of the firms are the patterns of investment in process and product innovation, and whether to stay or to leave the industry. Agents information and incentives in terms of assets returns are specified. Co-ordination is embedded into the model. We include in the model the relevant ideas from evolutionary economics in the product life cycle context. The model is used to explain and to reproduce the main observed facts in life cycle dynamics, in terms of the rise and fall of incumbent firms, concentration ratios, R&D expenditure and path-dependence in the evolution of the industry. Thus showing the utility of MAS in industrial evolutionary modeling and policy assessment.

Keywords:
Cognitive Evolutionary Models; Computational Organization; Industrial Dynamics; Multi-agent Systems

* Introduction

1.1
Economists don't know very much about the evolutionary behaviour of industrial sectors: entry and exit rates, concentration, innovation and path dependent dynamics. Industrial Economics researchers are involved in casual or empirical analysis of ex-post relationships among those variables. Agent-based modelling is well suited to provide a different and novel way of research in firm behaviour and Industrial Dynamics, which is realistic and rigorous.

Our aim: featuring the actual process of innovation.

1.2
We are mainly interested in setting up new guides for R&D management and industrial policy assessment. To this aim, we want to generate an organisation of agents, a multi-agent system of firms and consumers that reproduce the observed patterns of life cycle dynamics. We provide a better understanding of the path-dependence phenomena and the micro-processes that drive the aggregate behaviour of industries, that is, the relations between firm decisions and aggregate behaviour. In particular, we want to have a better knowledge of the following facts:
  • Why do some incumbent firms survive and gain competitive advantage while the older ones are forced to leave?. Why do some companies improve their market share, and other firms in the industry can not reduce the gap although they spend a lot of money in R&D?.
  • Which are, if any, the firms that lead the industry as an organisation?.
  • How does the industry (the organisation) affect the decisions of the individual firms, i.e. industry externalities?.
  • How can the patterns of evolution of R&D expenditure be explained?, Why do firms change their decisions in R&D investment?
  • Why sometimes, early innovators can not improve their market position whereas fast seconds or even slow thirds firms beat the market?.
  • Differences between group and individual perceived dynamics are observed in any industry of partially differentiated products. How do individual firms learn from this divergence the appropriate mix of R&D investment?

Our focus: Industry as an organization of agents.

1.3
Different approaches have been used to explain the process of innovation and the evolution of innovative industries. Beyond neo-classical approaches, the view by Nelson and Winter (1982) takes into account the main evolutionary economic principles. Firms are seen as bounded rational decision makers, which learn from the environment and adapt to changing market conditions. The evolution of the industry can be explained by means of the decisions taken by firms (bottom-up approach).

1.4
On the other hand, empirical patterns of the evolution of innovative industries have been widely studied in the field. Although it is very difficult to find general patterns common to all the industries, some works adopt the product life cycle approach, which recognises the existence of some stylised facts about the patterns of entry, exit and R&D expenditure, as summarised by Klepper (1996).

1.5
In this paper we use multi-agent systems to build a model of industry evolution, grounded both in the product life cycle approach and in the main evolutionary contributions by Nelson and Winter (1982). In this way, we put our work within well defined economic hypotheses, so that we can compare our results with previous works in the industrial economics literature. However, within those limits, we have tried to design the model as realistic as possible, with a reasonable trade off between previous evolutionary industry models and complexity.

1.6
Anyway, our main purpose in this paper is to check if it is possible, within an evolutionary multi-agent framework and a product life cycle focus, to reproduce the aggregated industry behaviour by means of the behaviours of individual firms.

1.7
If as it happens, our model is capable to generate the main signatures of the product life cycle dynamics, then a broad and promising agenda for further research is possible. We could then consider more products in the market, the possibility of mergers and acquisitions, inter-firm collaboration, joint ventures, clusters and industrial districts and some recent empirical facts from the economic geography literature.

1.8
In our approach, industry should be seen as an organization of social agents. Thus the description and programming of their members should be made explicit. This includes agents information, rewards, and coordination. The real agents, not dummy devices as the supply of the industry, with perhaps just predictive capacities.

1.9
This paper distinguishes itself from the previous literature in the following way. We want to capture the emergence of industrial dynamics as a self-organized institution. Industry is not represented as the stage where mathematical entities (aggregated supplies and demands) match, which might be enough for predictive purposes. We focus on industries emerging as a result of interacting agents (firms) which are themselves actively taking those decisions that are the most advantageous ones.

1.10
Thus we look for industry behaviour to emerge from individual firms interactions among them through a very special agent: the industry (as "the organization") agent.

1.11
Firms are cognitive agents learning from others and from the industry as a whole, with production rules. Each firm has its own rule bases and databases, where all its knowledge at the time, can be stored (procedural knowledge). The degree of belief in every possible incumbent rule is updated, through an endorsement process, from firms performance in relation to the changing conditions of the industry.

1.12
In order to isolate the technological decisions, a strong assumption is made. The firms equity equals total assets, so that there is no financial debt. When designing the model, we do not try to build any kind of theory about aggregated industry behaviour, but we want to show how empirical patterns can emerge from decisions taken by the firms. For this reason, we have tried to keep the model as simple as possible, although realistic enough for our purposes.

1.13
This paper has four main sections. Section 2 summarises the main features of the model, including environmental constraints, products and producers. Agents in the model, their decisions and capabilities are identified. One important concept in our model is the innovation process, and the way in which new technologies emerge in the market, depending on the effort in R&D shown by both the whole industry and the individual firms. All these issues are described in section 3, and some of the rules used are shown in computer language and in pseudo-code. In section 4, we explain the main results obtained with the model. We end with the conclusions of the paper.

* The Model.

2.1
We model an industrial sector in which companies are the main actors and they learn from the industrial sector and competitors, in a cognitive way. When designing the model, we are not thinking of any particular industry, because our purpose is to show how the general industry stylised facts emerge in a multi-agent framework, where firms are the main agents.

The agents: firms, consumers and the industry.

2.2
Firms have a set of resources and capabilities. The most relevant are: total equity, assets, maximum production capacity and trends in research and development (R&D) investments. Firms have an economic target: return on assets, which is closely related to the dividends policy.

2.3
In every period two products are traded in the market. One of them, OldGood, is related to an obsolete technology. The other, NewGood is more recent and technologically superior. When the firms' innovation projects succeed, a newer product will be demanded and the most obsolete product will disappear. In this case, the previous recent product becomes the old one. Products and technologies are related. Each product is manufactured with a different technology. Alternatively, we can think that new products are the most technologically advanced.

2.4
Companies try to produce as much as they can sell in the market. It depends on their manufacturing costs, whenever they do not exceed their maximum capacity. After paying dividends to shareholders, firms can invest in innovation (product R&D) and/or process R&D. Success in innovation leads to manufacturing updates in the whole sector, whereas success in process R&D allows companies to improve their manufacturing methods, and to reduce cost over time.

2.5
In figure 1, we show the model we study in this paper, including the demand for both goods (Demand-1 and Demand-2). Notwithstanding, we focus in the organisational evolution of the industrial structure, that appears on the left hand side of the picture.

Fig 1
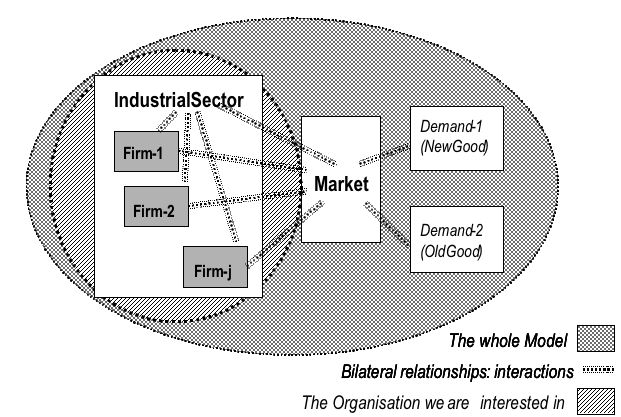
Figure 1. Model structure and agents

2.6
Agents in our model are: the firms, which take decisions and learn over time; the industrial sector, where they develop their activity; demand-1 and demand-2, representing the demands for the old and new good. Demands are modelled by means of a linear demand; as time goes on, this line becomes more elastic and it moves to the right. We summarise all the aggregated consumer behaviour with these agents. Segmenting the market in two demands will allow us to study, without loss of generality, the different patterns of diffusion of new products in the market.

2.7
Another important agent is the market, where firms and consumers trade both goods. In the model, new firms can arrive to the industry, while other firms leave. This fact is intended to introduce more realism in simulating different scenarios.

2.8
We remark that the "industrial sector" agent does not act as any kind of exogenous environment, but it is a consequence of the aggregated decisions taken by all the firms that stay in the industry. In fact, industrial economics fails to explain industrial dynamics because it does not make endogenous the social learning, which should be embedded in the model. Another way to express this is to say that the industrial sector acts as a general container, and the firms are sub-agents living in this container. Of course, at any period of time, individual firms do not have all the knowledge stored in the general container, so they take their decisions using only its own bounded (and sometimes imperfect) information.

2.9
In agent based modelling, agents are only the means, not the goal. Therefore, the starting point to explain every model should be the relationships among agents: information and implicit co-ordination. In Table 1 we have identified these interactions.

Table 1
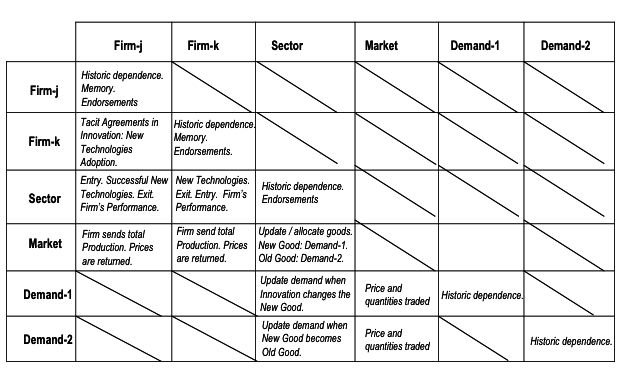
Table 1. Interactions among agents in the model

Firm strategies

2.10
Every firm has a memory to remember the past decisions and the achieved results. That knowledge is used to endorse the successful decisions and the errors in the firm's life. Moreover, they have an imperfect knowledge of some variables related to the industry performance that is also endorsed to learn the environment evolution. Companies, through these mechanics, have a learning process to change and improve their decisions.

2.11
Firms are the main actors in the model. They face both operational and strategic decisions. In the first case, they have to decide how much to produce for the new and the old good, with the given constraint of maximum production capacity. For strategic monitoring, they use as performance variables: net profits, growth, return on equity, market share and technological success.

2.12
Strategic decisions affect innovation and long term policies:
  • Entry: It depends on the firm having a necessary equity to access to the production technology and on how attractive the industry is in terms of return on equity (ROE).
  • Goods portfolio: Firms have to decide if they offer one or two goods, and how much to produce.
  • R&D policy: Firms have to manage their own investment portfolio: Process R&D, Innovation, and Capacity Growth. The budget can be elaborated in the way the firms decide, although firms know that success is related to allocated financial resources.
  • Increase or decrease the maximum production capacity: Firms distribute the dividend rewards to shareholders. The retained financial resources not intended for R&D or innovation investment are allocated to finance the firm's growth.
  • Exit the market: When firms can't get the profitability goals, and they can't improve their own positions, they leave the industry.

2.13
The new technologies are developed by the firms that have success in product R&D. In order to model how new technologies appear in the market, we use a non deterministic competition among them, so that the "winning" technology depends not only on the R&D investment of individual firms, but on the total industry expenditure as well, which is endogenous to the model but exogenous to each firm. In this way, the model includes the knowledge spillovers as industry externalities. In the next section, we summarise the whole process and we explain how the companies adapt their decisions over time.

* Investment Decisions and the Innovation Process

Technology investment

3.1
In each sector, due to the total industry R&D expenditure and to the interrelations with other sectors, there is always a portfolio of innovation projects that can be developed by firms. We have named these projects Technology and each one has a numerical code. The technical features of these projects depend on the state of the science and the technology relevant to the sector. But, anyway, two conditions have to be satisfied for a project to be successful and widely accepted by the industry. First, the firm must invest sufficient money to be able to develop it. Secondly, industry will only accept projects with enough scientific endorsement. In figure 2, we represent the whole process that leads to successful innovations.

Fig 2
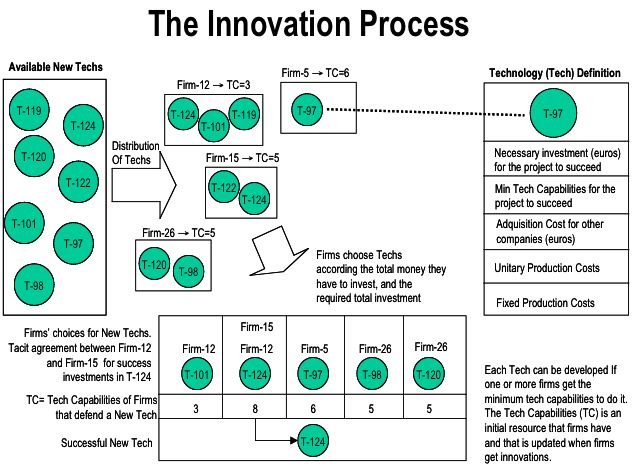
Figure 2. Representation of the process that leads to successful innovation

3.2
Firms choose along a set of several available technological projects. The more money it is invested in R&D, the more number of technologies chosen. Then, each firm arranges all these technologies according to competitive measures: the unitary production costs, and the purchasing cost for competitors, etc. Beginning with the highest rated technology, firms try to develop the highest number of technological projects they can, whenever they do not exceed its innovation budget. Firms can tacitly collude to develop the same technology.

Successful technologies and the innovation process

3.3
Every firm has its own technical and scientific capabilities (TC) to develop the innovations. When firms succeed in innovations, TC increases, and it decreases otherwise. To be accepted in the industry, every technological project has been endowed with a minimum TC that the involved firms have to reach. The project receives as total TC the sum of the TC of the firms that have chosen that innovation project. This means that innovations that could not be afforded by one company alone can be feasible if they are developed by several companies. Finally, if there is more than one technology that satisfies this acceptation constraint, the successful one is randomly selected.

3.4
This process is close to reality. The succeeding technology is not necessarily the best one. Perhaps there are not innovation projects that could reach the minimum TC level. This means that no innovation will emerge in the market in the next period, although firms have invested huge quantities of money in product R&D. When some technologies have been developed for different firms, only one of them becomes successful in the industry.

3.5
To formalise the models in a computer language, we use SDML (Strictly Declarative Modelling Language), a multi-agent language developed, for economic and social simulation purposes, at the Centre for Policy Modelling in the University of Manchester. The main features of SDML can be found in Edmonds et al (1996) and Moss et al. (1998). It is a rule based and strictly declarative multi-agent language.

3.6
We present in Table 2 the rule: "successful New Technology". This rule is allocated in the rulebases of the industrial sector agent. In the antecedents, we model the communication "firm-sector" with the predicate: at ?firm (TechSelection ?list). In TechSelection, the firms have the list of technological projects that they have developed. The industrial sector evaluates for every potential technology if it is in that list. In this case, the potential technology receives the necessary economic and technical resources from firms. As a result, a new or some technologies could emerge in the market. We have imposed that only one can be the successful. So if there are some technological projects that can be broadly accepted, the industry randomly selects one of them (randomChoice ?choice ?it [year newTechnology] includes ?successful ?it\).

table 2
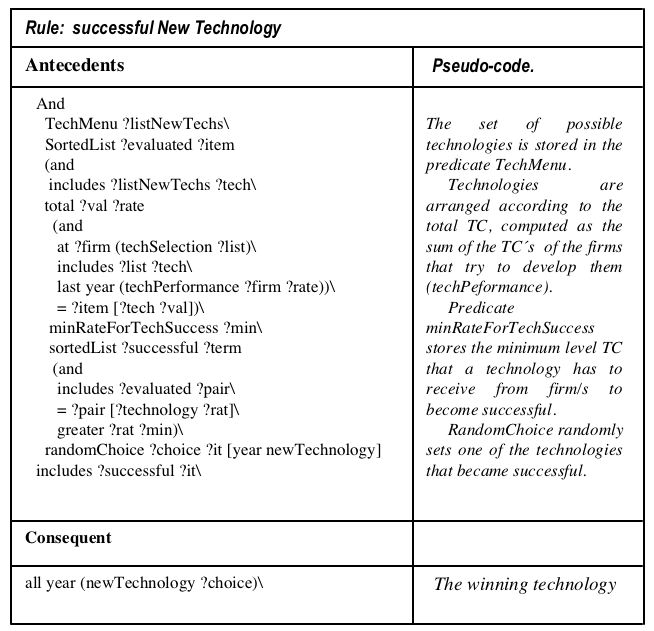
Table 2. This rule determines which technology will be the successful one

3.7
Companies that have not developed the "winning" technology, have to buy it if they want to manufacture the new good, although they may have invested a huge quantity of money in product R&D.

3.8
As we have seen, the technology emergence process depends on both, the individual and the aggregate R&D expenditure. Therefore, firm actions are the main force that drives industry evolution.

Learning and adaptation.

3.9
Firms learn how to adapt their decisions with the information they receive from de environment and from their past performance. To this aim, some models in the evolutionary literature include ad hoc learning, usually by means of rules of thumb that reproduce entrepreneurial behaviour; other, try to make endogenous the learning process. Thus, Kawasnicki (1996) and Yildizoglu (1999) among others, use genetic algorithms. Oltra and Yildizoglu (1998) use neural networks. And Dosi et al. (1999) introduce genetic programming. The question is: Can we capture the actual process of learning, according to the "nature of things"?.

3.10
We model how firms learn and change their decisions over time by means of the endorsement schemes proposed by Cohen (1985) This methodology has been successfully used by Moss (1995 and 1998), for economic and social modelling and takes into account some ideas from cognitive science. An endorsement is a data structure that summarises the reasons to believe or not in the propositions it is related to. Thus, endorsements give us a measure of the degree of confidence we have about the certainty of a proposition.

3.11
Of course, not all the reasons to believe in something have the same weight in the final certainty about the proposition, so in an endorsement scheme, a hierarchy of classes has to be defined, so that, endorsements in the same class have the same degree of certainty. Furthermore, a scheme of weights must be established, in order to asses the number of lower class endorsement that are equivalent to one endorsement of a higher class. Finally, a measure of the belief is built, based on the total endorsement, which is computed considering all the weights of all the classes associated with the propositions that are true.

3.12
The firms in our model use endorsements to determine how good R&D strategies are and to form expectations about their long-term feasibility. In Table 3 we show the endorsement scheme we have used in the model, as well as the weight of each of the individual endorsement.

table 3
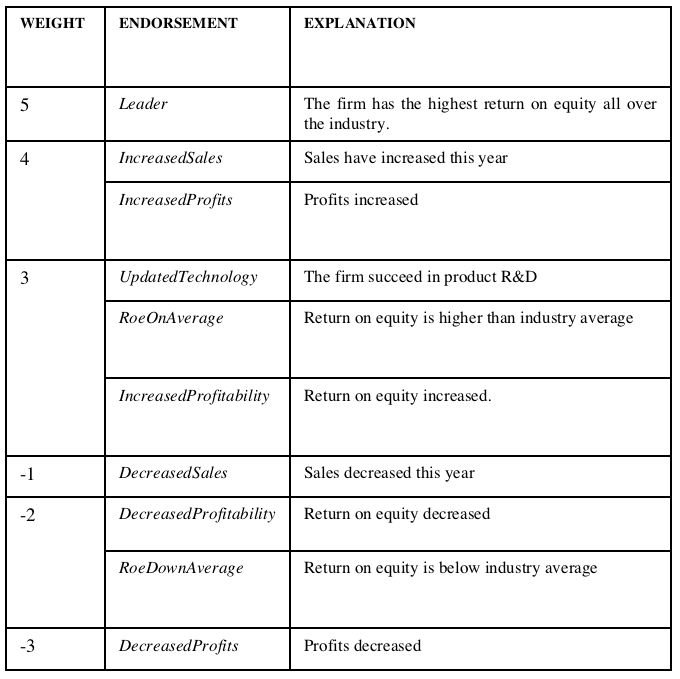
Table 3. Endorsement scheme

3.13
In order to choose one strategy, companies not only consider their past experiences but also the actions taken by the competitor that they consider to be a leader. How does a firm know which company is the leader?. In every period each firm looks at the behaviour of other companies, and forms its own endorsements about the performance of its competitors. The competitor with the highest endorsement is considered as the leader.

3.14
Alternatively, if a firm does not agree with any of the previous strategies, it can also develop new strategies (innovate). In this way, we include in the model different kinds of learning: exploration, exploitation and imitation.

3.15
The decision to leave the market depends not only on present performance, but on the feasibility endorsement level as well. In Table 4, we show the main rule that implements the decision to exit. If the return on equity is below a target level and, at the same time, feasibility is now less endorsed than the last period feasibility, then the firm leaves the market.

table 4
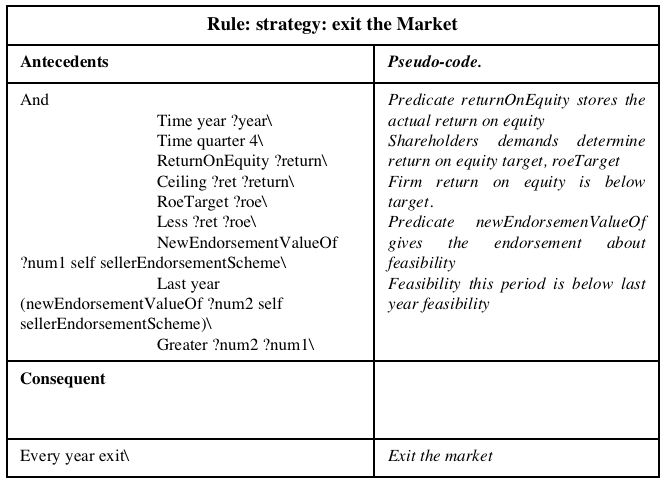
Table 4. Rule that implements the decision to leave the market

3.16
The endorsement schemes proposed by Cohen are grounded on cognitive theories and, in our opinion, they seem appropriate for a first approach to model bounded rational learning and satisfying behaviour. Of course, more complex methodologies should be developed to include more complex human learning, the emergence of firm competences, capabilities and human skills.

3.17
However, at this first stage of our research, we have chosen Cohen endorsements in order to get a trade off between simplicity and cognitive science rigour.

* Model Validation: Innovation as the Driving Force of Industry Evolution

4.1
What is the process that underlies the dynamics of intra-industry growth and decline?. Greenfield entry and closedown exit changes the firm population in the most obvious way. Firm turnover transfers resources from one group to another. The emergence of new firms causes some of them to exit and others to decline. But the amount of market share changes is not entirely explained by the rate of entry and exit. These led recently to look for explanations of industry dynamics in terms of investments in process and product R&D.

4.2
A lot of empirical work has been done in order to discover the patterns of the evolution of the industries. In this paper, we take into account the industry life cycle approach, grounded on the works by Abernathy and Utterback (1978), Utterback and Abernathy (1975), Gort and Klepper (1982), Klepper and Grady (1990), Utterback and Suarez (1993) De Bresson and Townsed (1981) or Klepper and Simons (1993), among others. The main regularities observed are summarised in Klepper (1996), who also proposes an evolutionary model to explain them.

4.3
Some of the stylised facts affect the patterns of entry and exit of new firms in the industry, while others involve market shares and the evolution and kind of R&D efforts. When industries are young, there is a lot of entry, and as there is not a standard product, firms usually offer different versions of the same product. For this reason, firms concentrate their R&D budgets in product innovation, so the rate of product innovation in the industry is high, and market shares change quickly.

4.4
But after the first stages of the industry, a standard product is accepted by both producers and consumers. Firms concentrate their efforts in the improvement of their production systems in order to reduce unitary costs. As a consequence, process R&D expenditures are increased with respect to product R&D. Higher levels of investment are needed for the mass production systems (capital intensive methods of production), entry slows down. There is a shakeout in the number of producers as the minimum efficient size increases; market shares stabilize. In figure 3, we have summarised graphically the main accepted regularities.

fig 3
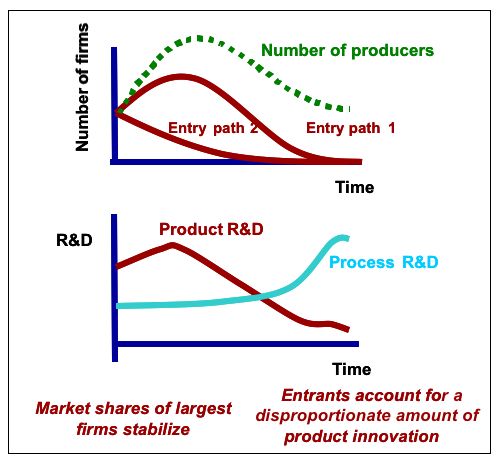
Figure 3. Stylised facts in industry life cycle dynamics

4.5
Of course, not all the industries follow exactly those patterns of evolution; moreover, there are many sceptics about it, both in terms of its logic and universality ( Klepper, 1996). But the industry life cycle approach has become popular in several disciplines, including technology management and marketing.

4.6
Our model was designed under the conjecture that innovation was the driving force of industry evolution. Is our model consistent with this conjecture?. Is it capable of reproducing the main accepted empirical evidence in the life cycle dynamics. The answer is: yes, it is! And here we report some selected results.

1st Scenario

4.7
Product innovation is not allowed, as in the works by Nelson and Winter (1982), where innovations lead to higher productivity or lower costs.
Firm population and concentration ratios

4.8
Four runs (s1, s2, s3, and s4) of the evolution of firm population are shown in figure 4. Concentration ratios, Herfindahl equivalent numbers for the same four simulations, are shown in figure 5. As it could be expected, the industry evolves to higher concentration ratios and a stable number of firms, similar to the evolution shown in most of the models designed on main Nelson and Winter ideas.

fig 4
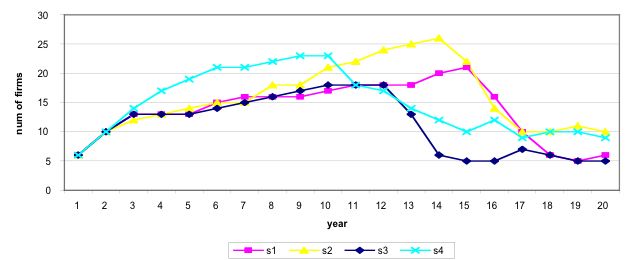
Figure 4. 1st Scenario. Evolution of the number of firms in the industry

fig 5
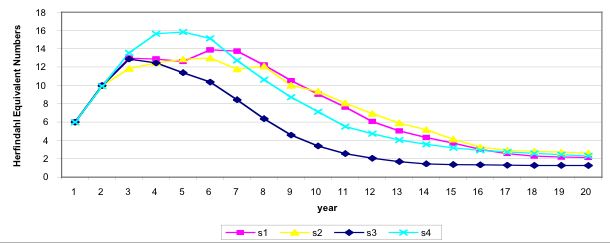
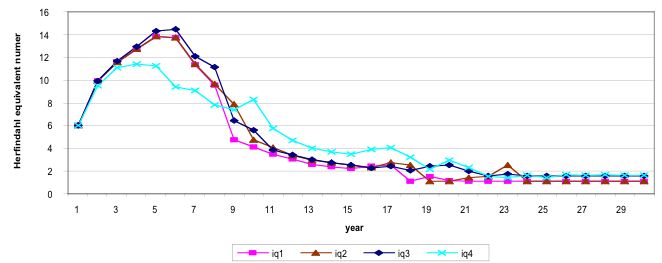
Figure 5. 1st Scenario. Herfindahl equivalent numbers. Lower numbers imply higher concentration levels

Market share evolution

4.9
Market shares evolution for the largest firms is shown in figure 6, for one of the previous simulations (s4). Markets shares tend to a stable rate for each of the firms in the long run. Early innovators (success in process R&D) were able to reduce their costs and, consequently to increase their market shares. Thus early innovators, keep their relative advantage over the competitors, and these can not reduce the gap, although most of them invested strongly and had success in R&D. For instance, in figure 6, we can see that at the first stages of the industry, firms 5, 6 and 9 enjoyed similar market shares, but in year 6, firm 9 succeeded in process R&D and increased its market share. Although during the next periods, firm 6 spent more money and succeeded as well in R&D, it could not reduce the gap. This gap became higher as firm 9 continued to improve its costs by means of R&D success. Thus, at the end of the simulation, firm 9 was the leader, with a market share over 80 %.

fig 6
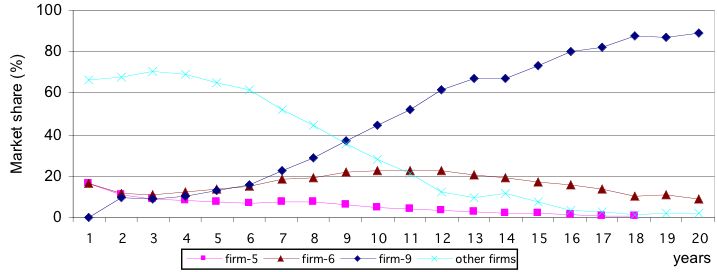
Figure 6. 1st Scenario. Market share evolution for major companies

4.10
This means that our model allows the emergence of path-dependence: the time when innovations (sometimes by luck) takes place matters, changing the future evolution of the industry.

2nd Scenario

4.11
Investment in product innovation. In this second setting we allowed for a large proportion of product innovations to be held during the first ten periods (years) of the simulations, as it is suggested to happen in the product life cycle literature.
Firm population and concentration ratios

4.12
Four runs (pd1, pd2, pd3 and pd4) of the rates of concentration are shown in figure 7. Industry becomes more concentrated as time goes by. However at the first stages of the industry life, the concentration levels are more volatile than under process innovation. The flow of incumbent and leaving firms increased with intense product innovation. More firms will leave the industry. But because the differentiated new products allow for greater market returns, thus making the industry more attractive, more greenfield entry will take place.

fig 7
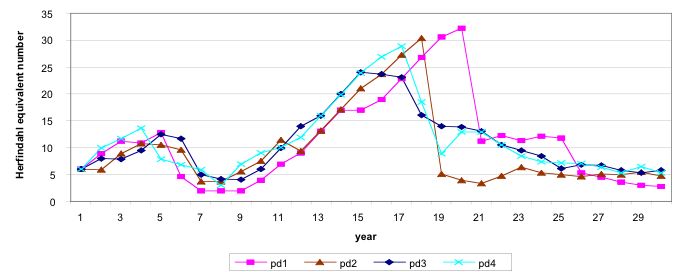
Figure 7. 2nd Scenario. Herfindahl equivalent number

Market share dynamics

4.13
The evolution of market shares in figure 8 shows that again early successful innovators can gain competitive advantage over their competitors. The gap is maintained, and market shares reach stable levels in the long run. For simulation pd4 in figure 8, we can see that the innovative firm 2 (success in product R&D) became the leader during the first stages of the industry. But later on (around period 10), other firms entered the market with the new technology. Among them, firm 32 succeeded in process R&D and could improve its position against firm 2. Again path-dependence emerges in the model. Furthermore, as it happens in real industries, a fast second or a slow third can beat the early innovator, if financial resources, knowledge and technology are good enough to reduce unitary costs with production technologies.

fig 8
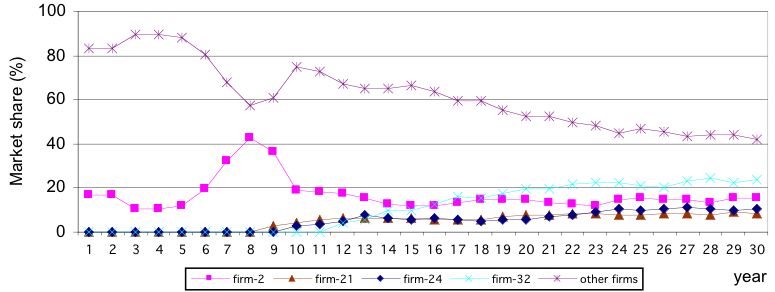
Figure 8. 2nd Scenario. Market shares

R&D patterns

4.14
In figure 9, we show the results of four runs of the evolution of total product R&D investment. Firms change their decisions over time in order to adapt themselves to their environment, so the companies with the fittest decisions will grow and stay over time. In the early stages of the product life cycle, the companies which spend more money in product R&D have more probabilities to succeed and reach competitive advantages. In other words, at the early stages of the industry, the firms learn that competitive advantages come from product R&D success, so the aggregated investment levels quickly increase and reach a maximum. Later on, the product becomes mature, and investments are shifted to process R&D, as indicated in figure 10.

fig 9
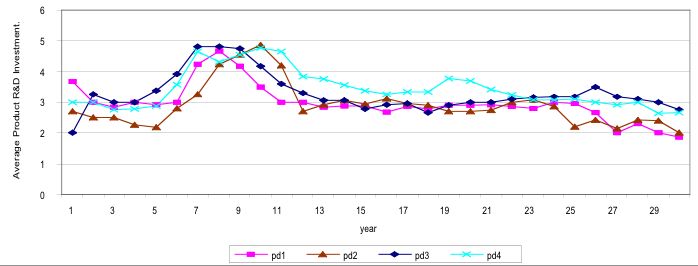
Figure 9. 2nd Scenario. Industry average product R&D expenditure reaches a maximun as firm learn

fig 10
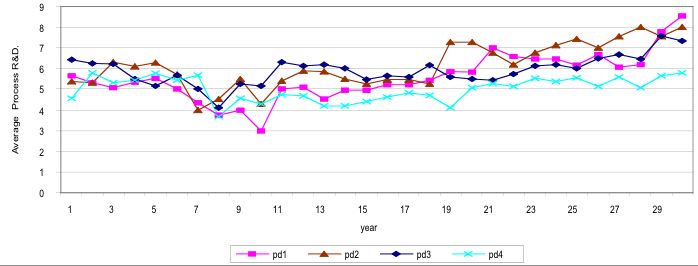
Figure 10. 2nd. Scenario. Industry average process R&D investmen

3rd Scenario

4.15
Product innovation takes place in a late stage of the industry life cycle.

4.16
To enhance the fact that the dynamics of the industry is time dependent, as it follows from previous comments, we simulated the effect of product innovation taking place in a late stage of the cycle. In figure 11, one can see that the concentration levels do not change much, after product innovation. Thus the timing of product innovation has the strongest influence in the evolution of the industry. This has immediate consequences for innovation policy decisions.

fig 11
Figure 11. 3rd Scenario. Industry average process R&D investment

* Conclusions and Further Research

5.1
We have designed a multi-agent model that reproduces some stylised facts in the evolution of innovative industries. A product life cycle approach is adopted, and we include the relevant ideas from previous evolutionary models. Cognitive learning of bounded rational firms is allowed.

5.2
As a consequence, a novel look at Self-Organization of markets is both necessary and feasible, thus rescuing the original view of A. Smith. To this end markets should be designed and their models should be programmed as Organizations of Social Agents. The observed aggregated behaviour of industries should emerge from interacting individual agents, who are actively looking for their most advantageous actions. Social learning is embedded in an endogenous way and the agent "industrial sector", which acts as a general container.

5.3
When Industrial Dynamics is focussed in this way, it is possible to model the way firms adaptively learn to improve their competitive advantage, to survive or to leave the industry. As it happens, decision on R&D, both in process and product, are the sources of the final return on assets.

5.4
The intensity of investment in R&D accounts for the dynamic behaviour of the industry life cycle. The results of the simulations with our self-organized industry model, for the rates of entry and exit, the market shares and the concentration indexes, are in agreement with the empirical evidence.

5.5
Lock-in situations and path-dependence phenomena emerge in the model. Early success in R&D investment allows the firm to keep the advantage gap. It is usually difficult to reduce the gap, even if competitors spend higher quantities of money in R&D. But at the same time, early product innovators do not have any guarantee of long term success, since other firms implementing fast second strategies could get higher market shares if they are have financial and human resources enough to improve their production technologies.

5.6
In order to show that the multi-agent paradigm is a novel and appropriate approach to simulate real-life industry interactions, a crude model as the one we have suggested makes the case more generic and robust. But in future research, the model should be extended and improved in several directions.

5.7
As it has been widely expressed in the literature, not all the industries follow the product life cycle approach. So we will try to model alternative industry behaviours. Moreover, we will try model specific and real sectors, as the Spanish automotive industry, following the recent evidence from Klepper (2002).

5.8
In order to keep our model close to Nelson and Winter hypotheses, we have not included some relevant ideas form recent literature in spatial economics. In future works, we will extend our model to cope with industrial clusters, agglomeration economies and so on. Some of the changes to undertake are closely related with new evolutionary principles, as expressed in Boschma and Lamboy (1999.)

5.9
We use Cohen´s endorsement schemes to model cognitive learning of firms. This methodology is grounded on cognitive science theories and allows us to model learning by knowledge exploration, exploitation and imitation. In our opinion, with this methodology we achieve a trade-off between simplicity of modelling and rigour (from the cognitive science point of view).

5.10
However, we agree that other ways of modelling bounded rational learning must be explored by evolutionary modellers. In particular, the emergence of firm competences and capabilities may be included in future research.

* Acknowledgements

The authors want to thank S. Moss and their colleagues at the CPM of the Manchester Metropolitan University for raising our interest in Multi-agent Social Modelling and for their moral and material assistance. The errors and opinions are entirely our responsibility. The authors want to thank also the anonymous referees of the initial version of the paper for their comments and suggestions. This work has been partially supported by the Spanish MICYT, number 2001-2108

* References

ABERNATHY, W.J. and UTTERBACK, J.M. (1978): "Patterns of Industrial Evolution". Technology Review, 80, pp:41-47.

BOSCHMA, R.A. and LAMBOY (1999): "Evolutionary Economics and Economic Geography". Journal of Evolutionary Economics, 9, pp: 411-429.

COHEN, P.R. (1985): Heuristic Reasoning: An Artificial Intelligence Approach. Pitman Advanced Publishing Program, Boston.

EDMONDS, B., MOSS, S. Y WALLIS, S. (1996):"Logic, Reasoning and A Programming Language for Simulating Economic and Business Processes with Artificial Intelligent Agents", in Eid-Dor (ed.): Artificial Intelligence in Economics and Management. Kluwer, Ac. Pub. Boston.

DE BRESSON, C. and TOWNSEND, J. (1981): "Multivariate Models of Innovations: Looking at the Abernathy-Utterback Model with Other Data". Omega, 9(4), pp: 429-36.

DOSI, G., MARENGO, L., BASSANI, A. Y VALENTE, M (1999): "Norms as Emergent Properties of Adaptive Learning: The Case of Economic Routines". Journal of Evolutionary Economics, 9(1), pp:5-26.

GORT, M. and KLEPPER, S. (1982): "Time Paths in the Diffusion of Product Innovations". Economic Journal, 92(367), pp: 630-53.

KAWASNICKI, W. (1996): Knowledge, Innovation and Economy: An Evolutionary Exploration. Edward Elgar Publishing Ltd.

KLEPPER, S. (1996): "Entry, Exit, Growth, and Innovation over the Product Life Cycle". American Economic Review, 86(3), pp: 562-583.R

KLEPPER, S (2002): "The Evolution of the U.S. Automobile Industry and the Detroit as its capital". Paper presented at 9th Congress of International Joseph A. Schumpeter Society, Gainesville, Florida, March.

KLEPPER, S, and GRADDY, E. (1990): "The Evolution of New Industries and the Determinants of Market Structure". Rand Journal of Economics, 21(1), pp:27-44.

KLEPPER, S. and SIMONS, K.L. (1993): "Technological Change and Industry Shakeouts". Mimeo, Carnegie Mellon University.

MOSS, S., GAYLARD, H., WALLIS, S. Y EDMONDS, B. (1998): "SDML: A Multi-Agent Language for Organisational Modelling". Computational & Mathematical Organization Theory, vol 4(1), pp:43-49.

MOSS, S. (1995): "Control Metaphors in the Modelling of Economic Learning and Decision-Making Behavior". Computational Economics, 8, pp:283-301.

MOSS, S. (1998): "Critical Incident Management: An Empirically Derived Computational Model". Journal of Artificial Societies and Social Simulation (JASSS), 1(4) <https://www.jasss.org/1/4/1.html>.

NELSON, R.R and WINTER, S.G.; (1982): An Evolutionary Theory of Economic Change. Belknop Harvard.

OLTRA, V. and YILDIZOGLU, M. (1998): "Learning and Expectations in R&D Decisions", BETA-THEME Working Paper. Université Louis Pasteur. France.

UTTERBACK, J.M. and ABERNATHY, W.J. (1975): "A Dynamic Model of Process and Product Innovation". Omega, 3(6), pp: 639-56.

UTTERBACK, J.M. and SUREZ, F.F. (1993): "Innovation, Competition and Industry Structure". Research Policy, 22(1), pp: 1-21.

YILDIZOGLU, M. (1999): "Competing R&D Strategies in an Evolutionary Model". BETA-THEME Working Paper. Université Louis Pasteur. France.

----

ButtonReturn to Contents of this issue

© Copyright Journal of Artificial Societies and Social Simulation, [2003]