© Copyright JASSS

  JASSS logo ----

Rob Stocker, David Cornforth and T. R. J. Bossomaier (2002)

Network Structures and Agreement in Social Network Simulations

Journal of Artificial Societies and Social Simulation vol. 5, no. 4
<https://www.jasss.org/5/4/3.html>

To cite articles published in the Journal of Artificial Societies and Social Simulation, please reference the above information and include paragraph numbers if necessary

Received: 31-Jul-2002      Accepted: 28-Sep-2002      Published: 31-Oct-2002


* Abstract

Networks are very evident in the physical world and particularly in social structures. One focus of research is on investigating the development and maintenance of social network structures. Social networks may be typically categorised as random, scale-free or hierarchical structures. A key research question is how the structure and parameters of a network affect the stability of opinion within the network. In a previous study, we examined the case for random network structures. In this work, we show how complex systems models can be used to investigate the effects of various parameters (including the number of layers and the number of links per node) in hierarchical and scale-free network structures. The models are used to investigate whether the network reaches a stable collective state, where the opinions of individuals remain constant, or an unstable state, where the opinions of individuals continue to change. Several important results emerge. One is that flat hierarchies, which possess few layers and many links per node, are more likely to be unstable than deeper hierarchies. Another is that regardless of the network topology, the number individuals whose opinion continues to change settles to a relatively stable level. We also demonstrate the inherent stability of scale-free networks. This work has implications for how network structures should be organized, in order to exploit stability or dynamic behaviour, in particular for political, organisational, social and educational contexts.

Keywords:
Asynchronous Update; Complex Systems.; Hierarchical Networks; Random Networks; Scale-free Networks; Social Networks; Social Simulations; Social Structures

* Introduction

1.1
Human social networks comprise individuals that interact with each other through family, work, recreation, community, social and sports activities. Common to these interactions is the establishment of relationships that rely on patterns of connection and information exchange processes. Individuals are able to identify each other in the system, the spatial and temporal relationships between them and their intrinsic properties.

1.2
Network peer members influence each other directly, through, for example, persuasion, orders, providing information and acting as role models (Burt 1987), and they adjust or modify their behaviour in consequence of their interaction with other individuals, and the environment in which they operate. Communication, and thus social comparison, depends on the individuals' attributes or features, strategies and other characteristics, in a social network and the nature of their relationships (Erickson 1988). New issues promote discussion and comparison as each individual develops an initial attitude towards the issue and stable agreement patterns emerge. However, significant disagreement can result in fragmentation of the social group. Consensus, communication and cohesion also depend upon the nature of the larger structural unit in which individual member links are embedded (Stocker et al. 2001). Individual characteristics and network structure influence individual decision-making, social processes and thus the intrinsic dynamics of the system, leading to unexpected and surprising dynamical effects (Bura et al. 1995; Nowak & Lewenstein 1996; Valente 1996; Axelrod 1997).

1.3
Studies of social networks have identified several important issues, including patterns that emerge in consequence of a society's structure and dynamics. These large-scale patterns may be considered separately from, and arise in consequence of, the small-scale properties associated with the individual members of a social group (Klüver & Schmidt 1999). This phenomenon of emergent behaviour is a property of complex systems.

1.4
Other studies have resulted in mechanisms and models that identify, describe and measure network topology and its critical relationship to network system dynamics (Scott 1991; Wellman & Berkowitz 1988; Axtell 2000). For example, the spread of ideas, innovations or computer viruses is dependent on network structure (Valente 1996; Pastor-Satorras & Vespignani 2001). Research into network topology and dynamics is necessary to understand the evolution and behaviour of complex network systems.

1.5
Random and hierarchical network structures are used to represent the structure of society and social groups. Random structure assumes that the probability of a link between any two individuals is independent of the individual. Hierarchies are common in society, for example, in business and military organisations and genealogical structures, usually implying a tree-like structure. However, many real world networks are more accurately represented by scale free network structures (Albert et al. 2000; Albert & Barabási 2001).

1.6
Stocker et al. (2000) have previously shown that random Boolean models of social network structures can explain how cooperation and cohesion can emerge within groups of individuals. They also demonstrated that critical levels of connectivity between individuals are required in order to achieve consensus within a social network (Stocker et al. 2001).

1.7
In this work, we examine simulations of hierarchical and scale-free social network structures to determine the effects of different parameters on patterns of agreement and change of opinion that emerge from the interaction of network members.

1.8
In Section 2, we provide a background for considering social networks as complex systems, and examine the properties of hierarchical and scale free network structures. In Section 3 we describe how social networks may be modeled in computer based simulations. Section 4 describes the methods used in simulations of social communication for hierarchical and scale-free networks. Section 5 provides results and analysis of consensus patterns. Section 6 discusses conclusions and implications for further research.

* Social Networks as Complex Systems

2.1
Social networks have been recognised as a type of complex system, where the patterns of interaction between individuals and the patterns of connectivity that social networks exhibit are characteristic. In consequence, tools that are common in complex systems research, such as graph theory and computer models, can be usefully applied to the study of social networks.

2.2
General principles govern all complex system behaviour and point to ways of solving attendant problems. Complex systems are often influenced by small inputs to generate large changes at significant lever points. That is, small changes in the parameters that interact in a complex system can produce significant change in the structural patterns that emerge in consequence of that interaction. The same patterns are evident across a wide range of disciplines (Holland 1995).

2.3
Complex systems theory provides models where communication between individual and collective levels in social groups generates stable structures. Here, where individual agent behaviour and attributes are mutually interdependent, a stable social system is able to respond to outside events by relying on an ability to adapt various strategies (Allen 1998). One such strategy is the forming of consensus or agreement amongst group members about one or more issues.

2.4
Simulations or models of social complexity are commonly implemented as random, hierarchical, and scale-free social network structures. These can be analysed and visualised using mathematical graph theory (Wellman 1988; Green 1993; Troitzsch 1997). This permits structural analysis of social networks, by investigating the ordered arrangements of relations that exist in the exchanges between members of the system (Wellman & Berkowitz 1988). Maps and topologies of social networks permit inferences that relate from the whole to parts, from structures and relations to categories, and from behaviours to attitudes. The nature of social structures may therefore be related to particular properties of social groups. For example, is consensus or agreement on one or more issues more pervasive in particular network structures?

2.5
A graph consists of a number of nodes or vertices (representing members of the network) connected by edges (representing communication pathways for the exchange of information resources). Some examples of such graphs are shown in Figure 1. If edges are placed at random, the result is a random graph with no apparent structure (Fig. 1a). This type of graph is characterised by a distribution of the number of connections at each node approximating a Poisson distribution.

2.6
If edges are placed so that cycles (closed loops) are disallowed, the result is a hierarchy (Fig. 1c). If edges are placed with higher probability of connecting to a node that already has more connections, the result is a scale-free graph (Fig. 1b). Such a graph has the property of having a few highly connected nodes, and many with fewer connections.

2.7
Social science research has used random network representations of social structures to provide useful insights into dynamic and structural patterns that emerge from the bi-directional interaction of individual members (Granovetter 1978; Hanneman 1995; Hales 1998; Gilbert and Troitzsch 1999).

2.8
Hierarchical network structures are evident in organisational charts, military and policing organisations, genealogical structures, strict class-based societies and the like. They consist of nodes with branching connections that form a typical tree-like structure (Figure 1c). Sometimes represented as binary-linked trees, where each node is connected to two others in the layer below, they can also have varying numbers of nodes in each layer and various numbers of links to the nodes below.

2.9
In scale-free, heterogeneous networks, a few highly connected nodes link the remaining sparsely connected nodes to the system (Figure 1b) and connectivity is based on a power law (Jeong et al. 2000; Albert & Barabási 2001).

Figure 1
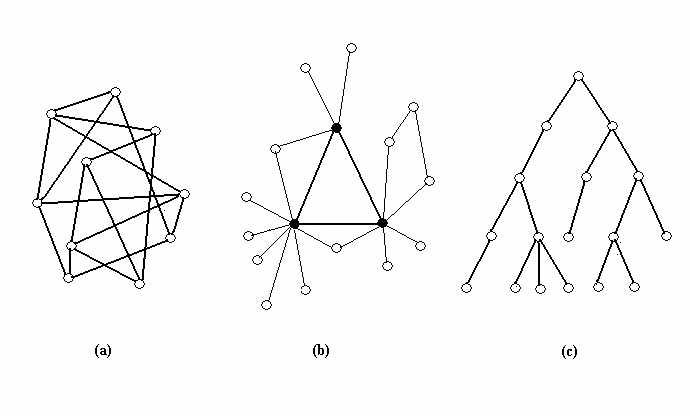
Figure 1. Representation of network structures: (a) random, (b) scale-free and, (c) hierarchical (Stocker et al. 2001)

2.10
Stocker et. al. (2001) have shown that in random network models, network behaviour depends upon the group size, density of connections, and pattern of connections. In this study, we examine patterns of agreement in hierarchical and scale-free network structures to determine the relationship between them.

* Computer Simulations of Social Networks

3.1
The study of dynamic patterns of behaviour in human society is an emerging discipline. The wide spread use of computer simulations in research into complex, dynamic systems allows precise study of the dynamical consequences of models and has been embraced by the social sciences (Troitzsch 1997; Liebrand 1998; Gilbert & Troitzsch 1999). Computer simulations are powerful, and often the only means by which the researcher can investigate the dynamic consequences of social theories (Nowak et al. 1990; Nowak & Lewenstein 1996).

3.2
Simulations are principally focussed on theory and the generation of information based on theory. They can be deterministic, representing time scales, or stochastic, representing irregularly distributed events (Doreian & Stokman 1997). They provide a systematic means of investigating patterns that emerge from the interaction of explicitly defined states of individual agents or actors and the causal processes that change these states over time (Hanneman 1995). Simulations are used, principally, to obtain a better understanding of features of the real world, make predictions about future behaviour and discover and formalise precise theoretical concepts.

3.3
Computer algorithms that simulate social complexity, social reality and the process of change to structural parameters are integral to the representation of valid constructions to test social theory (Hales 1998). Simulations are expressed in terms of a procedure or a set of steps that describe a specific behaviour in a more precise and rigorous way than a verbal description. Continuous refinement is required to distill the essence of social behaviour into precise computer language instructions that encompass the assumptions we have about how the behaviour can be implemented. Simulations can be run repeatedly, varying the parameters and assumptions, to observe effects on the model's behaviour for patterns that either confirm or deny our intuitions about what it is we are modelling and to determine how closely the simulation emulates real-world behaviour. Such investigation is often not practical, ethical or possible in real-world environments (Gilbert & Troitzsch 1999).

3.4
We represent individuals in a social network by nodes in a graph. Connections or edges between the nodes represent communication pathways. General rules are used to describe the behaviour of nodes and their activation thresholds (Granovetter 1978; Valente 1996; Axtell 2000) and topological rules to describe connectivity patterns that are peculiar to hierarchical and scale-free networks.

General Rules

3.5
Each node is randomly initialised with:
  • a state that represents an individual's opinion on a particular issue and is expressed as either "yes" (represented by 1), or "no" (represented by 0). After initialisation, 50 per cent of nodes on average will be in the "yes" state. A node's state influences the state of neighbouring nodes to which it is directly connected. Likewise, each node's state is influenced in return by the state of the neighbouring nodes that are directly connected to it,
  • a level of influence (expressed as a real value between 0 and 1) that represents the strength by which a given node communicates its current state, in effect an output weight, and
  • a level of susceptibility (expressed as a value between 0 and 1) that it will change from its current state, in effect an input weight.

3.6
Change from a node's current state depends upon relative influence and relative susceptibility during interaction between pairs of connected nodes. That is, change in state is initiated from a node with higher influence and lower susceptibility towards a connected node with lower influence and higher susceptibility. Consequently, change can occur in either direction between connected pairs (see pseudo-code below).

3.7
Synchronous updating of the states of individuals across the entire network has been commonly used in many models, but this is unlikely to reflect the behaviour of real world social systems (Bossomaier and Harvey 1997; Cornforth et al 2001) where individuals do not all change together (i.e. synchronously). In real communities, change takes place in pairs or in small groups, depending on the relationship between an individual and its connections to others. State changes in our simulations are therefore processed using asynchronous updating.

Topologic Rules

3.8
The population of the social structure is static, containing a fixed number of approximately 100 nodes. This parallels the population of random network structures used in previous studies (Stocker et al. 2001). For this study, we established the network topology for hierarchical and scale-free structures as follows:
The hierarchical structure

3.9
Two models were used. Firstly a random general tree topology with a population of 100 nodes, where each node is connected to one predecessor (except for the top layer of the hierarchy) and to a random number of successors. Secondly, a constrained and symmetrical hierarchical structure where the number of layers, the number of nodes in the first layer and the number of connections from each node to the next layer were set. For example, in one experimental run the number of layers = 3, number of nodes in first layer = 1, number of connections to second layer = 4 and number of connections to the final layer = 24 resulting in a population = 101 (see Figure 2).

Figure 2
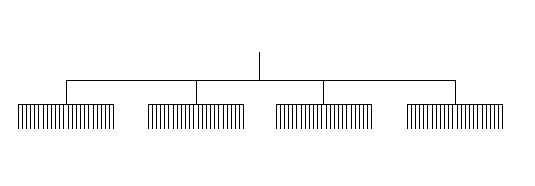
Figure 2. Patterns of connections to each node in the constrained hierarchical network structure, number of layers = 3, number of nodes in first layer = 1, connections to second layer = 4 and connections to the final layer = 24. This is designated Hierarchy 3λ1λ4λ24.

The scale-free structure

3.10
This model generated a topology based on a power law distribution where the probability P(k) of preferential attachment to node i is dependent on the degree k(i) of node i (Albert & Barabási 2001) as in the following equation.

Equation 1

3.11
Network growth is also a property of scale-free networks, but this was not included in this model, in order to hold the population constant at N ~ 100, for comparison with previous models (Stocker et al. 2001). Connectivity patterns were determined such that the total connectivity approximated 2N+1 by substituting values for the parameters Z (0.38 to 0.99) and λ (1.00 to 1.71). The resulting probability was applied to the population of 100 to determine the number of nodes connected to each node in the system. For example, with Z = 0.38 and λ = 1.00 the total connections for the system = 206, node 1 had 35 connections, node 5 had 6 connections and nodes 20 to 100 had 1 or 2 connections, thus approximating the power law distribution. For each experimental run, nodes were randomly positioned in the population of 100 to avoid bias in the results. With values of Z = 0.38 and λ = 1.00, and Z = 0.9999 and λ = 1.71, the connectivity patterns for the scale-free model approximates the power law distribution as shown in Figure 3 and Figure 4. The most obvious difference between the two wiring diagrams is the change to the distribution of connections for nodes 1 to 20 particularly the fewer number of nodes connected to the first preferential nodes (i.e. nodes 1 to 5).

Figure 3
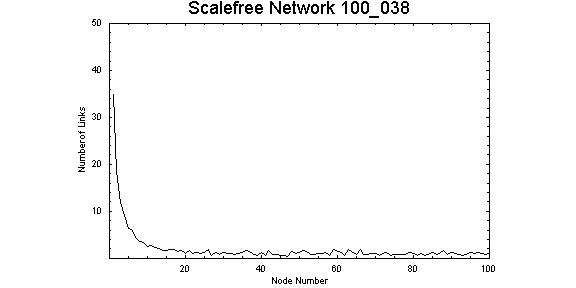
Figure 3. Connectivity pattern for values Z = 0.38 and λ = 1.00. Node 1 has 35 connections and node 5 has 6 connections, the majority of nodes have only 1 or 2 connections.

Figure 4
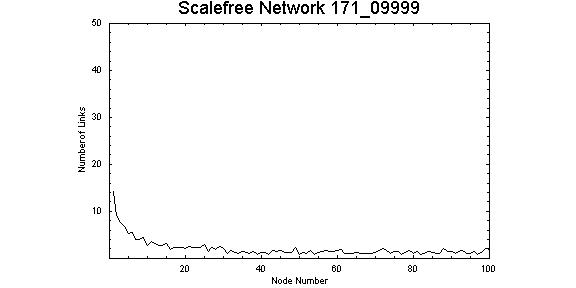
Figure 4. Connectivity pattern for values Z = 0.9999 and λ = 1.71. Node 1 has 14 connections and node 5 has 5 connections, the majority of nodes have only 1 or 2 connections.

3.12
Each model was iterated through 500 time steps during which time the connected nodes interacted according to the general rules described above. The number of nodes with the same "yes" (or 1) state and the number of nodes that changed states during interaction was recorded as were the patterns of connectivity. For each of 10 experimental runs of the simulations, the results were averaged.

3.13
The following algorithm describes the model:
//   initialise each node
      for each node
         set opinion 0 or 1
         set influence between 0 and 1
         set susceptibility between 0 and 1
      next node
//   initialise node connectivity for hierarchy OR scale-free
      if hierarchy
         for each node i in current layer
            select different node j in next layer
            create link between i and j
         next node i
      if scale-free
         for each node i
            k = number of connections for node i
            for each node j from 1 to k
               create link between i and j
            next node j
         next node i
//   execute interaction between connected nodes
      for time step (1000)
         for node i (1 to population)
            for node j (1 to population)
               if node i connected to node j
                  if influence of node (i > j) AND susceptibility of node (i < j)
                     state of j = state of i
                  else if influence of node (i < j) AND susceptibility of node (i > j)
                     state of i = state of j
            next node j
         next node i
         record state of each node for each time step
      next time step

* Results

Hierarchical Networks

4.1
The random general tree hierarchical model demonstrated stable patterns, quickly settling to a consistent level of around 50 per cent "yes" states amongst network members (see Figure 5).

Figure 5
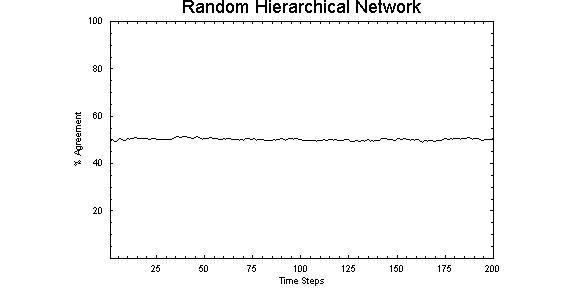
Figure 5. Agreement patterns through time for the random general tree hierarchical network structure, demonstrating stability through all time steps

4.2
The transition to stable patterns is more readily evident in the numbers of nodes that changed opinion, indicating a possible chaotic attractor, and is obvious at 0 to 100 time steps (see Figure 6).

Figure 6
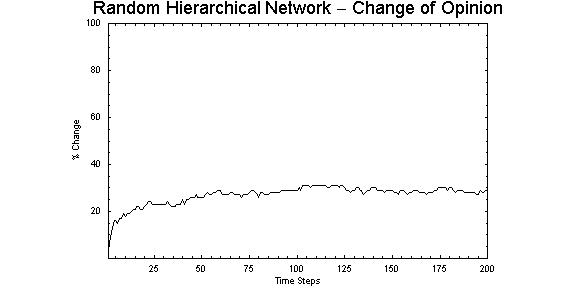
Figure 6. The percentage of nodes that changed state settling to stability through 0 to 100 time steps, indicating a possible chaotic attractor

.

4.3
The second hierarchical model quickly settled to stable behaviour, that is, consistent number of "yes" states amongst network members (see Figure 7).

Figure 7
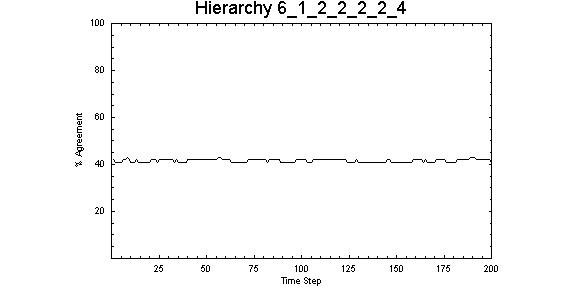
Figure 7. Representative of the consistent and stable patterns of opinions in hierarchical structures, this system comprised six layers with one node in the top layer. For subsequent layers, there are two links from the previous layer and four links to the final layer resulting in a population of 95 for this structure

4.4
However, as expected, variations in the number of layers, the number of nodes in the first layer and the number of connections per layer did affect the stability of opinion patterns. Stability became more pervasive as the number of layers increased, that is, as the structures became progressively narrow and approached a binary tree structure. Narrow hierarchical structures appeared to be more stable than those with a broad structure (see Figure 8), again suggesting a point of attraction.

Figure 8
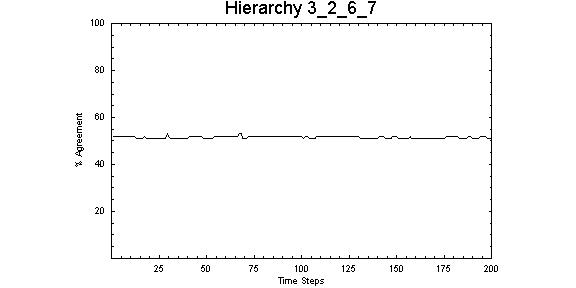
Figure 8. Relatively narrow3-layer hierarchical structure with 2 nodes in the top layer, 6 links to the second layer and 7 links to the final layer, demonstrates stable opinion patterns (compare Fig 7) suggesting a point of attraction

.

4.5
Likewise, where the number of links in a high level layer, exceed those in lower layers, the opinion patterns in the system remained essentially stable (see Figure 9).

Figure 9
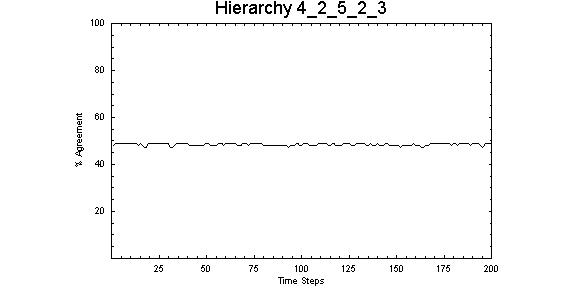
Figure 9. For this 4-layer structure, the number of links from the first layer to the second exceeds the number of links to subsequent layers. Note the stable patterns of opinion.

4.6
Broad structures with few layers were essentially unstable, exhibiting complex behaviour with many nodes changing state and opinion patterns fluctuating significantly particularly where the links from a node in a superior layer exceeded six (see Figure 10).

Figure 10
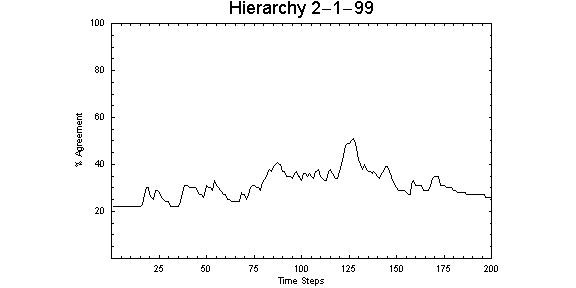
Figure 10. Representative of broad hierarchical structures, this 2-layer hierarchical network with one node in the top layer and links to ninety-nine nodes in the lowest layer, demonstrates complex behaviour and instability over time, where opinion patterns fluctuate from 20 per cent to 50 per cent.

4.7
As expected, where opinion patterns were stable, the number of nodes changing states was constrained to a narrow range. Conversely, where opinion patterns were unstable, the range of nodes changing state was broader.

Scale Free Networks

4.8
We selected the most interesting results from experimental runs. These correspond to the extreme ends of the parameter range for the power law distribution (i.e. Z = 0.38, λ = 1.00 and Z = 0.9999, λ = 1.71). The results demonstrated the inherent stability of scale-free networks (Albert & Barabási 2001; Pastor-Satorras & Vespignani 2001).

4.9
For Z = 0.38, λ = 1.00, number of "yes" states amongst network members shows a slight general decline between 0 and 100 time steps, and then shows a significant increase at around 100 time steps (see Figure 11). The effect corresponds with an increase in the number of nodes that change opinion from 0 to 100 time steps with a noticeable protuberance at around 100 time steps (see Figure 12). The changes are significant at this point. The system settles to a stable pattern of opinion after this point and may be the result of a highly connected node influencing the nodes to which it is connected.

Figure 11
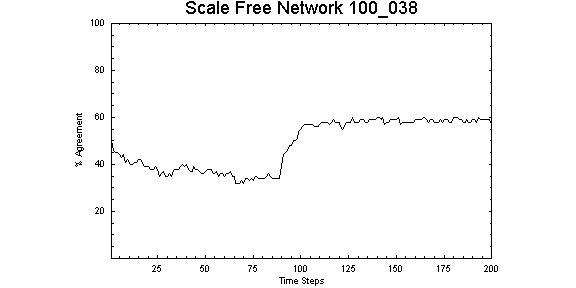
Figure 11. Scale-free network with Z = 0.38, λ = 1.00 showing significant change in number of "yes" around 100 time steps.

Figure 12
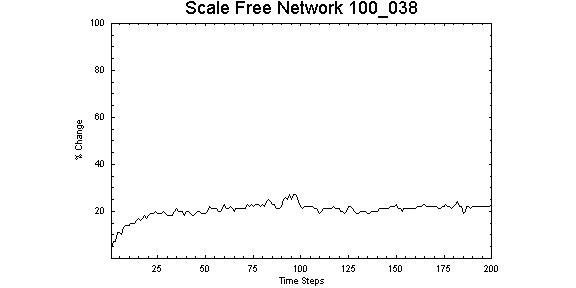
Figure 12. Scale-free network with Z = 0.38, λ = 1.00 showing corresponding the protuberance or increase in the number of nodes changing state at around 100 time steps

4.10
For Z = 0.9999, λ = 1.71, the progress to stability between 0 and 100 time steps is more uniform (see Figure 13) and lacks the significant change demonstrated by the lower value parameters. The effect corresponds with the variation in the number of nodes that change opinion in the system (see Figure 14) showing similarities to the lower value parameters.

Figure 13
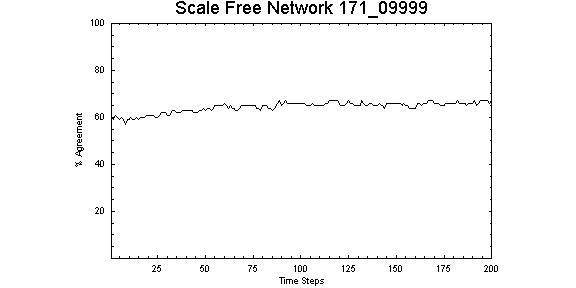
Figure 13. Scale-free network with Z = 0.9999, λ = 1.71 showing gradual move to stable opinion patterns over the first 100 time steps

Figure 14
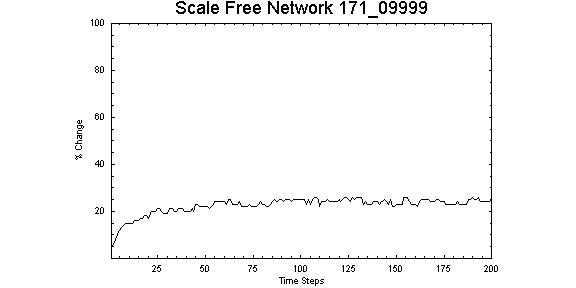
Figure 14. Scale-free network with Z = 0.9999, λ = 1.71 showing an increase in the number of nodes changing state at around 100 time steps that is similar to Z = 0.38, λ = 1.00.

4.11
After 100 time steps the number of nodes in the "yes" state and the number of nodes changing state are essentially the same for both Z = 0.38, λ = 1.00 and Z = 0.9999, λ = 1.71. Results for the lower and higher values of the power law parameters may be related to the difference in the connectivity patterns and, in particular, the different concentration of connections in the first few nodes (as shown in Figures 3 and 4).

4.12
One interesting aspect of the results is how the number of nodes that change opinion (20 per cent - 30 per cent of the population) is consistent for both the hierarchical and scale-free structures indicating that regardless of network structure there is always a relatively stable number of network members who will continue to change their opinion. There is no evidence to suggest that these are the same nodes for each time step of the simulation. The implications of this and the other results are discussed in the next section.

* Discussion and Conclusions

5.1
Hierarchical and scale-free network structures appear to behave in an inherently stable manner with respect to patterns of agreement and number of members who change opinion. As expected, variations on that general stability were dependent upon the number of layers and the number of nodes per layer for hierarchical structures and the characteristics of the power-law tail for scale-free structures. The static models used in this study allocate connections between nodes proportionally to the (fixed) population. It is logical to assume that the general results would not necessarily be different for larger populations. For dynamic models where the population (and connections between nodes) can grow and decay, we would expect to see markedly different results. These variations on the model are pointers to further research (see below).

5.2
An interesting effect of the model is that 100 per cent agreement is never reached. We believe that this situation is the result of interaction between those nodes with values for influence and susceptibility that do not allow for a change of state. This is reflected is society, where 100 per cent agreement in social groups is rarely achieved.

5.3
These results have implications for all areas of social systems modelling. Firstly, we have demonstrated that model behaviour is dependent on the structure of the model, its patterns of connectivity and the characteristics of the individual members. Secondly, there are implications for any complex system where stability is an issue, for example, in real-world political systems, social systems and public education systems. The simplicity of the model restricts our interpretations to be merely suggestive rather than definitive.

5.4
In the case of hierarchical networks, instability is observed primarily where the structure is broad. That is, where there is a requirement for a node in a superior layer to communicate with more than six nodes in the inferior layer (see Wellman et al. 1988; Dunbar et al. 1995; Dunbar & Duncan 1997). These results suggest that in the military or corporate organisations, a narrow structure is more conducive to consensus on specific issues throughout the structure. However, if innovation and change, represented by a breaking of consensus, is the objective, then superior positions in the hierarchy should communicate through formal connections to greater than six others at a subordinate level

5.5
For scale-free networks, change in stable patterns of opinion can be attributed to the links between highly connected nodes and the remaining nodes in the system. A change in one of these highly connected nodes will dramatically influence the rest of the nodes in the network (Albert et al. 2001). Logically, these changes are more likely to occur in networks where the power law tail of the distribution is such that a fewer number of nodes have the majority of connections, that is, at low values of Z and λ. The results confirm the inherent stability of scale-free networks and their general tolerance to change. However, under attack highly connected "leader" nodes can influence large numbers of the remaining population.

5.6
It should be noted that these models do not assign any authority to any individual node over its subordinate nodes. For both network structures, interaction between nodes is governed by the number of connections to other nodes, together with the difference between influence and susceptibility values that are assigned to each node randomly at initialization.

5.7
There are implications for political systems and elections in particular. In a predominantly two-party political system, the debate on single emotive issues often results in majority public support or rejection of policy with a relatively small proportion of the population undecided. Support for a political party is primarily determined by the nature of the issue (and the influence of mass media). The media and political mechanism focus on influencing and changing the opinion of the so-called "swinging voter". The results for both hierarchical and scale-free networks (e.g. 20 per cent - 30 per cent opinion changers) support this real world phenomenon. Will the influence of mass media on static and dynamic simulations of social networks affect opinion patterns (see Axelrod 1997)? How does introduction of multiple issues affect patterns of opinion and change of public opinion?

5.8
For business organisations, that are typically hierarchically structured, the results have implications for the most effective and efficient formation of opinions amongst staff coordinated by supervisors or managers. If the organisational structure is such that few managers are responsible for many subordinates at the same level, formation of consistent opinion is more difficult and subordinate's opinions are likely to be less consistent. This may be relevant in the formation of a corporate culture (for example, attitude to quality, customer service, standards and procedures) in the absence of strong leadership.

5.9
Likewise in systemic education, opinion change is necessary for the educative process. These results indicate that the number of students per educator (class-size) is critical for opinion change and hence instruction. Here the modern teacher will be well advised to organise groups according to the purpose of instructional sessions. For example, where class discussion about an issue is required, groupings of greater than six members (or the whole class) will provide for diversity of contributions to the discussion. Conversely, where a specific change in opinion is the objective, emulating the scale-free structure by engaging the most influential peers from the class in groups of less than six, is useful.

5.10
This study reveals some interesting questions that provide opportunities for further research. In the real world, people are not only connected in single-type network structures. People interact in work, social and family environments and they are members of much larger social groups, for example, clubs, towns, cities, states, nations, races, etc. These structures can be represented as random, hierarchical and scale-free networks. Individuals can be members of each type of network simultaneously and will contribute different amounts of their available time to different networks. What are the effects of time allocation to different network structures on consensus and cohesion?

5.11
To date, we have used static models where the population is set close to 100. What are the effects of increasing the population to 1000, 10000 and 100000 nodes? What variations occur when the number of nodes in the "yes" state at intitialisation is varied? What patterns emerge when the models are dynamic and nodes/links can be added or removed? What role do social and physical proximity play in the emergence of public opinion? Further extension of our models is consequently prescribed. We propose to address the questions posed above (and others) in future research.

* References

ALBERT R Jeong H and Barabási A-L (2000), Error and attack tolerance of complex networks. Nature, 406: 378-382.

ALBERT R and Barabási A-L (2001), Statistical mechanics of complex networks. arXiv:cond-mat/0106096, 1: 6 Jun, 1-54.

ALLEN Peter M (1998), Evolving complexity in social science. In Systems: New paradigms for the human sciences, (3-38). Berlin: Walter de Gruyter GmbH & Co.

AXELROD Robert (1997), The dissemination of culture: A model with local convergence and global polarization. Journal of Conflict Resolution, 41: 203-226.

AXTELL Robert L (2000), Effects of interaction topology and activation regime in several multi-agent systems. Working Paper 12, Center on Social and Economic Dynamics, Ann Arbor: University of Michigan.

BOSSOMAIER T R J and Harvey I (1997), Time out of joint: Attractors in asynchronous boolean networks. In P Husbands and I Harvey (Eds) Proc. Fourth European Conference on Artificial Life, 67-75

BURA S GuérinλPace F Mathian H Pumain D and Sanders L (1995), Cities can be agents too: A model for the evolution of settlement systems. In Gilbert, Nigel and Conte, Rosaria. Artificial societies: The computer simulation of social life, 86-102. London: University College London Press.

BURT R S (1987), Social contagion and innovation: Cohesion versus structural equivalence. American Journal of Sociology, 88: 1287-1335.

CORNFORTH D Green D G Newth D Kirley M (2001), Ordered asynchronous processes in natural and artificial systems. In Peter Whigham, Mitsuo Gen et al. (Eds) Proceedings of the Fifth Japan-Australia Joint Workshop on Intelligent and Evolutionary Systems, 105 - 112. Dept of Information Science, University of Otago, Dunedin, NZ.

DOREIAN P and Stokman F N (1997), The dynamics and evolution of social networks, NewYork: Gordon and Breach.

DUNBAR R I M Duncan N D C and Nettle D (1995), Size and structure of freely forming conversational groups. Human Nature, 6: 1, 67-78.

DUNBAR R I M and Duncan N D C (1997), Human conversational behaviour. Human Nature, 8: 3, 241-246.

ERICKSON B H (1988), The relational basis of attitudes. In Barry Wellman and S. D. Berkowitz, Social structures: A network approach, 99 - 121. New York: Cambridge University Press.

GILBERT N and Conte R (1995), Introduction. In Nigel Gilbertand Rosaria Conte Artificial societies: The computer simulation of social life, 1-15. London: University College London (UCL) Press.

GILBERT N and Troitzsch K G (1999), Simulation for the social scientist, Buckingham, UK: Open University Press.

GRANOVETTER Mark (1978), Threshold models of collective behaviour. American Journal of Sociology, 83 (6): 1420-1443.

GREEN D G (1993), Emergent behaviour in biological systems. In Complex Systems - From Biology to Computation. (ed. Green, D G and Bossomaier, T R J), 25-36. Amsterdam: IOS Press.

HALES D (1998), An open mind is not and empty mind: Experiments in the meta-noosphere. Artificial Societies and Social Simulations, 1(4), 1-26.

HANNEMAN R A (1995), Simulation modelling and theoretical analysis in sociology. Sociological Perspectives, 38 (4): 457-462.

HOLLAND J (1995), Hidden order: How adaptation builds complexity, Reading, MA: Perseus Books.

JEONG H Tombor B Albert R Oltavi Z N and Barabási A-L (2000), The large-scale organisation of metabolic networks. Nature, 407: 651-654

KLÜVER J and Schmidt J (1999), Topology, metric and dynamics of social systems. Journal of Artificial Societies and Social Simulation, 2: 3.

LIEBRAND Wim B G (1998), Computer modelling and the analysis of complex human behaviour: Retrospect and prospect. In Liebrand, et al. (Eds) Computer Modelling of Social Processes: New Technologies for Social Research, London: Sage Publications: 1-19.

NOWAK A and Lewenstein M (1996), Modelling social change with cellular automata. In R. Hegselmann, et al., Modelling and simulation in the social sciences from the philosophy of science point of view, (249-285). Netherlands: Kluwer Academic Publishers.

NOWAK A Szamrej J and Latané B (1990), From private attitude to public opinion: A dynamic theory of social impact. Psychological Review, 97(3), 362-376.

PASTOR-SATORRAS R and Vespignani A (2001), Epidemic spreading in scale-free networks. Phys. Rev. Lett, 86(14), 3200-3203.

SCOTT J (1991), Social network analysis: A handbook, London: Sage Publications.

STOCKER R Green D G and Newth D (2000), Connectivity, cohesion and communication in simulated social networks. In Akira Namatame Yasuhiro Tsujimura Mitsuo Gen Bob McKay Ruhul Sarker Xin Yao(Eds) Proceedings of the Fourth Japan-Australia Joint Workshop on Intelligent and Evolutionary Systems, 156 - 163. National Defence Academy, Japan; Ashikaga Institute of Technology, Japan; University of New South Wales, Australia.

STOCKER Rob Green David G and Newth David (2001), Consensus and cohesion in simulated social networks. Journal of Artificial Societies and Social Simulations, Volume 4 Issue 4. (https://www.jasss.org/4/4/5.html).

TROITZSCH Klaus G (1997), Social science simulation - Origins, prospects, purposes. In Conte, R et al. (Eds) Simulating social phenomena, Heidelberg: Springer-Verlag: 40-54.

TROITZSCH Klaus G (1998), Multilevel process in the social sciences: Mathematical analysis and computer simulation. In Liebrand, et al. (Eds) Computer Modelling of Social Processes: New Technologies for Social Research, London: Sage Publications: 20-36.

VALENTE Thomas W (1996), Social network thresholds in the diffusion of innovations. Social Networks, 18: 69-89.

WELLMAN B (1988), Structural analysis: From method and metaphor to theory and substance. In Wellman B and Berkowitz S D (Eds), Social structures: A network approach, Cambridge: Cambridge University Press: 19-61.

WELLMAN B and Berkowitz S D (1988), Introduction: studying social structures. In Wellman B and Berkowitz S D (Eds), Social structures: A network approach, Cambridge: Cambridge University Press: 1-18.

WELLMAN B Carrington P J and Hall A (1988), Networks as personal communities. In Wellman, B and Berkowitz S D (Eds), Social structures: A network approach, Cambridge: Cambridge University Press: 130-184.

----

ButtonReturn to Contents of this issue

© Copyright Journal of Artificial Societies and Social Simulation, [2002]