© Copyright JASSS

  JASSS logo ----

C. van Dijkum, J. van Mens-Verhulst, E. van Kuijk and N. Lam (2002)

System Dynamic Experiments with Non-linearity and a Rate of Learning:
the development of chronic fatigue complaints

Journal of Artificial Societies and Social Simulation vol. 5, no. 3
<https://www.jasss.org/5/3/6.html>

To cite articles published in the Journal of Artificial Societies and Social Simulation, please reference the above information and include paragraph numbers if necessary

Received: 24-Mar-2002      Accepted: 12-Jun-2002      Published: 30-Jun-2002


* Abstract

A system dynamics model is developed that explores the social dynamics of health-related actions to cope with fatigue. The process of self-regulation is simulated, particularly with respect to the consequences of non-linear feedback cycles. The rate of learning is identified as an intriguing parameter that regulates health-related actions.

Keywords:
Fatigue; Non-linearity; Rate Of Learning; Self-regulation; System Dynamics

* Introduction

1.1
In system dynamics, it is taken for granted that human beings engage in feedback cycles when they interact with the world. However, system dynamics models of human action are hardly ever used in social science research, despite the fact that many theories assume that interaction between people and the world is a dynamic activity. Why this is so, is a matter for speculation. In our opinion, it mainly has to do with the gap that exists between dynamic theories on the one hand and static methods of empirical research on the other.

1.2
One of the missed opportunities is a common-sense theory of health-related actions (Leventhal et al., 1984; Leventhal et al., 1990). As the theory involves feedback loops, it is also a dynamic theory. However, in empirical research, the aim of which is to verify theory, only static (linear) models are used. We were confronted with this practice when we used Leventhal's theory to explain empirical facts about the way patients cope with 'fatigue', namely: lack of concentration, sleeplessness, lack of energy, nervousness, tension, stress and forgetfulness (Mens-Verhulst and Bensing, 1998; Mens-Verhulst et al., 1999). As these complaints are not well understood in medical practice, we thought that a psycho-social theory would be more effective than a medical theory to explain what is going on. To bridge the gap between the empirical facts and Leventhal's psycho-social theory, we developed a dynamic computer simulation model.

1.3
The model is inferred from both the theory (Section 2) and the empirical research (Section 3). An explanation of the specification of the model indicates which variables (Section 4.1) and parameters (Section 4.7) are adequate; what equations constitute the model; and how some parameters of the model can be estimated with the aid of empirical data (Section 4.16). The results of simulation experiments are presented and interpreted in Section 5, followed, in Section 6, by discussion.

* A Dynamic Theory and Model

2.1
Leventhal developed a commonsensical, self-regulation theory based upon three simple propositions:
  1. People are active problem solvers; they see and define their worlds; select and elaborate coping procedures to manage threats; and change their representation of problems when they receive negative feedback.
  2. Problem-solving processes occur in context.
  3. The energy expended to enhance health and to prevent and cure disease is directed at what is perceived to be the most immediate and urgent threat. However, this source of energy is limited by resources (Leventhal et al., 1998).

2.2
This theory assumes development over time and so the individual is viewed as a dynamic agent. Three processes are distinguished - how illness is represented, coping, and evaluation. An additional presumption is that the way in which coping procedures are selected and carried out will be shaped by how the illness is represented, and that, in turn, the way in which illness is represented will be shaped by how coping procedures are undertaken and evaluated. The individual is thought to move through these stages again and again. Thus, the individual is seen as a learning system, because feedback loops allow the outcomes of evaluation to be fed back into the system.

2.3
Each of the three processes in this self-regulating system is subject to social influence. First, culture defines how illness is represented in that it categorises symptoms and diseases and views them in certain ways, and also issues slogans that favour specific self-care procedures. Second, the social context (of which, in addition to family members, friends and colleagues, healthcare professionals are a part) plays a mediating role, because it defines which constituents will be made available for scheme development and complaint management. Third, social comparison, in itself, is a source of information acquisition. Fourth, in actively appraising the relevance and reliability of their information sources, individuals are engaged in social interaction.

2.4
In system dynamics (Forrester, 1968; Richardson and Pugh III, 1981; Haefner, 1996), variables have to be selected in order to build a dynamic model. Then a causal diagram needs to be constructed to show the cause-effect relations between them. After that, equations representing these and other relations have to be determined and parameter values chosen.

2.5
Following this, we constructed a set of variables to represent the following concepts of the self-regulation theory: (fatigue) complaints, problem assessment, health-related (social) actions and recovery. Figure 1 shows the causal diagram that can be inferred, encompassing these concepts:

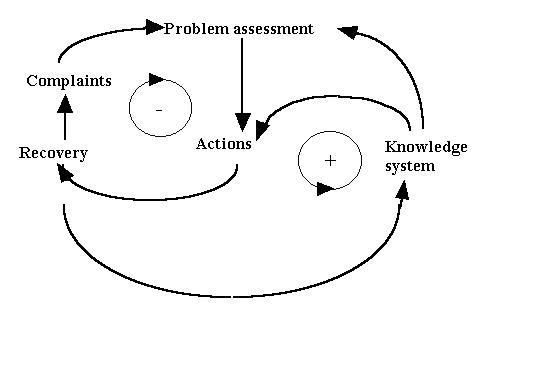
Figure 1. The basic causal diagram of our self-regulation model

2.6
In Figure 1, the representation process is shown as 'Problem assessment'. It is a product of the interaction between complaints (a concrete sensory level) and the knowledge derived from preceding attempts to reduce those complaints. The core of the coping process is represented under health-related 'actions'. These actions are triggered by problem assessment and will lead to recovery. 'Recovery' reflects the effects of the actions and the start of the evaluation stage. To keep the simulation model as simple as possible, the effects are assumed to be positive - both in the long run and on average. Our data allowed for this assumption. The knowledge system represents the initial memory structures regarding remedial strategies and illness schemata as acquired from the available cultural information and subsequent amendments to this information.

2.7
The diagram includes two of the main feedback loops in the self-regulation model. One is the 'complaints cycle', which leads from the complaints, via assessment of the problem, to actions and recovery and back into complaints again. This loop has a negative sign, because it is regarded as being self-inhibiting. The other loop is the 'knowledge cycle', which leads from recovery, through the knowledge system, into assessment of the problem and actions, and back again into recovery. This loop has a positive sign, because it is assumed to be self-reinforcing, though within limits. A natural ceiling is reached as soon as full knowledge is attained.

2.8
Because the data did not provide enough information about emotional processing, this diagram mainly highlights cognitive processing. The emotional part is confined to one concept - worrying - which influences problem assessment.

* Empirical Reference

3.1
The basis for our empirical reference was a data set derived from the representative Dutch National Health Survey of 1987. It consisted of single page paper-and-pencil diaries kept by respondents for a period of 21 days, in which they recorded in their own words any health problems (complaints) that they were experiencing at that time. In a pre-structured part they registered their assessment of these problems and the health-related actions they were taking to try and solve them. An excerpt from one of these diaries is shown below:

Table 1. An excerpt from a diary

3.2
The simulation model was based on a selection of complaints referred to here as 'fatigue'.

3.3
The sample used to build the simulation model consisted of the 254 respondents who had experienced fatigue or an associated problem for four days or more[1] during the period of measurement. The sample comprised 31.5% men and 68.5% women, 53.5% of whom were between 25 and 44 years of age, 34.3% were between 45 and 64, and 12.2% were older than 64. Among these, 41.6% had completed primary education, 40.3% secondary level and 18.1% post-secondary level education. This selection of individuals mirrored the section of the Dutch population that was trying to cope with complaints of fatigue. But, this sample was no longer representative of the total Dutch population.

* The Specification of the Model

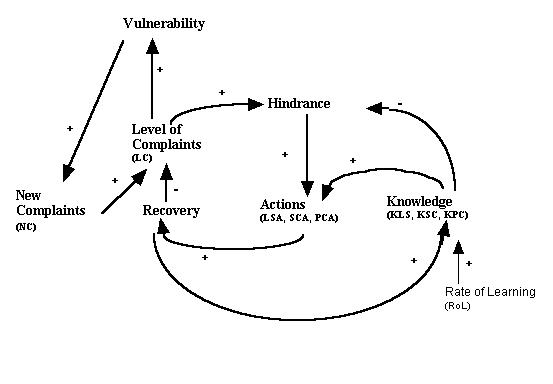
Figure 2. An extended causal diagram of the variables used in our model

Variables

4.1
The concepts in the causal diagram have been grouped into observed and unobserved (latent) variables by relating them, on the one hand, to the diary data, and, on the other, to our theory of self-regulation. Figure 2 pictures the causal relations between all these variables.

4.2
'Problem assessment' has been translated into the variable 'hindrance'. This was constructed as an observed variable rather close to our data; namely, as the mean between 'feeling irritated' and 'worrying', as reported in the diary.

4.3
'Actions' were translated into six observed variables that, according to disciminant analysis of the data, were relevant for the success of health-related actions. Subsequently, in line with an earlier Dutch study using the same range of health-related actions (van der Lisdonk, 1985), these variables were clustered into three latent variables: 'Life_style_actions' (LSA) - an aggregation of resting and doing; 'Selfcare_actions' (SCA) - talking and using home remedies; and 'Professional_care_actions' (PCA) - consulting a GP and using prescribed medicines. With this, we made explicit that a patient could choose different strategies and roles to fight the complaints.

4.4
The term 'complaints' has been interpreted as the accumulation of a number of complaints over a period of time. It was taken that an accumulation of four complaints was needed for a patient to be hindered enough to take action; a complaint on an ad hoc day was not considered enough to trigger action. The complaints, as reported in the diaries, have been modelled as the observed variable 'new complaints' (NC). The latent variable 'Level_of_complaints' (LC) represents the accumulation of those reports.[2]

4.5
'Recovery' was thought to indicate the lessening of complaints following health-related actions. It was specified as a latent variable indicating the disappearance of a complaint. In addition, on theoretical grounds, a 'vulnerability cycle' was postulated, expressing the insight that enduring complaints increase vulnerability, while vulnerability increases the chance of new complaints. As 'vulnerability' was not registered in the diary study, it is shown as a latent variable in the simulation model.

4.6
Knowledge follows when the success of actions has been evaluated. Thus, the variable, 'knowledge', is related to and constructed from the variables, 'complaints', 'action' and 'recovery', by a feedback cycle. As it was not reported as such in our diary study, this is also a latent variable. Parallel to the three kinds of action factors, three latent knowledge variables were included: 'Knowledge_about_lifestyle_actions' (KLS), 'Knowledge_about_selfcare_actions' (KSC) and 'Knowledge_about _professional_ care' (KPC). Their values range from 0 to 1.

Equations

4.7
Empirical data are necessary to link this model to the real world, and to validate it at face value. After this calibration phase, another set of data can be used to falsify or verify the model. When one enters into this process and the fascination of non-linear feedback cycles - starting with the theory - it is wise first to master the elementary mathematics of non-linear differential equations. Again, by doing experiments, software such as STELLA™ and MADONNA™ can be used to guide intuition to understand textbook mathematics (Verhulst 1990). We also recommend excursions into the domain of the natural sciences for those social scientists who take up the challenge of validating the model using statistical methods and with the help of empirical data (see also van der Zouwen and van Dijkum, 2001; Dijkum et al., 1998). Following the system dynamics approach, the causal relations between variables could be formalised using two kinds of equations: linear addition equations - eventually modified with logical 'if-then' statements - and difference or differential[3] equations.

4.8
According to the diagram, 'action' will lead to 'recovery', but it is doubtful whether every action will open up the same chance of recovery. Our data give an empirical indication: Figure 3 shows how likely it is that the different courses of action will contribute to the chance of recovery (Mens-Verhulst et al., 1999). According to discriminant analysis, these variables accurately predict 85% of the failures and successes of these actions.[4]

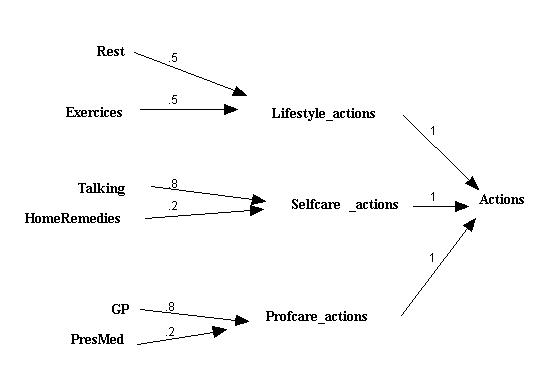
Figure 3. The action variables and their relative strengths
Numbers stand for weighting coefficients

4.9
With the aid of the weighting coefficients, the parameters of a number of linear equations could be determined, expressing how each action contributes to the chance of recovery. In other words, the model was calibrated according to our data.

4.10
Other linear 'if-then' equations were applied to modify the assumption that an action will follow only after a specific threshold of hindrance has been reached. The level of the threshold was determined by an empirical analysis of the linear relation between hindrance and a specific action. This gave rise to equations in which the threshold (showed in the 'if-then' statement) determines whether a specific health-related action will be carried out (value 1) or not (value 0). For example:

Equation 1

Rest = if Knowledge_Lifestyle=0 then round(.6*Hindrance_complaint) 
       else round( .6*Hindrance_complaint*Knowledge_Lifestyle)
Rest = if .4* Hindrance>=.5 then 1 
       else 0
However, it was assumed that the decision underlying the action will be influenced by the knowledge that someone has of its effects. Past success should increase the chance of it being re-used. This assumption has been modelled in an embedded 'if', by using the knowledge variables (KLA, KSC or KPC) as multiplier. An example of such an equation is:

Equation 2

Rest = if Knowledge_Lifestyle=0 then round(.6*Hindrance_complaint) 
       else round( .6*Hindrance_complaint*Knowledge_Lifestyle)

4.11
Difference equations were needed to express the time development implied in the feedback models inferred from causal relationships. (Forrester 1968; Haefner 1996; van Dijkum, 1998). Mathematically, it implies change in the value of a variable (Δvariable) after a time delay (Δt). For example, in principle, the LC was modelled with the following equation:

Equation 3

ΔLevel_of_complaints/Δt = New_complaints - Recovery

4.12
This equation produces an integer, because new complaints are observed as integer values only (because one does not have half a complaint), and, similarly, recovery means the disappearance, or not, of a complaint. Consequently, the variable LC shows discontinuity. Additionally, we modelled NC as a stochastic variable: it is a matter of chance whether a new complaint will arise or not.

4.13
The diagram in Figure 2 shows that NC is dependent on vulnerability and that, conversely, vulnerability is dependent on the LC. Expressed as simply as possible, we used vulnerability as a multiplying factor.

Equation 4


New_complaint=round[random(o,maximum*vulnerability] 

4.14
As a result, this fourth equation, plus the dependency of vulnerability on LC, is a (stochastic) difference equation. From a mathematical point of view, it is wise to express this in a simple linear stochastic difference equation. However, logical reasoning indicates (see Appendix 1) that according to the postulates in our (operationalised) theory, the simplest difference equation for the variable LC is a stochastic non-linear difference equation. This means that our model of self-regulation enters the field of non-linear mathematics and we have to be prepared for some surprises in how our model behaves.

4.15
A second linear difference equation was constructed for the positive feedback loop in the knowledge cycle, in order to represent the inhibited growth of knowledge. To cover the different foci of learning, three linear difference equations were used for the respective types of knowledge (KLS, KCS and KPC). Because, in the model, these linear equations were coupled to the non-linear difference equation, its variables will show non-linear behaviour. In the end, our model was mathematically expressed in 4 difference equations and 18 related, simpler linear equations (see Appendix 2).

The 'Rate of Learning' as a parameter

4.16
In the difference equations, knowledge variables are related to the recovery and action variables (see Appendix 2). This being so, one begins to question how rapidly changes in the recovery and action variables will be transformed into changes in the knowledge variables i.e. how fast the feedback will be between those variables. To express this variation in speed, we introduced our 'Rate of Learning' (RoL) parameter in the difference equations. This parameter is sensitive to a number of social, cultural and historical influences on the speed of learning, in addition to physical and psychological ones. More specifically:
  1. Physical condition: because of (chronic) ailments, the learning process may slow down;
  2. Learning capacity, i.e. intelligence. In particular, the ability to recognise patterns of symptoms and to evaluate action outcomes - in terms of adequacy of responses, representations and self-efficacy - will affect the tempo of the process;
  3. Available attribution patterns (prototypes, schemata) influence the speed of symptom appraisal;
  4. Coping capacity, i.e. the availability of health-related strategies will affect the speed in which information is processed and translated into actions.
  5. Coping resources, in the sense of important others (lay-persons or professional healthcare providers) define what opportunities there are for coping.

4.17
These factors, in turn, are dependent on sociobiological conditions such as age and gender and the resources to which they are linked. For example, an older age is known to enhance the availability of prototypes, knowledge through experience, and the tendency to attribute symptoms to age (Leventhal and Diefenbach, 1991; Bishop 1987). Gender differences are known to correspond with the categorization of complaints and with the choice of health-related actions; men, for example, mostly view fatigue as physical or neurological, while women interpret it mostly as psychological/psychiatric (Bishop 1987). In addition, the opportunity for trying particular actions and the presence of important others is unevenly distributed over the social categories. Moreover, both age and gender are subject to cohort effects.

4.18
Finally, disease history (of oneself or others), education in general and the influence of one's culture (the RoL) are important, because all these conditions influence the extent to which people can profit from feedback during self-regulation.

Software

4.19
To activate the model, we programmed it in two stages using model- and simulation software. STELLA™ was used to develop and build the model in the tradition of the feedback-loop modelling of system dynamics. Experiments with the model, which could not be carried out in STELLA™ because it was too slow for the many runs needed, were undertaken using the software MADONNA™.

* Simulation Experiments

5.1
Simulations of developments in fatigue (LC), health strategies (LSA, LSC, LPC) and knowledge levels (KLS, KSC, KPC) of an individual were conducted. That our model is able to identify a wide variety of individuals soon became clear by doing the simulation a hundred times.[5] Subsequently, the main parameter of the model, the RoL, was varied to give more insight into how the learning process influences the ways in which fatigue is self-regulated.

5.2
Figure 4 depicts how, during a period of 50 days, the LC of one simulated person rises and declines and how his or her LSA (for example, a combination of restful exercises) almost parallels a typical sequence of events showing the development in fatigue complaints (We chose a run of 50 days because, according to our experiments, this is the period during which the development of complaints and actions can be overviewed. If fewer days are used, something is missed; if a longer period is taken, no relevant pattern emerges.)

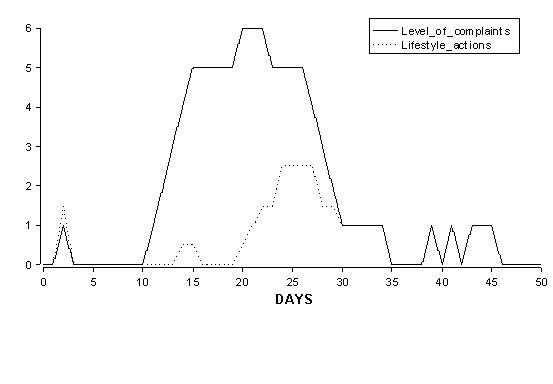
Figure 4. The changes in one individual of levels of complaint (LC) and lifestyle_actions (LSA) over a period of 50 days

5.3
This simulation output has face validity in that it is logically consistent with what one would expect by simply reasoning about health behaviour: action will be taken only after a period during which there have been more complaints than usual, and it will take some time before the effect of this action becomes visible. As such development is intelligible and has also been found in our empirical data our model is at least reasonable. It is validated in a qualitative way and at face value.

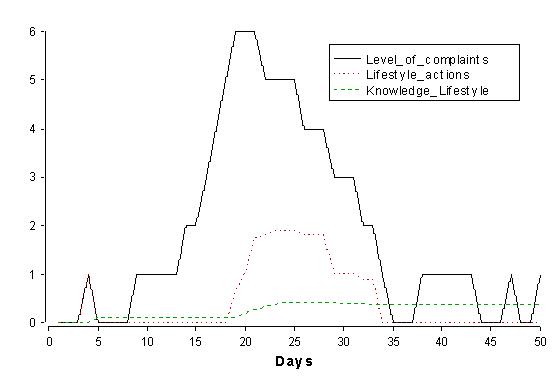
Figure 5. Changes in complaint levels (LC), Lifestyle_actions and Knowledge_Lifestyle for one individual over a period of 50 days

5.4
Figure 5 demonstrates further experimentation with the simulation model. It exhibits how: (1) complaints will evolve over time, after introducing changes in lifestyle; (2) knowledge about the effectiveness of this health strategy gradually increases.

5.5
On Day 4, an NC begins, but a health-related action on the same day has immediate success. For 14 days, the LC does not exceed 1, but then complaints begin to accumulate, reaching a maximum of 6 on the 20th day. LSA are undertaken in the meantime, starting on Day 19, and reaching a maximum of two actions a day on Day 22. Because of that, the LC gradually decreases, reaching 0 by Day 35, and alternating in the days thereafter between 0 and 1. The increasing KLS reflects the effectiveness of these actions.

Simulation of a hundred individual systems

5.6
When one repeats a simulation for an individual, one would expect the results to be the same. However with non-linear difference equations that is not the case.

5.7
The knowledge variables, which, in our model, are coupled to the non-linearity of the vulnerability cycle, will produce different outcomes each time, and not only because of the stochastic generator embedded in this cycle. The knowledge variables themselves are continuous in origin, but because of this coupling, they can show, more clearly than LC could have done, the discontinuities in the non-linearity of the outcome patterns, due to its discontinuous character.

5.8
Figure 6 shows the result of running the model a hundred times (with RoL 0.25) for KLS. It appears that the irregularities at the individual level constitute certain regularity in a group of individuals. According to our modelling, the underlying pattern is as follows. In the initial stage - when there is still little knowledge about the effectiveness of adopting changes in lifestyle to combat complaints (KLS) - the complaints (LC) bring about problem assessment (hindrance), and, after a while, also some action (LSA). Subsequently, the learning stage starts. Because of the success of the actions taken (as analyzed in our real data set), the KLS will increase and give rise to the repeated use of these LSA in the episodes that follow. During this self-amplifying process, learning is rapid (mainly within 25 days). Finally, somewhere between the 25th and 125th day, when progress in learning ceases, a stabilization stage sets in and the KLS reaches its ceiling.

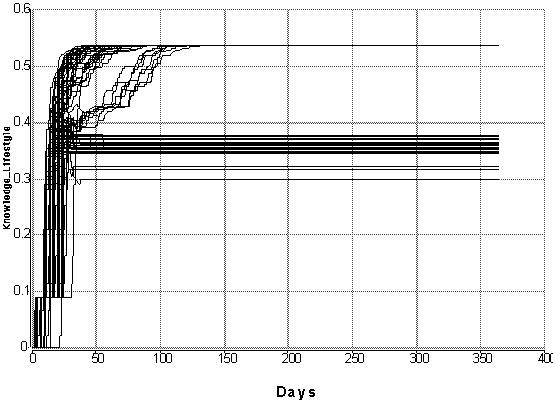
Figure 6. The 'Development of Knowledge' life style (KLS) of 100 individuals with a constant rate of learning of 0.25, for a period of a year

5.9
In general, the pattern depicted indicates that a group of people with a specific RoL will have a certain degree of success in combating their fatigue complaints, by taking a specific type of action. That is mirrored in the increase of knowledge as an indicator of success in combating complaints. This is no surprise, since the statistical analysis on which the model was calibrated states that, in the long run and on average, patients will be successful in combating their complaints. However, the simulation pattern also shows that not one, but a number of ceilings are involved. The development ends neither at a single predictable level of KLS, nor, accordingly, on a single predictable level of complaints (see Figure 6 again).

5.10
In more detailed simulation experiments with this phenomenon, manipulating the complaint generator reveals that this ramification into a number of different final ceilings results from small, arbitrary, initial differences between people, e.g., small differences in how new complaints are sequenced. Actually, this type of outcome is not unusual for non-linear stochastic models, because non-linear behaviour in a system means that some small arbitrary (possibly stochastic) fluctuations in initial conditions may result in various ranges of outcomes. From these experiments, one can conclude that the (externally observable) variation is internally produced by the non-linear feedback cycle. Thus, no additional explanatory variable or condition is necessary.[6]

Varying the rate of learning

Figure 7. The development in the level of knowledge about life-style (KLS) in a hundred people with different rates of learning
(The Y-axis differs in scale)

5.11
Figure 7 shows the developments in KLS and KSC for a set of a hundred individuals after varying the RoL. Notice that stochastic fluctuations can result sometimes (See: RoL = 0.2 and RoL = 0.125) in a momentary decrease of knowledge. However, on the average and in the long run, in agreement with was put in a statistical way in our model, patients are successful in combating their complaints. As a consequence knowledge will increase. Focusing on the role of the rate of learning: a slower RoL is apparent in the length of the learning stage required by people to arrive at a stable knowledge level. Moreover, this overview demonstrates how the number of stable knowledge ceilings at which patients can arrive may change when the RoL is varied. Comparing the fastest RoL (RoL = 0.5) with slower rates (RoL = 0.2, RoL = 0.125, RoL = 0.1), the number of stable knowledge ceilings is higher in the conditions listed last. It seems that a slower RoL results in a greater variation in the number of stable knowledge levels that a group of individuals can reach. Besides that, if the RoL is slower, more individuals will end on a lower level of knowledge. The quantitative variation of the RoL, therefore, is apparently linked to surprising variations in qualitative patterns.

* Discussion

6.1
The influence of the RoL parameter suggests that the interplay of physical, psychological, social and cultural variables is an important area that deserves further exploration. By modelling the influence of important others - lay-people as well as professionals - as a permanent factor rather than as a one-time impact, attention is drawn to their role in accelerating developments. Providing the time available for the learning stage is longer, they may function as a 'reinforcement machine', thereby instigating a greater number of stable knowledge ceilings. Where complaints are ambiguous and chronic, as in those to do with fatigue and dizziness, the probability of such extended learning periods is rather high. It should be noted, however, that this social 'reinforcement machine' does not ensure a more beneficial outcome of the self-regulation process. One of the reasons may be that, in our culture and contemporary medical profession, fatigue is usually interpreted as an acute physical complaint that can be cured by taking rest and avoiding activity. Unfortunately, although this strategy is adequate for normal physical fatigue, mental fatigue may, in fact, be aggravated by it because, in the longer term, inactivity itself causes sleep problems and physiological changes that reduce the capacity for activity (Sharpe and Bass, 1992), which leads to a cycle of fearing fatigue. The result is increased inactivity, growing social isolation and possible depression (Wessely and Nimnuan, 1999). In future studies, therefore, the RoL should be modelled in more detail, but first, the logic of how the RoL produces its patterns needs to be carefully investigated, and especially how it produces variation in the number of stable ceilings that patients can achieve.

6.2
The simplifications applied in our model are either empirically grounded or can be considered appropriate to this stage of the simulation project. We present them briefly here. The first simplification is the assumption that actions never give rise to new complaints. This is underpinned statistically by our selected data e.g. empirical base, because they indicate that, on average, actions do have effects. Also, from the point of view of individuals, and given the negative effects of staying in situations where there is too little stimulation (Rijk, 1999) and the added possibility of iatrogenic effects taking place as a result of professional actions, it would be more valid to assume that an action may also give rise to new complaints. Thus in such a model, knowledge may not only increase, but also decrease, and the feedback loop may become negative.

6.3
The second simplification is that the possibility of autonomous recovery has been omitted. Nevertheless, considering the difference equation involved by that component, it cannot be expected that this variable will fundamentally change the behaviour of the simulated model.

6.4
Compared with Leventhal's theoretical model of self-regulation (1984, 1990), there are two additional theoretical simplifications. One concerns the reduction in the number of feedback loops: according to the model, there should also have been a direct feedback loop from 'problem assessment' to 'complaints'. The other concerns the emotional processing that could be modelled more extensively. Only one variable for emotion was incorporated in this research and this was not imbedded in interaction with rational processing.

6.5
In addition, the simulation model could be extended to include the self, just as is sometimes suggested for the self-regulation model (Leventhal et al., 1980, 1984, 1998). To explore the social context, it would be interesting to extend the model to a gaming/simulation exercise (see also, van Dijkum and Landsheer, 2000).

6.6
Finally, the current simulation was based on data from people suffering from fatigue and associated complaints. However, different types of complaints, people, situations and cultures can be modelled by using other population characteristics as an empirical reference. All these possibilities may be systematically explored in subsequent simulation studies. At this phase of our research, our model is validated in a qualitative and global way. Actually, our validation should be considered more as calibration, with a focus on qualitative aspects. Of course, this process must be continued, in particular by testing on an independent longitudinal set of data, and by introducing sufficient statistics to validate the model in a quantitative way.

* What Can We Learn From System Dynamic Experiments?

7.1
In our empirical field of research (health psychology), we were surprised by the results of the simulation experiments. Little fantasy is required to realise that, in other domains of social behaviour, non-linear feedback cycles are possible. Although it is a struggle with existing static theories the reward is that fascinating patterns of chaos and order can be produced, and thereafter observed and identified in empirical data. Another positive aspect is that the theory will become much clearer.

7.2
The advantage of system dynamic experiments for social scientists is that it supports the intuitive idea of many social scientists that by identifying causes and effects in a description, in natural language, a mathematical model can be derived. A further plus point of system dynamics is that it combines qualitative with quantitative reasoning in an easy way. One does not need to be an expert in mathematics to express one's qualitative description of the dynamics of cause and effect relations (in a causal diagram) in valid differential equations. Software such as STELLA™ makes that possible.

7.3
Psychologists as well as social researchers who try to grasp the patterns of development processes can use this research approach to bridge the gap between more or less intuitive theories about, for example, cognitive learning, immigration and emigration processes in human populations, the dynamics of educational expansion (see van Dijkum et al., 2001), and the, sometimes surprising, facts about these phenomena as they are observed in the real world. Initially, the essential parts of the intuitive theory can be made explicit in a model by constructing a causal diagram.

7.4
Empirical data are necessary to link this model to the real world, and to validate it at face value. After this calibration phase, another set of data can be used to falsify or verify the model. When one enters into this process and the fascination of non-linear feedback cycles - starting with the theory - it is wise first to master the elementary mathematics of non-linear differential equations. Again, by doing experiments, software such as STELLA™ and MADONNA™ can be used to guide intuition to understand textbook mathematics (Verhulst 1990). We also recommend excursions into the domain of the natural sciences for those social scientists who take up the challenge of validating the model using statistical methods and with the help of empirical data (see also van der Zouwen and van Dijkum, 2001).


* Appendix 1

To assure that everybody has a chance on complaints, the minimum vulnerability has to be greater than zero (see: equation 4). Therefore, we more or less arbitrarily fix the minimum at 1/2. The consequence is that the multiplier effect of the variable is at minimum 1 /2 and at maximum 1. Secondly, it is argued that the more complaints somebody has (represented by the variable 'Level_of_Complaints') the more vulnerable s/he is. The most simple formula to express this relationship is:
Vulnerability  = Level_of_complaints
However, independent of the 'Level_of_Complaints', the maximum vulnerability will be 1 at the most. That means that - when vulnerability approaches the maximum of 1- the amount by which vulnerability is increased has to be near zero, also if the variable 'Level_of_Complaints' is very large. A simple mathematical expression which expresses this is:
Vulnerability = 1 - 1 / Level_of_complaints
This equation should imply that vulnerability will be at a minimum when the Level_of_complaints is zero. To achieve this, one has to amend the reciprocal relation into:
Vulnerability = 1 -  1 / (Level_of_complaints + x)
with such value of x that Vulnerability = 1 when Level_of_complaints = 0. The most simple equation which will be according these conditions is:
Vulnerability = 1-(1/(2+Level_of_complaints))
Combined with the equations:
Chance_on_Complaint=round(Random_complaints*Vulnerability) 
and
Random_complaints = RANDOM(0,1.5)
it at last leads to the difference equation:
ΔLevel_of_complaints / Δt = ROUND[RANDOM(0, 15) * (1 - (1 / (2 + Level_of_complaints))]


* Appendix 2

All the equations are in the notation of Dynamo (e.g. the software STELLA and Madonna)

(Time in days; dt is one day)

Level_of_complaints(t) = Level_of_complaints(t-dt) + (New_complaints - Recovery) * dt

INIT Level_of_complaints = 0

New_complaints = Chance_on_a_Complaint

Recovery = 
  if Level_of_complaints=0 then 0 
  else 
    if round(Profcare_actions+Selfcare_actions+Lifestyle_actions)>=1 then 1 
    else 0

Chance_on_a_Complaint = round(Random_complaints*Vulnerability)

Random_complaints = RANDOM(0,1.5)

Vulnerability = 1-(1/(2+Level_of_complaints))

Knowledge_Lifestyle(t) = Knowledge_Lifestyle(t - dt) + (Lifestyle_learning) * dt

INIT Knowledge_Lifestyle = 0

Lifestyle_learning = 
  if Total_response=0 then 0  
  else if Lifestyle_actions=0 then 0 
       else ((Lifestyle_actions/Total_response*Recovery -Knowledge_Lifestyle)/Rate_of_learning)

Knowledge_Profcare(t) = Knowledge_Profcare(t - dt) + (Profcare_learning) * dt

INIT Knowledge_Profcare = 0

Profcare_learning = 
  if Total_response=0 then 0 
  else if Profcare_actions=0 then 0 
       else ((Profcare_actions/Total_response*Recovery)-Knowledge_Profcare)Rate_of_learning)

Knowledge_Selfcare(t) = Knowledge_Selfcare(t - dt) + (Selfcare_learning) * dt

INIT Knowledge_Selfcare = 0

Selfcare_learning = 
  if Total_response=0 then 0 
  else if Selfcare_actions=0 then 0 
       else ((Selfcare_actions/Total_response*Recovery)-Knowledge_Selfcare)/Rate_of_learning

Rate_of_learning = 1

Hindrance_complaint = 
  if Knowledge_actions=0 then (Level_of_complaints*(1+Worry_complaint))*(2-Reason_complaint) 
  else (Level_of_complaints*(1+Worry_complaint))*(1+Knowledge_actions)*(1+Reason_complaint)

Knowledge_actions = (Knowledge_Lifestyle+Knowledge_Profcare+Knowledge_Selfcare) / 3

Reason_complaint = .4

Worry_complaint = .6

Rest = 
  if Knowledge_Lifestyle=0 then round(.6*Hindrance_complaint) 
  else round( .6*Hindrance_complaint*Knowledge_Lifestyle)

Exercices = 
  if Knowledge_Lifestyle=0 then round(.4*Hindrance_complaint) 
  else round( .4*Hindrance_complaint*Knowledge_Lifestyle)

Lifestyle_actions =(.5*Rest+.5*Exercices)

Talking = 
  if Knowledge_Selfcare=0 then round( .5*Hindrance_complaint) 
  else round(.5*Hindrance_complaint*Knowledge_Selfcare)

HomeRemedies = 
  if Knowledge_Selfcare=0 then round(.3*Hindrance_complaint) 
  else round(.3*Hindrance_complaint*Knowledge_Selfcare)

Selfcare_actions = (.8*Talking+.2*HomeRemedies)

GP = 
  if Knowledge_Profcare=0 then round(.2*Hindrance_complaint) 
  else round( .2*Hindrance_complaint*Knowledge_Profcare)

PresMed = 
  if Knowledge_Profcare=0 then round(.5*Hindrance_complaint) 
  else round(.5*Hindrance_complaint*Knowledge_Profcare e)

Profcare_actions = (.8*GP+.2*PresMed)

Total_response = Lifestyle_actions+Profcare_actions+Selfcare_actions


* Acknowledgements

We gratefully knowledge the anonymous reviewers who helped us to improve the article.


* Notes

1 One needs a sequence of at least four days to reconstruct the development of a fatigue problem by simulation.

2 Its theoretical maximum equals the number of simulated days.

3 Analytically viewed, it is easier to work with differential equations. However, with computer simulation, one works with difference equations, because computers have to operate with finite time steps.

4 Actually, the weights of the variables are inferred from unstandarized (linear regression) Betas of variables that discriminated between successes and failures of actions. The Betas were re-scaled for the clusters of (always positively interpreted) variables mentioned. The simulation model itself did not appear to be very sensitive to variation in these values.

5 The number 100 is quite arbitrary. It could also be 105. It is important, however, that the number is large enough to produce a qualitative interpretable pattern in the outcome, but not so large that it would take too much computer time. In any cae, the qualitative pattern of outcome is not sensitive to variations in the range of 100.

6 Prigogine (1980: 132) stated that in a critical region - near bifurcation - stochastic fluctuations drive the average. However, the pattern of the outcome has to be explained from the deterministic (internal) dynamics of the non-linear differential equations (e.g. p. 150). We are still exploring the intriguing combination of stochastic fluctuations and non-linear feedback cycles (see also Prigogine, pp. 123-127) to enable us to position our argument within the ongoing discussion about the relation between 'deterministic chaos' and 'stochastic fluctuation' (see also: Berliner 1992)


* References

BERLINER L.M. (1992). Statistics, Probability and Chaos. Statistical Science, 7(1), 69-122.

BISHOP, G.D. (1987). Lay conceptions of physical symptoms. Journal of Applied Social Psychology 17: 127 - 146.

DIJKUM C. van (1998). The validation of simulation models. In: E. Kerkhoffs and A. Bargiela (Eds.). Simulation Technology:Science and Art. Nottingham: Society of computer simulation, 221-224.

DIJKUM C. van, Tombe D. de, Kuijk E. van (Eds.) (1998). Validation of Simulation Models. Amsterdam: Siswo.

DIJKUM C van, and LANDSHEER H. (2000). Experimenting with a non-linear dynamic model of juvenile criminal behavior. Simulation & Gaming 31/4: 479-490.

DIJKUM C. van, LAM N., and GANZEBOOM H. (2001). The dynamics of educational expansion: A simulation model. In: F. Geyer and H. Zouwen van der (Eds). Sociocybernetics: Complexity, Autopoiesis, and Observation of Social Systems. (pp. 205-222). Westport: Greenwood Publishers.

FORRESTER J. (1968). Principles of Systems. Cambridge: Wright Allen Press.

HAEFNER J. W. (1996). Modeling Biological Systems: Principles and Applications. New York: Chapman & Hall.

LEVENTHAL, H. , MEYER, D. and NERENZ, D. (1980). The commonsense representation of illness danger. In: S. Rachman (ed), Medical Psychology, Vol.2: 2-30. New York: Pergamon.

LEVENTHAL, H., NERENZ, D. and STEELE, D.J. (1984). Illness Representations and Coping with Health Threats. In: A. Baum, S.E. Taylor and J.E. Singer (Eds.). Handbook of Psychology and Health, Vol. 4: 219-252. N.J.: ER/Baum,

LEVENTHAL, H. LEVENTHAL, E.A. and SCHAEFER, P.M. (1990) Vigilant coping and health behavior. In: M. Ory and R. Abeles (Eds.) Aging, Health and Behavior, pp.109-140. Baltimore: The John Hopkins Press.

LEVENTHAL, H. and DIEFENBACH, M. (1991). The active side of illness cognition. In: J.A. Skelton and R.T. Croyle (Eds.). Mental Representation in Health and Illness, pp.247-272. New York: Springer.

LEVENTHAL. H. LEVENTHAL, E.A. and CONTRADA, R. (1998) Self-regulation, health and behavior: A perceptual-cognitive approach. Psychology & Health 13/4: 717-735.

LISDONK, E.H. van de (1985) Ervaren en aangeboden morbiditeit in de huisartspraktijk. Thesis. Nijmegen, KUN

MENS-VERHULST, J. van and BENSING, J.M. (1998). Distinguishing between chronic and non-chronic fatigue, the role of gender and age. Social Science and Medicine 47/5: 621-634.

MENS-VERHULST, J. van, DIJKUM, C, van, KUIJK, E. van and LAM, N. (1999) . Dealing with fatigue: The importance of health-related action patterns. Patient Education and Counseling 36: 65-74.

PRIGOGINE I. (1980). From Being to Becoming. Time and Complexity in the Physical Sciences. New York: Freeman.

RICHARDSON G.P. and PUGH III, A.P. (Eds.)(1981) Introduction to System Dynamics Modeling. Cambridge MA: MIT Press.

RIJK,A. (1999). Fatigue in General-Practice Patients. An empirical study of fatigue in general practice and the development of the Quality-Quantity model for understanding fatigue. Thesis. Utrecht University.

SHARPE, M. and BASS, C. (1992). Pathophysiologica; mechanisms in somatization. International Review of Psychiatry 4: 81-97.

VERHULST F. (1990). Nonlinear differential equations and dynamical systems. Berlin: Springer Verlag.

WESSELY, S. and NIMNUAN, C. (1999). Functional somatic syndromes: one or many? Lancet 354/ 9182: 936-939.

ZOUWEN H. van der , DIJKUM C. van (2001). Towards a methodology for the empirical testing of complex social models. In: H. van der Zouwen and F. Geyer (eds.), Sociocybernetcs: Complexity, Autopoisis, and Observation of Social Systems, pp. 223-240. Westport: Greenwood Publishing Group.

----

ButtonReturn to Contents of this issue

© Copyright Journal of Artificial Societies and Social Simulation, [2002]