© Copyright JASSS


Andre Costopoulos (2001)
Evaluating the impact of increasing memory on agent behaviour:
Adaptive patterns in an agent based simulation of subsistence
Journal of Artificial Societies and Social Simulation
vol. 4, no.4
<https://www.jasss.org/4/4/7.html>
To cite articles published in the Journal of Artificial Societies and Social Simulation, please reference the above information and include paragraph numbers if necessary
Received: 10-Sep-01
Published: 31-Oct-01
 Abstract
-
This is an interim report on a set of ongoing agent-based simulation experiments. The main goal of the experiments is to evaluate the impact of varying memory capacities on the ability of agents to adapt to given subsistence environments and resource landscapes. The results so far suggest that increasing the number of events which an agent can use in decision making does not directly lead to an increase in the agent's ability to adapt to an environment. Variable memory capacity, however, does lead to diversification of agent behaviour patterns in a given environment. The results also suggest that more permissive environments allow agents with greater memory to show a greater diversity of behaviour than similar agents in more restrictive environments. These early results are providing the starting hypotheses which are at the core of a larger set of experiments presently being carried out. The simulation engine and source code are available from the author.
- Keywords:
-
multi-agent simulation, subsistence, agent cognitive systems
Introduction
- 1.1
- Computational approaches to the study of human physical and social processes have the potential of allowing us to both quantify and intuitively understand the deep patterning which characterizes the organisation of human societies. Because Anthropology typically deals with relatively small and low-density populations in which stochastic effects can be severe and in which kinship rules restrict mate choice, such computational approaches have a long history in the discipline (Dyke 1981). Brues' (1954) pioneering exploration of blood group evolution using a method of "experimental calculations" opened the way for the computational investigation of human small population dynamics (Kunstadter et al. 1963, Wobst 1974). More recently, agent-based models have come into use because they allow the exploration of the relationship between individual decision making and group organisation (Read 1998). Useful reviews of computational approaches to Anthropological problems can be found in Dyke (1981) and Aldenderfer (1991).
- 1.2
- Long-term changes in cognitive ability are mainstays of scenarios of human evolution. Cognitive complexification appears as either cause, consequence, or as part of complex feedback mechanisms in most scenarios. Yet few, if any, computational studies explicitly consider the role and impact of cognitive variability within an ancestral population. The nature and configuration of human cognition is likely one of the fundamental factors which allow the emergence of such regularities as seasonally stable subsistence strategies and socially stratified distribution of labour, among a great many others. Relative to other living forms, humans share a very high capacity for two particular cognitive processes: remembering and anticipating. These shape the reactions and inform the decisions which give rise to essentially human adaptive strategies and forms of social organisation. Any agent-based simulation of human behaviour must therefore pay particular attention to agents' capacity to remember events and to anticipate outcomes based on past experience. However, these are two of the most intractable aspects of the human experience, and there is so far no systematic understanding of their impact on human adaptation and on the evolution of social organisation.
- 1.3
- This paper is an interim report on a course of agent-based computer simulation experiments which will allow a preliminary quantification and an understanding of the impact of varying the number of "events" to which agents have access when making daily decisions about mobility and the allocation of labour. These experiments are being run using an existing simulation engine originally developed for my dissertation (Costopoulos 1999) and elaborated upon since then. I have recently completed a "scale-model" version of these full-scale, ongoing experiments. The results of these initial experiments have proved important in structuring the larger project. Here I present these, along with some early conclusions. These early conclusions in fact do no more than bring the issues involved in the full project into sharper focus.
The Simulation Engine: A brief overview
- 2.1
- This engine was programmed using Borland C++ and runs under all versions of the Windows operating system. The overview presented here is radically simplified. A fuller treatment of the engine's design and mechanics is available from the author. The engine creates an artificial topography and hydrographic network, certain attributes of which can be set by the user. Sets of subsistence and technological resources are then created whose abundance and distribution vary seasonally and vertically with altitude. Each subsistence and technological resource can also occur in one of three habitats: marine, riverine, or terrestrial. Technological resources are divided into 5 types (figure 1), each representing a different technological potential. Each subsistence resource may require for its extraction the expenditure of technological resources from none, some, or all of the technological resource types.
|
| Figure 1: Sample matrix of extraction cost for 5 subsistence resources (rows). Each column represents a type of technological resource. Each technological resource belongs to one type. Each technological resource also has a durability modifier which is applied to the base cost according to the subsistence resource being extracted |
|
| Res | T0 | T1 | T2 | T3 | T4 |
| 0 | 0.00 | 0.00 | 0.00 | 0.00 | 0.00 |
| 1 | 0.27 | 0.00 | 0.00 | 0.96 | 0.00 |
| 2 | 0.00 | 0.00 | 0.63 | 0.68 | 0.85 |
| 3 | 0.00 | 0.00 | 0.00 | 0.00 | 0.00 |
| 4 | 0.00 | 0.00 | 0.00 | 0.00 | 0.00 |
| 5 | 0.05 | 0.00 | 0.08 | 0.00 | 0.00 |
|
- 2.2
- The landscape generator is adapted from Phillips (1999). Landscapes are generated from a variable number of seeds which each have an altitude and a rate of radial fall-off (an exponent >0 and <1). The altitude of any single point on the map at any resolution can be determined as the average of all the altitudes z generated by all seeds at that point, where z is expressed by
z = Ie-ld
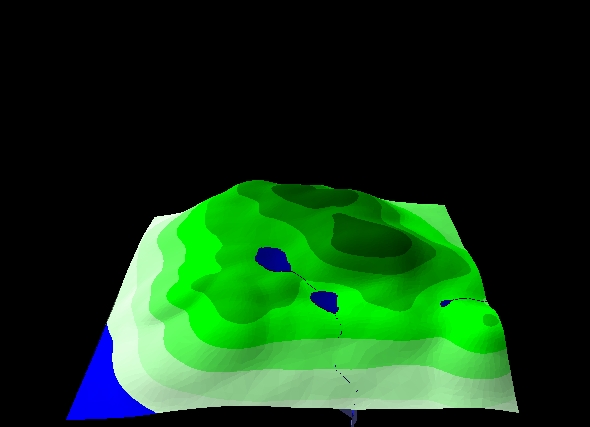
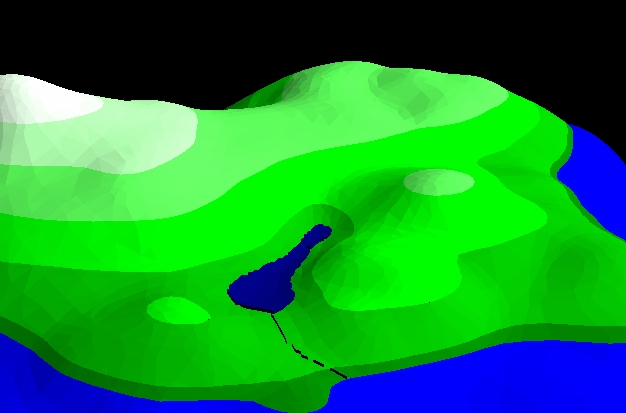
where I is the initial relief of the landscape, l is the fall-off exponent (damped by a user defined value) and d is the distance between the point and the seed generating the altitude z (also damped by a user defined value). The user defines the extent to which seeds will be clustered as well as the sea level and the density of the hydrographic network. The result is a flexible, simple, and scale independent terrain generation engine which can be used to create DEMs which approximate the characteristics of a variety of real-world landscapes (figure 2, figure 3).
|
|
Figure 2. Sample landscape 1
|
|
|
Figure 3. Sample landscape 2
|
- 2.3
- Each iteration (a "day" in a 360 day "year"), agents examine their physical surroundings, take some actions and make decisions. The actions include locating patches of technological and subsistence resources within a user defined location radius, procuring technological resources, extracting subsistence resources, expending technological resources, storing subsistence resources, and exploiting stores (figure 4). Agents make two main types of decisions:
- Whether located patches of subsistence and technological resources are of desirable size and type; agents have certain tolerances for the procurement and extraction of various individual resources.
- Whether or not to move at the end of the iteration, and if so how far away and in which direction.
- 2.4
- It is in the context of the mobility related decisions that memory plays an important role. Each agent's memory records "events". An event is made up of an action (extraction only, for now), a location in space (x,y), a location in time (sin(kt)), a resource ID, and a quantity. Agents have pre-dispositions which restrict the quantities which may make an impression on them, and how far removed in time they can be from the event in order for it cause a positive action. This distance is not absolute (t2 - t1) but relative (sin(t2) - sin(t1)). In other words, agents react to the time of year, rather than to the number of years separating them from an event.
- 2.5
- For the purposes of the current experiment, agents are created with 0-4 memory slots, each of which can contain a single event. Furthermore, the events stored are limited to extraction of subsistence resources. The agents have tolerances for time distance from remembered events. These range from 0 to 180 days. They also have tolerances for minimum extraction quantity which range from 1-100% of the user defined daily satisfaction level. An event is stored in memory if the resource quantity associated with it exceeds the quantity associated with the event presently stored in the active memory slot.
- 2.6
- At the end of each iteration, each agent examines the events in its memory (if any) and determines whether any of them are "attractive" (i.e. whether they represent a large enough extraction of a favoured resource at some reasonable distance, spatial and temporal, in the seasonal round). If such an event is found in memory, the agent will attempt to move toward it. If no such event is found, the agent will move in a random direction. Whether random or purposeful movement is used, the distance travelled will be inversely proportional to the quantity of subsistence resource extraction performed during the current iteration. Beyond a certain satisfaction level, an agent will not move at all.
|
| Figure 4: Typical agent behaviour record |
|
| Agent | Date | MSize | xPos | yPos | Event | Target | Quantity |
| 5 | 0 | 4 | 249 | 215 | Locate | 10 | 0.03 |
| 5 | 0 | 4 | 249 | 215 | Procure | 10 | 0.03 |
| 5 | 0 | 4 | 249 | 215 | Locate | 2 | 3.88 |
| 5 | 0 | 4 | 249 | 215 | Move | 1 | 4524.77 |
| 5 | 1 | 4 | 244.57 | 216.77 | Locate | 19 | 6.43 |
| 5 | 1 | 4 | 244.57 | 216.77 | Procure | 19 | 6.43 |
| 5 | 1 | 4 | 244.57 | 216.77 | Locate | 13 | 0.84 |
| 5 | 1 | 4 | 244.57 | 216.77 | Extract | 13 | 0.8 |
| 5 | 1 | 4 | 244.57 | 216.77 | Locate | 13 | 0.84 |
| 5 | 1 | 4 | 244.57 | 216.77 | Extract | 13 | 0.8 |
|
Analysis of 4 runs
- 3.1
- The object of the following analysis will be to identify the nature of the impact of variable memory capacity on agent behaviour. I will use large-scale quantitative comparison of results between runs, and between agents within runs. However, the simulation is detailed enough that I can also consider individual agent "life-histories" in order to shed light on the small scale patterns which give rise to the large scale quantitative differences.
- 3.2
- Briefly put, the analysis of the data suggests that memory size has an impact on agent adaptiveness only in some resource contexts. However, one of the more interesting results of this preparatory study is that variations in agent memory configuration seem to have a more significant effect on the behavioural pattern of agents than on the success of their behaviour as measured by subsistence resource extraction. Agents with similar cognitive characteristics seem to behave in similar ways.
- 3.3
- It goes without saying that these results are highly preliminary and based on a very small sample of agent behaviour in a restricted number of simulated physical contexts. Each of the four runs required approximately 20 hours of processor time on a PIII 600 Mhz with 256 Mb RAM. The runs varied in length between 1622 iterations and 2879. In all cases, 40 agents were created, and the natural environments consisted of 20 subsistence resources and 20 technological resources. All topographies, all subsistence and technological resources, the relationship matrix between the former, and all sets of agent propensities were created randomly.
- 3.4
- The larger scale experiments now being carried out in response to these preliminary results consist of 10 runs, each involving 200 agents. They are being performed on a dual 1 gigahertz processor machine with 1 gigabyte RAM. The average 3600 iteration run, with 200 agents, takes 90 minutes. This is a considerable improvement over the conditions under which the present analysis was conducted and will result in much greater depth and detail in the final report.
Quantitative differences between runs
- 3.5
- I will first discuss whether or not agent memory configurations (number of slots, tolerance for patch size, tolerance for distance in time from an event) has any impact on the ability of agents to adapt to a particular resource context. The correlation matrix below (figure 5) shows that overall, of the three memory configuration variables, only memory size seems to have had a significant impact on agent adaptiveness, as measured by the quantity of subsistence resources extracted per iteration.
|
| Figure 5: Correlations: four runs combined. MinQ is the quantity threshold, timeD is the time distance threshold, avgX is the average extraction per day per agent |
|
| | MEMSIZE | MINQ | TIMED | AVGX |
| MEMSIZE | Pearson Correlation | 1.000 | .025 | -.142 | .320 |
| | Sig. (2-tailed) | . | .767 | .085 | .000 |
| | N | 147 | 147 | 147 | 147 |
| MINQ | Pearson Correlation | .025 | 1.000 | -.014 | .007 |
| | Sig. (2-tailed) | .767 | . | .864 | .929 |
| | N | 147 | 147 | 147 | 147 |
| TIMED | Pearson Correlation | -.142 | -.014 | 1.000 | -.052 |
| | Sig. (2-tailed) | .085 | .864 | . | .530 |
| | N | 147 | 147 | 147 | 147 |
| AVGX | Pearson Correlation | .320 | .007 | -.052 | 1.000 |
| | Sig. (2-tailed) | .000 | .929 | .530 | . |
| | N | 147 | 147 | 147 | 147 |
|
- 3.6
- When the analysis is repeated independently for each run however, one finds that the impact of memory size is not generalized. The correlation between extraction and memory size is significant in runs 1 and 4 (r = 0.312, sig 0.05 and r = 0.689, sig 0.000, respectively) while it is not significant for runs 2 and 3 (and r = 0.277, sig 0.083 and r = 0.011, sig 0.958, respectively). None of the runs show significant correlations between minimum quantity, maximum time distance, and extraction.
- 3.7
- There is a wide range of resource contexts represented in the 4 runs. Figure 6 shows the abundance vs extraction cost (see Appendix A) of the subsistence resources for all 4 runs. It is obvious that the agents of run 3 faced a daunting task, while those of run 4 had a fairly easy time of it. The run 3 resource context was highly restrictive, while the run 4 context was very permissive. Runs 1 and 2 fall somewhere in between.
|
|
Figure 6. Resource abundance vs extraction cost, per run
|
- 3.8
- We can conclude from these observations that the relationship between resource context permissiveness and the importance of memory size is not a simple one. Runs 4 (very permissive) and 1 (somewhat permissive) show a significant correlation between memory size and agent success. Runs 2 (somewhat permissive) and 3 (highly restrictive), on the other hand, show no such correlation. While it does seem that more permissive environments might allow more scope for agent memory to have an impact on adaptiveness, two roughly equivalent environments differ in the impact of memory size.
- 3.9
- Interestingly, one would intuitively expect memory size to have the greatest importance in conditions of scarcity and in restrictive environments. This might yet turn out to be the case. However, the preliminary runs point to the possibility that more complex cognitive processes allow an organism a significant advantage over others in a permissive rather than restrictive environment. It is tempting, on the basis of these results, to make a similar argument about social complexity.
Agent Behaviour
- 3.10
- The number of directed, rather than random, agent moves during a run can be used as a rough index of the importance of the role played by agent memory during that particular run. The summary of runs table (figure 7) shows that run 1 had by far the greatest incidence of non-random (or directed) agent movement. I will focus on run 2 however, since it shows an incidence of directed movement roughly as high as that of run 4, without showing the correlation between memory and success which is present in run 4.
|
| Figure 7: Summary of Runs |
|
| Event | Per Iteration | Total |
Run1
2171 iterations | Extract | 57.338 | 124480.20 |
| Store | 4.874 | 10581.58 |
| NonRndMov | 1.041 | 2260 |
Run2
2637 iterations | Extract | 62.949 | 165995.90 |
| Store | 0.659 | 1738.39 |
| NonRndMov | 0.353 | 932 |
Run3
2879 iterations | Extract | 0.758 | 2183 |
| Store | 0.018 | 53.12 |
| NonRndMov | 0.002 | 7 |
Run4
1622 iterations | Extract | 194.244 | 315064.00 |
| Store | 44.359 | 71950.15 |
| NonRndMov | 0.483 | 783 |
|
- 3.11
- As the Range of Extraction per Iteration (figure 8) table clearly shows, there is in run 2 a wide overlap of success by agents of various memory classes. It also shows that the most successful agent was in the middle of the memory size distribution and that overall, at least some agents of each higher memory class (2-4) were more successful than all agents of the lower memory classes (1-2). This is a rather complex picture, and we must turn to individual agent behaviour within the run in order to shed some light.
|
| Figure 8: Range of Extraction per Iteration |
|
| Run 2, Range of Extract success per memory class |
| 0 | Min Extract/iteration | 0.95 |
| Max Extract/Iteration | 1.42 |
| 1 | Min Extract/iteration | 1.16 |
| Max Extract/Iteration | 1.41 |
| 2 | Min Extract/iteration | 0.43 |
| Max Extract/Iteration | 4.13 |
| 3 | Min Extract/iteration | 0.46 |
| Max Extract/Iteration | 3.01 |
| 4 | Min Extract/iteration | 1.20 |
| Max Extract/Iteration | 3.94 |
|
Run 2, Agent 1
- 3.12
- Agent 1 had the greatest success in run 2 with an average extraction per iteration of 4.13 units. It had 2 memory slots, and yet this enhanced memory capacity played no role in its success. Agent 1 had a very high quantity threshold of 93% of the daily satisfaction level, or 4.65 units per iteration for this group of four runs. Agent 1's largest extraction event was of 3 units. As its average extraction per iteration implies, it frequently extracted more than 3 units per day, but this total was made up of the extraction of several smaller patches. No single extraction event, therefore, caused agent 1 to make mobility decisions. It moved randomly throughout the run.
- 3.13
- The source of this agent's success lay rather in the fortunate resource context in which it found itself. It specialized in the extraction of subsistence resource (SR) 7, which made up well over 99% of its subsistence over the course of the run. This resource was terrestrial and available year round, with an optimal altitude of 88 metres and a wide vertical distribution. While it was available year round in a range of environments, it never occurred in any great quantities and even at peak distribution, the patches it formed were quite small and scattered. This is because it had a low base value (0.28) and its patch modifier was modest (0.5). It also was a rather costly and complex resource to extract, requiring the expenditure of varying amounts technological resources of type 0 and 1. Type 0 technological resources were not a problem in agent 1's environment. Three were available year round in terrestrial environments, and a fourth had a shorter seasonal occurrence in coastal regions. Agent 1 never approached the coast, however, and procured amounts of the three terrestrially available Type 0 technological resources.
- 3.14
- Type 1 technological resources were potentially a limiting factor in this particular resource context. Three were present in the entire system, 1 of which, technological resource (TR) 2 was available year round in terrestrial environments. The other two had much more restricted distributions, one of which being available year round but in riverine contexts only, and the other having a very seasonal distribution in marine contexts only. TR2 had the advantage of being available in the same context as SR7, and furthermore it was extremely durable. It had a durability modifier of less than 0.01. Given the length of this run, it essentially never wore out under use.
- 3.15
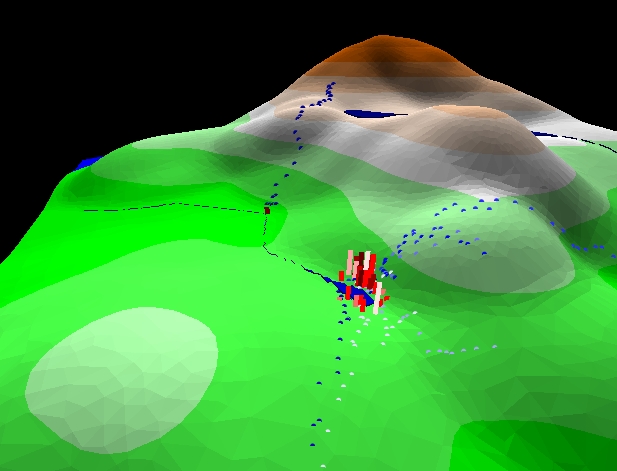
- Spatially, agent 1's behaviour shows no clear pattern other than the random walk (figure 9, figure 10), with the distance of individual legs constrained by daily success in extraction. It intensively exploited small areas during the peak distribution of SR7 and covered larger distances in random directions when SR7 was less abundant. In fact, at SR7 peak, agent 1 was so successful that it could afford to be semi-sedentary. It is quite conceivable that agent 1 could have wandered outside the territory in which the combination of SR7 and TR2 provided a readily available subsistence.
|
|
Figure 9. Agent 1's extraction track; darker shades indicate later events, bar height reflects quantity extracted
|
|
|
Figure 10. Extraction pattern for agent 1; dark blue line shows the daily distance to the point of greatest extraction and shows periods during which agent 1 is sedentary. The close agreement between the extraction pattern (dark grey line) and SR7's seasonal distribution (purple line) shows agent 1's heavy reliance on SR7
|
Run 2, Agent 14
- 3.16
- The behaviour of agent 14 (figure 11, figure 12), also of run 2, offers a very interesting and illuminating contrast to the behaviour of agent 1. First, they shared the trait of having a very high threshold for quantity extracted. Agent 14 did not act on a memory which was associated with a quantity smaller than 93% of the daily satisfaction level. Second, like agent 1, agent 14 had two memory slots, but whereas agent 1 had great success and did not use directed movement, agent 14 had somewhat more moderate success (1.36 average extraction, vs 4.13 for agent 1) but displayed a spatially highly structured pattern of subsistence.
- 3.17
- Agent 14 relied heavily on SR13, a riverine resource available year round, but extracted it only at some times of the year. Because SR13 was much more abundant than SR7 at peak distribution (base value 0.81 vs 0.28), agent 14 experienced individual extraction events large enough to make an impression on it. However, since the maximum patch value of both resources was identical at 0.5, patches of SR13 occurring at non-peak times were not large enough to cause agent 14 a significant memory. This explains why agent 14 wandered despite the fact that it consistently and at regular intervals returned to the area in which it had early on extracted a large quantity of SR13.
|
|
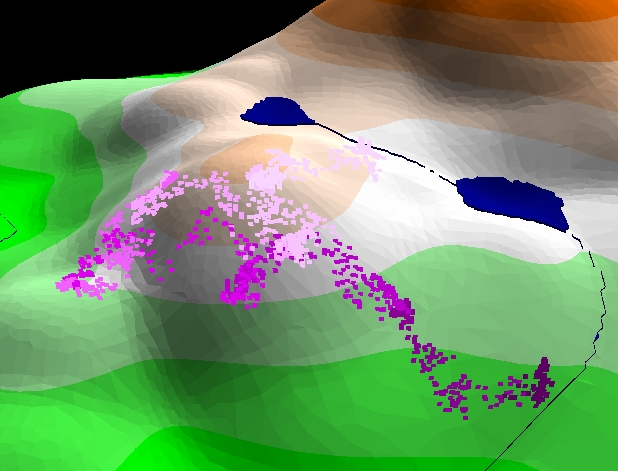
Figure 11. Agent 14, extraction track for SR13; darker shades denote later events. Bar height indicates magnitude of extraction. Rounded dots indicate directed (non-random) movement events. This spider leg pattern occurs when periods of random walking alternate with more organized episodes of directed movement aimed at a particular resource extraction point
|
|
|
Figure 12. Extraction pattern for agent 14; dark blue line shows that agent 14 regularly returns to the point at which it experienced an early, high yield extraction event associated with SR13. This event happened to coincide with the onset of peak distribution for SR13. However, the pattern is far from optimal, as SR13 was available in much larger quantities elsewhere. See below for a discussion of the late run departure from the established pattern
|
- 3.18
- It is interesting to note that SR13 was much more abundant at all times around the higher elevation lake in the background of the figure. However, agent 14 never happened to extract any of that resource at that spot, even though it travelled close to it in the late stages of the run. It is clear that it was there before peak time for SR13, since it begins its trek down the slope in order to return to the lower lake where, because of events stored in memory, it can expect larger patches than are available at higher elevation at that moment.
- 3.19
- Here, an apparently innocuous event has quite fundamental implications for the design of the simulation. On its last trip before the end of the run agent 14 never makes it back to the lake, since it bumps into the river where equivalent quantities of SR13 are available near the onset of peak distribution. After exploiting the river edge during the SR13 peak, it wanders away again. In effect, agent 14 now has a baseline to which it could have returned the next year, rather than just a point or cluster of points. The river itself, as a linear concentration of subsistence and technological resources, has now acquired a certain epistemological status in agent 14's very simple cognitive system. During the (ongoing) design of this simulation, I often struggle against the idea of including linear information (y = mx + b) as explicit structures in agent memory. On the basis of this result, I will suggest that such linear structures are unnecessary (and therefore superfluous and possibly undesirable), as they seem to emerge quite naturally from point based information once the agent has access to more than one point.
- 3.20
- The extraction of SR13 was even more complex and costly than that of SR7, requiring the expenditure of technological resources of types 0, 1, and 3. In our discussion of agent 1, we determined that types 0 and 1 were readily available. Type 3 technological resources presented no problem for agent 14, accounting for 8 of 20 technological resources in this particular resource context. They were distributed in all three habitats, and collectively available at various times of the year. During the run, agent 14 extracted various amounts of 3 technological resources of type 3, one of which (TR4) was extremely durable.
Conclusion
- 4.1
- The large-scale quantitative comparisons between runs presented here are somewhat inadequate. They are based on a mere four runs of the simulation. They do, in spite of this, allow us to form certain expectations as to what sorts of results a more adequate sample would produce. Such expectations are a good starting point for an experimental programme aimed at evaluating them.
- 4.2
- On the other hand, the analysis of individual agent behaviour presented in these pages merely scratches the surface and does no more than hint at the small scale patterns from which larger regularities emerge. These four runs, after all, included a total of 160 agents who deposited a record of their behaviour for thousands of iterations.
- 4.3
- I am presently increasing the amount of data available for large-scale quantitative comparison and developing finer and more comprehensive studies of individual agent behaviour. My overall aim is the expansion of this analysis, focusing on the relationships between agent cognition and agent success, and individual behavioural patterning and overall system regularity.
- 4.4
- This particular project constitutes the final step in the preparation for inclusion in agent cognitive systems of a wider range of types of events, including those related to reproductive resources and exchange of resources between agents.
Appendix A : Resource abundance and extraction cost
-
I always attempt to use modelling which is as generative as possible. This means allowing behaviour to emerge from the interaction between elements of the model, rather than merely describing and imposing that behaviour on agents. I therefore do not include any explicit descriptive models of resource abundance and extraction costs. These are categories which must be constructed for analytical purposes and whose value must be determined based on the information available in the generative model.
Resource abundance at any point on the map (for both subsistence and technological resources) is calculated using a current time of year (sin(kt)), a day of the year at which the resource is at peak distribution, a Gaussian fall-off function y = e^-kx^2 which determines the shape of the seasonal distribution, a base value for the resource's overall distribution, and a patch modifier for the local availability. There is also a habitat factor and a vertical fall-off function. Some resources are available only in certain altitude bands, the width of which is determined by an exponent k, as in the fall-off function used for seasonal distribution. In addition, some resources are available only near the coast while others are available only at major lake and river systems.
It is therefore entirely possible (but unlikely) that a resource which is indicated as being abundant on the graph is in fact nearly absent from the resource context. For example, this resource could be available only at lakesides within 50 metres altitude of 150 m.a.s.l., while no such lake exists on the map for a particular run.
The other factor which could lead to this situation is related to extraction cost. Some subsistence resources, in order to be extracted by agents, require the expenditure of certain amounts of various technological resources of certain types. Technological resources have distributions which are calculated like those of subsistence resources. They are also assigned a "technological type", and a durability modifier.
The extraction cost graph represents the following calculation: Sum of the expenditure requirements for all five technological resource types, multiplied by the number of types required for extraction.
Therefore, the larger the total quantity of expenditure required, and the more complex the operation (i.e. more different types required), the more costly the extraction is considered to be. There are several difficulties with this method of calculation. Each technological resource, as stated above, has a durability modifier. Therefore, two different individual resources belonging to the same type, and so fulfilling the same extractive role, can result in radically different cost structures. There is also the obvious problem of the distribution of individual technological resources themselves. Here again, there is the possibility that an apparently inexpensive subsistence resource may turn out to be impossible to extract if the technological resources required are nowhere to be found or extremely rare.
One of my short-term goals is the production of a more comprehensive system of extraction cost measurements, which will allow much better comparability between resource contexts generated for different runs. But no matter how detailed the accounting system, there will remain, as in the real world, the problem of environmental and contextual variability within runs. Because their initial contexts vary vertically, horizontally, and in terms of access to the three basic habitats (terrestrial, riverine, marine), individual agents will experience different extraction costs for the same resource and may in fact experience radically different cost structures.
References
-
ALDENDERFER M S (1991), "The Analytical Engine: Computer simulation and archaeological research", Archaeological method and theory, Vol. 3, pp 195-247.
BRUES, A M (1954), "Selection and Polymorphism in the A-B-O Blood Groups, American Journal of Physical Anthropology, December 1954, pp 559-599.
COSTOPOULOS, A (1999), Modeling and Simulation for Anthropological Archaeology: the logic of long-term change, Ph.D. Dissertation held at Oulu University, Finland.
DYKE, B (1981), "Computer simulation in anthropology", Annual review of anthropology, Vol. 10. pp 193-207.
KUNSTADTER P, Buhler R, Stephen F and Westoff C F (1964), "Demographic Variability and Preferential Marriage Patterns", American Journal of Physical Anthropology, Vol. 21, pp 511-519.
PHILLIPS, J.D. (1999), Earth Surface Systems: Complexity, Order, and Scale, Blackwell Publishers, Malden Massachusetts.
READ D W (1998), "Kinship Based Demographic Simulation of Societal Processes", Journal of Artificial Societies and Social Simulation vol. 1, no. 1, <https://www.jasss.org/1/1/1.html>
WOBST H M (1974), "Boundary conditions for paleolithic social systems: a simulation approach", American Antiquity Vol. 39 (2), pp 147-78.
 Return to Contents of this issue
© Copyright Journal of Artificial Societies and Social Simulation, [YEAR]