© Copyright JASSS


Ramzi Suleiman and Ilan Fischer (2000)
When One Decides for Many: The Effect of Delegation Methods on Cooperation in Simulated Inter-group Conflicts
Journal of Artificial Societies and Social Simulation
vol. 3, no. 4,
<https://www.jasss.org/3/4/1.html>
To cite articles published in the Journal of Artificial Societies and Social Simulation, please reference the above information and include paragraph numbers if necessary
Received: 6-Jul-00
Accepted: 23-Sep-00
Published: 31-Oct-00
 Abstract
-
The study explores the evolution of decision strategies and the emergence of cooperation in simulated societies. In the context of an inter-group conflict, we simulate three different institutions for the aggregation of attitudes. We assume that: (a) the conflict can be modeled as an iterated Prisoner's Dilemma played by two decision makers, each representing her group for a fixed duration; (b) the performance of each group's representative influences her group members and, consequently, her prospects to be reelected. Our main objectives are: (1) to investigate the effects of three power-delegation mechanisms: Random Representation, Mean Representation, and Minimal Winning Coalition representation, on the emergence of representatives' decision strategies, (2) to investigate the effect of the frequency of elections on the evolving inter-group relations. Outcomes of 1080 simulations show that the emergence of cooperation is strongly influenced by the delegation mechanism, the election frequency, and the interaction between these two factors.
- Keywords:
-
Prisoner's Dilemma, intergroup conflict, evolution of cooperation, social influence, representation, elections frequency
 Introduction
"It will sometimes happen that the minority are right, and the majority are wrong, but as soon as experience proves this to be the case, the minority will increase to a majority, and the error will reform itself by the tranquil operation of freedom of opinion and equality of rights" ( Thomas Paine, 1835, p.14).
- 1.1
- While many important decisions are made by individuals, their consequences may influence the well being and survival of groups, organizations, and entire peoples. It is the group leader, the organization CEO, or the people's delegate, that holds the power to decide, but it is the group members who bare the consequences, and who may provide feedback about the decision maker's (DM) performance and her decision quality. Depending on the groups' structure, such feedback may strengthen the DM's position, or alternatively result in relieving her from her duties.
- 1.2
- Although this fact is easily recognized, it is difficult, or even impossible, to conduct controlled experiments aimed at revealing the underlying mechanisms in dynamical social systems involving large groups. The longer the period of time needed for monitoring the representative DM, and the larger the group size, the more difficult it becomes to conduct controlled experiments that capture such situations. It is not surprising, then, that the study of decision-making processes in large-groups, with long interaction periods, was left outside the experimental agenda. Indeed, almost all experimental research on time-dependent group processes is limited to the investigation of small groups whose members interact for relatively short time spans.
- 1.3
- The present study utilizes a relatively new research method that applies computer simulations to study the decision processes in large-groups whose members are engaged in interactions for a prolonged time. Specifically, we use computer simulations to study the effects of various institutions for attitude aggregation, and their transformation into decision strategies, on the evolution of inter-group relations. Our main objectives are to investigate the effects of different group representation methods, and of different representation periods, on the cooperation patterns that may develop between two representative DM's.
- 1.4
- We are not aware of any empirical research that has compared the effects of different representation methods on the evolving relations between representative DM's. On the other hand, the effect of representation (constituency) period on the representatives' conduct has attracted some research and scholarly attention. Obviously, the duration of a constituency period, after which a representative is dismissed or reelected, is of no intrinsic value unless seen in the context of optimal constituency periods given some defined objectives. The inspection of scholarly debates over this issue in various parliaments reveals two opposing arguments: the first favors short constituency periods on the bases of expected high level of commitment, and strong delegate-electorate dependency. James Mill in his "Essay on Government" wrote that "the smaller the period of time during which any man retains his capacity of representative, as compared with the time in which he is simply a member of the community, the more difficult it will be to compensate the sacrifice of the interests of longer period by the profits of misgovernment during the shorter" (Mill, 1828, p.70).
- 1.5
- The second argument claims that longer constituency periods are more favorable because they guarantee a reasonable degree of independence for the delegate and allow her to develop long term policies. Under longer periods, delegates are protected from being too closely tied to the interests and opinions of their constituents.
- 1.6
- An intriguing conclusion was drawn by Amacher and Boyes (1978) who claimed that since both arguments have opposing implications for the political system, their juxtaposition should lead to the theoretical prediction that there exists an optimal election frequency. Amacher and Boyes distinguished between 'decision costs' associated with direct elections expenditures, and 'external costs' composed of the expected costs individuals would endure as the result of an elected official behaving in an independent way which contradicts the desires of her constituents. The authors claim that by choosing this optimal frequency, election costs can be minimized.
- 1.7
- While the study of Amacher and Boyes (1978) investigated the issue of election frequency from an intra-group perspective, in two recent simulation studies (Suleiman and Fischer, 1996; Fischer and Suleiman, 1997) we took a different approach, by investigating the influence of election frequencies within two interacting groups on the emergence of cooperation between the two groups. Following standard game theoretic approaches to inter-group conflicts (c.f.Schelling, 1960; Brams, 1975) the groups' interaction was modeled as a 2-person PD game, but contrary to the standard approach, the two groups were not represented by two unitary players who represent their groups for the whole duration of the game. Rather, it was assumed that each group is comprised of a population of individuals, and that each individual is characterized by a certain probability that he or she will cooperate with an out-group member. The elected delegates represented their groups decisions in the ongoing interaction for a predetermined constituency period, after which elections were held, and their results determined whether each delegate was reelected, or replaced by a new DM. Between two successive elections, the elected delegates played a repeated PD game and their corresponding strategies were defined by their probabilities of cooperation. Following each interaction, each DM affected the cooperativeness of each in-group member, according to a social influence function that is directly proportional to the DM's payoff and inversely proportional to the social distance (on the cooperativeness continuum) between the DM and the target member. As a result, the distribution of cooperativeness in each group changed after each interaction; this, in turn, affected the choice of the representative DM for the next election period. Our main findings were that the duration of a constituency period was an important factor in determining the nature of the evolving relations between the group representatives, and that there was an optimal constituency period that maximized the prospects for inter-group cooperation.
- 1.8
- The representation method in our above-mentioned studies was restricted to the Minimal Winning Coalition (MWC) method. Under this method, a "minimal coalition" that contains 51% or more group members is formed in each group, and its mean is delegated to represent the group decision strategy between two successive elections. The MWC by no means exhausts all possible and externally valid representation methods. Although appropriate for modeling the basic representation method adhered to by democratic organizations (such as democratic government), various political systems such as Oligarchies, religious hegemonies, or despotic regimes are still fairly common. They succumb to different rules of power-delegation, and hence may give rise to a variety of inter-group cooperation patterns.
- 1.9
- When Thomas Paine raised the question regarding the classification of governments, he concluded that they could be reduced to two: The despotic and the free (Paine, 1793). A proper classification of the various power-delegation methods is beyond the scope of this study. However, to enable a meaningful comparison between the MWC and other methods, we investigate the evolution of decision strategies under two additional representation methods, each emphasizing an important perspective of power-delegation. The first is the Mean Representation (MR) method under which the elected group delegate represents the mean attitude in her group regarding the readiness to cooperate with an out-group member. This method can be seen as an extreme democratic procedure, because all constituents' attitudes towards inter-group cooperation are accounted for in choosing the "mean delegate". The second is the Random Representation (RR) method under which the group delegate is chosen randomly from the attitude population in her group. In contrast to the MR, the Random Representation method stands on the other extreme, in that it delegates a representative based on a random selection criterion. It is important to note that such selection criterion does not necessarily imply anarchy. It only emphasizes the lack of interest or importance attributed to the issue of cooperation with out-group members. The selection of a delegate may well be a result of a selection process that takes into account many other factors (economic, educational, etc.), all orthogonal to the attitude towards cooperation.
- 1.10
- In the present study we investigate the effects of the above-mentioned representation methods, under various election frequencies, on the group delegates' decision strategies, and on the emergence of inter-group cooperation patterns. The following section provides a detailed description of the inter-group simulation used in this study. The section that follows summarizes the simulation results, and the final section concludes with a discussion.
 The Simulation
- 2.1
- The basic features of the simulation can be described as follows:
- The inter-group conflict is modeled by an iterated two-person PD game played by elected delegates of the two groups. The specific PD payoff matrix in each game is shown in Table 1.
|
| Table 1: Prisoner's Dilemma Payoff Matrix |
|
| Delegate B |
| C | D |
| C | 5 , 5 | -10 , 10 |
| Delegate A |
| D | 10 , -10 | -5 , -5 |
|
- The simulation begins by defining two group sizes, n and m. Each group member is characterized by an initial propensity, or probability p, that she will cooperate in a PD game with an out-group member. Group members with p = 0 are those who will never cooperate, while those with p = 1 will always cooperate. To obtain a reasonable degree of flexibility in defining the distributions of cooperation in the two groups, we used a beta function[1] for defining these distributions. This function is sufficiently rich to describe most random variables having a restricted range (Derman et al., 1973). It can assume a wide variety of shapes, including uniform, symmetric, positively skewed, negatively skewed, and U-shaped functions. The results reported here were obtained for symmetrical bell-shaped distributions[2] that resemble a normal distribution in the range (0, 1).
- Following the construction of each group, the simulation defines the group's delegate. The delegate who represents the group's attitude and is responsible for making its decisions, is selected according to one of three representation methods:
- The "Minimal Winning Coalition" (MWC) method: Under this representation method, the simulation starts by locating all possible "non-fragmented" [3] groups which contain 51% or more group members. Of all the possible subgroups satisfying this condition, the simulation selects the most compact one on the cooperativeness continuum, and the mean of this MWC is chosen as the decision strategy that will represent the entire group. To illustrate this procedure, consider a population with the cooperation distribution portrayed in Figure 1.

|
|
Figure 1. The minimal winning coalition for a hypothetical distribution of cooperation
|
To locate the group delegate, the simulation starts by finding all possible non-fragmented subgroups containing 51% or more of the population. The simulation proceeds by selecting the most compact one (i.e., the one with the minimal range on the p continuum). This is the dark shaded subgroup in Figure 1. This subgroup is sought as the minimal winning coalition in democratic elections held in this population, and its mean is sought as the elected group delegate. This delegate represents the entire group for the duration of a constituency period. After this period, new "elections" are held according to the procedure described above and a delegate with a new decision strategy is "elected".
- The "Mean Representation" (MR) method: Under this representation method, the simulation computes the mean attitude (probability of cooperation) of the entire population, and this mean is then delegated to represent the groups decision strategy for the entire duration between two successive elections.
- The "Random Representation" (RR) method: Under this representation method, the simulation chooses a random delegate, from the "populated" attitudes on the cooperativeness continuum. This attitude will then represent the groups decision strategy for the entire duration between two successive elections.
- The time intervals between successive elections are defined separately for each group.
- After being elected, the delegates engage in an iterative PD game with each other. At every stage of the game, the decision strategy of each delegate is probabilistic and is defined by her probability of cooperation. Following each interaction, the simulation records each delegate's payoffs, as well as her cumulative gain.
- Following each interaction, each group delegate influences the propensities for cooperation of all her group members. This process can be considered as an ongoing social learning process (Axelrod, 1984) in which group members learn and adapt their strategies depending on their delegate's performance. We assume that the social influence of a delegated DM d on any group member i is inversely proportional to the social distance (measured on the cooperation continuum) between d and i. Moreover, we assume that this influence is proportional to the delegate's payoff. To express this relationship in formal notation, denote the probabilities that an individual i and the delegate d will cooperate at period t by pi (t) and pd (t), respectively. Also denote the outcome for delegate d at period t by Od (t). The social influence of d on i can be expressed by:
|
pi (t + 1) = pi (t) + K Od (t)/(pd (t)-pi (t))
| (1)
|
where pi (t + 1) is the probability that the individual i will cooperate at period t+1, and K is a constant. In the reported simulations, the values for the outcome Od(t) are given by the matrix in Table 1. Accordingly, a delegated DM can either win 10 or 5 units, or lose 10 or 5 units. The numerical value for K in the reported simulations was K = 10-5. This ensured that incremental changes in individuals' attitudes were sufficiently small in order to achieve a gradual buildup of social influence.
- 2.2
- In essence, the social influence function in Equation 2 resembles recent formulations of Latané's "social impact function" (Latané, 1981; Nowak, et al., 1990). Nevertheless, it has a number of unique properties that differentiate it from Latané's function in several important ways: (1) distances here are social and not spatial, because they are defined on the continuum which maps the individuals' propensities to cooperate; (2) group members are influenced by the outcomes of their delegate (the source), not by the strength of his or her attitude; (3) the type of social learning defined in Equation 2 is probabilistic and not deterministic as in Latané's model; (4) social influence is sought as a continuous or an incremental process in which delegates gradually affect their constituents' cooperativeness, whereas in Latané's theory the change of attitudes is a binary, all-or-none process.
- 2.3
- Note that Equation 2 has a singular point when pd(t) - pi(t) = 0, which means that the DM's social influence on a group member with pi(t) = pd(t) is not defined. To account for such cases, the probability pi (t + 1) at the singular point is defined as:
|
if Od(t) >= 0 then pi (t + 1) = pi(t)
if Od(t) < 0 THEN Pi (t + 1) = pi(t)+ m K Od(t) | (2)
|
where m is a random parameter which assumes the values ± 1 with equal probabilities.
- 2.4
- According to this definition, for a non-negative delegate outcome (Od(t) >= 0), the initial propensity of group member i to cooperate is not changed (i.e., it remains equal to the probability of cooperation of the DM). On the other hand, if the DM loses (Od(t) < 0), THEN THE PROBABILITY THAT I WILL COOPERATE AT PERIOD T + 1 WILL EITHER INCREASE OR DECREASE, DEPENDING ON THE REALIZATION OF THE RANDOM PARAMETER M.
- 2.5
- To illustrate the dynamics of social influence generated by the model, consider the distribution in Figure 2 which shows a hypothetical population at some period t.

|
|
Figure 2. The social influence process in a hypothetical population
|
- 2.6
- If the DM wins at period t, then she will "pull" all other group members toward her position (i.e. closer to her probability of cooperation). The "pull" force will be strongest on members in cluster w. In addition, it will be stronger on members in cluster x, whose positions are closer to the position of the delegate, than on members in cluster y whose positions are more distant from the DM's position. Conversely, if the DM loses, then all group members will be "pushed" away from her position, and the "push" force will be inversely proportional to the proximity between their positions and the DM's position.
- 2.7
- Following each interaction between the two DM's, the simulation updates the cooperation propensities of all other group members according to the social influence function described above. Each delegate remains in position until the next elections, regardless of the changes in the distribution of cooperation that take place in her group. When elections are due, the representation method together with the most recent distribution of cooperation determines who becomes the new group's delegate that will make all its decisions during the next constituency period.
- 2.8
- While Equation 2 describes the form of social influence in almost all cases, special treatment was needed to ensure that the same social learning principles will apply for the two boundary situations in which group members shift toward all-cooperate or all-defect, while their delegate lags behind them and incurs losses. Suppose that members in group A shift to the right and concentrate very close to the p = 1 point, while their DM, who is still in position, is located somewhere very close, but still to the left (having a lower p value). In the case in which the DM of group B is much less cooperative, group A's DM will lose continuously, and all group members having higher p values will be "pushed" away from her towards the far right end (i.e., toward the all-cooperate position). When the next elections are due, the new delegate will be an all-cooperate one and will lose continuously. Still, a majority of her group members will have higher p values, and thus will continue to be "pushed" to the right end of the p continuum. Because these members can not be "pushed" to the right further, they may be "stuck" at the right end of the p continuum. The same situation, though less frequently, might occur at the all-defect end. To avoid such counter-intuitive situations, we modified the social influence rule for these extreme situations, such that group members "pushed" away from a losing delegate will move inward, towards the center of the p range.
- 2.9
- Operationally, the extreme boundaries were defined as the 2.5% ends on both sides of the p continuum. The simulation treatment of the upper boundary condition can be formalized as follows:
|
For pi(t) > .975, pd(t) > .975, and Od(t) < 0 :
If pi(t) > pd(t) then pi(t + 1) = pd(t) + K Od(t) | (3-a)
|
Similarly, the lower boundary condition can be formalized as follows:
|
For pi(t) > .025, pd(t) > .025, and Od(t) < 0 :
If pi(t) < pd(t) then pi (t + 1) = pd(t) - K Od(t)
| (3-b)
|
 Results
- 3.1
- As stated earlier, the main objectives of the reported simulations were: (1) to investigate the effects of three different power-delegation methods on the evolution of decision strategies in inter-group settings; and (2) to investigate the effect of the frequency of elections in the two groups on the evolution of cooperation between the groups. The simulations were run on a PC. The results reported here were obtained for two equal groups with size n = m = 300. The initial propensities for cooperation in both groups were identical, with symmetrical beta distributions with parameters u = v = 5. To test the effect of the election period on the evolution of inter-group conflict for each power-delegation method (MWC, MR, and RR), we ran thirty simulations under each one of twelve election conditions. These conditions were: (1, 1), (10, 10), and (1000, 1000) up to (10000, 10000) with intervals of 1000, where each pair indicates the number of iterations between successive elections in the first and second group. The total number of simulations was 1080 (3 power-delegation methods × 12 election frequencies × 30 simulations for each condition). Each simulation was run for 80,000 iterations. For every iteration, the computer program generated (and displayed) the distributions of cooperation for the two groups, their delegates' probabilities of cooperation, and their cumulative payoffs. In reporting the results, however, we focus on the first two variables and omit the reporting of the payoffs, which is of no value for understanding the evolution of cooperation between the two groups.
- 3.2
- To study the emerging patterns of the inter-group dynamics, we plotted the probabilities of cooperation of the groups' delegates as functions of the number of iterations. The investigation of these graphs revealed that for some simulations, the inter-group dynamics followed certain, well defined, "pure" patterns. In most other simulations, the emerging patterns exhibited some alternating mixes of these "pure" patterns. Typically, a certain "pure" pattern prevailed for a relatively long period (counted in iterations), after which the dynamics shifted to another "pure" pattern, and so on. The emerging pattern was chaotic only for very few simulations. For the reported simulations (each of which consisted of 80,000 iterations), an "enduring" pattern was defined as one that stabilized for at least 5000 iterations[4]. Before comparing the results for the three delegation methods we describe all emerging cooperation strategies. Some of these strategies evolved under all three methods, while others were more characteristic of a specific method.
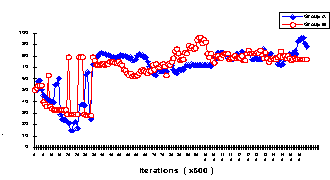
- A Mutual Cooperation (C-C) pattern: Once this pattern emerged, the two groups converged to mutual cooperation as shown in the result portrayed in Figure 3.1.
|
|
Figure 3.1. The delegates rates of cooperation for a Cooperation-Cooperation pattern
|
The maximum level of mutual cooperation obtained in the displayed result is quite impressive (about 80% for both delegates). In most other results the delegates' rates of cooperation were lower. For classification purposes, we decided to classify a pattern as a C-C pattern if it exhibited a clear and enduring pattern (for at least 5000 iterations) of mutual cooperation, and if the rate of cooperation of both delegates did not drop below the 51% threshold.
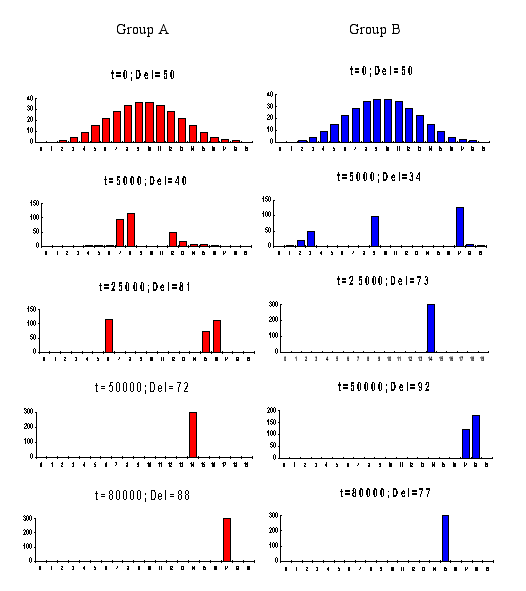
The corresponding intra-group dynamics for the result in Figure 3.1 is depicted in Figure 3.2. The vertical axis shows frequency distributions, and the horizontal axis shows the probabilities of cooperation given in equal intervals of 0.05 (denoted in the graphs by 0, 1, ..., 19).
|
|
Figure 3.2. The intra-group processes for a typical Cooperation-Cooperation pattern
|
The figure shows that after some transitional period the two groups move towards high cooperation rates. When such a situation is reached, both delegates win (in expected values) and mutual cooperation is maintained.
- A Defection vs. Oscillation (D-O) pattern: A typical example of this pattern obtained under the (10,10) elections condition is shown in Figure 4.

|
|
Figure 4. The delegates' rates of cooperation for a typical Defection vs.
Oscillation pattern
|
This figure depicts the delegates' probabilities for cooperation as a function of the iterations. It clearly shows that after some transitional phase, a relatively stable steady state emerges in which group A's delegate continuously oscillates between high and low levels of cooperation, while group B's delegate converges slowly toward a very low level of cooperation.
- A Cooperation vs. Defection pattern: In this pattern one of the groups' delegates engages in a long period of high level cooperation, whereas the other delegate repeats a very low level of cooperation. This patterns results in an enduring exploitation of the cooperating group. Figure 5 depicts a simulation result that demonstrates a Cooperation vs. Defection pattern. The figure shows that for two relatively long phases of the evolution (marked by P1 and P2 in the figure), group A's delegate is 100% cooperative, while group B's delegate is very uncooperative (with cooperation rates of 22% and 2% during phases P1 and P2 respectively).
- A Mutual Defection pattern: In this pattern, both groups incur losses because their delegates engage in a low level of cooperation. An example of a Mutual Defection pattern is demonstrated in Figure 6. The figure clearly shows that during two adjacent phases (marked by P1 and P2) the levels of cooperation of the two delegates are quite low. This D-D interaction is more salient in the second phase (P2) during which the rates of cooperation of the two delegates drops to very low levels.

|
|
Figure 5. The delegates' rates of cooperation for a simulation results with
Cooperation vs. Defection phases
|

|
|
Figure 6. The delegates' rates of cooperation for a simulation results with Mutual
Defection phases
|
- Equal Split patterns: These patterns are characterized by an exact split, in at least one of the groups, into two equal subgroups (of exactly 50% of the population). Such split resulted in blocking the dynamics of social change in the group. We identified three patterns involving equal splits: (a) Cooperation vs. 50%-Cooperation in which one of the groups breaks down into two equal blocks, each driven to one edge of the cooperation continuum, while the other group exhibits relatively high levels of cooperation. (b) Defection vs. 50%-Cooperation in which one of the groups breaks down into two equal blocks, each driven to one of the edges of the cooperation continuum, while the other group exhibits relatively high levels of defection; and (c) Mutual 50%-Cooperation (50% cooperation vs. 50% cooperation). Under the MWC and RR methods, and for most election frequencies, we found less then 3% of either one of these patterns. However the MR method produced high rates of the Mutual 50% Cooperation. We will report results of Equal Split patterns only when their relative frequency exceeds 5%. An example of the 50%-Cooperation vs. Defection pattern is demonstrated in figure 7.

|
|
Figure 7. The delegates' rates of cooperation for a typical Defection - 50%
Cooperation pattern
|
- A Chaotic pattern: This pattern is characterized by high-frequency fluctuations between various levels of cooperation, so that none of the patterns endures for a sufficient duration to justify its classification into one of the previous categories.
- 3.3
- As noted earlier, some simulation results were predominantly comprised of one of the "pure" patterns described above, but most others exhibited an alternating mix of "pure" patterns, as well as some transitional chaotic patterns. Figures 8 demonstrate some typical pure and mixed simulation results.

|
|
Figure 8. Typical simulation results for some elections frequencies
|
- 3.4
- As stated earlier, for each representation method, and election frequency, we ran 30 simulations for 80,000 iterations each. For each of the three representation methods, and each election period, we calculated the relative frequency of each pattern at the end of the 80,000 iterations. A pattern was classified as one of the previously described types only if the dynamics characterizing this type was stable at least for the last 5000 iterations.
- 3.5
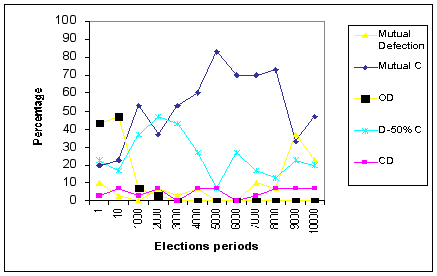
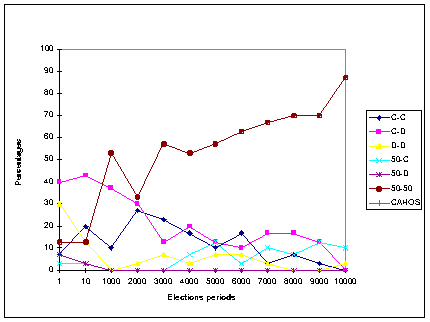
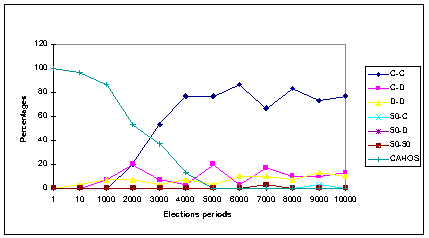
- Figure 9 shows the distribution of cooperation patterns for each of the election frequencies, obtained under the MWC method (panel a), the MR method (panel b), and the RR method (panel c).
|
|
Figure 9a. Frequencies of all Cooperation patterns (in %) at the end of 80,000 iterations
under the Minimal Wining Coalition method, for each elections condition
|
|
|
Figure 9b. Frequencies of all Cooperation patterns (in %) at the end of 80,000 iterations
under the Mean Representation method, for each elections condition
|
|
|
Figure 9c. Frequencies of all Cooperation patterns (in %) at the end of 80,000 iterations
under the Random Representation method, for each elections condition
|
The distribution of cooperation patterns under the MWC method
- 3.6
- As shown in Figure 9-a, the emerging cooperation patterns under the MWC condition are characterized by an impressive rate of mutual cooperation. These patterns are especially dominant in the mid-range of the investigated election frequencies (between 4000 and 8000 iterations) reaching levels of up to 80% of all simulations. In contrast, the rate of the Mutual Defection pattern is negligible under most election frequencies (with the exception of the two lowest frequencies). Two additional patterns do not die-out completely at the end of the 80,000 iterations. The first is the Oscillation vs. Defection pattern, which comprises over 40% of the simulations under high election frequencies (1 and 10), but dies-out almost entirely under all other frequencies. The second is the 50%- Cooperation vs. Defection pattern, which comprises about 20% of the emerging patterns under most election frequencies (except for the 2000 frequency, where it reaches a peak of about 40%). All other patterns, including the Cooperation vs. Defection pattern, drop to negligible rates, or die-out completely at the end of the simulation.
The distribution of cooperation patterns under the MR method
- 3.7
- A completely different distribution of cooperation patterns emerges under the Mean Representation (MR) method. As shown in Figure 9-b, the rates of the Mutual Cooperation pattern are below 10% for most election frequencies, and rise to about 20% - 30% for high frequencies (between 10 and 30,000 iterations). The Cooperation vs. Defection patterns show a relative smooth decline, starting from about 40% of the results under high election frequencies, and decreasing to about 20% under low election frequencies. The most prevailing pattern under the MR method is the 50%-Cooperation vs. 50%-Cooperation pattern. This pattern is dominant under most election frequencies. It starts from a low rate of about 10% under high election frequencies, but increases monotonically up to 90% for low election frequencies. This equal split of the two populations seems to characterize the MR method. All other patterns, including the Mutual Defection pattern reach negligible rates, or die-out completely at the end of the simulation.
The distribution of cooperation patterns obtained under the RR method
- 3.8
- The inspection of Figure 9-c corresponding to the Random Representation (RR) method shows that for high frequencies of election, the Chaotic pattern is the dominant one. As the frequency of elections decreases, the rate of this pattern declines monotonically, and dies-out completely for duration of elections of 5000 iterations and above. Synchronically, the rate of the Mutual Cooperation pattern increases with the decrease of election frequency, reaching impressive rates of 70% and above for election periods of 4000 and above. All other patterns, including the Mutual Defection pattern reach negligible rates, or die-out completely at the end of the simulation.
- 3.9
- To further investigate the effect of election frequency on the evolution of the cooperation patterns, we sampled each of the 1080 simulation results at eight sampling points separated by equal intervals of 10 thousand iterations. The sampling points were 10, 20, ... 70, 80 thousand iterations. For each of the three representation methods, and each election condition, we calculated the relative frequency of each of the emerging cooperation patterns. At each sampling point, a pattern was classified as such only if its characterizing dynamics was stable for at least 2500 iterations on each side of the sampling point. Though all cooperation patterns were influenced by the election frequencies, we focus here only on the mutual cooperation pattern.
- 3.10
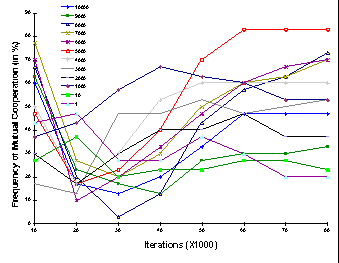
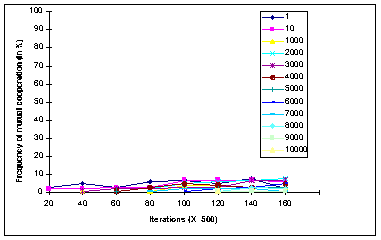
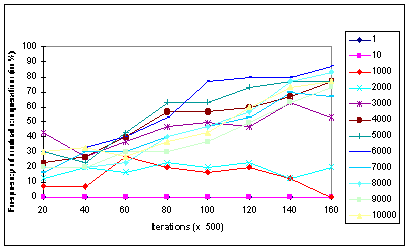
- Figures 10-a to 10-c depict the relative frequencies of the occurrence of mutual cooperation (in %), for each of the three election methods, and each election condition.
|
|
Figure 10a. Frequencies of the Mutual Cooperation patterns (in %) under the Minimal
Wining Coalition procedure for each elections condition
|
|
|
Figure 10b. Frequencies of the Mutual Cooperation patterns (in %) under the Mean
Attitude Representation procedure for each elections condition
|
|
|
Figure 10c. Frequencies of the Mutual Cooperation patterns (in %) under the
Random Attitude Representation procedure for each elections condition
|
- 3.11
- The emerging pattern of mutual cooperation for the MWC (Fig. 10-a) demonstrates the following main features: (a) for all election frequencies, the levels of mutual cooperation first decrease, then increase monotonically and stabilize on a certain cooperation rate that differs from one election condition to another; (b) the highest mutual cooperation rates (of about 85%) are achieved under the 5000 elections' period condition; (c) lower rates of cooperation are reached for frequencies above and below the 5000 period.
- 3.12
- The patterns of mutual cooperation obtained under the Mean Representation (MR) method (Fig. 10-b) show that the rates of cooperation obtained under all election conditions were very low. The highest rate (about 8%) was obtained under the 2000 election period. Finally, Figure 10-c corresponding to the Random Representation method, shows that the mutual cooperation patterns emerging under this condition are quite similar to the ones obtained under the MWC condition. Furthermore, the graphs corresponding to the various election frequencies show that: (a) for most election frequencies there exists a steady increase in the level of cooperation; (b) in terms of their influence on the evolution of mutual cooperation, the twelve election frequencies can be classified into three distinct groups: the first includes the 1 and 10 election frequencies under which no mutual cooperation was obtained. For the second group, comprised of the 1000 and the 2000 election frequencies, the levels of mutual cooperation are relatively low, and do not exceed a 20% rate. For the last group, which includes all remaining frequencies, the obtained levels of cooperation are relatively high, ranging from about 50% for the 3000 election period, and 80% for the 6000 and 5000 election periods.
 Discussion
- 4.1
- Before focusing on the main results of the study, two methodological remarks seem in order: (1) The complexity of the investigated situation renders it less than amenable to mathematical tractability. In the absence of closed form solutions, computer simulation - as undertaken here - seem to provide the best tool for studying the evolutionary dynamics of inter-group (and intra-group) decision processes. The emerging patterns in this study, their evolutionary path and optimal periods, reveal some important principles concerning the nature and underlying structures of group decision formation. Notwithstanding, the results of such simulations should be taken with care due to their sensitivity to the specific parameter values under which they are run. (2) The reported results were obtained under the assumption that the representatives act according to probabilistic strategies. While in the long term, the delegate probability distribution is affected by the history of interactions between the groups, in the short run, her strategies were not strictly reactive to her opponent's strategies. The introduction of reactive strategies could affect the investigated evolutionary dynamics.
- 4.2
- The inspection of the results obtained under the different power-delegation methods sheds some light on the emergence of decision strategies and inter-group cooperation. It shows how the decision strategies taken by group delegates are strongly influenced by the delegation mechanism. An interesting finding is the similarity in the high level of mutual cooperation achieved under the Random Representation, and the Minimal Wining Coalition method. This similarity is found mainly for the mid-range of election frequencies, whereas under more extreme frequencies the two methods give rise to very different patterns. Under the Random condition, high frequency for delegate selection produces a Chaotic pattern of decision strategies (maybe in line with the intuitive expectation), but produces an Oscillation-Defection pattern under the MWC method.
- 4.3
- The similarity between the results under the MWC and the RR methods is, in part, a result of social learning. It's inspection shows that the continuous "pushes" and "pulls" of individual strategies (on the cooperativeness continuum) resulted in their clustering into few distinct subgroups, while leaving most of the cooperativeness continuum almost non-populated. When such configurations were reached, delegation under the MWC method ensured the election of representatives whose attitudes toward cooperation were close to the attitudes of constituents in highly populated clusters (i.e., to "winning" coalitions). The same result was reached under the RR method, although due to a different underlying process. Recall that under the RR method delegates were chosen from "populated" attitudes by a random process. Accordingly, the probability of choosing a delegate with a given attitude towards cooperation was positively related to the number of constituents holding the same attitude.
- 4.4
- The Mean Representation method seems to be fairly dull in its ability to produce decisive strategies. The main evolving pattern under this method splits the population into two groups, thus keeping the overall decision strategy at the 50% level of cooperation. For high election frequencies, the dynamics produced by this method is characterized by a fairly high rate of Cooperation vs. Defection, and a low rate of Mutual Cooperation.
- 4.5
- Further inspection of the simulations confirms previous findings (Suleiman and Fischer, 1996; Fischer and Suleiman, 1997) regarding the prospects of mutual cooperation and their sensitivity to the election frequencies in the interacting groups. It also demonstrates the interaction between the representation method and the election frequency. A careful study of the Mutual Cooperation pattern under the MWC and RR methods suggests that election frequency can enhance mutual cooperation in at least two possible ways: (1) longer periods between elections allow the delegates to exercise a more systematic and directional influence on their constituents. The build-up of such influence can result in a coherent and directional shift of group members in one defined direction. In contrast, frequent changes of delegates can result in an incoherent, "random-walk" type movement caused by the frequent changes in the delegates' decision strategies; (2) the effect of long election periods is dramatically pronounced when the two groups drift to very low cooperation levels and their delegates engage in a loose-loose (D-D) strategy. In such situations, long election periods provide sufficient duration for "pushing" the populations of both groups towards high cooperation levels. Conversely, very long periods considerably decrease the chances for achieving a synchronized mutual cooperation, since any small difference between the levels of cooperation of the two delegates causes an amplified influence, pushing one, or both populations away from the existing high cooperation level. These two opposing effects of the frequency of DM election yield an optimal election period for which mutual cooperation occurs with highest probability. This optimum is close to the 5000 elections period for the MWC method, and is reached for frequencies above the 4000 election period under the RR method. The location of the optimal duration for achieving the best prospects for the development of mutual cooperation provides interesting insights to the nature of the evolution of cooperation emphasizes the interaction between the power delegation method and the required social learning period. To allow for the development of mutual cooperation, under the RR condition, it is sufficient to allow for a certain minimum of social learning period. For the MWC method a more delicate fine-tuning is required. Over or under shooting of this optimal time span will result in decline of the chance to achieve mutual cooperation. Of course, there is no simple way for correlating this optimum (or other elections periods) with the temporal dimension of real life decisions taken in political or social systems. Such a comparison will require longitudinal studies, or even historical data collected over very long time spans.
- 4.6
- The poor performance of the MR method in producing inter-group cooperation adds to previous reservations, voiced on different grounds, against the averaging of population opinions. In reference to the relationship between constituents and their representatives, Rousseau, in his 'Social Contract', discriminated between the "General Will" and the 'Will of Everybody". In Rousseau's words "it often happens that the will of everybody, because it is looking to private interest and is thus merely a sum of particular wills, is something quite different from the general will, which looks exclusively to the common interest" (Rousseau, 1762). Rousseau goes further to suggest that very extreme opinions should be disregarded when the public "General Will" is defined.
 Acknowledgements
-
We wish to thank Nigel Gilbert and three anonymous referees for their helpful remarks.
 Notes
Notes
-
1
In formal notation, the beta density function for the probability of cooperation, p, can be written as:
|
f(p) = pu (1-p) v / B(u,v) | if 0 <= p <= 1 |
| 0 | Otherwise |
where u and v are the parameters of the beta distribution (u >= 0, v >= 0), and B(u,v) is the Beta function (see e.g.Johnson and Kotz, 1969).
2 The parameters of the beta function for producing this distributions were
u = v = 5 for the two groups. Moreover, in all reported simulations the continuous beta functions were approximated by discrete functions with equal intervals of D = 0.05.
3 A non-fragmented group is one that is defined over a continuous segment of the cooperativeness range.
4 The durability of a given pattern, as defined here, does not imply that a static, or dynamic, equilibrium was reached.
 References
-
AMACHER, R. C., and Boyes, W. J. (1978). "Cycles in senatorial voting behavior: implications for the optimal frequency of elections". Public Choice 33 (3), 3-13.
AXELROD, R. (1984). The Evolution of Cooperation. New York: Basic Books.
BRAMS, S. (1975). Game Theory and Politics. New York: Free Press.
DERMAN, C., Gleser, L. J., and Olkin, I. (1973). A Guide to Probability Theory and Application.New York: Holt, Rinehart, and Winston.
FISCHER, I. Suleiman, R., (1997). "Mutual Cooperation in a Simulated Inter-group Conflict". Journal of Conflict Resolution 41 (4), 483-508.
JOHNSON, N. L., and Kotz, S. (1969). Distributions in Statistics. Boston, MA: Houghton Mifflin.
LATANÉ, B. (1981). "The psychology of social impact". American Psychologist 36, 343-365.
MILL, J. (1828). Essay on Government (new edition 1955). New York: Bobbs-Merrill.
NOWAK, A., Szamrej, J., and Latané, B. (1990). "From private attitude to public opinion: A dynamic theory of social impact". Psychological Review 97 (3), 362-374.
PAINE, Thomas. (1793). The Catachism of Man. London.
PAINE, T. (1835): Dissertation on First principles of government. James Watson, London
ROUSSEAU, J. J. (1762). The Social Contract (new edition 1954) Illinois: Henry Regnery.
SCHELLING, T. (1960). The Strategy of Conflict. Cambridge, MA: Harvard University Press.
SULEIMAN, R., and Fischer, I. (1996). "The Evolution of Cooperation in a Simulated Inter-group Conflict", in W. B. G. Liebrand, and D. M. Messick (eds.). Frontiers in Social Dilemmas Research. (pp. 419-438). Berlin: Springer-Verlag.

 Return to Contents of this issue
© Copyright Journal of Artificial Societies and Social Simulation, 1999
 Abstract
![]() Introduction
Introduction
![]() The Simulation
The Simulation


![]() Results
Results


![]() Discussion
Discussion
![]() Acknowledgements
Acknowledgements![]() Notes
Notes![]() References
References![]()
Return to Contents of this issue