Where Does Theory Have It Right? A Comparison of Theory-Driven and Empirical Agent Based Models

,
and
aCrawford School of Public Policy, Australian National University; bUniversity of Twente, Netherlands; cUniversity of Technology Sydney, Australia
Journal of Artificial
Societies and Social Simulation 24 (2) 4![]()
<https://www.jasss.org/24/2/4.html>
DOI: 10.18564/jasss.4573
Received: 05-Sep-2020 Accepted: 15-Mar-2021 Published: 31-Mar-2021
Abstract
Computational social science has witnessed a shift from pure theoretical to empirical agent-based models (ABMs) grounded in data-driven correlations between behavioral factors defining agents' decisions. There is a strong urge to go beyond theoretical ABMs with behavioral theories setting stylized rules that guide agents' actions, especially when it concerns policy-related simulations. However, it remains unclear to what extent theory-driven ABMs mislead, if at all, a choice of a policy when compared to the outcomes of models with empirical micro-foundations. This is especially relevant for pro-environmental policies that increasingly rely on quantifying cumulative effects of individual behavioral changes, where ABMs are so helpful. We propose a comparison framework to address this methodological dilemma, which quantitatively explores the gap in predictions between theory- and data-driven ABMs. Inspired by the existing theory-driven model, ORVin-T, which studies the individual choice between organic and conventional products, we design a survey to collect data on individual preferences and purchasing decisions. We then use this extensive empirical microdata to build an empirical twin, ORVin-E, replacing the theoretical assumptions and secondary aggregated data used to parametrize agents' decision strategies with our empirical survey data. We compare the models in terms of key outputs, perform sensitivity analysis, and explore three policy scenarios. We observe that the theory-driven model predicts the shifts to organic consumption as accurately as the ABM with empirical micro-foundations at both aggregated and individual scales. There are slight differences (±5%) between the estimations of the two models with regard to different behavioral change scenarios: increasing conventional tax, launching organic social-informational campaigns, and their combination. Our findings highlight the goodness of fit and usefulness of theoretical modeling efforts, at least in the case of incremental behavioral change. It sheds light on the conditions when theory-driven and data-driven models are aligned and on the value of empirical data for studying systemic changes.Introduction
UN Sustainable Development Goals (SDGs) call for drastic changes in consumption patterns (e.g., Goal 12). The Intergovernmental Panel on Climate Change (2019) considers consumer choice for food, housing, and mobility as one of the main factors influencing global efforts to reduce environmental impacts. Demand-side policies can contribute to tackling climate change issues and managing environmental resources, calling for methods to quantify the cumulative effects of possible pro-environmental behavioral changes (Taghikhah et al. 2019).
Complex system approaches help to explore whether and why consumers buy green, sustainable products as well as the cumulative impacts of these individual choices (Czupryna et al. 2020; Duinen et al. 2016; Suleimenova & Groen 2020; Taghikhah, Voinov, Shukla, Filatova, et al. 2020). Agent-based models (ABMs) are the primary method to simulate the dynamics among heterogeneous agents, their behavioral change, their interactions with each other, and the environment, as well as their collective actions over time (Jager & Ernst 2017), such as the emergence of diffusion processes at the macro-level. As attention to the potential of this method to investigate the effectiveness of different policies grows, so does the necessity to align the use of empirical data with the theoretical micro-foundations of agents’ behavior. Specifically, one may explore the effect of different policy interventions promoting the adoption of green practices by combining the results of empirical studies with behavior change theories in ABMs. Two approaches for developing ABMs focus on either:
- Theoretical ABMs driven by processes and mechanisms inspired by a social or behavioral sciences theory. Here ABM dynamics are shaped by mathematical equations and if-else rules describing the underlying relationships and feedbacks among components of decision-making grounded in the chosen theory (Schlüter et al.2017; Schwarz et al. 2020; Schlüter et al. 2017; or
- Empirical ABMs developed based on the explicit integration of field micro-data. Here agents’ decisions are usually driven by a statistical function (e.g., linear regression, probit, or logit) or machine learning functions (e.g., support vector machine, ensemble methods) (Janssen & Ostrom 2006; Smajgl & Barreteau 2014).
It is to be noted that our intention is not to contrast theory-driven to data-driven ABM approaches. We rather firmly believe that a combination of both approaches, with different contributions in model development, is useful. For example, the design of questionnaires and behavioral experiments behind the micro-data collection is usually theory-grounded. Hence, the success of ABMs relies on uniting the strengths of relevant theories and data to address societal challenges. For a comprehensive and systematic comparison between the pros and cons of theoretical and empirically-grounded models, please refer to Sun et al. (2016).
Looking at the articles in the Journal of Artificial Societies and Social Simulation, the models are still mostly theoretical (Conte & Paolucci 2014). However, with the ABM aspirations to advise real policy decisions, the interest of the ABM community to go beyond theoretical models is strong (Sun et al. 2016). Consequently, we increasingly aim for extensive empirical data collection to provide bottom-up prediction models or reveal new phenomena. While the number of empirical ABMs developed based on certain case studies grows rapidly, O’Sullivan et al. (2016) argue the contribution of an additional ABM can only be marginal if the community cannot learn broader lessons from its use. They use the acronym YAAWN (Yet Another Agent-Base Model … Whatever … Nevermind …) and explain that cumulative learning could happen but only if the focus of modeling efforts drifts from unique structures and highly specific case studies to a more general understanding of the problem. For example, many scholars have empirically measured the relationship between behavioral factors and land use decisions for specific cases (Janssen & Ostrom 2006). However, the findings are of limited application if the experiments could not significantly contribute to generalized knowledge on the systems under study. Moreover, while methods for developing empirical ABMs constantly advance (Bell 2017; Robinson et al. 2007; Smajgl et al. 2011), collecting microdata to specify agents’ actions and interactions is expensive and time-consuming, postponing possible policy explorations.
These concerns call for a better understanding of decision-making processes, exploring the significance of changing conditions on behavior, and providing new insights on the functionality of systems or theory building. The question is in finding a golden balance between theory-grounded generalizable models and case-specific policy-relevant ABMs with empirical micro-foundations of agents’ behavior. An insightful study by Boero & Squazzoni (2005) shed light on the methodological challenges of using empirical data in conjunction with social theories when developing ABMs.
In the literature on consumer behavior, theoretical ABMs have gained popularity due to the lack of micro-level data on decisions or difficulties with data collection. For example, Li et al. (2018) assess the impact of access and price on fruit and vegetable consumption in a theoretical ABM for New York’s population. Garcia et al. (2007) discuss the challenges of validating a theoretical ABM in the field of wine marketing. Zeppini & Frenken (2018) developed a theoretical ABM to investigate the impact of network structures on the speed and extent of innovation diffusion. Scalco et al. (2019) examine the effectiveness of pricing and marketing strategies for reducing meat consumption in a theoretical-empirical ABM. Calisti et al. (2019) simulated the interactions between consumers and small food markets to understand the dynamics that opening a small food shop could trigger in the local competitive environment. Theory-driven models are powerful tools in representing general dynamics and are useful when according to Sun et al. (2016), the modeler deals with “\(\dots\) incomplete knowledge of individuals’ interactions or underlying decision mechanism \(\dots\)”. This type of model provides a practical abstraction of a system to test and experiment with common principles of social and behavioral dynamics and derive generalizable results across cases.
Notwithstanding the popularity of the theoretical approach, there is skepticism and criticism regarding the credibility of these models and the levels of uncertainty in their results (Manson 2007; O’Sullivan et al. 2016). Especially when it comes to food policy-making and long-term strategic decisions – which directly affect health, nutrition, and food security of nations – the adoption of theory-driven ABMs encounters resistance. There are concerns about the structural validity of models grounded in theoretical frameworks and the credibility of their results in terms of representations of consumer preferences and future scenarios (Jager 2017). Considering the uncertainty of outputs, it is difficult to assess the quality of theoretical models and determine whether they are appropriate for predicting behavior change. In addressing this criticism, we align the performance of an ABM with theory-driven vs. data-driven micro-foundations of agents’ behavior in real policy settings, we propose a comparison framework. The framework is not limited to contrasting the model outputs in the baseline run but advocates the examination of their sensitivity and performance when running various policy scenarios. This provides modelers with a basis for evaluating the respective capacities and weaknesses of both approaches and allows them to make conclusions about the model usage, especially for policy exploration.
Our objectives are to (\(i\)) empirically validate the assumptions and theoretical mechanism of decision-making and discuss the usefulness of behavioral change theories for understanding consumer preferences in computational models, (\(ii\)) test the reliability and generalizability of previously identified patterns by comparing the sensitivity and scenario analysis of theory- and data-driven models, and (\(iii\)) analyze the synergies between data and theory-driven behavioral micro-foundations.
We use ORVin, an ABM simulation model developed by Taghikhah, Voinov, Shukla, & Filatova (2020), for examining organic wine purchasing behavior. This model is suitable to address this research problem since it structures consumer preferences and behavior change explicitly along with the foundations of behavioral theories. Hence, there are several theoretical assumptions involved in specifying the behavioral heuristics of agents that need further validation (e.g., attitude and habits). Moreover, we can design a set of policy interventions to trigger pro-environmental behavior changes among agents, making the model a useful tool to explore policy design. The latter is especially relevant in the case of Sydney in Australia, where ORVin was applied and where the uptake of organic consumption is still quite low and could be certainly boosted by the right policy. So far, despite the dramatic growth of organic wine production, Australia largely sees it as an export-oriented industry due to the low-local market demand.
We design a survey to collect extensive empirical data about individual wine preferences in the City of Sydney. We use this microdata to instantiate the decisions of agents in the existing theory-driven model (ORVin-T) and develop its empirical counterpart model (ORVin-E). Next, we use both models to report on the potential impacts of the market-based (i.e., higher taxes on conventional products), persuasive (i.e., organic wine informational marketing), and combined interventions to increase the number of organic wine consumers. Finally, we discuss the results of these experiments and provide implications for the future development of ABMs aimed at supporting policy decisions.
Methodology
Our proposed comparison framework consists of five main components: theory-driven model, data-driven model, and their comparisons at baseline runs, as well as their sensitivity and performance in scenario analyses (Figure 1). When conducting the model comparisons, we also differentiate between two supporting sub-components: the processes and mechanisms, explicit behavioral data driving the ABM dynamics. The framework starts with designing and testing a theory-driven ABM, entirely based on literature, knowledge, and theories. In the next step, the model assumptions are relaxed, and theoretical rules are replaced with the empirical observations and data to develop the empirical counterpart of the model. Techniques for collecting data from the target population may range from interviews and surveys to role-playing games and laboratory experiments (Smajgl et al. 2011). The input data, key outputs, and time periods should be the same for both models to ensure the differences arise from their structures. To make this comparison more meaningful, the framework suggests going beyond just comparing the model outputs in a baseline run and comparing the results of sensitivity and scenario analyses. Analyzing how different the models perform when running similar scenarios and the extent of associated uncertainties can reveal the full contrast with respect to the drivers of the dynamics of the modeled social system, helping ABM developers to refine and improve theoretical models.

Theory and survey data
To illustrate the proposed framework, we use the ORVin ABM (Taghikhah et al. 2020), which studies individual purchasing behavior, specifically the choice of organic versus conventional products using wine as an example. Three behavioral change theories—theory of planned behavior (TPB, Ajzen (1985)), the alphabet theory (Zepeda & Deal 2009), and the goal framing theory (Lindenberg & Steg 2011)—provide the conceptual foundations of ORVin for modeling the behavioral choices of heterogeneous adaptive agents. Based on this underlying theoretical framework (Figure 2), we design a survey for eliciting the factors related to wine-purchasing decisions. A total of 1,003 consumers living in the City of Sydney, Australia, responded to the online survey carried out in September - November 2019. We collected data on socio-demographics, shopping-drinking patterns, and behavioral factors. Appendix A provides the survey questions, which we utilized in this article. It is worth mentioning that this survey (that delivers the data for the empirically estimated agent’s rules) was developed in accordance with the theoretical framework in Figure 2. Taghikhah et al. (2021) provide the details on the survey content and the structure of questionnaire.

Socio-demographic factors include age, education, income, and household size (Table 1). The majority of survey respondents are highly educated, and their income level is higher than the average income (more than AU $75,000). For incorporating consumer wine shopping and consumption-related patterns, we ask respondents about their frequency of consuming and shopping for wine, average shopping size for wine, maximum wine budget, frequency of comparing the price of different products, and average time spent at the wine shop (Table 2). More than two-thirds of respondents visit wine shops at least once a week and drink wine two to five times a week. Regarding behavioral factors, we assess attitude, PBC, social norms, habits, and hedonic-gain-normative goals (Table 3). Generally, consumers have positive attitudes toward organic wine and like its taste—85% and 76% of respondents, respectively. Most respondents (73%) report habitual purchasing and the strong influence of the advice of their friends and family on their wine-purchasing decisions. Note that values for attitude and hedonic goals are determined by averaging the values of their components.
Besides this, we measure how much more people are prepared to pay for organic wine as compared to the conventional. We assume a desire to pay this premium for organic wine serves as a proxy for the organic-purchasing intention. Additionally, respondents whose wine shopping basket is more than 50% organic are marked as organic consumers in the survey and, in turn, in our ABM. The survey results reveal that, while more than 80% of consumers have a positive intention for purchasing organic wine despite its higher cost, only about 20% of them actually purchase organic wine almost exclusively. The data allows us to initialize a population of heterogeneous agents and provides the empirical micro-foundation of parameters and assumptions in ORVin-E, as discussed in the next section. If required, one can upscale the model by connecting national statistical data to this data.
| Socio-demographic items | |
| Gender | |
| Male | 59% |
| Female | 41% |
| Age | |
| \(18-25\) | 10% |
| \(26-35\) | 25% |
| \(36-45\) | 39% |
| \(46-55\) | 16% |
| \(56-65\) | 6% |
| \(66\) and more | 4% |
| Education | |
| Primary | 2% |
| Secondary | 10% |
| Graduate | 39% |
| Post-Graduate | 49% |
| Household annual income | |
| Less than \(45\) thousand AU$ | 9% |
| \(45-75\) thousand AU$ | 14% |
| \(75-150\) thousand AU$ | 38% |
| \(150-250\) thousand AU$ | 26% |
| More than \(250\) thousand AU$ | 13% |
| Household size | |
| One | 15% |
| Two | 29% |
| Three | 26% |
| Four | 0% |
| Five | 18% |
| Six | 4% |
| Seven and more | 8% |
| Shopping and drinking-related patterns | |||
| Average number of wine bottles purchased | Max price paid for a bottle of wine | ||
| Not more than 1 bottle per month | 18% | Less than 50$ | 52% |
| Between 1 and 4 bottles per month | 34% | Between 51 and 100$ | 23% |
| Between 5 and 10 bottles per month | 33% | Between 100 and 150$ | 14% |
| More than 10 bottles per month | 15% | More than 150$ | 11% |
| Frequency of drinking wine | Frequency of purchasing wine | ||
| Few times in a year | 7% | Few times in a year | 11% |
| Once per month | 3% | Once per month | 9% |
| Few times a month | 10% | Few times a month | 18% |
| Once per week | 11% | Once per week | 18% |
| \(2-3\) times a week | 26% | \(2-3\) times a week | 21% |
| \(4-5\) times a week | 30% | \(4-5\) times a week | 18% |
| Everyday | 13% | Everyday | 4% |
| Average price paid for a bottle of wine | Frequency of comparing wine prices | ||
| Less than 15$ | 11% | Every shopping | 33% |
| Between 15 and 30$ | 36% | Every other shopping | 13% |
| Between 31 and 50$ | 24% | Quite often | 33% |
| Between 51 and 70$ | 17% | Rarely | 15% |
| Between 71 and 100$ | 8% | Seldom | 3% |
| More than 100$ | 4% | Never | 3% |
| Average time spent at the retail shop | Frequency of socializing about wine | ||
| Less than 15 minutes | 33% | Every day to every week | 54% |
| Between 15 and 30 minutes | 55% | Every month | 20% |
| More than 30 minutes | 12% | Every couple of month to every year | 26% |
| Behavioral factors | No | Neutral | Yes |
| Attitude | |||
| Trust on organic wine | 1% | 17% | 82% |
| Environmental knowledge of organic wine | 1% | 11% | 88% |
| Health knowledge of organic wine | 1% | 14% | 85% |
| PBC | |||
| Importance of wine price | 55% | 17% | 28% |
| Social norms | |||
| Advice of family and friends | 24% | 30% | 46% |
| Habit | |||
| Habitual purchasing | 6% | 21% | 73% |
| Hedonic goals | |||
| Distinction of organic wine taste | 14% | 15% | 71% |
| Likeness of organic wine taste | 6% | 18% | 76% |
| Pleasure of drinking organic wine | 18% | 21% | 61% |
| Gain goals | |||
| Substitution if wine price increases | 42% | 14% | 44% |
| Normative goals | |||
| Influence of others at shop | 16% | 12% | 72% |
The ORVin Agent-Based Model
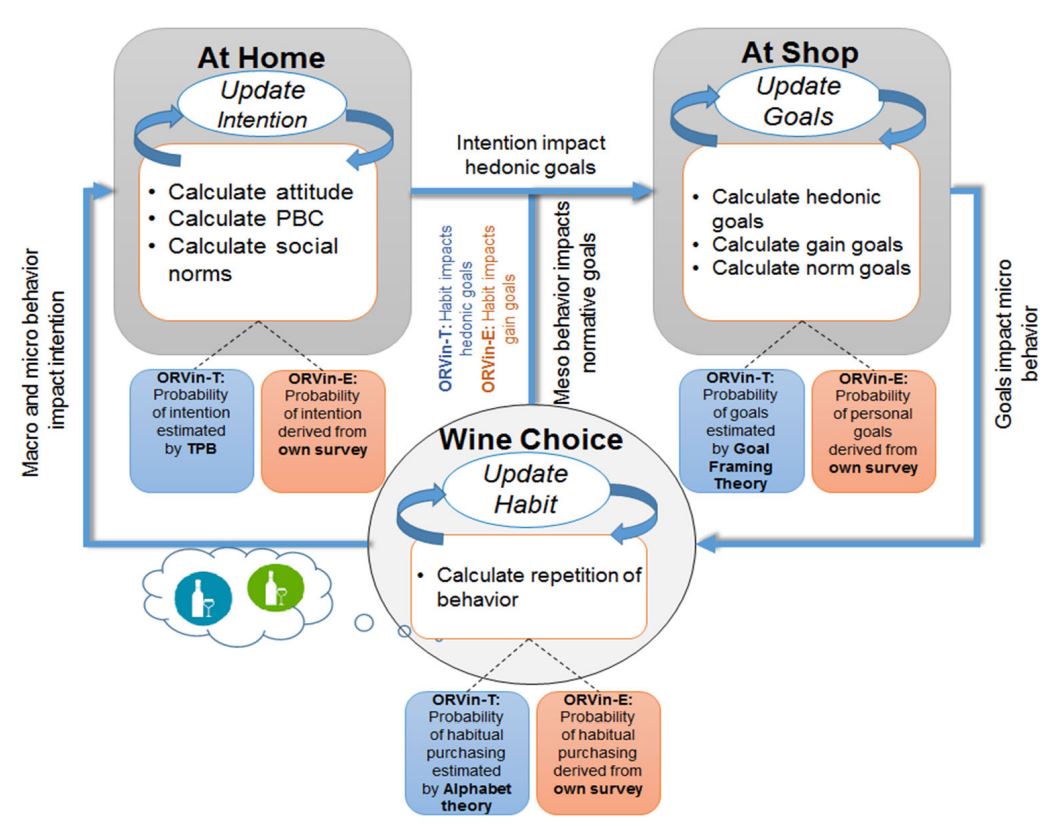
The ORVin model aims to explore the evolution of heterogeneous consumers’ organic wine preferences and evaluate the cumulative impacts of behavior change over time and space. According to TPB (Figures 2 and 3), individuals plan in advance to purchase either organic or conventional wines for their household in accordance with their attitude, perceived behavioral control (here limited to the price of wine), and subjective norms contingent on the opinions of their family and friends. The ABM assumes that consumers always do their wine-related shopping at the closest wine shop and both conventional and organic products are equally available across all shops at the same price.
Having made a decision based on TPB at home, individual agents go to shops (Figure 3). Certain factors at the shop, such as wine price, availability, and normative cues, can influence consumers’ intentions and divert their behavior from the planned choice. For instance, if the costs of both wine types are higher than the consumers’ budget, they leave the shop without purchasing any product. To investigate the impact of these factors on the relationship between intention and behavior, we use the principles of goal framing theory by considering the interactions between hedonic, gain, and normative goals and their correlations with intention (Figure 2). Besides this, past choices may affect future decisions, as reflected by alphabet theory. Hence, in the ORVin model, some consumers develop purchasing habits over time. According to Gardner (2015), a strong habit causes the intention to drift and can drive the behavior.
In what follows, we first introduce ORVin-T, a process-based model grounded in behavioral theories and parameterized partially with aggregated data. Then, we discuss ORVin-E, developed based on implicit empirical correlations from our micro-level survey data, described in the previous section. Figure 3 shows the conceptual difference between these two models. Our objective is to compare the quality and performance of theoretical and empirical ABMs to test the validity of results generated by theories for devising policies. The time step in the model is set to one week within a time window of 600 weeks.
Theory-driven model ORVin-T
ORVin-T largely relies on ORVin architecture (Taghikhah et al. 2020): the assumptions, structure, equations, and calibration settings of agents’ theory-driven behavioral model follow the theoretical framework in Figure 2. At initialization, a population of 1003 consumers is randomly distributed over the City of Sydney. We locate one wine retailer for each of the five major suburbs of this area, according to Google maps. It is assumed the shops sell similar wines for the same prices (i.e., there are no differences between the shops in the model). Empirical data collected from our survey informs only a few socio-demographic parameters of ORVin-T, including age, gender, education, income, household size, frequency of wine shopping and drinking, shopping size, and WTP more for organic wine. The theory-driven micro-foundations of ORVin-T imply that we explicitly coded the theoretical constructs such as attitude, PBC, social norms, habits, hedonic, gain and normative goals, the speed of information diffusions, and price elasticity. Values of these behavioral attributes characterizing consumer agents are set stochastically in ORVin-T. During the simulation, these theory-driven parameters are updated driven by the changes in the shopping experience and habits of agents, observations and social learning (e.g., the wine choice of others at shops), the exchange of information about wine within agents’ social networks (e.g., interactions with family and friends), which eventually determine wine consumers’ preferences. The overview, design concepts, and details (ODD) protocol for the base ORVin model and a full description of its sensitivity analysis tests are available in Taghikhah et al. (2020).
Data-driven model ORVin-E
In contrast, we develop ORVin-E by modifying some of the behavioral assumptions driving agents’ choices, given the insights from the survey (Figure 3). Namely, the modifications concern (\(i\)) introducing new parameters to the structure of sub-models, in PBC, habit and normative goal functions; (\(ii\)) relaxing assumptions of attitude, social norms, and gain goals calculations; and (\(iii\)) calibrating the model with empirical data for intentions and behavior. For agent parameterization, we use empirical data related to socio-demographics, shopping-drinking patterns, and behavioral factors to feed this model (the previous section reported the details of these factors and their values).
In ORVin-T this link between TPB and GFT has been made by using attitude/intention for estimating the hedonic goals. We also considered the influence of social norm (TPB) on the normative goals (GFT). For both empirical and theoretical models, the influence of intention on gain goals is defined in the agent rules. Besides, we defined the role of habits (alphabet theory) and their impact on hedonic (in ORVin-T) and gain goals (in ORVin-E). Finally, in Appendix B, we summarize the key differences between the two models in Table 8, with an indication of where theory (in terms of if-else rules/equations) or/data (in terms of parameter values) were used.
Below, we provide a brief description of the applied changes in the sub-models. Notably, the equations for estimating intention (\(F_{Ii}(t)\)) and goal frame (\(GO_{i}(t)\), \(GC_{i}(t)\)) remain unchanged in ORVin-T and ORVin-E. For more information, please refer to the ODD protocol in Taghikhah, Voinov, Shukla, Filatova, et al. (2020). In all equations, \(i = 1, \dots, n\), where \(n\) is the total number of consumers and \(j = 1, \dots, m\), where \(m\) is the total number of shops.
Attitude
In ORVin-T, for estimating attitude (\(TF_{Ai}(t)\)), we use an average of health concern, environmental belief, and drinker type, all of which are estimated based on age, gender, income level, education, wine knowledge, and shopping frequency from our survey. In addition, the willingness to change for agent \(i\) is approximated by the theory of cognitive dissonance (Festinger (1962); Appendix C.3.3 in Taghikhah et al. (2020)).
In ORVin-E, we estimate the attitude (\(EF_{Ai}(t)\)) of agent \(i\) based on disaggregated survey data as:
| \[EF_{Ai} (t) = Average(EF_{Ai1}(t), EF_{Ai2}(t), EF_{Ai3}(t))\] | \[(1)\] |
Perceived behavioral control
In predicting the perceived ease or difficulty of organic wine purchase, price and availability are amongst the most influential factors. In both ORVin-T and ORVin-E, PBC is only a function of perceived price elements (including organic wine price, conventional wine price and the willingness to pay a price premium for organic wine). Therefore, the importance of availability is excluded from both models because no stock-out condition is allowed. While ORVin-T considers the weight of price on PBC is equal to \(1\), ORVin-E extracts this parameter from the survey. The formulation of PBC (\(EF_{Pi}(t)\)) in ORVin-E is as follows:
| \[EF_{Pi}(t) = EW_{Pi}EF_{Pi1}(t)\] | \[(2)\] |
Social norms
Drinking wine with friends, family, or workgroups internalizes the social norms for wine consumption and preferences in individuals. For determining social norms, we asked the following question: “Please consider the hypothetical situation of choosing a bottle of wine for family consumption from the supermarket shelf: rank the decision factors including price of wine, health impacts, environmental impacts, convenience of shopping, and advice of others base on their importance to you”. This helps us to elicit the relative importance of social norms when choosing wine.
In ORVin-E, the perceived subjective norm of consumer \(i\) (\(EF_{Si}(t)\)) is calculated as:
| \[EF_{Si}(t) = EW_{Si} \frac {F_{Spoi}(t)}{F_{Spi}(t)}\] | \[(3)\] |
Habit
The habit concept is highly relevant to wine-purchasing behavior (Pomarici & Vecchio 2014; Vecchio 2013). Habit formation follows an asymptotic curve, as a remarkable increase can be observed in behavior automaticity in the initial repetitions, and the automaticity growth rate gradually reduces until the behavior approaches its limit of automaticity (i.e., asymptote to be reached) (Lally et al. 2011). The ORVin-T model assumes all consumers could develop habitual purchasing. In an experimental study about the impact of habit on promoting healthy eating and drinking behavior, Lally et al. (2010) found that for reaching up to 95% of the asymptote of atomicity, on average, 66 repetitions are required within a range between 18 to 254. As such, a triangular distribution that takes numbers between 18 and 254 with mode 66 is assigned to the action repetition attribute indicating the minimum number of times households should purchase a particular wine type before this preference becomes a habit. More details about the habit function in the theory-driven model is presented in Taghikhah et al. (2020). The empirical analysis related to the influence of habits on wine purchasing behavior can be found in Taghikhah et al. (2021).
To ensure the estimation of habit function is consistent with the empirical data in ORVin-E, we modify the habit function (\(EH_{i}^{e}\)) as:
| \[\begin{aligned} EH_{i}^{o}(t) &= \left \{ \begin{array}{ll} min (unif (0.7,0.9, Rand), H_{i}^{e}) & \mbox{if $ NE_{i}^{o}(t) > R_{i} \quad and \quad NE_{i}^{c}(t) < 0.3*NE_{i}^{o}(t)$} \\ 0 & \mbox{otherwise} \\ \end{array} \right.\end{aligned}\] | \[(4)\] |
Hedonic goals
Personal interests, egoistic values, and enjoyment drive hedonic goals. Predicting the hedonism of households is hindered since it is difficult, if not impossible, to measure emotions and pleasure. In ORVin-T, we assume the value of hedonic goals for organic and conventional wine is determined by either intention or habit, depending on which one drives the behavior. If the habit of household \(i\) is stronger than his/her intention at time \(t\), then with a high probability, habitual behavior guides the action and is considered the value of hedonic goals. Moreover, if a strong habitual behavior exists, only under a stronger intention/motivation or interrupted purchasing pattern, this habit will be changed.
In ORVin-E, however, we estimate the hedonic goals (\(EFH_{i}^{o}(t)\)) of agent \(i\) by explicit consideration of survey data as:
| \[EFH_{i}^{o}(t) = F_{Ii}(t) Average (EF_{Hi1}(t), EF_{Hi2}(t), EF_{Hi3}(t))\] | \[(5)\] |
Gain goals
In the gain goal-frame, the individuals choose the most convenient or cheapest options available. Minimizing expenditure is a popular objective for initiating gain goals when making purchasing decisions. In ORVin-T, we estimate the organic versus conventional gain goal of agent \(i\) by dividing the price of organic wine into the price of conventional wine and vice versa for organic gain goal.
In ORVin-E, to find out the strength of gain goals, our survey asks whether respondents substitute their preferred wine type if its price increases or the product is no longer available (refer to Appendix A). If consumer \(i\) has a willingness to change (\(WTC_{i}\)) to other wine types, we assume that the gain goals actively drive their decisions. Moreover, the correlation analysis conducted by Taghikhah et al. (2021) highlights a negative relationship between gain goals and habits. Thus, in the absence of \(WTC\), only price of products can drive the gain goals, whereas, if the person is willing to switch to substitute products, then habits can modify the influence of price on their goal.
Accordingly, we modify the gain goal function (\(EFG_{i}^{o}(t)\))in ORVin-E as:
| \[\begin{aligned} EFG_{i}^{o}(t) &= \left \{ \begin{array}{ll} 1-\frac{P_{o}(t)-EWTP_{i}}{P_{o}(t)+P_{c}(t)} & \mbox{if $ WTC_{i} \neq 0$} \\ 1-\frac{P_{o}(t)-EWTP_{i}}{P_{o}(t)+P_{c}(t)} (1-FH_{i}^{o}(t)) & \mbox{otherwise} \\ \end{array} \right.\end{aligned}\] | \[(6)\] |
Normative goals
For modeling the effect of normative motive, we assess social dynamics based on individuals’ observations at the wine shop. In both models, agent \(i\) observes the wine choice of other shoppers at the wine shop. This observation is linked with the concept of social learning, which can prompt unplanned purchasing decisions. In ORVin-T, we assume the influence of other shoppers’ choices on the wine-purchasing decisions of all agents is equal. Nevertheless, in ORVin-E, for estimating the normative goals, we asked the respondents the following question: “Please rate to what extent does the choice (or advice) of these people influence your wine preference (family, friends, other shoppers at store, shop staff, social media”. This allows us to assess the instant influence of shopping environment and the choice of others at the shop on the wine purchasing decisions at the time of purchase. Considering the empirical data on the importance of other shoppers’ choices for consumer \(i\) (\(W_{Ni}\)) by modifying normative goal function (\(EFN_{i}^{o}(t)\)) as:
| \[EFN_{i}^{o}(t) = EW_{Ni} \frac{F_{Noji}(t)}{F_{Nji}(t)}\] | \[(7)\] |
Finally, we designed question “How often do you talk with family, friends and neighbours about your drink choice?” - to determine the interaction rate of agents and the speed of information exchange in the population.
Results and Discussion
Calibration, validation and sensitivity analysis
For ORVin-T, we use the calibrated values of ORVin1 (Taghikhah et al. 2020). We calibrate ORVin-E by adjusting the weights of behavioral factors (i.e., attitude, social norms, PBC, hedonic goals, gain goals, and normative goals) to reproduce the survey data. Specifically, the weights of three intention components—attitude, PBC, and social norms—are calibrated against the survey data for the percentage of consumers who intend to purchase organic wine. We then use the data on the number of organic wine consumers for calibrating a set of parameters related to goals, including the weights of gain, hedonic, and normative goals.
Table 4 presents the list of calibrated parameters and their associated values, delivering the best fit. In both models, the population is heterogeneous following a certain statistical distribution, which in the case of ORVin-E is derived from empirical data and in the case of ORVin-T from social theories. These values only determine the weights to be used when accounting for both intention and behavior.
| Calibrated parameters | ||
| ORVin-T (the same as in ORVin) | ORVin-E (using survey data) | |
| Weight of attitude | 0.55 | 0.8 |
| Weight of social norm | 0.16 | 0.2 |
| Weight of PBC | 0.6 | 0.1 |
| Weight of hedonic goals | 0.8 | 0.1 |
| Weight of gain goals | 0.4 | 0.25 |
| Weight of normative goals | 0.2 | 0.15 |
The results of calibration show that both models agree that it is mainly attitudes that drive intention for purchasing wine. However, they disagree with regard to the underlying factors driving behavior. While the theory-driven model identifies hedonic goals to have the highest weight on consumers’ wine choice, the data-driven model finds the importance of gain goals to be the highest.
Before conducting other standard model tests and scenario analysis, we compare the baseline runs from the two models.
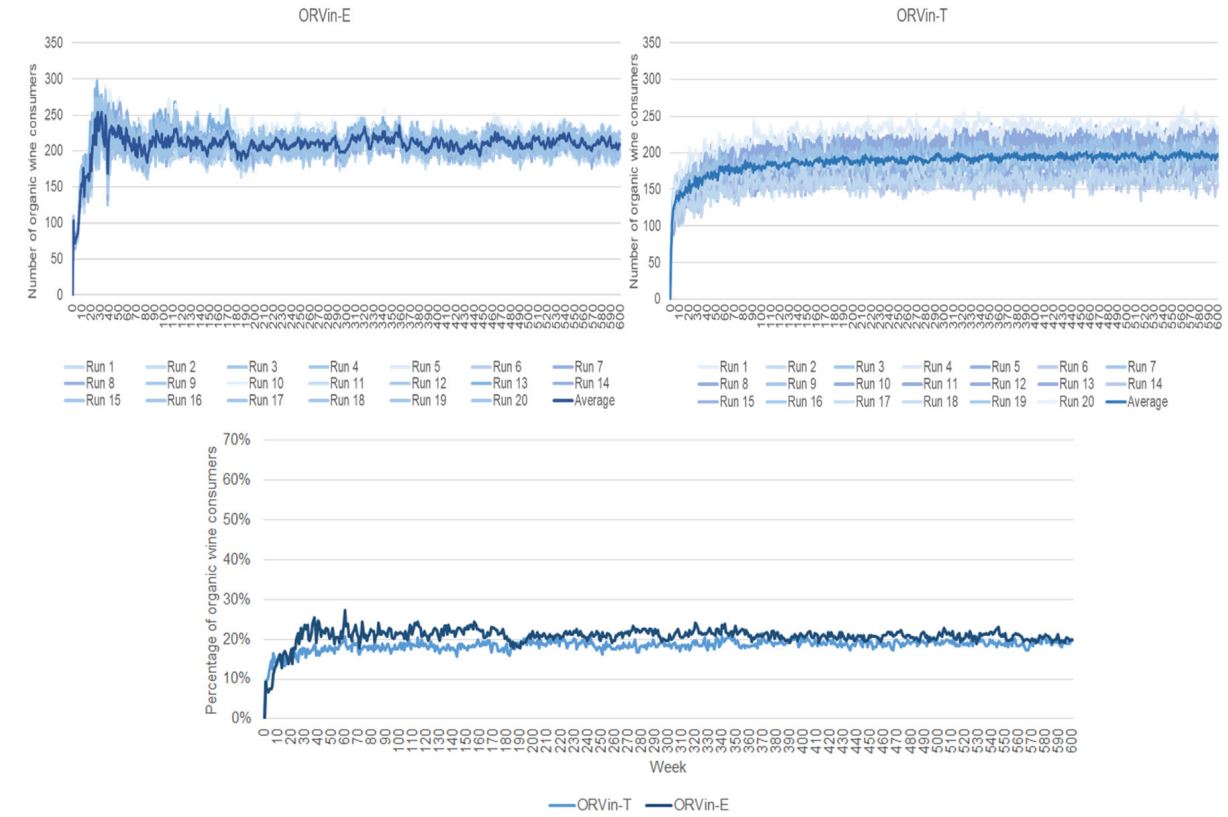
Figure 4 demonstrates a slight difference (up to 5%) in the stabilization level of two models over the simulation period, with ORVin-E reaching the equilibrium nearly 100 weeks faster than ORVin-T.
We empirically validate ORVin-T and ORVin-E by fixing the parameters across the model and then assessing the intention and behavior outputs against the survey data at the aggregated (city) and individual (person) levels.
| Attitude | |||
|---|---|---|---|
| Validation | ORVin-T | ORVin-E | Empirical data |
| Aggregated level | 60% | used for calibration | 85-95% organic consumers |
| Individual level | 591 Consumers correctly predicted | used for calibration | 1003 consumers |
| Intention | |||
| Aggregated level | 40% | used for calibration | 79-83% organic consumers |
| Individual level | 422 Consumers correctly predicted | 841 Consumers correctly predicted | 1003 consumers |
| Behavior | |||
| Aggregated level | 18-20% | used for calibration | 18-22% organic consumers |
| Individual level | 767 Consumers correctly predicted | 731 Consumers correctly predicted | 1003 consumers |
The results of ORVin-T validation at the aggregated level show that, with regard to behavior, the estimations are consistent with the empirical data (18%-20% compared to 18%-22% in Table 4). However, when comparing the attitude and intention outputs with empirical data, the estimation errors are approximately 25% (60% compared to 85%) and 40% (40% compared to 80%), respectively. Concerning the results at the individual level, the estimation accuracy of behavior in the ORVin-T model is significant at 76% (the behavior of 767 out of 1003 consumers is correctly predicted). Note that although ORVin-T has not been calibrated with our survey data, it can still provide reasonably accurate predictions of consumer preferences. Regarding the validation of ORVin-E at the individual level, we can see that the error of estimations for intention and behavior is relatively low: 16% and 27%, respectively.
Moreover, with regard to retrodictive validation, in line with the respective observed pattern in historical time series, the result of the model-generated wine consumption pattern for both models is almost constant. The validated models allow us to explore consumers’ wine preferences and test strategies that may be effective in changing their behavior.
We compare the sensitivity to the values of behavioral factors in both models—ORVin-T and ORVin-E—using the one-factor-at-a-time (OFAT) method. Table 5 reports the percentage of change in the model outputs through varying the model inputs by $$20% of their base case values. Compared with the theory-driven model (range of change between -44% and +55%), the data-driven ORVin-E model is more sensitive to behavioral factors (range of change between -71% and +200%). This is likely because the empirical model is developed based on the survey data, and it will always perform better (i.e., over-perform) when tested on the dataset from which it is derived. Hence, introducing fluctuations to the parameters and data on which it is built can cause higher uncertainty in the data-driven models. In other words, the theory-driven model is more stable.
| Percentage of change | |||||
| Parameters | Model version | -20% | -10% | 10% | +20% |
| Attitude | ORVin-T | -28% | 0 | +11% | +28% |
| ORVin-E | -29% | -19% | +52% | +71% | |
| Social norms | ORVin-T | +33% | +22% | -22% | -17% |
| ORVin-E | +76% | +71% | -14% | -24% | |
| PBC | ORVin-T | +22% | 0 | 0 | 0 |
| ORVin-E | +62% | +62% | -10% | -14% | |
| Hedonic goals | ORVin-T | -44% | -17% | +39% | +50% |
| ORVin-E | -71% | -62% | +71% | +200% | |
| Gain goals | ORVin-T | +28% | +17% | 0 | -17% |
| ORVin-E | +100% | +81% | -29% | -50% | |
| Normative goals | ORVin-T | +50% | +44% | -22% | -44% |
| ORVin-E | +62% | +52% | -10% | -24% | |
Both models have the highest sensitivity to the changes in the weight of hedonic goals. In the case of ORVin-T, the weight of normative goals is as sensitive as the weight of hedonic goals, but it is not valid for the empirical model. Taghikhah et al. (2020) associated the high sensitivity of outputs to normative goals to the undercover altruism in organic purchasing behavior. This social phenomenon assumes individuals may choose to hide their virtuous, moral behavior in public to avoid awkward social situations and to integrate within a social group (Scalco 2017). Nevertheless, the ORVin-E sensitivity results show the importance of gain goals, mainly linked to the changes in price and availability, when purchasing wine.
Granularity of behavioral data matters for policy scenarios
The probabilistic theory- and data-driven rules of our ABMs deliver dynamic consumption patterns. These methodological differences may be subtle unless they create qualitatively different emerging patterns, which is especially vital when analyzing policy scenarios. Currently, the application of theories in predicting the extent of behavior change and the impacts granularity of data (average population-level vs. disaggregated data) may have on model outputs are unknown (Muelder & Filatova 2018). Therefore, we test any possible deviations between the emerging patterns of ORVin-T and ORVin-E under three behavioral change scenarios: increasing conventional wine tax, launching organic social-informational campaigns, and their combination. We apply the three scenarios after week 150 in the ABMs when the simulated market saturates, as the wine preferences of all agents are revealed. All of the resulting figures present an average of 20 simulation runs.
Increasing tax on conventional products
In the first set of experiments, we investigated the effect of increasing the Wine Equalization Tax (WET) on conventional wine from the current 29% to 50%. The rise in prices of less environmentally friendly products lasts for the whole simulation period. We also experiment with the extent of change if the new taxation scheme discontinues after 300 weeks (consistent with interventions suggested by Taghikhah et al. 2020). Figure 5 compares the differences in the ratio of organic wine consumers in ORVin-T and ORVin-E that result from applying this scenario.

Applying a higher tax on conventional wine leads to an increase in its price from 10$ to 11.42$. In both models, we observe significant growth of 20% points in the number of organic wine consumers compared to the baseline at the end of the simulation (week 600). As the results from ORVin-T are the same as ORVin-E (at nearly 40% of organic wine diffusion), we can consider that in this case, theories could successfully measure the extent of change in food preference. However, the predicted rate of behavioral change (i.e., derivative of the graph) in the data-driven model is larger than that of the theory-driven model. From the theoretical perspective, this difference indicates that, based on empirical data, the price elasticity of wine is higher. From the modeling perspective, it shows theories may underestimate the speed of change, as in the case of ORVin-T.
Further results for the impact of learning illustrate that, if 20% extra tax on conventional wine is removed in week 450, both models show the percentage of organic wine consumers stays almost 10 points higher than the baseline (Figure 5). Hence, the imposed increase in the tax on conventional wine makes the prices of organic wine competitive. While being only a temporary stimulus, it triggers a formation of new habits—purchasing organic products—that remain after the tax is suspended. That said, the rate of change is slower in ORVin-E than the rate predicted by ORVin-T. This difference indicates the strong influence of habits on consumers’ food choices and the challenges associated with breaking them. Overall, we can conclude that, in response to the increase in wine price, consumers adopt substitute products quicker than theory predicts. Still, the estimation of effectiveness and percentage of diffusion is the same in the data and theory-driven models.
Developing a social information marketing program
The power of ABMs is in accounting for behavioral aspects in addition to pure economic reasoning driving consumer choices. This permits us to go beyond the assessment of price-based policies and explore the effectiveness of launching an intensive social-informational marketing program for raising the environmental and health awareness of consumers. We assume the campaign is directed to all agents. Depending on the agent’s learning ability (set as uniform distribution in the interval \([0.1, 0.2]\)) and the success rate of social marketing program (set as uniform distribution in the interval \([0.1, 0.2]\)), individuals acquire knowledge at the rate of the program’s success level times their own learning ability. In ORVin-T, we assume gaining new knowledge about the environmental and health benefits of organic products increases the positive attitude of agents towards organic food. However, in the empirical model, knowledge acquisition only leads to trust and positive attitudes toward organic food. Similar to the tax scenario, in assessing the effect of past behavior and learning, we keep the informational campaign active for only 300 weeks (Figure 6).

Both models report that the information campaign increases the ratio of organic wine adoption (Figure 6) but not as much as the taxation scenario (Figure 5). Results obtained from ORVin-E show a 10% increase in organic wine consumers, slightly (4%) higher compared to the results of the theory-driven version. This implies that, in practice, by changing the knowledge and attitude of consumers, in our case study, we observe a bigger change in organic adoption than that predicted by theories. The empirical model highlights the higher strength of the attitude-behavior relationship. We observe the propagation of change patterns in these models, as well as the drop in the percentage of organic wine consumers after the suspension of the intervention (3.5% reduction), are similar.
In summary, there is not a considerable discrepancy between the estimations of ORVin-T and ORVin-E with regards to the influence of information campaigns for changing food preferences. This result is consistent across the two versions of the model. In line with Taghikhah et al. (2020), our finding confirms that increasing awareness is amplified by dynamically shaped habits, creating a lasting effect associated with this intervention.
Joint effects of market-based and information policies
In the third set of experiments, we evaluate the effectiveness of a combined tax-marketing scenario in changing behavior towards organic products (Figure 7).

As a result, in ORVin-T and ORVin-E the number of organic consumer increases by a little more than 40% and 35%, respectively, compared to the baseline. According to both models, the growth in the percentage of organic adoption is 5-10 points higher than when applying the scenarios separately, meaning that information and price policies amplify the positive effect of each other. Notably, while the rates of change in the empirical model for the two separate scenarios are slightly higher than the theoretical counterpart, its reported emergent effect from combined interventions is 5% lower. Therefore, according to ORVin-E, information and price policies together deliver higher diffusion rates of organic products compared to their individual effects (see Figure 7 b versus Figure 6 b and 5 b). Yet, when agents follow empirically-defined rules, we observe a suppression of individual policy effects on promoting organic products (compare Figures 7 a and 7 b).
Moreover, the percentage of organic consumers after removing the combined intervention in the ORVin-E model drops by 15% and stands at 40% (dashed lines in Figure 7 b). The reduction rate in this model is 5% higher than that in ORVin-T (10% drop). We may explain this small gap to the different approaches (theoretically defined versus empirically calculated from the survey) that we take in these models to measure willingness to change, which can indirectly influence intentions and goals. According to cognitive dissonance theory (Festinger 1962), individuals who act against their attitude may develop a willingness to change, as confirmed by ORVin-T outputs (Figure 7 a). However, in practice, we observe many conventional consumers demonstrate a positive attitude and intention toward organic food yet are unwilling to change their choice, as indeed ORVin-E results illustrate (Figure 7 b). This inner inconsistency underlines the higher strength of personal goals and habits compared to intentions for driving behavior.
After all, the findings confirm that simultaneously implementing the market-based and awareness-based interventions can lead to non-additive growth in the share of consumers preferring organic products. We reiterate the explanation for this effect from Taghikhah et al. (2020). First, due to the co-dependence of behaviors (Jager & Ernst 2017), change in the social environment can pressure and amplify the change in individual preferences. Second, we can observe a cascade of change by getting over the 35% tipping point only if the scenarios are applied simultaneously. Third, conformity rather than social learning plays the dominant role in purchasing wine.
Although the credibility of results generated by the theory-driven model to understand the effectiveness of interventions is sensible, still, we need data to ensure the reliability of the model. At the same time, interpreting data-driven rules in terms of the theory is important to understand the underlying processes and mechanisms. However, it may not be easy and quick to implement.
Conclusions
There is a growing awareness that consumption is as important as production when decreasing the pressure on the environment. Agent-based models of consumer behavior play a significant role in assessing policies and market design options and in devising potential pathways for transitions toward sustainable consumption. Given the urge to develop ABMs for policy support, the interest in going beyond theory-driven micro-foundations of agents’ decisions is strong. Hence, the number of empirical ABMs to examine consumption patterns grows in scope and scale. This paper attempts to address some of the knowledge gaps and questions regarding replacing data-driven rules with theory-driven rules in the absence of micro-level data when analyzing policies to promote sustainable behavior. We also reflect on when one should be cautious in interpreting results from theory-driven models compared to data-driven ones. Although relative advantages of theoretical and empirical modeling approaches have been acknowledged (Deichsel & Pyka 2009; Moss 2008; Windrum et al. 2007), to the best of our knowledge, this is the first study that extends the scope of model comparison to sensitivity and scenario analyses. We argue that going beyond the comparison of baseline models is essential when attempting to understand the validity and explanatory power of ABMs.
To this end, our paper presents a framework for comparing the performance of theory-driven and data-driven ABMs. We apply this framework in the context of food-purchasing behavior, selecting ORVin as an example of a theory-driven ABM that integrates behavioral change theories from psychology in a simulation model to explore implications of consumer preferences for organic products. We briefly present the results of a survey among the Australian population and use aggregate average values from this survey to inform the parameters of the theory-driven rules of ORVin-T ABM. We then develop ORVin-E, which is grounded in the data-driven rules at the agent level. Here, the survey data are used to relax several theoretical assumptions, thus modifying equations and improving calibration on disaggregated data.
- Empirical validation of the theory-driven behavioral micro-foundations: Comparing the baseline results, both theory-driven and data-driven models successfully predict the magnitude of the current organic market in our case-study areas in Sydney, Australia, with high accuracy (errors in estimation were found to be less than 30%) at both the aggregated and individual scales. These results are quite significant for validating theory-driven ORVin-T, since, with no changes in the structure or extra efforts for calibration, it succeeds in reproducing outputs, which are unbiased and reasonably close to the real-world observations. Hence, by using theory-driven rules parameterized with secondary literature data and aggregated survey data, we generate high-level insights on the diffusion of organic wine consumption, which do not differ significantly from the results of the empirical model.
- Robustness of simulated policy outcomes under theory-driven vs. data-driven micro-foundations: We argue that a comparison of models should go beyond the basic match of outputs to analyze possible differences in sensitivity and policy scenario analysis. By analyzing market-based and information policy scenarios, we show that, in general, both models deliver similar results. The response of the artificial population in the models to the combined market and information strategy confirms the existence of non-additive effects and the occurrence of a cascading preference change from conventional to organic food at the 35% consumer tipping point. This is consistent with other studies confirming a nonlinear effect of policies, which alter behavioral factors and price structure, on pro-environmental choices (Niamir et al. 2020). Our scenario analysis results add to the validity of ORVin-T for assessing the influence of policies and evaluating the extent of changes in individual organic preferences for the entire population.
- Synergies between theory-driven and data-driven ABMs: Ideally, when analyzing the impacts of policies promoting sustainable behavior, it is desirable to develop models informed by data. Yet, a lack of empirical micro-level data on socio-psychological factors should not necessarily prevent exploratory policy analysis. Our study highlights the added value of theories for developing credible behaviorally-rich ABMs in testing the effectiveness of different policies in the case of an organic wine shift. Through this example, we show that by developing theory-driven models, researchers can unfold complex decisions and behaviors in a transparent and accessible manner. In the context of this research, theory-driven ABM proved useful in linking specific case-study results to the larger generic social phenomena that may have broad applicability across different decision-making contexts. However, other studies comparing empirical with theoretical ABMs are required to confirm the validity of our observations.
The knowledge derived from empirical studies, such as surveys, lab/field experiments, or participatory workshops, is essential for overcoming these limitations, testing the validity of alternative behavioral theories at the agent level against empirical data, or for theory development (Smaldino et al. 2015). When operational or policy decision-making is driven by high stakes in the long-term, for a society or individuals, it is essential to validate the micro-foundations guiding agents’ rules empirically. However, if stakes of individual decisions are small, changes in behavior are incremental, and choices are already relatively well studied in the theoretical literature (for example, where theories are already tested on marketing data), then theory-driven models could likely be used with confidence. A combination of data-driven rules and theory-driven processes/mechanisms is important when an ABM is to anticipate a major systemic shift, a societal transition/transformational change. The theoretical ABMs inform the empirical models and vice versa, and thus, their integration can create cumulative scientific knowledge while advancing theory.
This study has a number of limitations that suggest several potential directions for future research. Firstly, as with other stated preferences surveys, ours relies on self-reported behavior rather than actual consumption behavior. Survey respondents could be prone to social desirability bias in reporting their intention for organic products, and their elicited behavior can only be interpreted as their reported choices; it is not their real behavior. One possible future direction is to compliment households’ survey data that elicit preferences and psychological factors impacting choices with the actual market consumption behavior data for validation. Another limitation of our study concerns the generalizability of the findings. Considering the fact that our study compares two very specific and non-exemplary theory- and data-driven models, the conclusions relate to this case rather than to the ABM field as a whole. Future research may focus on the systematic comparison between theory- and data-driven models across a range of cases, with incremental and drastic behavioral changes. We acknowledge that granular behavioral data helps reduce biases, assumptions, and errors, expand simulation capabilities, and enhance the accuracy of results.
Nevertheless, these advantages may be offset by uncertainty due to the diversity of social theories explaining behavioral changes and many conceptual – but difficult to formalize – factors driving the key socio-psychological processes that need to be parameterized. If data-driven models are not accompanied by theories, an understanding of the underlying decisions and the prevailing behavioral processes in each case-study is undermined, limiting the applicability of models to other cases and the generalization of results. Therefore, we recommend future research to consider the theory-driven process-based representation and causal relationships of individual decision-making mechanisms in empirical ABMs. We acknowledge that the decision between taking a theory- or empirically-based modeling approach depends on the modeling purpose and the availability of micro-level data.
Model Documentation
Both models are programmed in AnyLogic Software, and the code is freely available online at https://www.comses.net/codebase-release/c9a21217-ed18-4649-aebf-abc329a9a5d7/.Acknowledgments
Authors wish to thank the editor and three anonymous reviewers for their valuable comments and suggestions on this manuscript. We would like to thank the UTS PERSWADE Research Center, Australian Mathematical Sciences Institute (AMSI), and Australian Postgraduate Research Intern (APR.Intern) for funding the survey.Notes
- 1ORVin used the aggregated secondary data from Ogbeide et al. (2015) field experiment on Australians’ interest in organic wine.
Appendix
A: Questionnaire
Title: Extending supply chain to address sustainability
Dear Respondents, We are conducting research to understand how people make decisions about the wine they want to drink. The goal of our project is to develop a decision-support tool for transitioning towards more sustainable wine production-consumption. We trust that the choices of customers - as one of the most important stakeholders - are key to such transition.
Your information will enable us to understand the needs of wine consumers and hopefully improve your experience with wine products in the future. The responses to this survey will be anonymous and no identifying information will be linked to your responses. This research went through an ethics approval and is in line with the ethical guidelines and privacy requirements of the University of Technology Sydney.
Should any questions or concerns arise about the survey or the project in general please send an email to Firouzeh.th@gmail.com.
Q1: Are you \(\dots\)?
Male (1)
Female (2)
Prefer not to say (3)
Q2: Within which age group do you fall?
- 18 to 25 years (1)
- 26 to 35 years (2)
- 36 to 45 years (3)
- 46 to 55 years (4)
- 56 to 65 years (5)
- 66 years or more (6)
Q3: What is the highest education level in your household?
- Primary (1)
- Secondary (2)
- Graduate (3)
- Post-graduate (4)
Q4: What is the average income of your household?
- Less than 45,000$ (1)
- 45,000 to 75,000$ (2)
- 75,001 to 150,000$ (3)
- 150,001 to 250,000$ (4)
- More than 250,000$ (5)
Q5: Do you like the taste of organic wine?
- Yes (1)
- No (2)
- Neutral (3)
Q6: Do you find a distinction between the taste of organic and conventional wine?
- Yes (1)
- No (2)
- Neutral (3)
Q7: Do you think organic wine is tastier than conventional wine?
- Yes (1)
- No (2)
- Neutral (3)
Q8: Have you ever purchased organic wine?
- Yes (1)
- No (2)
Q9: If “Yes”, proportionately, how much of your shopping size is organic wine? (in percent)
- 0% - 25% (1)
- 26% - 50% (2)
- 51% - 75% (3)
- 76% - 100% (4)
Q10: Do you buy organic wine for special occasions?
- Yes (1)
- No (2)
Q11: How frequent do you purchase wine?
- Every day (1)
- 4-5 times a week (2)
- 2-3 times a week (3)
- Once per week (4)
- Few times a month (5)
- Once per month (6)
- Few times in a year (7)
Q12: How much time do you usually spend in a wine shop?
- Less than 15 mins (1)
- Between 15-30 mins (2)
- More than 30 mins (3)
Q13: Do you buy wine of a particular brand every time?
- Always (5)
- Sometimes (4)
- Maybe (3)
- Seldom (2)
- Never (1)
Q14: Please rate the following statement when thinking of purchasing wine. Purchasing a certain type/brand of wine (either conventional or organic) is something that \(\dots\)
| Strongly agree (5) | Agree (4) | Neutral (3) | Disagree (2) | Strongly disagree (1) | |
| I do frequently (1) | |||||
| I do automatically (2) | |||||
| I do without thinking (3) | |||||
| belongs to my (daily, weekly, monthly) routine (4) | |||||
| I start doing before I realize I’m doing it (5) | |||||
| I would find hard not to do (6) | |||||
| I have been doing for a long time (7) | |||||
Q15: Please respond to these statements by indicating true or false and if not sure, indicate so.
| Strongly agree (5) | Agree (4) | Neutral (3) | Disagree (2) | Strongly disagree (1) | |
| Chemicals used for wine production have an effect on the environment (1) | |||||
| Wine produced from grapes grown with no chemical application is higher in antioxidants (2) | |||||
| The antioxidant in wine helps to reduce cholesterol in the blood (3) | |||||
| Consumption of naturally produced products reduces diseases risk (4) | |||||
| Organic wine has specific health benefits that reduce the risk of developing diseases (5) | |||||
| Added chemicals in wine have long term effects on consumer health (6) | |||||
Q16: Please state your level of agreement with each of these statements.
| Strongly agree (5) | Agree (4) | Neutral (3) | Disagree (2) | Strongly disagree (1) | |
| I believe that climate change is real and I am very concerned (1) | |||||
| If we continue on our present course, we will soon experience a major ecological catastrophe (2) | |||||
| I think that humans are responsible for climate change issues (3) | |||||
| I think organic vs conventional farming increases species richness and benefits biodiversity (4) | |||||
| I would be willing to change my behaviour to address environmental concerns (5) | |||||
| By changing my shopping habits, I can affect other people’s habits (6) | |||||
| I do not purchase products that damage the environment (7) | |||||
| I feel that by purchasing organic (bio) food products, I can protect the environment (8) | |||||
| I would like to have more information about organic products (9) | |||||
| I am willing to spend more money on organic products (10) | |||||
| I prefer organic wine to non-organic wine since it is healthier (11) | |||||
| I look for sustainability labels when I go shopping (E.g. NASAA, ACO, OGA organic, Principles/Practices, DEMETER Biodynamic) (12) | |||||
Q17: Please indicate your level of support for these statements.
| Strongly agree (5) | Agree (4) | Neutral (3) | Disagree (2) | Strongly disagree (1) | |
| I trust in the health and environmental benefits of organic wine (1) | |||||
| I trust in the originality of organically labelled/claimed wine (2) | |||||
| I trust that my purchase of organic wine helps to promote sustainable lifestyle (3) | |||||
| I trust Australian institutions that certify organic foods (4) | |||||
Q18: Please consider the hypothetical situation of choosing a bottle of wine for family consumption from the supermarket shelf: Please rank the following decision factors based on their importance to you. (1= least important, 5=most important)
- Price of wine (1)
- Health benefit of wine (2)
- Environmental benefit of wine (3)
- Convenience (4)
- Advice of others (5)
Q19: How much do you pay on average for a bottle of wine?
- Less than 15 (1)
- 15-30 (2)
- 31-50 (3)
- 51-70 (4)
- 71-100 (5)
- More than 100 (6)
Q20: What is the maximum amount you would pay for a bottle of wine?
Q21: Are you willing to pay more for organic wine compared to a conventional wine with similar characteristics?
- Yes (1)
- No (2)
Q22: How much more are you prepared to pay for an organic-labelled certified wine bottle over the “everyday price” (Assume that everyday price is 10$ per bottle)?
- Not willing to pay more (1)
- Willing to pay less than 10% more (2)
- Willing to pay less than 20% more (3)
- Willing to pay less than 30% more (4)
- Willing to pay less than 40% more (5)
- Willing to pay over 50% more (6)
Q23: How often do you compare prices of different wines?
- Every time you purchase wine (1)
- Every other shopping (2)
- Quite often (3)
- Rarely (4)
- Seldom (5)
- Never (6)
Q24: What will you do if the price of your favorite wine increases by 20%-30%?
- Check the price of other wines and buy a cheaper wine (1)
- Will not buy wine and wait until its price decreases (2)
- Will buy my favorite wine at the new price (3)
Q25: What will you do if your favorite wine is not available at the store?
- Will not buy wine and will wait until my next shopping for wine (1)
- Check stores of other Sydney areas to get my favorite wine (2)
- Buy other available wines if it costs less (3)
- Buy other available wines if it has the same price (4)
- Buy other available wines even at higher prices (5)
- Do not know (6)
Q26: Please rate to what extent does the choices (or advice) of these people influence your wine preferences:
| Strongly agree (5) | Agree (4) | Neutral (3) | Disagree (2) | Strongly disagree (1) | |
| Family (1) | |||||
| Friends (2) | |||||
| Other shoppers at store (3) | |||||
| Shop staff (4) | |||||
| Social/mass media, commercials (5) | |||||
Q27:How often do you talk with family, friends and neighbours about your drink choice?
- Every day (1)
- Every week (2)
- Every month (3)
- Every couple of months (4)
- Every year (5)
B: ORVin-T versus ORVin-E
Table 8 summarizes the key differences in ORVin-T versus ORVin-E models side by side, with an indication on whether the rules are derived from theory or data. The list of notations used in equations is provided in Table 7.
| Variables | Definition | ||||
| \(F_{Ai1}(t)\) | Household \(i\) health belief at time \(t\) (driven from theory) | ||||
| \(F_{Ai2}(t)\) | Household \(i\) environmental awareness about organic wine at time \(t\) (driven from theory) | ||||
| \(F_{Ai3}(t)\) | Household \(i\) wine drinker types at time \(t\) (driven from theory) | ||||
| \(F_{Ai4}(t)\) | Household \(i\) willingness to change at time \(t\) (driven from theory) | ||||
| \(EF_{Ai1}(t)\) | Household \(i\) health belief at time \(t\) (driven from data) | ||||
| \(EF_{Ai2}(t)\) | Household \(i\) environmental awareness about organic wine at time \(t\) (driven from data) | ||||
| \(EF_{Ai3}(t)\) | Household \(i\) trust in organic products at time \(t\) (driven from data) | ||||
| \(EWTC_{i}\) | Household \(i\) willingness to change at time \(t\) (driven from data) | ||||
| \(W_{A1}\) | Weight of health belief (driven from theory) | ||||
| \(W_{A2}\) | Weight of organic awareness (driven from theory) | ||||
| \(W_{A3}\) | Weight of type of drinker (driven from theory) | ||||
| \(W_{A4}\) | Weight of willingness to change (driven from theory) | ||||
| \(F_{pi1}(t)\) | Household \(i\) perceived economic value of organic wine at time \(t\) (driven from data) | ||||
| \(F_{pi2}(t)\) | Household \(i\) perceived availability of organic wine for at time \(t\) (driven from data) | ||||
| \(W_{p1}\) | Weight of price (driven from theory) | ||||
| \(W_{p2}\) | Weight of availability (driven from theory) | ||||
| \(EW_{pi}\) | Weight of price (driven from data) | ||||
| \(F_{Spoi}(t)\) | Total number of household \(i\) ’s neighbors with organic wine preferences at time \(t\) (driven from theory) | ||||
| \(EW_{Si}\) | The influence of social norms on household \(i\) decisions (driven from data) | ||||
| \(NE_{i}^{o}(t)\) | The number of times household \(i\) purchased conventional wines at time \(t\) (driven from theory) | ||||
| \(H_{i}^{o}(t)\) | Households \(i\) habitual purchasing of organic wine at time \(t\) (driven from theory) | ||||
| \(F_{Nojit}(t)\) | The ratio of conventional wine shoppers to total wine shoppers with household \(i\) at shop \(j\) at time \(t\) | ||||
| \(F_{Njit}(t)\) | The ratio of organic wine shoppers to total wine shoppers with household \(i\) at shop \(j\) at time \(t\) | ||||
| \(EF_{Hi1}(t)\) | Households \(i\) finds a distinction between organic and conventional wine at time \(t\) | ||||
| \(EF_{Hi2}(t)\) | Households \(i\) tastes different flavors for organic and conventional wine at time \(t\) | ||||
| \(EF_{Hi3}(t)\) | Households \(i\) enjoys drinking organic wine more than conventional wine at time \(t\) | ||||
| \(F_{Ii}(t)\) | Household \(i\) intention for purchasing organic wine (driven from theory) | ||||
| \(H_{i}^{e}(t)\) | textbfHousehold \(i\) habits for purchasing organic/conventional wine (driven from data) | ||||
| \(EFH_{i}^{o}(t)\) | Household \(i\) intention for purchasing organic wine (driven from data) | ||||
| \(WTP_{i}\) | Household \(i\) willingness to pay more for organic wine (driven from data) | ||||
| \(P_{o}(t)\) | Price of organic wine at time \(t\) (driven from data) | ||||
| \(P_{c}(t)\) | Price of conventional wine at time \(t\) (driven from data) | ||||
| \(EW_{Ni}\) | The influence of normative goals on household \(i\) choice (driven from data) |
Looking into the existing literature on organic wine purchasing, we could not find any study reporting data on social network characteristics. Nevertheless, when it comes to alcohol consumption behavior, social disorganization theory (Sampson 1993) highlights the importance of neighborhood environments (Shih et al. 2017). In both ORVin-T and E, the social network of each household (macro-level network) includes neighbors living up to 400-800 meters away from them. The defined neighborhood type and buffer may influence the estimation of neighborhood effects (i.e., the effect of a particular neighborhood characteristic on wine choice) (Duncan et al. 2013). Individual relationships with peers, family and friends may modify neighborhood effects. While in ORVin-E, we considered the influence of family and friends on the wine choice, it is excluded from ORVin-T due to the lack of data. Hence, ORVin-T focuses only on social interactions with neighbors where households exchange information about wine preferences and continuously update their perceived subjective norms about wine types.
We also define another immediate social environment for each household: their observations of the wine choices of the surrounding consumers in shops (meso-level network). This social influence assumption is in line with the study of Scalco (2017) on consumer behavior for organic food. In both models, the number of social contacts that households may have is not predefined and is generated during the model run. However, in ORVin-E, we include the influence of observing the choice of others in the shop as well as the recommendation of shop staff on choosing a wine type. This parameter is estimated directly from empirical survey data. Question18, 26, and 27 are related to the social network.
| Behavioral Microfoundation | ORVin-T | ORVin-E |
| Attitude | \(W_{A1}F_{Ai1}(t) + W_{A2}F_{Ai2}(t)+\) \(W_{A3}F_{Ai3}(t) + W_{A4}F_{Ai4}(t)\) | \(Aver (EF_{Ai1}(t), EF_{Ai2}(t), EF_{Ai3}(t))\) |
| Perceived behavioral control | \(W_{p1}F_{pi1}(t) + W_{p2}F_{pi2}(t)\) | \(EW_{pi}EF_{pi1}(t)\) |
| Social norm | \(\frac{F_{Spoi}(t)}{F_{Spi}(t)}\) | \(EW_{Si}\frac{F_{Spoi}(t)}{F_{Spi}(t)}\) |
| Habit | \(unif(0.7, 0.9)\) \(if\) \(NE_{i}^{o}(t) > R_{i}\) \(and\) \(NE_{i}^{c} < 0.3* NE_{i}^{o}(t);\) \(0\) \(otherwise\) | \(min (unif(0.7, 0.9), H_{i}^{e}\) \(if\) \(NE_{i}^{o}(t) > R_{i}\) \(and\) \(NE_{i}^{c} < 0.3* NE_{i}^{o}(t);\) |
| Gain Goal | \(1-\frac{P_{o}(t) - WTP_{i}}{P_{o}(t)+ P_{c}(t)}\) | \(1-\frac{P_{o}(t) -WTP_{i}}{P_{o}(t)+ P_{c}(t)}\) \(if\) \(WTC_{i} \neq 0\) \(0\) \(otherwise\) |
| Normative Goal | \(\frac{F_{Noji}(t)}{F_{Nji}(t)}\) | \(EW_{Ni}\frac{F_{Noji}(t)}{F_{Nji}(t)}\) |
| Willingness to change | The theory of cognitive dissonance (Festinger 1962) | Directly from empirical survey data |
| Innovation diffusion rate | Randomly | Directly from empirical survey data |
| Time spent in the shop | Randomly | Directly from empirical survey data |
| Maximum price paid for wine | Randomly | Directly from empirical survey data |
References
AJZEN, I. (1985). From intentions to actions: A theory of planned behavior. In J. Kuhl & J. Beckmann (Eds.), Action control (pp. 11–39). Springer. [doi:10.1007/978-3-642-69746-3_2]
BELL, A. R. (2017). Informing decisions in agent-based models — A mobile update. Environmental Modelling & Software, 93, 310–321. [doi:10.1016/j.envsoft.2017.03.028]
BOERO, R., & Squazzoni, F. (2005). Does empirical embeddedness matter? Methodological issues on agent-based models for analytical social science. Journal of Artificial Societies and Social Simulation, 8(4), 6.
CALISTI, R., Proietti, P., & Marchini, A. (2019). Promoting sustainable food consumption: An agent-Based model about outcomes of small shop openings. Journal of Artificial Societies and Social Simulation, 22(1), 2. [doi:10.18564/jasss.3901]
CARUANA, R., Glozer, S., & Eckhardt, G. M. (2019). “Alternative Hedonism”: Exploring the role of pleasure in moral markets. Journal of Business Ethics, 166, 143–158. [doi:10.1007/s10551-019-04123-w]
CONTE, R., & Paolucci, M. (2014). On agent-based modeling and computational social science. Frontiers in Psychology, 5, 668.
CZUPRYNA, M., Franzke, C., Hokamp, S., & Scheffran, J. R. (2020). An agent-based approach to integrated assessment modelling of climate change. Journal of Artificial Societies and Social Simulation, 23(3), 7. [doi:10.18564/jasss.4325]
DEICHSEL, S., & Pyka, A. (2009). A pragmatic reading of Friedman’s methodological essay and what it tells us for the discussion of ABMs. Journal of Artificial Societies and Social Simulation, 12(4), 6.
DUINEN, R. van, Filatova, T., Jager, W., & Veen, A. van der. (2016). Going beyond perfect rationality: Drought risk, economic choices and the influence of social networks. The Annals of Regional Science, 57(2–3), 335–369.
DUNCAN, D. T., Kawachi, I., Subramanian, S., Aldstadt, J., Melly, S. J., & Williams, D. R. (2013). Examination of how neighborhood definition influences measurements of youths’ access to tobacco retailers: A methodological note on spatial misclassification. American Journal of Epidemiology, 179(3), 373–381. [doi:10.1093/aje/kwt251]
FESTINGER, L. (1962). A theory of cognitive dissonance. Stanford University Press.
GARCIA, R., Rummel, P., & Hauser, J. (2007). Validating agent-based marketing models through conjoint analysis. Journal of Business Research, 60(8), 848–857. [doi:10.1016/j.jbusres.2007.02.007]
GARDNER, B. (2015). A review and analysis of the use of “habit” in understanding, predicting and influencing health-related behaviour. Health Psychology Review, 9(3), 277–295. [doi:10.1080/17437199.2013.876238]
INTERGOVERNMENTAL Panel on Climate Change. (2019). Climate change and land.
JAGER, W. (2017). Enhancing the realism of simulation (EROS): On implementing and developing psychological theory in social simulation. Journal of Artificial Societies and Social Simulation, 20(3), 14. [doi:10.18564/jasss.3522]
JAGER, W., & Ernst, A. (2017). Introduction of the special issue “Social simulation in environmental psychology”. Journal of Environmental Psychology, 52, 114–118. [doi:10.1016/j.jenvp.2017.07.002]
JANSSEN, M. A., & Ostrom, E. (2006). Empirically based, agent-based models. Ecology and Society, 11(2), 37. [doi:10.5751/es-01861-110237]
LALLY, P., Jaarsveld, C. H. van, Potts, H. W., & Wardle, J. (2010). How are habits formed: Modelling habit formation in the real world. European Journal of Social Psychology, 40(6), 998–1009. [doi:10.1002/ejsp.674]
LALLY, P., Wardle, J., & Gardner, B. (2011). Experiences of habit formation: A qualitative study. Psychology, Health & Medicine, 16(4), 484–489. [doi:10.1080/13548506.2011.555774]
LI, Y., Zhang, D., Thapa, J. R., Madondo, K., Yi, S., Fisher, E., Griffin, K., Liu, B., Wang, Y., & Pagán, J. A. (2018). Assessing the role of access and price on the consumption of fruits and vegetables across New York City using agent-based modeling. Preventive Medicine, 106, 73–78. [doi:10.1016/j.ypmed.2017.10.014]
LINDENBERG, S., & Steg, L. (2011). Normative, gain and hedonic goal frames guiding environmental behavior. Journal of Social Issues, 63(1), 117–137. [doi:10.1111/j.1540-4560.2007.00499.x]
MANSON, S. M. (2007). Challenges in evaluating models of geographic complexity. Environment and Planning B: Planning and Design, 34(2), 245–260. [doi:10.1068/b31179]
MOSS, S. (2008). Alternative approaches to the empirical validation of agent-based models. Journal of Artificial Societies and Social Simulation, 11(1), 5.
MUELDER, H., & Filatova, T. (2018). One theory-many formalizations: Testing different code implementations of the theory of planned behaviour in energy agent-based models. Journal of Artificial Societies and Social Simulation, 21(4), 5. [doi:10.18564/jasss.3855]
NIAMIR, L., Kiesewetter, G., Wagner, F., Schöpp, W., Filatova, T., Voinov, A., & Bressers, H. (2020). Assessing the macroeconomic impacts of individual behavioral changes on carbon emissions. Climatic Change, 158(2), 141–160. [doi:10.1007/s10584-019-02566-8]
OGBEIDE, O. A., Stringer, A., & Ford, C. (2015). Consumer willingness to pay a premium for the health benefits of organic wine. Mayfair Journal of Agribusiness Management, 1(1), 1–23.
O’SULLIVAN, D., Evans, T., Manson, S., Metcalf, S., Ligmann-Zielinska, A., & Bone, C. (2016). Strategic directions for agent-based modeling: Avoiding the YAAWN syndrome. Journal of Land Use Science, 11(2), 177–187. [doi:10.1080/1747423x.2015.1030463]
POMARICI, E., & Vecchio, R. (2014). Millennial generation attitudes to sustainable wine: An exploratory study on Italian consumers. Journal of Cleaner Production, 66, 537–545. [doi:10.1016/j.jclepro.2013.10.058]
ROBINSON, D. T., Brown, D. G., Parker, D. C., Schreinemachers, P., Janssen, M. A., Huigen, M., Wittmer, H., Gotts, N., Promburom, P., Berger, T., Gatzweiler, F., Barnaud, C., & Irwin, E. (2007). Comparison of empirical methods for building agent-based models in land use science. Journal of Land Use Science, 2(1), 31–55. [doi:10.1080/17474230701201349]
SAMPSON, R. J. (1993). The community context of violent crime. In W. J. Wilson (Ed.), Sociology and the public agenda (pp. 259–286). SAGE Publications. [doi:10.4135/9781483325484.n13]
SCALCO, A. (2017). Organic food purchase behavior: The complex relationship between consumer’s attitude and social norms.
SCALCO, A., Macdiarmid, J. I., Craig, T., Whybrow, S., & Horgan, G. (2019). An agent-Based model to simulate meat consumption behaviour of consumers in Britain. Journal of Artificial Societies and Social Simulation, 22(4), 8. [doi:10.18564/jasss.4134]
SCHLÜTER, M., Baeza, A., Dressler, G., Frank, K., Groeneveld, J., Jager, W., Janssen, M., McAllister, R. R. J., Müller, B., Schwarz, N., Orach, K., & Wijermans, N. (2017). A framework for mapping and comparing behavioural theories in models of social-ecological systems. Ecological Economics, 131, 21–35.
SCHWARZ, N., Dressler, G., Frank, K., Jager, W., Janssen, M., Müller, B., Schlüter, M., Wijermans, N. & Groeneveld, J. (2020). Formalising theories of human decision-making for agent-based modelling of social-ecological systems: Practical lessons learned and ways forward. Socio-Environmental Systems Modelling, 2, 16340. [doi:10.18174/sesmo.2020a16340]
SHIH, R. A., Parast, L., Pedersen, E. R., Troxel, W. M., Tucker, J. S., Miles, J. N., Kraus, L., & D’Amico, E. J. (2017). Individual, peer, and family factor modification of neighborhood-level effects on adolescent alcohol, cigarette, e-cigarette, and marijuana use. Drug and Alcohol Dependence, 180, 76–85. [doi:10.1016/j.drugalcdep.2017.07.014]
SMAJGL, A., & Barreteau, O. (2014). Empirical Agent-Based modelling -Challenges and solutions. Springer.
SMAJGL, A., Brown, D. G., Valbuena, D., & Huigen, M. G. (2011). Empirical characterisation of agent behaviours in socio-ecological systems. Environmental Modelling & Software, 26(7), 837–844. [doi:10.1016/j.envsoft.2011.02.011]
SMALDINO, P. E., Calanchini, J., & Pickett, C. L. (2015). Theory development with agent-based models. Organizational Psychology Review, 5(4), 300–317. [doi:10.1177/2041386614546944]
SULEIMENOVA, D., & Groen, D. (2020). How policy decisions affect refugee journeys in South Sudan: A study using automated ensemble simulations. Journal of Artificial Societies and Social Simulation, 23(1), 2. [doi:10.18564/jasss.4193]
SUN, Z., Lorscheid, I., Millington, J. D., Lauf, S., Magliocca, N. R., Groeneveld, J., Balbi, S., Nolzen, H., Müller, B., Schulze, J., & Buchman, C. M. (2016). Simple or complicated agent-based models? A complicated issue. Environmental Modelling & Software, 86, 56–67. [doi:10.1016/j.envsoft.2016.09.006]
TAGHIKHAH, F., Voinov, A., & Shukla, N. (2019). Extending the supply chain to address sustainability. Journal of Cleaner Production, 229, 652–666. [doi:10.1016/j.jclepro.2019.05.051]
TAGHIKHAH, F., Voinov, A., Shukla, N., & Filatova, T. (2020). Exploring consumer behavior and policy options in organic food adoption: Insights from the Australian wine sector. Environmental Science and Policy, 109, 116–124. [doi:10.1016/j.envsci.2020.04.001]
TAGHIKHAH, F., Voinov, A., Shukla, N., & Filatova, T. (2021). Shifts in consumer behavior towards organic products: Theory-driven data analytics. Journal of Retailing and Consumer Services, 61, 102516. [doi:10.1016/j.jretconser.2021.102516]
TAGHIKHAH, F., Voinov, A., Shukla, N., Filatova, T., & Anufriev, M. (2020). Integrated modeling of extended agro-food supply chains: A systems approach. European Journal of Operation Research, 288(3), 852–868. [doi:10.1016/j.ejor.2020.06.036]
VECCHIO, R. (2013). Determinants of willingness-to-pay for sustainable wine: Evidence from experimental auctions. Wine Economics and Policy, 2(2), 85–92. [doi:10.1016/j.wep.2013.11.002]
WINDRUM, P., Fagiolo, G., & Moneta, A. (2007). Empirical validation of agent-based models: Alternatives and prospects. Journal of Artificial Societies and Social Simulation, 10(2), 8.
ZEPEDA, L., & Deal, D. (2009). Organic and local food consumer behaviour: Alphabet theory. International Journal of Consumer Studies, 33(6), 697–705. [doi:10.1111/j.1470-6431.2009.00814.x]
ZEPPINI, P., & Frenken, K. (2018). Networks, percolation, and consumer demand. Journal of Artificial Societies and Social Simulation, 21(3), 1. [doi:10.18564/jasss.3658]