
Introduction
Social networks evolve. Their structure is reconfigured each time someone forms a new tie or some old tie is dissolved. But, where does this motion lead? And what are its consequences, both for the individual and the society? To address these questions, we pursue a theoretical investigation of the mechanisms linking dynamically evolving social networks to several important outcome variables such as generalized trust, willingness to cooperate, social utility (utility drawn from social contacts with family, friends and acquaintances) and economic performance. We propose a novel computational agent-based model with a realistic demographic and social network structure, where the network evolves endogenously as individuals build new ties and some old ties are dissolved. The model elucidates how social networks give rise to the accumulation of social capital – defined as the aggregate of resources accessible to individuals through their social networks – and how in turn individuals’ social capital, through its four dimensions: degree, centrality, heterophilous interactions (social ties with dissimilar others) and homophilous interactions (social ties with similar others, especially kin), enables the creation of trust and cooperation, and eventually social utility and economic performance. We close the model by a circular assumption that prospects for increasing social utility and economic performance are the key variables that govern how agents modify their social networks by creating and dissolving social ties.
In particular, we are interested in addressing the following research questions:
- Does the endogenous social network structure converge to a stationary state, and if so, what are its key properties?
- Is there a connection between the structure of social networks with which individuals enter their adulthood and the network structure that arises in the stationary state? If so, how strong is the connection?
- How does frequency of social network reconfiguration – i.e., ease in creating new ties and durability of existing ones – affect generalized trust in a society, frequency of cooperation, average satisfaction from social contacts, and economic performance?
- How does the social norm on maintaining family ties – represented by the strength of link between social tie durability and the two agents' family closeness – affect generalized trust in a society, frequency of cooperation, average satisfaction from social contacts, and economic performance?
- Is there a trade-off between social utility and economic performance?
The structure of our theoretical model is motivated by the empirical literature documenting that characteristics of social networks can have a sizable impact on individuals' generalized trust and willingness to cooperate as well as – ultimately – social utility and economic performance.[1] Such effects have been observed both at the individual level (e.g., individuals with more heterophilous interactions tend to be more willing to cooperate and economically better off), and at the aggregate level (e.g., societies that either are better connected or exhibit a lower frequency of local cliques, tend to record relatively better aggregate economic performance), see e.g. Coleman (1988), Dasgupta (1988), Putnam (2000), Inglehart & Baker (2000), Zak & Knack (2001), Burt (2005), Granovetter (2005), Growiec et al. (2018). More detailed features of the model setup draw from the patterns found in our detailed cross-sectional survey dataset (Growiec et al. 2017) offering a unique opportunity for precise quantification of links between individuals’ participation in social networks, various types of their social capital, trust and willingness to cooperate.
The key novelty of the current paper is that it is – at least to our knowledge – the very first study addressing the mechanism of creation of generalized trust, willingness to cooperate, social utility and economic performance in the context of an artificial society with dynamically evolving social network structure, driven by purposeful decisions of individual agents. Earlier studies, including (Growiec et al. 2018), have based their findings either on a snapshot of network structure at one point in time or static networks that are entirely fixed, or otherwise did not include some key elements of the considered mechanism (e.g. Melamed & Simpson 2016).
Our results are quite promising. We find that the evolving social network in the stationary state of the simulation exhibits small-world topology – a type of network that is observed in real life.[2] This emergent behavior of the system is unique among networks endogenously generated in multi-agent models with explicit economic and social motives guiding the creation and destruction of social ties.
Beyond that result, in an extensive comparative statics study we find that societies with a higher frequency of social tie creation and destruction, both per annum and within each individual's lifetime, are – ceteris paribus – more trustful and cooperative, and exhibit better economic performance. By contrast, they display lower intensity of homophilous interactions and lower average social utility. Opposite effects are observed for societies where the durability of social ties is relatively strongly linked to agents' family closeness: they are less trustful and their economic performance is worse, but they imply more homophilous interactions and greater social utility. We also find that societies where young individuals enter their adult life in relatively inclusive, non-clustered networks tend to be more trustful and exhibit better economic performance. Thus, we find that some of the basic properties of social networks formed in individuals’ youth tend to persist in adult life even though social networks are repeatedly reconfigured.
Finally, our results also imply that social network dynamics (taking place at the individual level) can be conducive to a trade-off between social utility and economic performance (measured both at the individual and the aggregate level). We demonstrate that the trade-off can arise endogenously, driven by a few key characteristics of social network dynamics, and therefore arises not only under static network structure (Growiec et al. 2018) but also in a model that accounts for finite lifespans of individuals in an overlapping generations setup with social tie decay.
The remainder of the paper is structured as follows. In Sections "Conceptual framework of the model" and "Specification of the model" we motivate and lay out the model. Next, in Section "Simulation experiment design and results" we present the results and discuss them against the relevant literature.
Conceptual Framework of the Model
Defining social capital
In this text we follow network-based approach to social capital (Bourdieu 1986; Coleman 1988; Flap 1991; Lin et al. 2001; Li et al. 2005; Burt 1992; Burt 2005; Putnam et al. 1993; Putnam 2000; Field 2010). We define social capital as “resources embedded in one’s social networks that can be accessed or mobilized through ties in the networks” (Lin 2001). This definition is widely shared in sociology (Kadushin 2002; Li et al. 2005; Burt 2005) and naturally allows to separate people's observable behavior (related to maintaining social contacts) from latent traits such as trust or willingness to cooperate, that are considered as social capital correlates or outcomes. Moreover, under this definition we are able to link individuals' economic performance and social utility to the structure of their social network by the fact that they can access resources via their social contacts (Bourdieu 1986; Lin 2001).
Lin’s (2001) theory underscores that social capital is a relational asset, not a common good or a collective asset. Access to network resources requires both action and structure: social capital provides benefits only to individuals who reach out for the resources embedded in their social network, and for whom the relevant “structural opportunities” are available. In this paper, we operationalize Lin's (2001) theory by considering four key dimensions of individuals' social capital: (i) degree (number of social ties), (ii) centrality, (iii) heterophilous and (iv) homophilous interactions. To capture all four network characteristics independently, a minimal model has to explicitly acknowledge individuals' heterogeneity not only in terms of their position in the social network, but also in terms of additional individual traits. [3] In order to do so we consider the following traits:
- family location fi, with the presumption that social ties between individuals who are close to each other in terms of fi represent (relatively strong and exclusive but economically less valuable) kinship ties whose aggregation represents the individual's stock of homophilous interactions;
- agent type vi, with the presumption that social ties between individuals who are distant in terms of vi represent (relatively weak but economically profitable) heterophilous, bridging ties whose aggregation represents the individual's stock of heterophilous interactions. In Section "Specification of the model" we discuss in detail the background literature motivating the assumption that contacts between dissimilar agents have higher economic potential;
- agent age ai, because empirical data suggests that individuals activity in creating and dissolving social ties varies during their life span.
We motivate our choice of the four social capital dimensions (degree, centrality, heterophilous and homophilous interactions) as follows.
Inclusion of degree (the number of social ties of an individual) as a dimension of social capital is natural: ceteris paribus more network resources should be available to individuals who maintain more social ties.
Considering centrality as our second social capital dimension follows Burt's (1992) argument that, ceteris paribus, more resources tend to be available to the individuals who are bridges between otherwise disconnected sub-networks because they are part of a chain enabling the flow of resources in the network. Their central position makes them influential which – as connections to the influential agents become more valuable than connections with less influence (Newman 2008) – allows them to exploit this position to gain extraordinary benefits.
Finally, not all network connections are equally valuable. Access to network resources depends on the personal characteristics of individuals to whom a person is connected. In Lin’s theory, this is captured by the distinction between heterophilous and homophilous interactions (Lin 2001). Heterophilous interactions are the relations between actors with dissimilar resources such as wealth, reputation, power, lifestyle, education, interests or expertise, whereas homophilous interactions take place when the actors’ resources are similar. Maintaining heterophilous interactions demands relatively more effort as the interacting partners, aware of the inequality of their resources, need to assess each other’s willingness to engage in exchange and perform subjective valuation of their resources. Maintaining homophilous interactions is much easier because “the homophily principle links sentiment, interaction, and similarity of resources in actors’ reciprocal relationships” (Lin 2001, p. 47). Therefore, according to Lin (2001), homophilous interaction is the normative and ordinary one, while heterophilous interaction is non-normative and extraordinary.
Lin further juxtaposes the types of interactions (heterophilous vs. homophilous) with motives for action (instrumental, focused on gaining resources vs. expressive, focused on maintaining resources). He states that by heterophilous interactions actors gain resources, while by homophilous interaction they maintain them.
“Expressive action is likely to result in ego’s seeking out other actors who have similar resources and a similar interest in maintaining and defending them. The more similar the partners’ resources, the more likely they will share an understanding and concern for maintaining or defending such resources. (…) Gaining resources, on the other hand, implies a different type of interaction. (…) [T]he action to gain resources is better served, in terms of return, if the actor engages in heterophilous interactions – finding actors with dissimilar resources. (...) Obtaining additional or better resources requires (…) seeking out actors in different social positions than ego’s” (Lin 2001, p. 49-50).
Lin’s distinction between heterophilous and homophilous interactions parallels the distinction between bridging social capital (social ties with dissimilar others) and bonding social capital (social ties with similar others), introduced by Gittell & Vidal (1998) and Putnam (2000). According to the psychodynamic approach, bonding social capital is formed to satisfy the safety drive[4] and support the status quo, whereas bridging social capital is formed to satisfy the efficacy drive[5] and enhance innovation (Bowlby 1969; Greenberg 1991; Kadushin 2002; Kadushin 2012).
The decision to include heterophilous and homophilous interactions in our model as two distinct dimensions of individuals’ social capital rather than a single one mirrors Lin’s (2001) assertion that they are not two ends of a continuum but genuinely distinct concepts, qualitatively separate phenomena.[6] Heterophilous interaction requires “greater effort to reach out beyond one’s own social circles, and is more costly in commitments to reciprocity and the offer of one’s resources for the initiating actors. (…) [It] requires a greater degree of agency” (Lin 2001, p. 51). It is also a well-documented fact that bridging ties weaken or disappear much faster than bonding ones due to lack of embeddedness in social structure (Burt 2000; Burt 2002).
Generalized trust and willingness to cooperate
Granovetter (2005) observes that social networks are an effective source of feedback on individual behavior via the flow of information. The levels of an individual's generalized trust and willingness to cooperate tend to depend on her position in the network because social network structure may influence who cooperates with whom (affecting the decisions on whether we want to engage in contact with a given stranger) and the individuals’ approach to economic exchanges (e.g. the level of willingness to exploit the other side of the contact), see e.g. Misztal (1996) and Field (2010). The causality runs typically from social network structure to trust and cooperation rather than the other way round: “trust and norms of reciprocity, fairness, and cooperation are ‘benefits’ that are nurtured in (…) social relationships; (…) they do not exist independently of social relationships” (Woolcock 1998, p. 185).
Trust and cooperation are then the natural channels through which social network structure translates to the outcomes of social interaction. For instance, as observed by Lazarsfeld & Merton (1954) and Lin (2001), dense sub-networks are typically formed by similar agents, leading to reputation formation and social control serving as substitutes of trust (Dasgupta 1988). Conversely, in sparse networks individuals need more generalized trust to behave cooperatively as such networks are less effective in transmitting reputation information. By contrast, in dense networks social ties are often more redundant than in sparse networks in terms of access to resources, giving rise to inefficiency (Granovetter 2005). Similar considerations, via the transaction cost argument, translate to individual's cooperativeness and thrift (Inglehart & Baker 2000; Florida 2004; Klapwijk & van Lange 2009). Sparse social networks are more efficient in transmitting business information – and thus on average incur lower transaction costs – because are characterized by lower average distance between two random agents. In effect, at the margin people whose social networks are sparser should be relatively more willing to engage in private enterprise.
We consider individuals’ willingness to cooperate as a separate concept from generalized trust because cooperation can be secured also through other mechanisms than trust, e.g., reputation, legal enforcement, monitoring, or self-regulation of professional societies (Cook et al. 2005), whereas the notion of generalized trust may stretch beyond the realm of business interactions and pertain also, e.g., to building and maintaining casual social connections and sharing personal secrets.
Following these observations, in our computational multi-agent model generalized trust (itself related to individuals’ social networks, particularly the extent of trust-reducing homophilous interactions) determines the probability that two individuals engage in economic interaction with one another. Then the outcome of the contact is determined by their willingness to cooperate (which is also related to social networks, but through the network distance between both agents and their heterophilous interactions).[7]
Influence of social capital on economic performance and social utility
We model the economic interaction between any two agents using a “prisoner's dilemma” game: both agents are better off when both cooperate than when both defect, but each of them is also individually tempted to defect. The model is calibrated so that an interaction where both agents defect is better than no interaction at all, but it is better not to interact at all than to interact, cooperate, and be cheated (Growiec et al. 2018).
The above assumptions are justified by theory and empirical evidence regarding the existence of causal links between generalized trust, cooperation and economic performance (see e.g. Fukuyama 1995; Knack & Keefer 1997; Zak & Knack 2001; Algan & Cahuc 2010). In particular, Fukuyama (1995) argues that business success requires “spontaneous sociability” – a result of trust and shared values. Prevalence of family-based business models correlates with high transaction costs and limited aggregate economic performance, whereas high-trust societies tend to feature more social ties with non-kin and higher economic performance.
More broadly, the relation between social capital, and social utility and economic performance – the outcome variables of our model – has received a lot of attention from empirical studies. Their results depend on the operationalization of the social capital concept but are typically positive: social capital tends to go together with greater social utility and better economic performance; see e.g. Aghion & Durlauf (2005) for an overview of many among these results. More specifically, Beugelsdijk & Smulders (2003) find that bridging social capital, as opposed to the bonding one, positively relates to regional economic growth in Europe. Norbutas & Corten (2018), in turn, find that bridging social capital is associated with better, and bonding with worse economic performance of Dutch municipalities. There is also ample evidence on positive influence of heterophilous interactions on individual economic success, e.g. finding a job, getting a raise, etc. (Granovetter 1973; Podolny & Baron 1997; Mouw 2003; Slomczynski et al. 2005; Franzen & Hangartner 2006; Growiec & Growiec 2010; Zhang et al. 2011) while dominance of bonding contacts may have an opposite effect (Franzen & Hangartner 2006; Sabatini 2009; Kim 2009).[8]
As regards social utility – non-economic benefits from maintaining social ties – the literature stresses that it is positively correlated to frequent social interactions in general and centrality in the network (see e.g. Winkelmann 2009; Alesina & Giuliano 2010; Kroll 2011; Leung et al. 2011; Growiec & Growiec 2014; Christakis & Fowler 2009). Social utility may come in various non-pecuniary forms, such as social support, improved emotional and physical health, increased value of leisure, and better access to potentially valuable information. For example, contacts with kin are an especially important source of support in case of natural disasters and war (Shavit et al. 1994), whereas diversified social networks are particularly helpful in reducing depression syndromes and forwarding information on health prophylaxis (Erickson 1996; Erickson 2003). Furthermore, social capital also has both a direct and a buffering effect on people’s health. Individuals with bigger social capital resources are less often ill and when they do fall ill, they cope with the illness better (Hammer 1983).
Motives for reconfiguring social networks
An important novelty of our modelling approach is that agents are allowed to endogenously reconfigure their social networks. In this regard, we again follow Lin’s (2001) theory and consider two motives for maintaining existing social ties and creating new ones: to protect existing valued resources and to gain additional ones. The former motive promotes expressive action (“Maintaining one’s [network] resources requires recognition by others of one’s legitimacy in claiming property rights to these resources”, Lin 2001, p. 45), whereas the latter promotes instrumental action (“which hopes to trigger actions and reactions from others leading to more allocation of resources to ego”, Lin 2001, p. 46). We assume that agents in our model value two types of resources – the ones which provide social utility, and the ones which augment economic performance. Thus, when considering setting up a new social tie, individuals will reach out primarily to those others who hold a promise of increasing access to either of the two types of resources.
Empirical evidence from a survey on social capital dimensions
Growiec et al. (2017) present results of a survey of a representative sample of the Polish population, providing direct empirical evidence on the correlations represented by our model. Namely, they quantify the relationships between:
- degree, centrality, heterophilous and homophilous interactions,
- generalized and particularized trust and willingness to cooperate,
- social utility and economic performance,
As regards the relationships between the four dimensions of social capital, the empirical findings of Growiec et al. (2017) are the following:
- individual's degree positively correlates with centrality and heterophilous interactions, and negatively with homophilous interactions,
- centrality correlates positively with heterophilous and negatively with homophilous interactions,
- heterophilous and homophilous interactions are essentially uncorrelated (which corroborates our earlier discussion justifying treatment of these variables as independent dimensions).[9]
Although we do not directly calibrate our computational multi-agent model against these correlations, it turns out (see the section "Simulation experiment design and results") that, in an emergent manner, all of them are reasonably well approximated by our model.
Additionally Growiec et al. (2017) study, in line with the earlier literature, confirms existence of the following correlations – which we, in contrast to correlations (1)-(3) – do incorporate in the assumptions of our model:
- positive link between heterophilous interactions and willingness to cooperate,
- positive link between generalized trust and willingness to cooperate,
- negative link between homophilous interactions and generalized trust.
Specification of the Model
The laboratory for our experiments is a computational multi-agent model with a realistic demographic and social network structure and dynamics. The setup of this model has been motivated by background literature and individual-level empirical evidence for the Polish population, presented in Growiec et al. (2017). It extends a related model with a static network structure, developed in Growiec et al. (2018).
Although in principle our model is theoretical, we use empirical data to guide the values of its parameters. In this way in Section “Simulation experiment design and results” we can concentrate the experiments on the areas of model parameter space which are plausible empirically.
We assume that we have \(N\) agents in the model. The model is dynamic with discrete time indexed by natural numbers. The connections between agents \(i,j\in \{1,2,\dots,N\}\) are interpreted as social ties and represented by \(x_{i,j}\) (\(x_{i,j} = 1\) if there is a tie and \(x_{i,j} = 0\) otherwise). We assume that social ties are symmetric, \(x_{i,j} = x_{j,i}\), and posit \(x_{i,i} = 0\). We define agent degree as the number of social ties the agent has:
| $$D_i = \sum_{j=1,\dots,N} x_{i,j}\text{,}$$ |
Attributes of agents
Each agent has three attributes: \(f_i\) (family location), \(v_i\) (agent type) and \(a_i\) (age).
Family location
Family location of agent \(i\) is denoted as \(f_i\in [0,1]\). For two agents \(i\) and \(j\) the smaller the difference between \(f_i\) and \(f_j\) is, the closer are the family ties between them. We want to treat every value of \(f_i\) in the same way (the value itself should not carry any information, only the difference between two values should be important) therefore we assume that values 0 and 1 are considered identical, i.e. we assume that agents are located on a circle. Following this, we define family similarity \(s_f\) between agents \(i\) and \(j\) as:
| $$ s_f(i,j)=1-2\min \{ |f_i-f_j|,1-|f_i-f_j|\}\text{.}$$ |
To calculate \(f_i\) we draw it from a uniform distribution over the interval \([0,1]\), and thus agents are also uniformly distributed on a circle.
Agent type
Type of agent \(i\) is denoted as \(v_i\in \mathbf{R}\) and represents in a reduced form the type of information that the agent has access to (not to be confused with individual characteristics that can be placed on an ordinal scale, such as years of education, wealth, etc.). For two agents \(i\) and \(j\), the smaller the difference between \(v_i\) and \(v_j\) is, the more similar are their types and the less valuable information can be transferred between them. We assume that values of \(v_i\) are normally distributed and agents can be more or less typical: values close to 0 are considered typical, whereas values that are very positive or very negative are non-standard. We do not impose any single interpretation of types and simply restrict ourselves to considering if some agent has typical information for the population or not. However, we assume that less typical agents (far from 0) offer potentially more unique informational resources to their connections so they would tend to be more central in the network.[10], [11] Therefore, we define type distance \(d_v\) between agents \(i\) and \(j\) as:
| $$ d_v(i,j)=1-\exp(-|v_i-v_j|)\text{.}$$ |
This specification allows us to capture the situation that if two agents possess very non-standard information then this information might significantly overlap (when \(v_i\) and \(v_j\) have the same sign) or the opposite – the information might be qualitatively different (when they have opposite signs).
For each agent we randomly simulate \(v_i\) from a standard normal distribution, as this is a natural distribution to assume for a trait in the population.
Agent age
The model has an overlapping-generations structure. Each agent has age \(a_i > 0\) measured in years, where \(a_i = 0\) is the moment of birth of a person.
There is a probability \(z(a_i)\) that agent of age \(a_i\) dies in the given period, where the simulation tick size (i.e. going from time \(t\) to \(t+1\)) is one year. Following Boucekkine et al. (2002) and Azomahou et al. (2009) we posit that the unconditional probability of survival until age \(a_i\) is equal to:
| $$m(a_i)=\frac{e^{-\kappa a_i}-\eta}{1-\eta}\text{,}\quad \eta>1\text{,}\quad \kappa<0\text{.}$$ |
The maximum lifetime of an individual is given under this survival law by
| $$ T^{\ast}=-\frac{\ln \eta}{\kappa}\text{,}$$ |
| $$ E=\frac{1}{\kappa}+\frac{\eta\ln\eta}{(1-\eta)\kappa}\text{.}$$ |
For example, when \(\eta =\) 5.44 and \(\kappa =\) –0.014729 as in Boucekkine et al. (2002) then the life expectancy is \(E =\) 73 years and the maximum lifespan is \(T^{\ast} =\) 115 years.
We assume that there is a constant birth rate in the social system, equal to the reciprocal of the life expectancy, \(b = 1 / E\). This guarantees that the overall population size is fixed in expectation.
The initial ages \(a_i\) for the simulation are drawn from the ergodic agent age distribution implied by the function \(z\). Coupled with the assumption of a fixed overall population size, this implies that in the ergodic agent age distribution, the number of individuals aged \(a_i\) is proportional to \(z(a_i)\).
An important model design decision was that we assume that social utility \(SU_i\) and economic performance \(EU_i\) (to be defined later) do not depend directly on agent's age. This assumption is clearly not valid in real life: for example, people accumulate wealth and work experience in the course of their lives; earnings typically exhibit a hump-shaped profile over individuals' life cycle; happiness is U-shaped. However, our objective was to focus on network-induced effects and do not mix them with age effects working through other (non-network related) channels. In our model agents' age affects directly only the process of network reconfiguration (discussed below), but not agents' outcomes
Initial graph of connections
We consider a dynamic population and an evolving graph of connections. Therefore, we need to specify the initial structure of the network at the start of the simulation (the population will evolve away from it in the long term but we have to specify a starting point).
Agents at age \(a_i < T_{\min}\) do not have connections in the model as they are assumed to be in their school period and to be economically inactive (they get their initial connections when they reach \(a_i = T_{\min}\)). We assume that agents enter the market at age \(T_{\min} =\) 15. To initiate the model at time zero we generate the network of connections using the Watts & Strogatz (1998) model over agents that initially have \(a_i\) greater or equal than \(T_{\min}\). This model has three parameters\(:\) N denoting the number of agents in the model, \(r\) denoting the graph radius (\(2r\) is the average degree of node in the social graph) and p denoting the edge rewiring probability (inverse probability of occurrence of local cliques). In this text we adapt the standard Watts-Strogatz algorithm by assuming that initially agent \(i\) is connected to \(2r\) agents who have the smallest distance \(s_f\) to her (in the standard Watts-Strogatz model agents are placed uniformly on a ring lattice, here the distribution of \(s_f\) does not have to be uniform). Next with probability \(p\) each existing link is replaced by a random link. Hence, the resulting initial graph is always between a lattice (\(p =\) 0) and a random network (\(p =\) 1).
It should be stressed that the Watts-Strogatz algorithm does not ensure right skewness of the degree distribution of the graph (a phenomenon observed empirically). However, as it will be discussed later, in the long run our simulation exhibits this desirable property, i.e. a long right tail of the vertex degree distribution in the social ties graph is an emergent property of our model. The Watts-Strogatz model is used here only to initiate the simulation. The stationary-state network of connections between agents, formed after social ties have been repeatedly reconfigured over many steps of the simulation, is different (and better fitting empirical evidence). Actually, we believe that this is one of the crucial emergent features of our model.
Homophilous and heterophilous interactions
We define homophilous interactions of agent \(i\) as the average level of family similarity across all agent \(i\)'s social ties,
| $$Ho_i= \begin{cases} \sum_{j:x_{i,j}=1} s_f(i,j)/D_i\quad\text{if}\quad D_i>0\\ 0\quad\text{if}\quad D_i=0\text{,} \end{cases}$$ |
Heterophilous interactions of agent \(i\) are, in turn, defined as the average level of type distance (trait heterogeneity) across all agent \(i\)'s social ties,,
| $$ He_i= \begin{cases} \sum_{j:x_{i,j}=1 } d_v(i,j)/D_i \quad\text{if}\quad D_i>0\\ 0\quad\text{if}\quad D_i=0\text{,} \end{cases}$$ |
Social utility
We assume that the overall well-being of the agents has two components: social utility and economic performance. Social utility \(SU_i\) of an agent is interpreted as all non-economic resources drawn from her social contacts. We assume that social utility from a given social tie is increasing with family similarity of the two agents, \(s_f(i, j)\), and centrality of the contacted agent, \(C_j\). This reflects the two diverse purposes social ties may serve (Kadushin 2002): the need for affiliation and emotional closeness (addressed by strong kinship ties) and the need for personal development and success (addressed by the informational advantages of social ties with agents who are central to the network), as in
| $$ SU_i= \begin{cases} \sum_{j:x_{i,j}=1 } s_f (i,j)^{\rho} Q_j^{\rho} / D_i \quad\text{if}\quad D_i>0\\ 0\quad\text{if}\quad D_i=0\text{,} \end{cases}$$ |
| $$ Q_i=\frac{\Biggl(\lim_{x\rightarrow C_i^-} F_{\textit{emp}} (x) + \lim_{x\rightarrow C_i^+} F_{\textit{emp}}(x) \Biggr)}{2}\text{,}$$ |
Generalized trust, willingness to cooperate and economic performance
Economic performance \(EU_i\) of an agent is defined as total value generated by the agent thanks to her engagement in joint private enterprises with other agents. The success of these enterprises is assumed to depend on mutual trust and willingness to cooperate between the agents as well as on the volume of non-redundant information available to them. Specifically, we model the enterprises as interactions between two agents who play a stochastic "prisoner's dilemma" game in the social network, as in Growiec et al. (2018). Agents \(i\) and \(j\) are matched in pairs such that the probability of a match depends on the degree of mutual trust. We assume that the probability that agents i and j are randomly matched — i.e., the degree of their mutual trust — is equal to
| $$ P_{i,j}=\frac{\sqrt{(1-Ho_i)(1-Ho_j)}}{L_{i,j}}\text{.}$$ |
Generalized trust of agent \(i\) is calculated by aggregating \(P_{i,j}\) over all individuals in the society:
| $$Tr_i=\sum_{j\neq i} \frac{P_{i,j}}{N-1}\text{.}$$ |
Once agents \(i\) and \(j\) are matched they act in two steps: first they announce if they want to cooperate or defect and next they actually play the game, which allows them to randomly deviate from their original declaration. In line with the "prisoner's dilemma" game structure, we assume that if \(i\) and \(j\) cooperate then they both get a high positive outcome ("reward", normalized to unity), if they both defect then they get a low positive outcome ("punishment" \(g_{nn}\in (0,1)\)), and if agent \(i\) cooperates while agent \(j\) defects, then agent \(i\) gets a negative outcome \(g_{cn}\) whereas agent \(j\) gets a very high "temptation" outcome \(g_{nc} > 1\). We assume that this game is symmetric for both agents.[12] Furthermore, we also posit that the outcome of economic interaction increases with the type difference between the agents, \(d_v(i, j)\) representing the volume of non-redundant information available to the pair of agents.
We assume that agent \(i\)′s willingness to cooperate (probability of cooperation) with agent \(j\) is proportional to \(W_{i,j}(i, j) = He_i / L_{i,j}(i, j)\), where \(L_{i,j}\) is the length of the shortest path linking agents \(i\) and \(j\) in the network (their distance; we assume that it is \(N\) if there is no path between them), and that her overall willingness to cooperate is
| $$ Co_i=\sum_{j\neq i}\frac{W_{i,j}}{N-1}=\frac{He_i}{N-1}\sum_{j\neq i}\frac{1}{L_{i,j}}\text{.}$$ |
Observe that in contrast to social trust, willingness to cooperate is generally not symmetric:
| $$ P_{i,j}=P_{j,i}\wedge W_{i,j}\neq W_{j,i}\text{.}$$ |
Following the derivation in Growiec et al. (2018), economic performance of agent \(i\), being the sum of economic outcomes obtained across all economic interactions of agent \(i\) with others, is calculated as:
| $$ EU_i=\sum_{j\neq i}P_{i,j}d_v(i,j)\Biggl( W_{i,j}W_{j,i}\Bigl(\epsilon^2+\epsilon(1-\epsilon)(g_{cn}+g_{nc})-\epsilon(2-\epsilon)g_{nn}\Bigr)+g_{nn}\Biggr)\text{,}$$ |
In summary, the economic value of a relationship between agent \(i\) and \(j\) is proportional to the probability that they get in contact \(P_{i,j}\) (which depends on their distance in the graph and extent of homophilous interactions - two variables that are identified as important determinants of generalized trust in the literature review) and to the potential value of this cooperation \(d_v(i, j)\) that is corrected by assuming that \(i\) and \(j\) play a stochastic "prisoner's dilemma" game (and so they can defect if their willingness to cooperate \(W_{i,j}\) is low; while individually beneficial, defection decreases the aggregate economic outcome of the cooperation). Willingness to cooperate \(W_{i,j}\), again following the literature, is related to agents' heterophilous interactions and the network distance between agents (Misztal 1996; Molm et al. 2000).
Model dynamics
As we have already mentioned, a single step of the simulation is interpreted as one year of real time. Connection dynamics are governed by the following steps in a single tick of the simulation:
- death process: we traverse agents in random order; with probability \(z(a_i)\) agent \(i\) dies (and her social ties are destroyed);
- birth process: we spawn new agents with age \(a_i = 0\) so that in the long run the community size stays unchanged (in expectation);
- aging: for each living agent age \(a_i\) is increased by 1.
- entry: for every agent who has \(a_i = T_{\min}\) (enters adult period of life) we first generate \(2r\) connections with closest family \(f_i\) and then rewire each connection with probability \(p\) (all actions are only performed against agents who have \(a_j\) greater or equal than \(T_{\min}\)); in general this step resembles the initial graph generation process described above but is applied only to a single new vertex in the graph;
- destruction of social ties: all edges are traversed in random order; with probability proportional to \(p_{\textit{cut}}\) edge from agent \(i\) to agent \(j\) is cut; \(p_{\textit{cut}}\) depends on the age of agents \(i\) and \(j\) (the lower the age the higher the probability) and on their family distance (it is harder to cut family ties); the exact formulas are given below;
- creation of new social ties: all agents are traversed in random order; with probability proportional to \(p_{\textit{add}}\) agent \(i\) creates a new connection; \(p_{\textit{add}}\) positively depends on agent's degree and negatively depends on her age; next the agent randomly chooses the new connection but the probability weight \(p_{\textit{con}}\) of connecting with agent \(j\) is negatively correlated with \(L_{i,j}\) (i.e. it is more probable to connect with a friend of a friend) and positively with the increase in social utility and economic performance generated by this new connection; below we present the formulas we use.
Social tie destruction process
In one year \(\alpha N^{\ast}/2\) ties are destroyed, where \(N^{\ast}\) is the number of agents in the social graph with age at least \(T_{\min}\) and \(\alpha\) is a model parameter. We select the set of dissolved ties as a weighted sample from the set of all edges in the graph without replacement. The weight formula for cutting the edge between agents \(i\) and \(j\) is:
| $$ p_{\textit{cut}}(i,j)=\exp \Biggl( -\frac{\min\{a_i,a_j\}-T_{\min}}{T^{\ast}}\Biggl)\Bigl(1-s_f(i,j)\Bigr)^{\beta}\text{,}\quad\beta>0\text{.}$$ |
The selection of age and family ties as parameters for social tie destruction follows Granovetter (2005), Roberts & Dunbar (2011), and Growiec et al. (2017), whose analyses of empirical data show that younger people have a higher tendency to sever relationships, that family ties are more durable, and that those are the two most important factors governing this process. The parameter \(\beta > 0\) governs the strength and functional form of the relationship between family similarity of two agents and the probability that their tie will be dissolved.
Social tie creation process
In one year \(\alpha N^{\ast}/2\) ties are created. To this end we first select a set of individuals as a weighted sample from the set of all agents in the graph with replacement. The weight formula for adding the edge for agent \(i\) is:
| $$ p_{\textit{add}}(i)=\exp\Biggl(1-\frac{a_i}{T_{\min}}\Biggr)(1+D_i)^{\gamma}\text{,}\quad\gamma>0\text{.} $$ |
The selection of age and degree as parameters for social tie creation follows Growiec et al. (2017), whose analyses of empirical data show that younger people have a higher tendency to create relationships and that people who already have many connections have a higher probability of creating new ones (preferential attachment). The parameter \(\gamma > 0\) governs the strength and functional form of the relationship between agent degree and the probability of forming a new tie. Second, we posit that when an agent decides to create a new social tie she wants to increase her social utility and economic performance. Specifically, for each connection that agent is about to create, she randomly selects agent \(j\neq i\) with probability proportional to a standard CES utility function (Arrow et al. 1961; Uzawa 1962):
| $$ p_{\textit{con}}(i,j)=\frac{\Biggl(\omega\Bigl(\frac{\Delta SU_i(j)}{\Delta SU_i}\Bigr)^{\phi}+(1-\omega)\Bigl(\frac{\Delta EU_i(j)}{\Delta EU_i}\Bigr)^{\phi}\Biggr)^{\frac{1}{\phi}}}{L_{i,j}^{\zeta}}\text{,}\quad\omega,\phi,\zeta\in (0,1)\text{,}$$ |
The network dynamics proposed here are similar to Stochastic Actor-Oriented Models (Snijders 2017) with several changes that were designed to reflect the nature of the proposed model and empirical data. First, to reflect the associated empirical data we guide social tie creation and destruction by different factors (however, similarly to SAOM approach, in our model a tie between two agents is created based on the goal to maximize social utility and economic performance after the change). Also note that in our model an implicit balancing mechanism is present: agents who have more connections are more likely to lose them. Next, our network is dynamic not only in terms of edges, but also vertices, as we assume an overlapping generations structure of the agent population. Finally, due to the fact that our model is developed in discrete time (one tick represents one year) we use an approximation of the continuous time Markov process by assuming a given number of changes happen in each period.
Simulation Experiment Design and Results
Baseline parameterization of the model
The proposed model is computing intensive as it requires simulation of the whole population with complex decision-making rules about social tie creation and destruction. Therefore, in order to attain high performance of the code for a reasonably large population, the simulation was developed in Julia language (Bezanson et al. 2017) using the LightGraphs.jl package. The source codes of the model are available at https://www.comses.net/codebases/d34b6370-490c-483c-bcf2-94cbeab904fc/releases/1.0.0/.
| Parameter | Baseline value | Comparative statics range | Interpretation |
| \(\kappa\) | -0.014729 | slope of demographic survival law | |
| \(\epsilon\) | 5.44 | scaling of demographic survival law | |
| \(N\) | 1024 | initial size of the community | |
| \(r\) | 7 | [3, 11] | \(2r\) is avg. # of social ties per agent created at birth |
| \(p\) | 0.05 | [0, 1] | (inverted) probability of occurrence of local cliques |
| \(\rho\) | 0.9 | [0.1, 0.95] | share of family ties in social utility |
| \(g_{nc}\) | 1.5 | payoff in no-cooperation/cooperation situation | |
| \(g_{cn}\) | -0.5 | payoff in cooperation/no-cooperation situation | |
| \(g_{nn}\) | 0.25 | payoff in no-cooperation/no-cooperation situation | |
| \(\epsilon\) | 0.95 | probability that agent keeps the promise to cooperate | |
| \(\alpha\) | 4 | [2, 6] | average number of actions of agent per year |
| \(\beta\) | 2 | [0.5, 2.5] | social tie destruction: family importance |
| \(\gamma\) | 1 | social tie creation: degree importance | |
| \(\omega\) | 0.5 | relative weight of social utility and economic perf. | |
| \(\phi\) | 0.5 | elasticity of subst. of social utility and economic perf. | |
| \(\zeta\) | 0.5 | decay rate of distance in network for economic utility |
Table 1 shows the baseline model parameters. They take into account empirical data and background literature in the following way. Parameters \(\kappa\) and \(\epsilon\) were specified following Boucekkine et al. (2002). Value of \(N\) was determined by technical reasons - so that the model would fit in computer memory and simulations would be finished in acceptable time. Parameter \(r\) was selected based on works of Dunbar & Spoor (1995) and Hill & Dunbar (2003). Parameter \(p\) should be small — we assume that when person becomes adult her ties are relatively clustered as they mostly originate from family and school friends. Parameter \(\rho\) should be large as confirmed by World Value Survey (http://www.worldvaluessurvey.org/wvs.jsp) data (globally about 90% respondents claim that family is “very important” in their life, and further 8.6% say it is “rather important”). Relation of parameters of the stochastic “prisoner’s dilemma” game should be \(g_{cn} < 0 < g_{nn} < 1 < g_{nc}\), as we take 1 as the normalized “reward” payoff where both agents cooperate and 0 means no contact at all. All the assumptions follow the discussion presented in Section "Conceptual framework of the model". Similarly, we conclude that the model parameter ε should be relatively high.
The value of parameter \(\alpha\) is based on data from Growiec et al. (2017): our respondents recall to have formed on average about 11.2 new social ties in the last three years.[13] Parameter \(\beta\) is selected to strongly favor cutting ties with people who rank very low in family kinship (Roberts & Dunbar 2011). Parameter \(\gamma\) is set to 1 so that the probability of new connections scales linearly with the number of existing ties (if person A has two times more ties than person B then in the past she approximately was twice as active; we assume that she will be also twice as active in the future). This is the standard treatment of preferential attachment in the literature (Simon 1955; Barabasi & Albert 1999). Parameter \(\omega\) implies that we assume that both economic performance and social utility are equally important for agents. As regards the substitutability parameter \(\phi\), we have tested the model for \(\phi < 0\) and the results of the simulation are not in line with empirical data. Therefore, we conclude that for creating new ties, additional social utility and economic performance are relatively substitutable, with an elasticity of substitution above one; we select \(\phi = 0.5\). Parameter \(\zeta\) is selected to strongly differentiate very short paths from longer ones (i.e. the change of value of \(L_{i,j}\) from 2 to 3 is more important than e.g. from 4 to 5, as those are distant ties anyway).
Individual-level correlations: model vs. data
Before we present our main findings, we need to check if our theoretical model is able to explain the main patterns present in Growiec et al. (2017) empirical data. We have assessed goodness of fit of the model to the data by the means of correlation analysis.
In order to verify that our computational model generates a reasonable structure of correlations of individual-level variables under the baseline parameterization, we simulated it 32 times, comparing the correlation structure of model variables at each run against the properties of empirical data on individuals’ age, degree, centrality, heterophilous and homophilous interactions (Growiec et al. 2017). We find that the model replicates the structure of the data reasonably well. In particular, signs of correlations between all considered variables agree between the model and empirical data in every case in every of 32 runs (see Table 2). We concentrate on signs of relationships as we do not fit the model to quantitatively replicate the empirical data for a single country (Poland) exactly, but we foremostly want to capture the right direction of the relationship.
The Appendix presents figures with detailed results. The number of simulation runs was selected to ensure that the uncertainty of the estimation does not influence the direction of the relationship (for all results given on plots in Appendix we provide mean effects and confidence intervals).
| Age | degree | centrality | heterophilous | homophilous | |
| age | - | - | - | + | |
| degree | - | + | + | - | |
| centrality | - | + | + | - | |
| heterophilous | - | + | + | -* | |
| homophilous | + | - | - | -* |
Our model does an equally good job in matching the signs of relationships between the dimensions of social capital and our key outcome variables: agents’ economic performance and social utility. These signs are presented in Table 3. If a sign of correlation is given, it was consistent for all 32 runs of the simulation; in two cells, we report 0, which means that the sign of the simulation result was changing and its deviations from 0 were small (we interpret it as no relationship between respective parameters). Both in the model and the data, we observe that higher degree, centrality and more heterophilous interactions uniformly improve both dimensions of individual performance, while homophilous interactions improve social utility while decreasing economic performance. People with unique qualities (high \(|v|\)) have higher economic performance, while social utility increases with age. The neutrality of age with respect to economic performance is to be expected as we do not model accumulation of capital in the model, as explained in Section "Specification of the model".
| |v| | age | degree | centrality | hetero- philous | homo- philous | |
| economic performance | + | 0 | + | + | + | - |
| social utility | 0 | + | + | + | + | + |
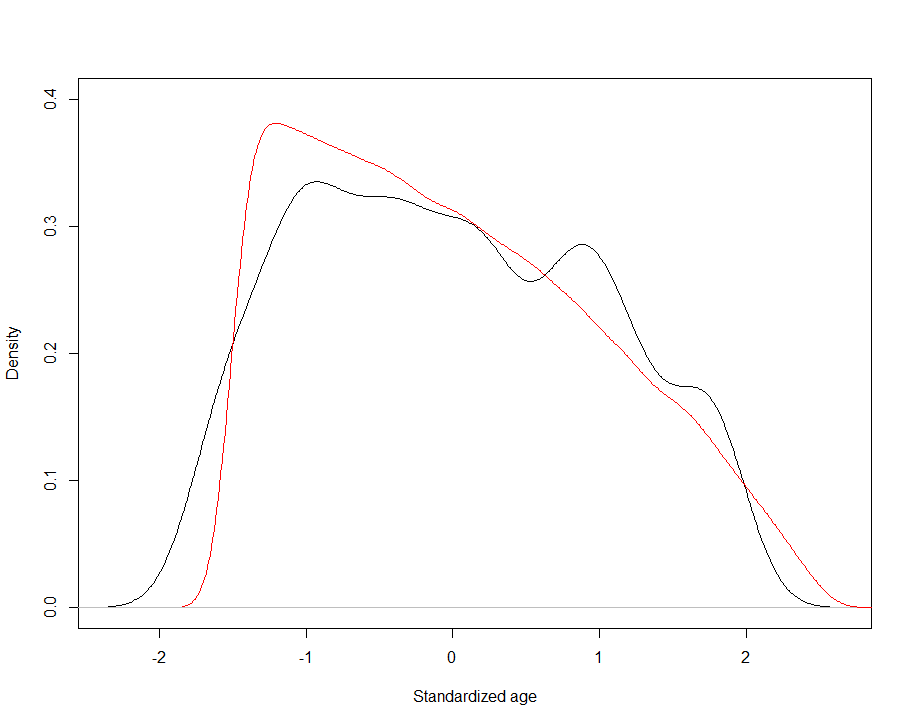
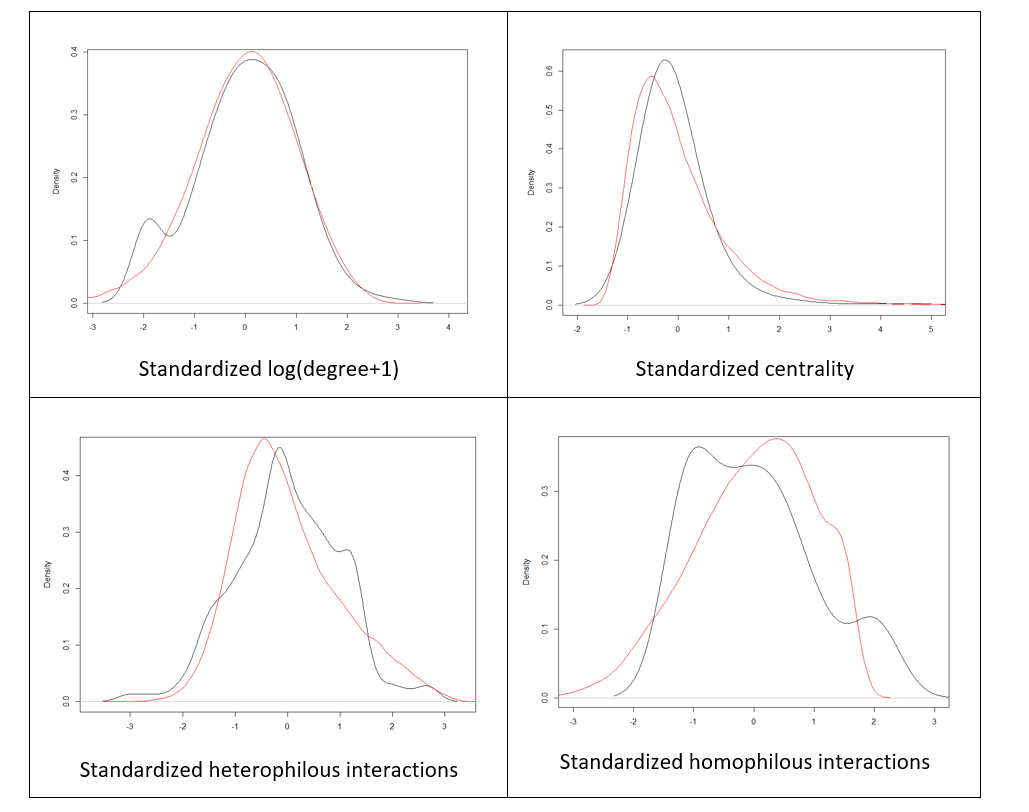
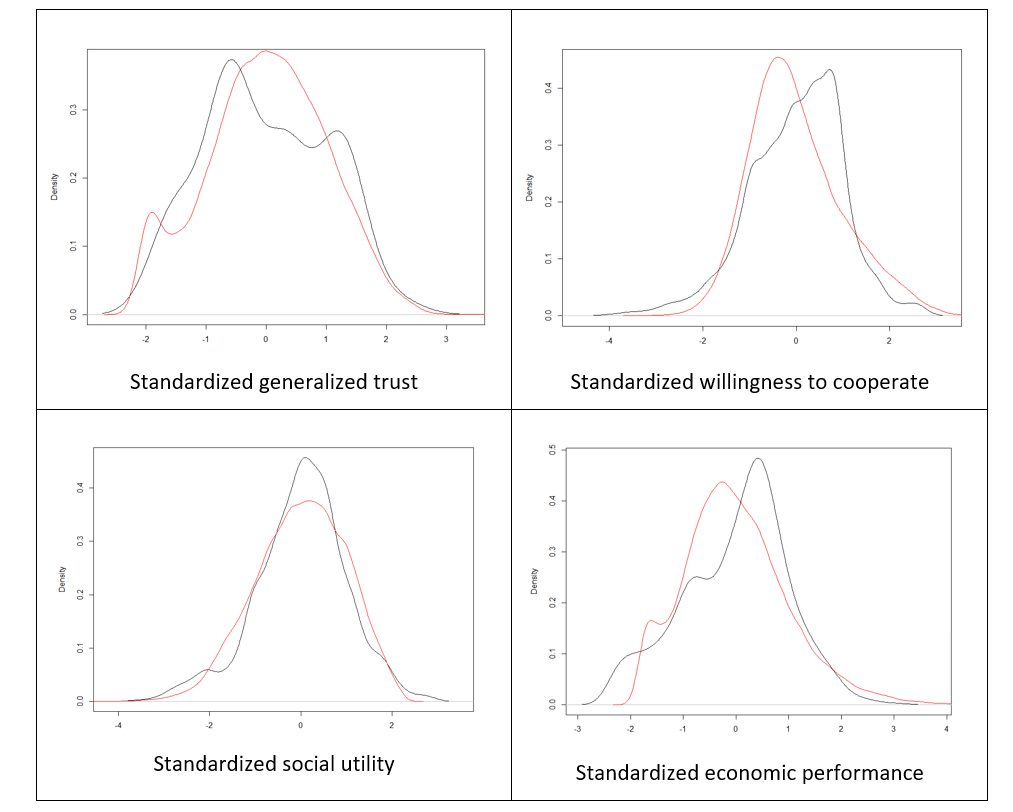
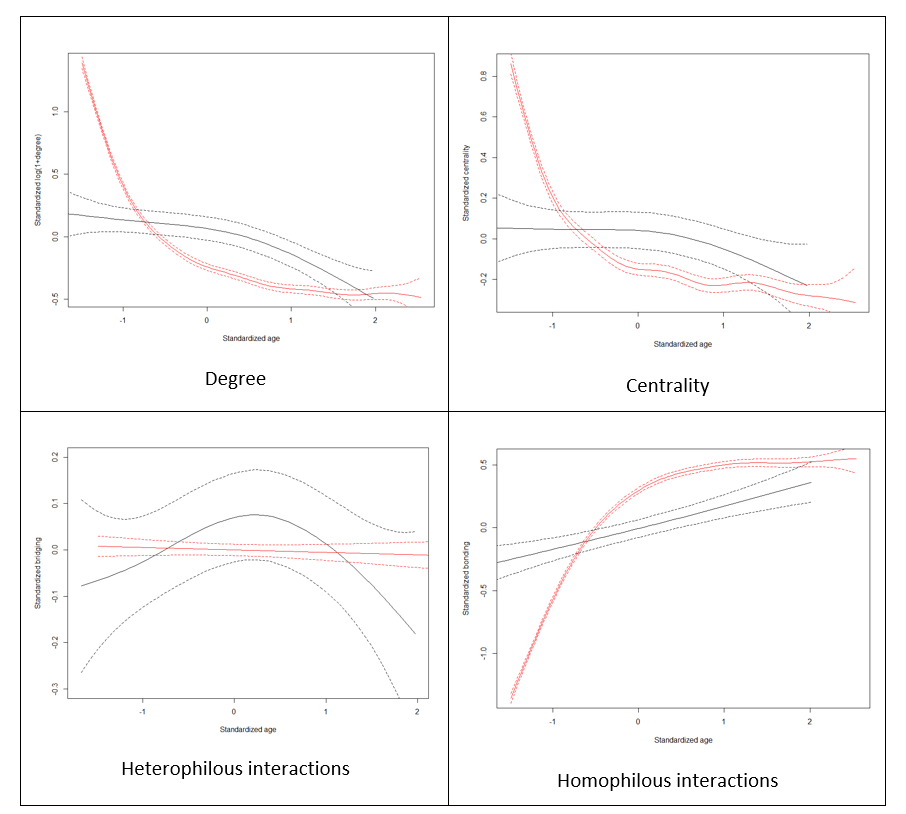
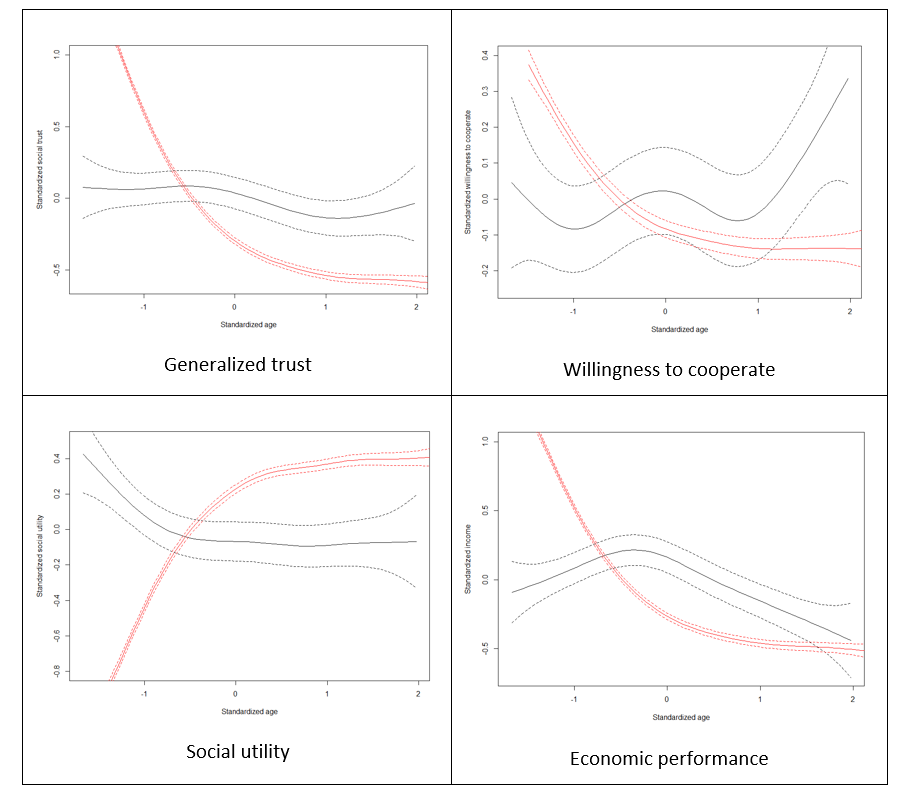
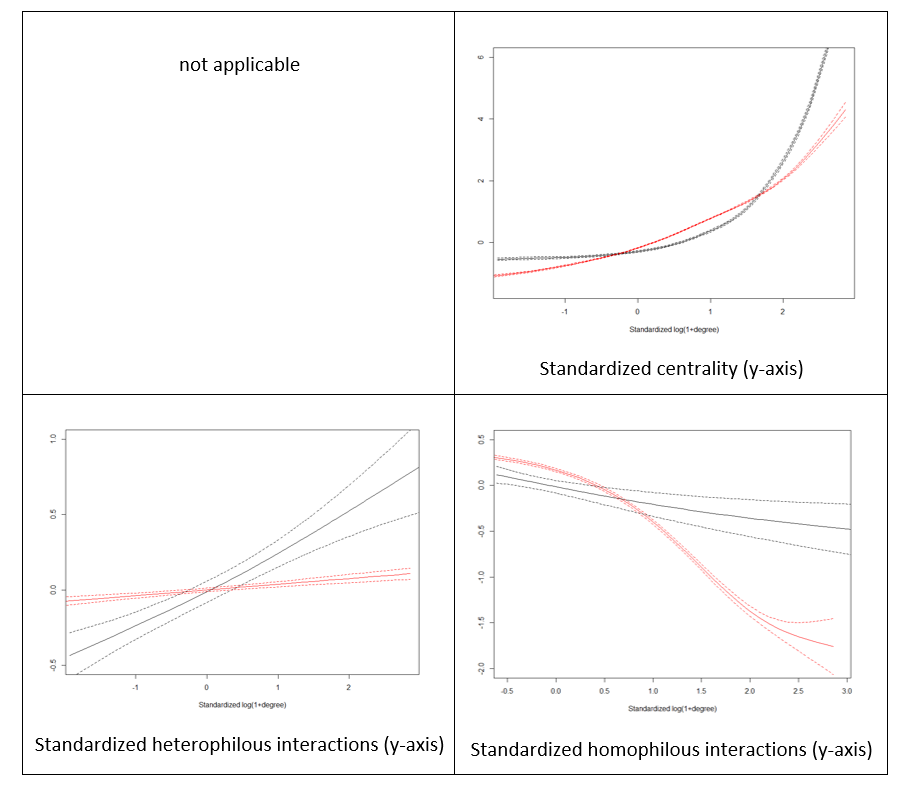
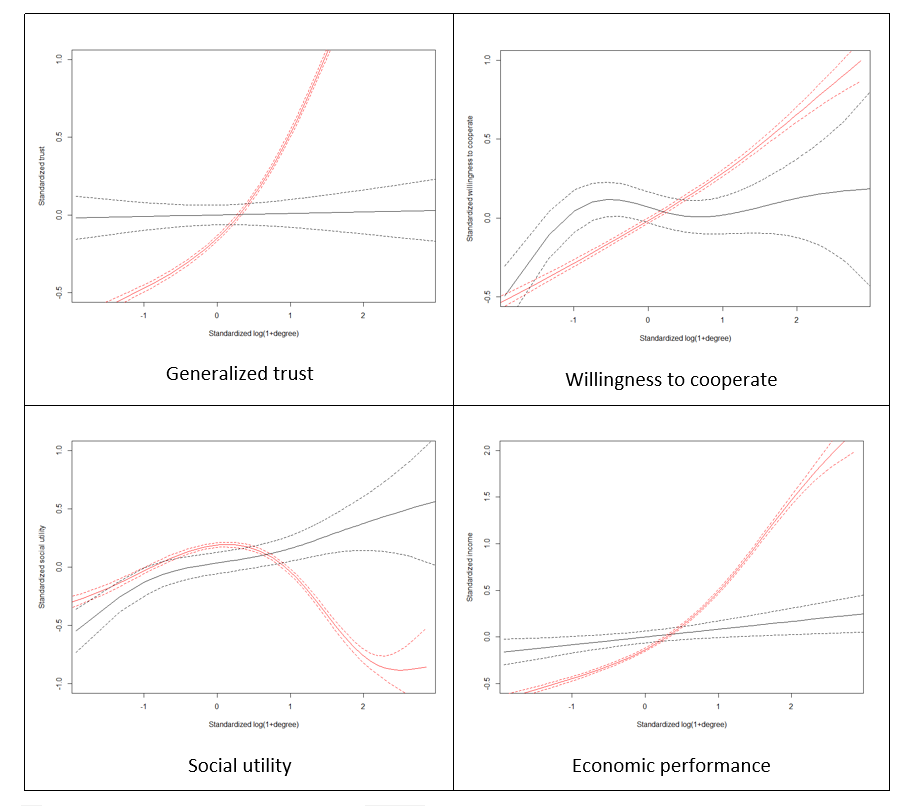
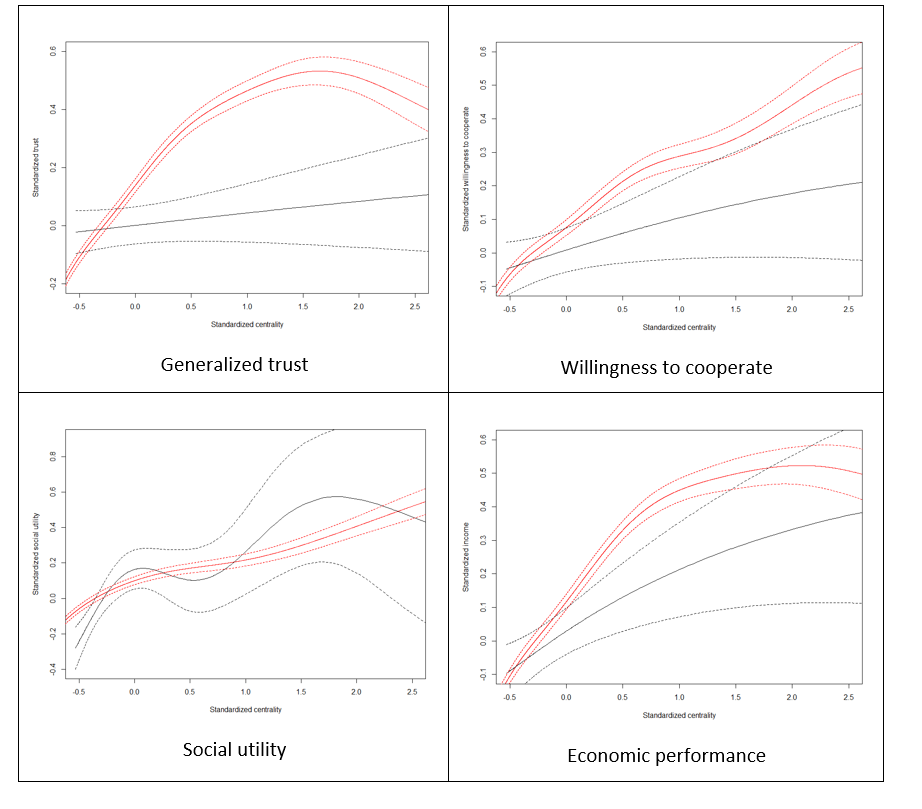
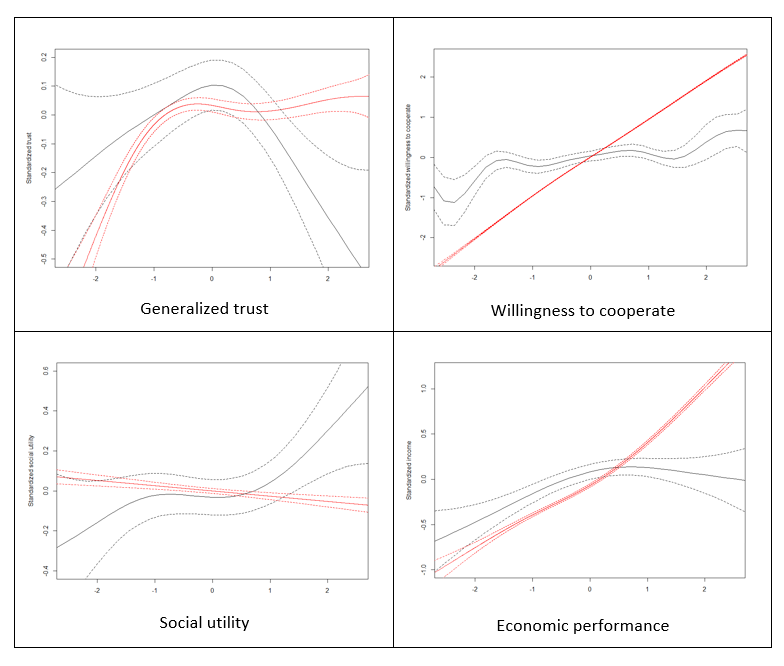
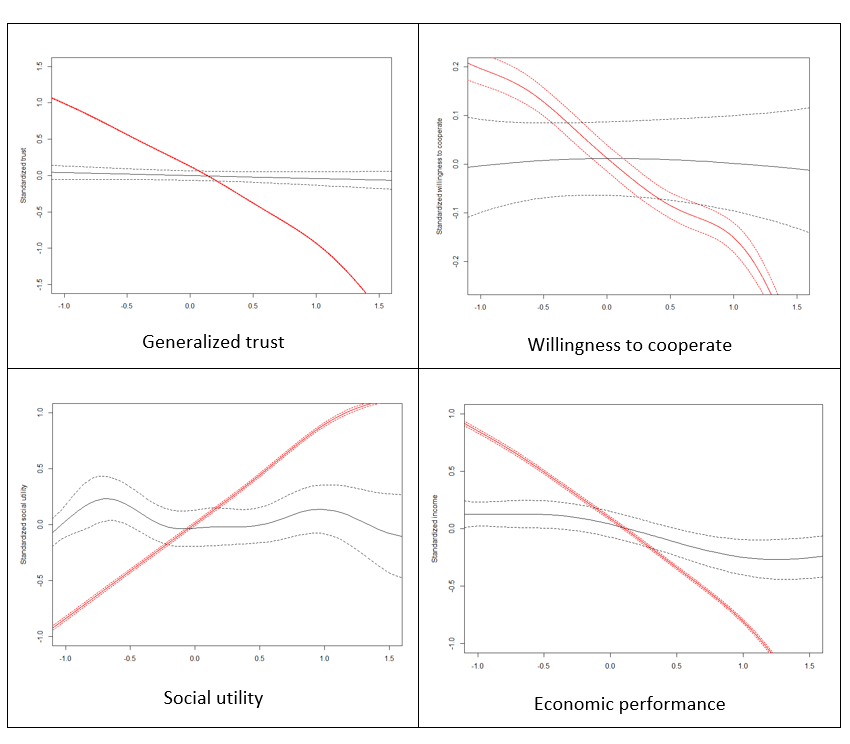
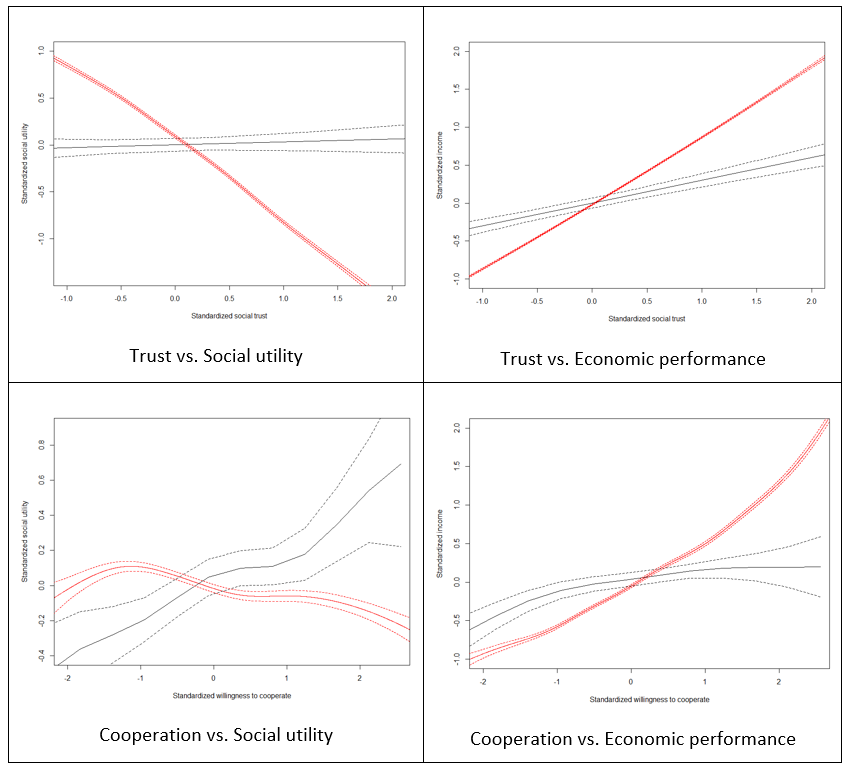
Apart from the correlation analysis, we have also performed more detailed assessment of goodness of fit of our model against Growiec et al. (2017) data. In the figures presented in Appendix we provide a visual comparison of kernel density estimates of key model variables: age (Figure 1), the four dimensions of social capital (Figure 2), and the four outcome variables (Figure 3); as well as nonparametric regressions of these variables against – respectively – individuals' age (Figures 4 and 5), network degree (Figure 6 and 7), centrality (Figure 8), heterophilous (Figure 9) and homophilous interactions (Figure 10), generalized trust and willingness to cooperate (Figure 11). In general, we find that the model results coincide with the data (although – as we stressed before – it was not directly calibrated to reflect all those relationships). However, a few caveats must be kept in mind when looking at these comparisons:
- There is no direct measurement of social utility in the data. The variable is computed from our survey data only as a residual from regressing happiness on incomes, mirroring the model assumption that social utility and economic performance are the two ultimate sources of happiness. In reality, however, happiness may be shaped by other variables as well, such as health, innate optimism, etc. Thus the empirical measurement of this variable is likely noisy.
- The data on degree (number of acquaintances) are likely to be noisy because the respondents found it hard to recall the number of their social ties. This may artificially reduce the observed correlations between degree and variables such as generalized trust or willingness to cooperate.
- In the data, we measure homophilous interactions as the share of kinship ties among all social ties of an individual. While this corresponds well to the model, it appears that the data on this variable are rather noisy (for the same reason as above), again artificially lowering the correlation of this variable with all others.
- The model concentrates on the role of cooperation in social networks for economic performance but abstracts from numerous other relevant determinants of individuals' incomes, such as human capital (education, work experience, health).
- The model assumes that social utility is drawn from ties with kin and with agents who are central to the network. This is a stylized specification which ignores that social utility can be also drawn from social ties with close friends, organized leisure activities, etc.
Small-world topology
In our model, the graph of social ties is dynamic and therefore we measure its average properties in the long run. For 1024 agents we observe an average path length in the graph (average of \(L_{i,j}\)) around 3, global clustering coefficient around 0.27 and the skewness of degree distribution – over 0.5. This means that the assumed graph generating process (featuring both edge destruction and creation) leads to small-world type graphs. For reference, in the Watts-Strogatz model with the same number of nodes and edges, calibrated to reach similar average path length we get that: (a) the clustering coefficient is around two times smaller and (b) skewness is around three times smaller. Thus, our model is able to much better reproduce small-world type properties observed for real-life social networks.
Here we would like to highlight two facts. First, it is known that Watts-Strogatz graphs are not able to adequately represent the long right tail of degree distribution, so the ability to capture this empirically observed phenomenon is a direct advantage of our model. Second, although Watts-Strogatz model was designed to allow for a high clustering coefficient, it is achieved only via a trade-off with average path length. In empirical networks, however, as reported e.g. for the Facebook social graph by Ugander et al. (2011), the clustering coefficient is very high despite short path lengths (remaining over 0.2 for nodes with degree less than 20). Therefore, we believe that the fact that our model exhibits a relatively higher clustering coefficient than Watts-Strogatz model can be considered its relative advantage (it should be noted here, however, that we are not calibrating the model directly to replicate the empirical local clustering coefficient so we concentrate on relative values only).
Individual-level mechanisms and aggregate outcomes: Comparative statics analysis of the model
In order to address our research questions regarding the impact of key characteristics of the social network reconfiguration process (taking place at the individual level) on selected aggregate outcomes (measured at the society level), we have performed a comparative statics experiment. The exercise consisted in modifying model parameters, one at a time, while keeping other parameters at their baseline levels, and assessing the impacts of this change on a range of outcomes.
The ranges for parameter variation in the comparative statics analysis that are reported in this section are provided in Table 1. We report results for all parameters that significantly influence simulation results (we have also tested other parameters and the simulation is either insensitive to changing them within a reasonable range of variation or the results qualitatively do not change).
The results of our study are summarized in Table 4 and discussed below.
| \(\mathbf{\alpha}\) | \(\mathbf{\beta}\) | \(\mathbf{p}\) | \(\mathbf{r}\) | \(\mathbf{\rho}\) | |
| Average path length | - | 0 | 0 | - | 0 |
| Global clustering coefficient | - | + | - | + | 0 |
| Heterophilous interaction | 0 | 0 | 0 | 0 | 0 |
| Homophilous interaction | - | + | 0 | + | 0 |
| Generalized trust | ++ | - | + | - | 0 |
| Willingness to cooperate | + | 0 | 0 | + | 0 |
| Social utility | - | + | - | + | ++ |
| Economic performance | ++ | - | + | - | - |
| Correlation \(D_i\) vs. \(C_i\) | + | - | 0 | - | 0 |
| Correlation \(D_i\) vs. \(Ho_i\) | - | - | + | - | 0 |
| Correlation \(C_i\) vs. \(Ho_i\) | - | - | + | ∪ | 0 |
Frequency of social network reconfiguration (\(\alpha\)).
More frequent social network reconfiguration means that, on average, individuals form more social ties during their lifetime but these ties are less durable. It reduces the role of networks formed in one's youth, which tend to be family- and school-based, as more of them will eventually be replaced with consciously created social ties with people from one's work, hobby groups, etc.
More frequent social network reconfiguration throughout people's lives implies that the resultant network becomes more connected and inclusive, with a reduced average path length and global clustering coefficient. As the percentage share of kinship ties declines, there is also less homophilous interactions in the society.
Reduced average path length in conjunction with fewer homophilous interactions are conducive to marked increases in generalized trust and willingness to cooperate. This in turn fuels a strong positive impact on economic performance.
The effects on social utility are a priori ambiguous: social utility is drawn from contacts with agents displaying high family similarity as well as highly central individuals, and more frequent network reconfiguration drags the first variable down while pushing the second one up. On balance, the first channel appears stronger and social utility is somewhat reduced.
In summary, a higher α makes the network more similar to a random network: average path length and clustering coefficient decrease, resulting in a higher economic performance at the cost of decreasing social utility. Therefore, we observe that there is no a priori optimal value of this parameter in our model as its changes lead to a trade-off between social utility and economic performance (thus extending the results of Growiec et al. (2018), based on a model with a static network structure).
There are also a few interesting results at the individual level. Namely, more frequent network reconfiguration amplifies the cross-sectional correlation between individuals' degree and centrality. At the same time, it reduces the correlation between each of these two characteristics and homophilous interactions.
Importance of family for social tie durability (\(\beta\)).
Family ties are more durable than non-family ties (Granovetter 2005; Roberts & Dunbar 2011). It is therefore natural to assume that the probability of a tie being dissolved should decline with family similarity. The strength and functional form of this relationship, governed by the parameter \(\beta > 0\), are however uncertain. In our simulation experiment, if family similarity is very important for social tie durability (\(\beta > 1\)) then the relationship is convex and kinship ties are far more difficult to dissolve than non-kinship ties. In contrast, if \(\beta < 1\) then the relationship is concave and family similarity only mildly affects the probability of tie destruction.
We find that a high \(\beta\) increases the likelihood that the network becomes clustered into local family-based cliques. It therefore increases the global clustering coefficient and the average intensity of homophilous interactions. This, in turn, reduces generalized trust and economic performance but increases social utility.
In summary, a higher \(\beta\) makes the network more clustered around family. This results in lower economic performance and increased social utility so, similarly to the case of parameter \(\alpha\), there is no a priori optimal value of this parameter in our model, owing to an underlying trade-off between social utility and economic performance.
At the individual level, we also find that in societies with a higher \(\beta\), implying a more clustered social network, individuals' centrality does not correlate that strongly with degree. Also, the correlation between both these variables and homophilous interactions is reduced.
Frequency of local cliques in adolescents' social networks (\(p\)).
Social networks with which adolescents enter their adult life are shaped mostly in family, school and neighborhood. Forming these ties is typically not a conscious choice of the adolescent but a consequence of existing culture and institutions. In terms of our model, a higher \(p\) corresponds to more inclusion and less fragmentation into local cliques. Societies with a high \(p\) are thus the ones with, on the one hand, less fractionalization, class divisions, and school segregation, and on the other hand, with weaker kinship ties.
We find that more inclusive networks among the youth lead to a less clustered network among the adults as well. They are also conducive to more generalized trust and better economic performance, but slightly less social utility.
In summary, a higher \(p\) makes the network more similar to a random one. This results in higher economic performance and decreased social utility. Again - both performance measures are subject to a trade-off and there is no a priori optimal value of this parameter in our model.
At the individual level, more inclusive networks among the youth also imply a higher correlation between agents' degree or centrality and their homophilous interactions.
Other parameters: \(r\) and \(\rho\)
The parameter \(r\) governs the social network density among the youth (\(2r\) is the average number of social ties per agent when they enter adulthood). It then also relates to the average network density among adults. At face value (Table 4), it has substantial impacts on all model variables. One should be cautious when drawing direct inferences from changes in \(r\), however, because in the simulations this parameter is kept independent from \(\alpha\), the frequency of social network reconfiguration, even though in reality they may be intertwined. Thus, a major part of the results may be driven by the implication that more dense networks are also more stable: for a larger \(r\), given a constant \(\alpha\), there is a lower probability a given tie will be dissolved, and newly created ties constitute a lower fraction of all individuals' ties.
The parameter \(\rho\) captures the prevailing social norm on family importance. In societies with a high \(\rho\), family is perceived as relatively important for social utility when compared to social ties outside of family. We find that in societies where \(\rho\) is larger, on average individuals tend to derive more social utility at the cost of lower economic performance. The impact on other variables is, however, rather negligible. In conclusion, also in this case, for both parameters \(r\) and \(\rho\) we see a tradeoff between economic performance and social utility in our model.
Concluding Remarks
In this paper, we have proposed a computational multi-agent model of dynamic formation of social networks guided by the prospects of improving economic performance and social utility of the agents. The model exhibits high compatibility with empirical data presented in Growiec et al. (2017) and literature review. We then used the model to address the five research questions specified in the Introduction, with the following results.
- The endogenous social network structure converges to a stationary state, where the network topology satisfies the small-world property.
- There is a connection between the structure of social networks with which individuals enter their adulthood and the network structure that arises in the stationary state – e.g., cliques formed in people’s youth may persist into adulthood – but the connection fades away with time and is weaker if there is a greater frequency of network reconfiguration.
- Societies with a higher frequency of social tie creation and destruction are – ceteris paribus – more trustful and cooperative, and exhibit better economic performance. By contrast, they display a lower intensity of homophilous interactions and lower average social utility.
- Societies where the durability of social ties is relatively strongly linked to agents' family closeness are relatively less trustful and their economic performance is worse, but they imply more homophilous interactions and greater social utility.
- There is a clear trade-off between social utility and economic performance.
The result that the network of connections between agents arising in the stationary state exhibits small-world properties (small average path length, high clustering and right skewness of the degree distribution) is particularly promising. To our knowledge, this is the first model that achieves these properties and at the same time: (a) is dynamic (i.e. the network evolves all the time while maintaining these properties and the effect is emergent endogenously), (b) takes the age structure of the society into account and (c) the process of social tie creation is explicitly guided by both economic performance and social utility maximization motivations.
The findings of comparative statics analysis provide model-based support for a few well-known sociological and psychological theories (e.g., Coleman 1988; Putnam 2000; Burt 2005; Granovetter 2005). They are also in line with cross-country empirical data to the extent they exist (see the discussion in Growiec et al. 2018). In particular, our result that societies whose social networks are relatively frequently reconfigured, display relatively higher generalized trust, willingness to cooperate, and economic performance at the cost of lower social utility, correspond with Alesina & Giuliano’s (2010) point that societies with stronger family ties are less trustful but happier. Our finding that more dense networks are also more stable is in agreement with Burt’s (Burt 2000; Burt 2002) result that more deeply embedded ties (supplemented by many indirect connections through third parties) are more durable.
As a possible avenue for further research, we can identify additional cross-country verification of predictions of our model. In order to perform it, data similar to Growiec et al. (2017) would have to be collected for different populations. Furthermore, one could also extend the model by incorporating e.g. the life-cycle of earnings, human capital accumulation, or the accumulation of wealth.
Acknowledgements
Financial support from the Polish National Science Center (Narodowe Centrum Nauki) under the grant OPUS 6 No. 2013/11/B/HS4/01467 is gratefully acknowledged.Model Documentation
The model has been built in Julia and the model code is available at https://www.comses.net/codebases/d34b6370-490c-483c-bcf2-94cbeab904fc/releases/1.0.0/.
Notes
- We assume that social utility and economic performance are conceptually separate components of agents’ well-being. Both of them positively contribute to individual well-being but have different determinants.
- By the stationary state of a stochastic model we understand the set of expected values of variables computed from their respective stationary distributions. In practice the stationary state is identified by running the simulation multiple times, each time for a period long enough to make the effect of initial conditions of the simulation insignificant, c.f. Law (2013), and then computing sample averages. Our analysis confirms the validity of the stationary state concept in the case of our model: all model variables indeed converge to stable stationary distributions.
- By definition of heterophilous interactions (social ties with dissimilar others) and homophilous interactions (social ties with similar others, especially kin), they cannot be identified by looking only at the graph of the social network, without characterizing the nodes.
- The safety drive signifies that “people need to feel safe before they start to explore the environment, make new connections or behave in a non-conformist way” (Kadushin 2012, p. 59). The safety drive tends to lead to expressive actions, focused on maintaining resources.
- The efficacy drive has two components: the drive towards competence and autonomy (Greenberg 1991, p. 137). The safety drive and the efficacy drive are “two kinds of basic human motivations (…): first, to feel safe and second, to reach out.” (Kadushin 2012, p. 56). The efficacy drive tends to lead to instrumental actions, focused on gaining new resources.
- “Heterophilous interaction goes beyond simply the reversal of homophilous interaction” (Lin 2001, p. 50).
- Hence, our framework is also consistent with the view that generalized trust is one’s subjectively estimated probability that a randomly selected business partner will not exploit her if they had the chance, whereas willingness to cooperate is the inverse of the likelihood that she will exploit the partner herself in an analogous situation.
- In some specific contexts homophilous interactions may also be important for economic performance, though. For example, the literature on industrial districts and regional economies documents that sometimes bonding social capital may provide the structural conditions necessary for the flourishing of tightly-knit networks of small firms. We thank an anonymous Referee for this observation.
- The Pearson correlation coefficient in the data is -0.09 and not robust when controlling for confounding variables.
- Information that is possessed and exchanged among people may relate to multiple areas of human life. To understand this within a simple model, let us aggregate these areas into two dimensions, \(A\) and \(B\). One could think, for example, that these two dimensions represent broadly defined social (\(A\)) and technical (\(B\)) information. Under the assumptions that (i) all information is valuable, but (ii) information collection is costly and the human capacity for information processing and storage is uniformly limited, this generates a trade-off: more information of type \(A\) becomes associated with less information of type \(B\), and the probability of having both a very high (or low) \(A\) and \(B\) at the same time is extremely low. In order to simplify the reasoning we consider the stylized extreme case where \(A+B\) is constant (in real life this relationship will not be deterministic, but rather the correlation between \(A\) and \(B\) will be negative which is approximated by the assumption that A+B is constant). Using this approach one can precisely locate any person along the \(A\)-\(B\) spectrum by referring to a single-dimensional reduced-form variable (\(A-B\)). We call this variable \(v\). Persons with extreme values of \(v\) are the ones who are highly specialized in a certain area, \(A\) or \(B\), and thus have an advantage in terms of non-redundant information, compared to individuals with \(v \sim 0\) (\(A \sim B\)).
- According to Hammer (1983), people from lower social strata tend to meet people who possess similar resources, and this only perpetuates their low position in the social structure. By contrast, people from higher social strata do not necessarily meet more people, but are more likely to meet individuals with different resources, which benefits their position in the social structure.
- Hence, economic interaction is socially desirable even if both agents defect: the sum of “punishment” outcomes is positive.
- When asked about the number of social ties formed in the last 1 year or 3 months, respondents provide somewhat larger counts. We focus on the long-term statistic in order to disregard non-durable links that are formed and dissolved within one year.
Appendix: Goodness of fit tests of baseline parameterization of the model against empirical data from Growiec et al. (2017)
References
AGHION, P. & Durlauf, S. (2005). ‘Social capital.’ In P. Aghion & S. N. Durlauf (Eds.), Handbook of Economic Growth. Amsterdam: Elsevier.
ALESINA, A. & Giuliano, P. (2010). The power of the family. Journal of Economic Growth, 15(2), 93–125.
ALGAN, Y. & Cahuc, P. (2010). Inherited trust and growth. American Economic Review, 100(5), 2060–92
ARROW, K. J., Chenery, H. B., Minhas, B. S. & Solow, R. M. (1961). Capital-labor substitution and economic efficiency. The Review of Economics and Statistics, 43(3), 225–250.
AZOMAHOU T. T., Boucekkine, R. & Diene, B. (2009). A closer look at the relationship between life expectancy and economic growth. International Journal of Economic Theory, 5(2), 201–244.
BARABÁSI, A. L. & Albert, R. (1999). Emergence of scaling in random networks. Science, 286(5439), 509–512.
BEUGELSDIJK, S. & Smulders, J. A. (2003). ‘Bonding and bridging social capital: Which type is good for economic growth?.’ In W. A. Arts, J. A. P. Hagenaars & L. Halman (Eds.), The Cultural Diversity of European Unity: Findings, Explanations and Reflections from the European Values Study. Tilburg: Tilburg School of Economics and Management, pp. 147–184.
BEZANSON, J., Edelman, A., Karpinski, S., & Shah, V.B. (2017). Julia: A Fresh Approach to Numerical Computing. SIAM Review, 59(1), 65-98.
BOUCEKKINE, R., De la Croix, D., & Licandro, O. (2002). Vintage human capital, demographic trends, and endogenous growth. Journal of Economic Theory, 104(2), 340-375.
BOURDIEU, P. (1986). ‘The forms of capital.’ In J. C. Richardson (Ed.), Handbook of Theory and Research of Sociology of Education. Santa Barbara, CA: Greenwood Press, pp. 117–142.
BOWLBY, J. (1969). Attachment and Loss. London: Hogarth Press and the Institute of Psychoanalysis.
BURT, R. S. (1992). Structural Holes: The Social Structure of Competition. Cambridge, MA: Harvard University Press.
BURT, R. S. (2000). Decay functions. Social Networks, 22(1), 1–28.
BURT, R. S. (2002). Bridge decay. Social Networks, 24(4), 333–363
BURT R., S. (2005). Brokerage and Closure: An Introduction to Social Capital. Oxford: Oxford University Press.
CHRISTAKIS, N. A., J. H. Fowler (2009). Connected: The Surprising Power of Our Social Networks and How They Shape Our Lives. New York, Boston, London: Little, Brown Spark.
COLEMAN, J. S. (1988). Social capital in the creation of human capital. American Journal of Sociology, 94(S), 95–120.
COOK, K. S., Hardin, R. & Levi, M. (2005). Cooperation Without Trust?. New York, NY: Russell Sage Foundation.
DASGUPTA, P. (1988). ‘Trust as a commodity.’ In D. Gambetta (Ed.), Trust: Making and Breaking Cooperative Relations. London: Basil Blackwell, pp. 49–72.
DUNBAR, R. I. M. & Spoors, M. (1995). Social networks, support cliques, and kinship. Human Nature, 6(3), 273–290.
DURLAUF, S. N., and M. Fafchamps (2005): ‘Social Capital.’ In P. Aghion and S. N. Durlauf (Eds.), Handbook of Economic Growth. Amsterdam: Elsevier.
ERICKSON, B. H. (2003). Social Networks: the Value of Variety. Contexts, 2 (1), 25–31.
ERICKSON, B. H. (1996). Culture, Class, Connections. American Journal of Sociology, 102 (1), 217–251.
FIELD, J. (2010). Social Capital. London: Routledge.
FLAP, H., D. (1991). Social Capital in the Reproduction of Inequality, Comparative Sociology of Family, Health and Education, 20, 6179-6202.
FLORIDA, R. (2004). The Rise of the Creative Class. New York: Basic Books.
FRANZEN, A., D. Hangartner (2006). Social Networks and Labour Market Outcomes: the Non-Monetary Benefits of Social Capital. European Sociological Review, 22(4), 353–368.
FUKUYAMA, F. (1995). Trust: The Social Virtues and the Creation of Prosperity. New York: Free Press.
Gittell, R. & Vidal, A. (1998). Community Organizing: Building Social Capital as a Development Strategy. Sage, Thousand Oaks, CA.
GRANOVETTER, M. (2005). The impact of social structure on economic outcomes. Journal of Economic Perspectives, 19(1), 33-50.
GRANOVETTER, M. S. (1973). The Strength of Weak Ties. American Journal of Sociology, 78(6), 1360–1380.
GREENBERG, J. (1991). Oedipus and Beyond: A Clinical Theory. Cambridge, MA: Harvard University Press.
GROWIEC, J., K. Growiec (2010). Social Capital, Well-Being, and Earnings: Theory and Evidence from Poland. European Societies, 12(2), 231–255.
GROWIEC, K., J. Growiec (2014). Trusting Only Whom You Know, Knowing Only Whom You Trust: The Joint Impact of Social Capital and Trust on Happiness in CEE Countries, Journal of Happiness Studies, 15, 1015–1040.
GROWIEC, K., Growiec, J. & Kaminski, B. (2017). Mapping the dimensions of social capital. KAE Working Paper 2017_025, SGH Warsaw School of Economics.
GROWIEC, K., Growiec, J. & Kaminski, B. (2018). Social network structure and the trade-off between social utility and economic performance. Social Networks, 55, 31–46
HAMMER, M. (1983). ‘Core’ and ‘Extended’ Social Networks in Relation to Health and Illness, Social Science and Medicine, 17(7), 405–411.
HILL, R. A. & Dunbar, R. I. M. (2003). Social network size in humans. Human Nature, 14(1), 53–72.
INGLEHART, R., & Baker, W. E. (2000). Modernization, cultural change, and the persistence of traditional values. American Sociological Review, 65(1), 19-51.
KÄÄRIÄINEN, J., & Lehtonen, H. (2006). The variety of social capital in welfare state regimes–a comparative study of 21 countries. European Societies, 8(1), 27-57.
KADUSHIN, C. (2002). The motivational foundation of social networks. Social Networks, 24(1), 77–91.
KADUSHIN, C. (2012). Understanding Social Networks: Theories, Concepts, and Findings. New York, NY: Oxford University Press.
KIM, H. H. (2009). Networks, Information Transfer, and Status Conferral: The Role of Social Capital in Income Stratification among Lawyers. The Sociological Quarterly, 50(1), 61–87.
KLAPWIJK, A. & Van Lange, P. A. M. (2009). Promoting Cooperation and Trust in ‘Noisy’ Situations. The Power of Generosity, Journal of Personality and Social Psychology, 96(1), 83.
KNACK, S. & Keefer, P. (1997). Does social capital have an economic payoff? A Cross-Country Investigation. The Quarterly Journal of Economics, 112(4), 1251–1288.
KROLL, C. (2011). Different things make different people happy: examining social capital and subjective well-being by gender and parental status. Social Indicators Research, 104(1), 157–177.
LAW, A.,M. (2013). Simulation Modeling and Analysis. New York, NY: McGraw Hill.
LAZARSFELD, P. F., R. K. Merton (1954). ‘Friendship as Social Process: A Substantive and Methodological Analysis.’ In M. Berger, T. Abel & C. H. Page (Eds.), Freedom and Control in Modern Society. NewYork, NY: Van Nostrand, pp. 18–66.
LEONARD, M. (2008). Social and subcultural capital among teenagers in Northern Ireland. Youth & Society, 40(2), 224-244.
LEUNG, A., C. Kier, T. Fung, L. Fung, R. Sproule (2011). Searching for Happiness: The Importance of Social Capital. Journal of Happiness Studies, 12, 443–462.
LI, Y., A. Pickles, and M. Savage (2005). Social capital and social Trust in Britain, European Sociological Review, 21(2), 109–123.
LIN., Cook, K. S. & Burt, R. S. (2001). Social Capital: Theory and Research. New Brunswick, NJ: Transaction.
MELAMED, D. & Simpson, B. (2016). Strong ties promote the evolution of cooperation in dynamic networks. Social Networks, 45, 32–44.
MISZTAL, B. (1996). Trust as Social Order. Cambridge, MA: Polity Press
MOLM, L. D., Takahashi, N. & Peterson, G. (2000). Risk and trust in social exchange: An experimental test of a classical proposition. American Journal of Sociology, 105(5), 1396–1427.
MOUW, T. (2003). Social Capital and Finding a Job: Do Contacts Matter?, American Sociological Review, 68, 868–898.
NEWMAN, M.E.J. (2008). ‘Mathematics of networks.’ In S. Durlauf & L. E. Blume (Eds.), The New Palgrave Encyclopedia of Economics. London: Palgrave MacMillan.
NORBUTAS, L. & Corten, R. (2018). Network structure and economic prosperity in municipalities: A large-scale test of social capital theory using social media data. Social Networks, 52, 120–134.
PODOLNY, J. M.& Baron, J. N. (1997). Resources and relationships: Social networks and mobility in theworkplace. American Sociological Review, 62(5), 673–693.
Putnam, R. D. (2000). Bowling Alone: The Collapse and Revival of American Community. New York, NY: Simon and Schuster.
PUTNAM, R. D., Leonardi, R., & Nanetti, R. Y. (1993). Making Democracy Work: Civic Traditions in Modern Italy. Princeton, NJ: Princeton University Press.
ROBERTS, S. G. B. & Dunbar, R. I. M. (2011). The costs of family and friends: An 18-month longitudinal study of relationship maintenance and decay. Evolution and Human Behavior, 32(3), 186–197
SABATINI, F. (2009). Social Capital as social networks: A new framework for measurement and an empirical analysis of its determinants and consequences. The Journal of Socio-Economics, 38, 429–442.
SHAVIT, Y., C. S. Fischer, Y. Kresh (1994). Kin and Non-kin under Collective Threat: Israeli Networks During the Gulf War. Social Forces, 72(4), 1198–2017.
SIMON, H. A. (1955). On a class of skew distribution functions. Biometrika, 42(3/4), 425-440.
SŁOMCZYŃSKI, K., & Tomescu-Dubrow, I. (2005). Friendship patterns and upward mobility: A test of social capital hypothesis. Polish Sociological Review, 151(3), 221-235.
SNIJDERS, T. A. B. (2017). Stochastic actor-oriented models for network dynamics. Annual Review of Statistics and Its Application, 4(1), 343–363.
TIAN, F. F., & Lin, N. (2016). Weak ties, strong ties, and job mobility in urban China: 1978–2008. Social Networks, 44, 117-129.
UGANDER, J., Karrer, B., Backstrom, L., & Marlow, C. (2011). The anatomy of the Facebook social graph. arXiv preprint arXiv:1111.4503.
UZAWA, H. (1962). Production Functions with Constant Elasticities of Substitution, Review of Economic Studies, 29(4), 291–299.
WATTS, D. J., & Strogatz, S. H. (1998). Collective dynamics of ‘small-world’networks. Nature, 393(6684), 440.
WINKELMANN, R. (2009). Unemployment, Social Capital, and Subjective Well-Being. Journal of Happiness Studies, 10, 421–430.
WOOLCOCK, M. (1998). Social Capital and Economic Development: Towards a Theoretical Synthesis and Policy Framework. Theory and Society, 27(2), 151–208.
ZAK, P. J., & Knack, S. (2001). Trust and growth. The Economic Journal, 111(470), 295-321.
ZHANG, S., Anderson, S. G. & Zhan, M. (2011). The differentiated impact of bridging and bonding social capital on economic well-being: An individual level perspective. Journal of Sociology and Social Welfare, 38, 119–142.