
Introduction
The financial system plays a very important role in the development of the whole economic system. Bond Both primary and secondary financial markets have a significant impact on the real economy (Bond et al. 2012), while certain critical events, such as the subprime crisis in 2008, the European sovereign debt crisis in 2010 and the shock to Japan’s stock market and foreign exchange market triggered by the earthquake in 2011 can have negative systemic consequences. Note that also China’s financial system has been negatively affected by frequent financial crises. For example, the Shanghai Composite Index fell more than 45%, from 5178.19 points to 2850.71 points, from June 12, 2015 to August 26, 2015. This implied that the total market value of the Shanghai and Shenzhen stock markets dropped by approximately 33 trillion yuan. During the “money shortage” experienced by China’s banking industry in June 2013, the interbank rates increased drastically. The overnight interbank repo rate reached a high of 30%, and the 7-day repo rate reached a high of 28%. Bank stocks became the object of panicked selling. This means that another financial crisis is likely to happen, the only question is when (Wright 2016).
Since 2007, banks, investment banks, securities institutions and insurance institutions have all suffered major losses. The global financial industry lost approximately $50 trillion in 2008; in particular, from October 2007 to November 2008, the Dow Jones index fell 45%, and 25 American banks failed in that year. American International Group (AIG), one of the largest commercial and life insurers in the United States, lost $18.5 billion in three quarters in 2008. There are complex business connections among financial institutions that might spread risk among banks, securities, insurance and other markets as well as between different regions and countries. This implies that “good” financial institutions can be infected by “bad” ones so triggering an outbreak of global financial systemic risk. The various interrelated channels of risk contagion are one of the vital aspects of systemic risk.
Financial systemic risk is the risk that the failure of a participant to meet its contractual obligations may in turn cause other participants to default, with a chain reaction leading to broader financial difficulties (BIS 1994). Contagion is at the very core of systemic risk and refers to the mechanisms through which shocks propagate from one element of the financial system to another and from the financial system to the real economy (Dijkman 2010). The domino effect caused by risk contagion, the cumulative effect produced when one event sets off a chain of similar events[1] is the main reason for the ensuing of major losses in the financial system after an outbreak of financial systemic risk. At the end of the 20th century, for example, through the foreign exchange market, Thailand’s financial crisis quickly spread to other Asian countries, causing Asian currencies to depreciate. As a result, the Asian financial crisis broke out in an all-round way, which brought great economic losses to the real economy. Specifically, the per capita GDP of Indonesia, Thailand and South Korea shrank by 59%, 40% and 38.5%, respectively, compared to before the financial crisis. The root cause of the domino effect is the risk exposure caused by business linkages between financial institutions. In China’s financial market, financial institutions have a variety of businesses connections with each other, which are the financial risk contagious channels. In the interbank market, financial institutions are linked through interbank lending, interbank deposits, buying securities and return sales, selling repo, foreign exchange transactions and other businesses; in the securities market, financial institutions are linked through cross-shareholding, bond investment and other businesses. This has increased the risk exposure of financial institutions. When one or more financial institutions suffer enough damage from external shocks to default, losses will spread along these links to other financial institutions, which may cause a crisis in the financial system.
In the interbank lending market, when the financial institution \(A\) lends other financial institutions money, its risk exposure increases. If one or more financial institutions that borrow money from \(A\) are subject to shocks and their assets shrink so that they are unable to repay the loans, then defaults occur and losses are passed on to the financial institution \(A\). Therefore, if \(A\) is unable to repay the loans of its creditor institutions, the losses will continue to be passed on along the interbank lending relationship. In this way, interbank lending is a channel of risk contagion between financial institutions. In the stock market, the risk exposure of \(A\) increases due to the hold shares in other financial institutions. If the assets of these financial institutions shrink, the value of the shares held by \(A\) will decline and the assets of financial institution \(A\) will shrink, with negative implications on other financial institutions that hold \(A\)'s shares. These losses will spread simultaneously along the cross-shareholding channel, which is also a risk contagious channel.
It is worth noting that in recent years, with the development of China’s financial markets, mixed operations among financial institutions have led to a variety of cross-business relations among banks, securities, insurance and other financial institutions. This provides more channels for risk contagion among financial institutions. When regulators monitor market risks, they are bound to measure the risks generated by each channel. This raises a number of relevant questions: Will the financial systemic risk be underestimated if the risk of each channel is measured independently? Will the risk of different channels be infected by superposition, leading to the nonlinear evolution of risks in financial system? When there is an outbreak of financial risks, which factors are related to the exposure of financial institutions, and how do they affect losses due to risk contagion after the systemic risk outbreak? Answering these questions is key to prevent and regulate systemic risks in financial markets.
The aim of this paper is to tackle these questions. First, by gathering and analysing data on financial transactions among the 500 institutions listed in “2016 Top Financial Enterprise in China”, published by NetEase finance, and data from the Wind database [2], we found that China’s banking assets account for more than 80% of China’s total financial assets in recent years. This testifies to the fact that the Chinese financial system is dominated by banks. The volume of interbank lending has increased annually since 2010 and reached more than 800 trillion yuan in 2016. Therefore, interbank lending is clearly one of the most important businesses in the interbank market. Furthermore, with the continuous development of the capital market in recent years, China’s stock exchange is now increasingly active with stocks being very liquid investment vehicles. Financial institutions hold each other’s shares more than in the past. After comparing the size and scope of the business between the financial institutions based on the data of their financial statements, we found that the financial institutions in China are mainly linked through interbank borrowing and cross-holding.
Using these data, we constructed a double-layer network structure including the two risk contagion channels as interbank lending and cross-shareholding. One layer network is an interbank business network with data from financial institutions’ balance sheets. Another layer network is a cross-shareholding network with data from financial institutions’ annual reports. This allows us to examine the dynamic mechanism of risk contagion in the financial system and analyse the factors influencing the overall risk and the nonlinear evolution of financial risk. We mapped the contagion and evolution processes of risk by considering connections and with a detailed picture thanks to data in the annual reports of 162 financial institutions for 2016. Data included total assets, total liabilities, loans from banks and other financial institutions, lending to banks and other financial institutions, interbank storage, interbank offers, and cross-shareholding data.
The main contributions of our study are twofold. First, previous research has ignored the impact of cross-shareholding among financial institutions on China’s financial system, which may lead to the underestimation of systemic risk. Here, we reconstructed not only an interbank lending network but also a cross-shareholding network to simulate risk contagion in a double-layer network. Then, we compared the losses in the single-layer network with those in the double-layer network. This allowed us to identify the nonlinear evolution mechanism of risk contagion. (2) We run experiments on the process of systemic risk contagion initiated by bankrupt institutions under different circumstances (asset loss rate, loss given default, total assets, interbank assets and interbank liabilities). This allowed us to examine the impact of a variety of factors on financial systemic risk.
The remainder of this article is organized as follows. Section 2 provides a literature review that specifies the concept of financial system risk and its implications. Section 3 introduces the network model and the processes of risk contagion. Section 4 presents the double-layer network, while Section 5 presents the simulation and our results. Finally, Section 6 provides a summary of the main findings and discusses their implications.
Related literature
Defining financial systemic risk in a univocal and consensual way is difficult (Martínez-Jaramillo et al. 2010). Bartholomew et al. (1995), Bernanke (2009), and IMF (2011) defined financial systemic risk from the point of view of the extent and scope of the risk. BIS (1994), Kaufman & Scott (2003), and Hart & Zingales (2009) described financial systemic risk from the point of view of risk contagion. The Bank for International Settlements (BIS 1994) considered systemic risk as the risk that the failure of a participant to meet its contractual obligations may in turn cause other participants to default with a chain reaction leading to broader financial difficulties. Kaufman & Scott (2003) defined systemic risk as the probability that a breakdown of individual or a certain component of system results in a loss or collapse of the entire system, and the collapse of an overall system is derived from the infectious effect of risk. Martínez-Jaramillo et al. (2010) argued that the definition of systemic risk should feature two aspects: an initial random shock that affects one or more financial institutions and the contagious effect caused by the initial shock. While studying how to avoid the possible financial crisis caused by “too big to fail”, Hart & Zingales (2009) suggested that financial systemic risk refers to the risk that tail events such as institutional collapse or market collapse in the financial system spread from one institution to multiple institutions and from one market to multiple markets, resulting in the continuous spread of losses in the financial system and the impact on the real economy. Zigrand (2014) defined it as a type of risk with a chain reaction that includes the risk of external shocks and the internal risk of the system. Contagion risk is widely perceived as an important element of banking crises and systemic risk (Duggar & Mitra 2009).
We argued that a network approach is needed to reflect the risk exposure among institutions and effectively describe the process of risk contagion. This permits to treat the financial system as an interrelated network: if one or more institutions are subjected to an external shock and fail to operate normally, or even fail completely, the losses may be spread within the network and gradually expand throughout the entire financial system.
Allen & Gale (2000) have been among the first in considering the banking system as a network, indicating that the mechanism of risk contagion depends on the precise structure of the interbank market. Boss et al. (2004), Baum et al. (2004), Martinez-Jaramillo et al. (2010), Xu et al. (2016), and Becher et al. (2008) found that interbank debt networks tend to show a small-world property. Soramäki et al. (2007) and Cont et al. (2010) found that the real world’s interbank business network is a scale-free network, the degree of which is subject to power-law distribution. Montagna & Lux (2017) and González-Avella et al. (2016) adopted scale-free networks to describe interbank networks and study risk contagion in these networks. On the other hand, other studies have used a full network (Martínez-Jaramillo et al. 2010; Mistrulli 2011) and a core-periphery network (Veld & Lelyveld 2014; Elliott et al. 2014; Fricke & Lux 2015) to describe the business linkages among financial institutions.
To our purposes, we do not have sufficient data to prove that the financial system of China has one of the specific structures typically mentioned in network research, such as scale-free or small-world structures. It is interesting to note here that Upper & Worms (2004) used a matrix form to represent bilateral credit relationships for the German banking system and a balance sheet information to estimate it. They tested whether the breakdown of a single bank can lead to contagion. The matrix form was a type of network model based on data in the balance sheet. Note that data in the balance sheet can truly and directly reflect the risk exposure of financial institutions and are easily available. Furthermore, the matrix approach is easy perform and does not need to make any assumptions about the network structure. Upper (2011) argued that the matrix approach is very useful for simulating risk contagion.
This led us to decide to use a matrix approach to build our interbank lending network among financial institutions. Note that there is research using this approach to investigate financial risk contagion. For instance, Wells (2005) followed Upper & Worms (2004) and estimated a matrix of bilateral exposures for all banks operating in the United Kingdom. He considered two cases of risk contagion: the first was the likelihood of “domino effects” while the other was the extent to which the failure of one bank could cause a wider weakening of the United Kingdom banking system. Degryse & Nguyen (2007) employed a matrix to depict the bilateral risk exposure among Belgian banks and study the evolution of contagion risk in the Belgian banking system. Li et al. (2011) used a matrix to build the interbank lending network among banks in China and constructed an index to compare and analyse the differences in the influence of random shock and selective shock on the stability of the bank network. Ji et al. (2014) improved the matrix approach propounded by Upper to overcome the limitations of the random graph and static contagion model and carried out a dynamic simulation of external shock. This method can be used to determine the important parameters needed for controlling the system risk of banks in the event of a crisis.
However, in some countries, including China, lending data between financial institutions are not available. This implies that it is impossible to calibrate the values of each element in the matrix empirically. In these cases, a method called maximum entropy is applied to estimate such matrices (Elsinger et al. 2006; Andrecut 2017). Jaynes (1957a, 1957b) suggested that maximum entropy is a reasoning method that ensures that unconscious arbitrary assumptions are not introduced in the model. Furthermore, the maximum entropy method can be considered an objective estimation of the two-sided exposure matrix method under the condition of a lack of relevant information. In our cases, we could only obtain data on the total borrowing and total lending of each financial institution and therefore used the maximum entropy method to estimate the lending data between every two financial institutions.
According to the classification of the risk contagious channel, there are two approaches to the use of a network model to describe risk contagion. The first considered a single channel, which is typically characterized by a single-layer network (Nier et al. 2007; Gai et al. 2010; Georg et al. 2013; Sachs et al. 2014; Sensoy et al. 2015; Betz et al. 2016; Silva et al. 2016; Cheng et al. 2017). However, in real financial markets, there are various risk contagious channels among financial institutions. If only one of them is considered, the expected systemic loss will be underestimated (Poledna et al. 2015). The other approach considers a multichannel, which is typically presented in forms of multilayer networks. Each layer represents one relationship, and these layers are interrelated (Granell et al. 2013). Using data from the settlement market infrastructure, León et al. (2014) studied financial institutions’ transactions from three different trading and registering individual networks that they combine into a multilayer network. They found that a multilayer approach produced a connective structure consistent with most real-world networks, such as sparse, uneven and aggregated distributions. Poledna et al. (2015) built a multilayer network model to examine the risk in Mexico’s banking industry. They showed that previous studies focused only on one contagion channel, thereby greatly underestimating the systemic risk. They noted that the process of risk aggregation among the various layers is nonlinear. In a study on financial stability, Langfield et al. (2014) built an interbank risk network and interbank fund network based on the different economic functions of the British market. Bargigli et al. (2015) analysed the multiple networks of banks in Italy from the perspective of contract type and maturity, finding different topological properties and persistence over time.
However, the use of a specific layer to represent the others can be a poor representation of the interlinkages in the interbank market, so potentially biasing the estimation of systemic risk. Li et al. (2017) studied a three-layer network corresponding to different guarantee relations in China’s guarantee market and found that these three single-layer networks have scale-free and hetero compatibility characteristics. However, note that Bargigli et al. (2015), León et al. (2014) and Li & Wen (2017) only focussed on the multilayer network structure of the financial system and did not measure the contagious losses after systemic risks break out. Poledna et al. (2015) and Langfield et al. (2014) investigated systemic risks in the banking industry without considering other type of financial institutions. Ignoring the role of financial institutions, aside from banks, could underestimate systemic risks. Constructing a double-layer network of two risk contagious channels, which includes banks, insurance, securities and other financial institutions, is key to capture the complexity of actors and connections. When the initial shock occurs, we estimated the isolated single-layer risk contagious loss and double-layer contagious loss.
Network Model
Interbank lending network
We assume that there are \(n\) nodes in the interbank lending network, with each node representing a financial institution. If the interbank assets of institution \(i\) are expressed by \(IA_i\), the interbank liabilities are expressed by \(IL_i\), and \(x_{ij}\) is the unpaid loans of bank \(j\) to bank \(i\), then the interbank lending network can be expressed as an \(n \times n\) matrix \(X\):
| $$\begin{align*} X =& \left[\begin{matrix} x_{11}&.&.&.&x_{1j}&.&.&.&x_{1n}\\ .&.&&&.&&&.&.\\ .&&.&&.&&.&&.\\ .&&&.&.&.&&&.\\ x_{i1}&.&.&.&x_{ij}&.&.&.&x_{in}\\ .&.&&&.&&&.&.\\ .&&.&&.&&.&&.\\ .&&&.&.&.&&&.\\ x_{n1}&.&.&.&x_{nj}&.&.&.&x_{nn} \end{matrix}\right] \quad \begin{matrix}a_1\\.\\.\\.\\a_i\\.\\.\\.\\a_n\end{matrix}\\ &\qquad\begin{matrix} l_{1}&.&.&.&l_{j}&.&.&.&l_{n} \end{matrix} \end{align*}$$ | (1) |
First, standardize Equation 1. Let \(a'_i = \frac{IA_i}{\sum_i IA_i}\), and \(l'_j = \frac{IL_j}{\sum_j IL_j}\); then,
| $$\begin{align*} X =& \left[\begin{matrix} x_{11}^{\ast}&.&.&.&x_{1j}^{\ast}&.&.&.&x_{1n}^{\ast}\\ .&.&&&.&&&.&.\\ .&&.&&.&&.&&.\\ .&&&.&.&.&&&.\\ x_{i1}^{\ast}&.&.&.&x_{1j}^{\ast}&.&.&.&x_{in}^{\ast}\\ .&.&&&.&&&.&.\\ .&&.&&.&&.&&.\\ .&&&.&.&.&&&.\\ x_{n1}^{\ast}&.&.&.&x_{nj}^{\ast}&.&.&.&x_{nn}^{\ast} \end{matrix}\right] \quad \begin{matrix}a_1'\\.\\.\\.\\a_i'\\.\\.\\.\\a_n'\end{matrix}\\ &\qquad\begin{matrix} l_{1}'&.&.&.&l_{j}'&.&.&.&l_{n}' \end{matrix} \end{align*}$$ | (2) |
Second, maximize the information entropy:
| $$\max \Biggl( - \sum_j \sum_i x_{ij}^{\ast} \ln x_{ij}^{\star} \Biggr)$$ | (3) |
| $$\max \Biggl( - \sum_j \sum_i x_{ij}^{\ast} \ln x_{ij}^{\star} \Biggr)$$ | (4) |
| $$x_{ij}^{\ast} = a'_i \times l'_j\text{.}$$ | (5) |
The network represented by matrix \(X^{\ast}\) is a fully connected network, that is, every node in the network is connected to other nodes as well as to itself (\(x_{ii}^{\ast} > 0\)), which is contrary to the fact that a bank would never have dealings with itself. Therefore, we set \(x_{ii}^{\ast} = 0\).
The structure of the real interbank network has the characteristics of local compactness (National Research Council of the National Academics 2007; May & Levin 2008). This means that the probability of interbank exposure among banks with high total assets is greater than that among banks with low total assets. In reality, large banks often have lending business with many banks, while small banks may only have some lending business with a few large banks. For some periods, there may be no business between small banks at all[3]. Then, assuming in the model that the probability of a lending relationship between banks is positively correlated with the size of the assets of the two banks ensures that the interbank relationships between large banks are more closely related.
| $$P_{ij} = \sup(P_{ab})\frac{ZA_i + ZA_j}{2ZA_{\max}}\text{,}$$ | (6) |
Assume that the generated network can be represented by an adjacency matrix \(q = [q_{ij}]_{n \times n}\), in which \(q_{ij}\) is 0 or 1. When bank \(i\) is connected to bank \(j\), \(q_{ij} = 1\), and otherwise, \(q_{ij} = 0\). We modify matrix \(X^{\ast}\) based on matrix \(q\). Assuming that the modified matrix is \([Y]_{n \times n}\),
| $$y_{ij} = \begin{cases} x_{ij}^{\ast} & \text{if} \quad q_{ij} = 1\\ 0 & \text{if} \quad q_{ij} = 0 \end{cases} \text{.}$$ | (7) |
Obviously, \(Y\) does not satisfy the constraint condition (Equation 4), so we optimize the \(Y\) matrix by minimizing the cross-entropy between \(X^{\ast}\) and \(Y\). The objective function and constraints are as follows:
| $$\min \sum_i \sum_j y_{ij} \ln \frac{y_{ij}}{x_{ij}^{\ast}}$$ | (8) |
| $$\text{s.t.} \quad \sum_{j = 1}^n j_{ij} = a'_i\text{,} \quad \sum_{i = 1}^n = l'_j\text{,} \quad y_{ij} \geq 0\text{,} \quad y_{ii} = 0\text{,}$$ | (9) |
| $$If \text{If} \quad y_{ij} = 0\text{,} \quad \text{then} \quad \ln\frac{0}{0}=0\text{.}$$ | (10) |
This problem can no longer be solved analytically and therefore requires numerical optimization. The RAS algorithm provides a computationally efficient method to solve this minimization problem (Bacharach 1965). The algorithm starts by allocating an array \(Y\) with \(N^2\) elements and setting \(y_{ij} 0 x_{ij}^{\ast}\). The algorithm iterates the following equations:
| $$y_{ij}(t + 1) = \frac{y_{ij} (t) a_i}{\sum_{m = 1}^n y_{im} (t)},i,j = 1, \dots, n\text{,}$$ | (11) |
| $$y_{ij}(t + 1) = \frac{y_{ij} (t) l_i}{\sum_{m = 1}^n y_{mj} (t + 1)},j,i = 1, \dots, n\text{,}$$ | (12) |
| $$\eta = \mid | y(t + 1) - y(t) | \mid < \delta\text{.}$$ | (13) |
Obtain matrix \(Y\):
| $$\begin{align*} Y =& \left[\begin{matrix} 0&.&.&.&y_{1j}&.&.&.&y_{1n}\\ .&.&&&.&&&.&.\\ .&&.&&.&&.&&.\\ .&&&.&.&.&&&.\\ y_{i1}&.&.&.&0&.&.&.&y_{in}\\ .&.&&&.&&&.&.\\ .&&.&&.&&.&&.\\ .&&&.&.&.&&&.\\ y_{n1}&.&.&.&y_{nj}&.&.&.&0 \end{matrix}\right] \quad \begin{matrix}a_1^{\ast}\\.\\.\\.\\a_i^{\ast}\\.\\.\\.\\a_n^{\ast}\end{matrix}\\ &\qquad\begin{matrix} l_{1}^{\ast}&.&.&.&l_{j}^{\ast}&.&.&.&l_{n}^{\ast}\end{matrix} \end{align*}$$ | (14) |
| $$\sum_i y_{ij} = l_j^{\ast}\text{,} \quad \sum_j y_{ij} = a_i^{\ast}\text{.}$$ | (15) |
The contagion of financial risk
The interbank business network
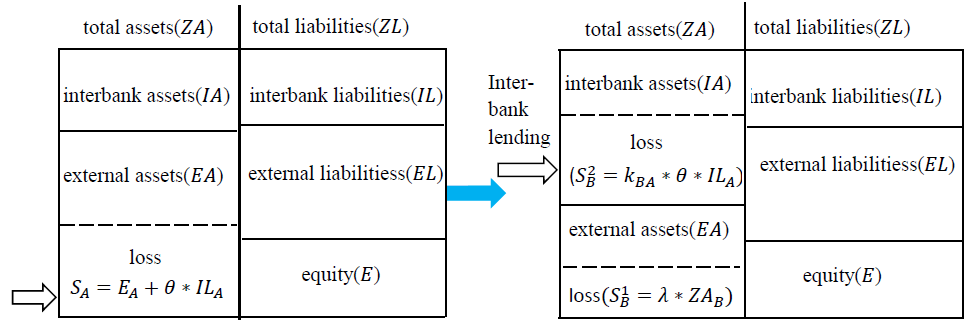
Total assets \(ZA\) in the balance sheet of a financial institution include interbank assets \(IA\) and external assets \(EA\), and total liabilities \(ZL\) include interbank liabilities \(IL\) and other liabilities \(EL\). The owner′s equity of a financial institution is expressed by \(E\). Then,
| $$ZA = IA + EA\text{,}\quad ZL = IL + EL\text{,}\quad E = ZA - ZL\text{.}$$ | (16) |
For a single financial institution, when equity \(E < 0\), it is bankrupt and will default on its debts. When a financial institution faces an external shock, a portion of its external assets will be lost. If the loss is \(\Delta EA\), when \(\Delta EA > E\), the institution will go bankrupt and be liquidated. In the process of liquidation, institutions will recover their interbank assets and external assets first to service debts and then will repay their debts. Assuming that financial institutions first repay other liabilities and then repay interbank liabilities, the loss of the institution is \((E + \theta \ast IL)\), where \(\theta\) is the proportion of the interbank liabilities that cannot be repaid, which is called the loss given default \((0 \leq \theta \leq 1)\).
In the process of risk contagion, only the losses caused by institutional bankruptcy will be transmitted through the interbank business channel. When the failed institution cannot repay all of its interbank liabilities, it is assumed that the institution treats all liabilities equally. The rate of repayment of \(j\) to \(i\) is as follows:
| $$k_{ij} = \frac{y_{ij}}{l_j^{\ast}}\text{,} \quad k_{ij} \in K\text{,} $$ | (17) |
| $$IA_i^{\ast} = \sum_{j = 1}^n k_{ij} IL_j^{\ast}\text{.}$$ | (18) |
When financial institutions are driven into bankruptcy by the loss of interbank assets, it is called contagion default and satisfies the following conditions:
| $$E = IA + (EA - EL) - IL \geq 0\text{,} E = IA^{\ast} + (EA - EL) - IL < 0\text{.} $$ | (19) |
Cross-shareholding network
In the cross-shareholding channel, \(h_{ij}\) represents the proportion of shares of institution \(j\) held by institution \(i\). When institution \(j\) is subjected to an external impact resulting in a loss of its owner's equity \(s_{j0}\), the loss of institution \(j\) may be transmitted to institution \(i\) through the shares held by institution \(i\). Here, the loss of \(i\) is \(s_{ij} = s_{j0}^{\ast}h_{ij}\text{,} \, s_{j0} \leq E\). As long as an institution has its owner's equity losses, whether it is bankrupt or not, these losses will be transmitted to its shareholders through the cross-shareholding channel, which is different from the interbank business channel.
Risk contagion channel of the double-layer network
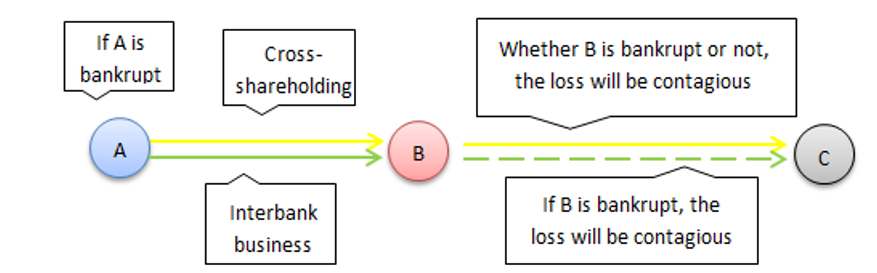
Figure 1 shows risk contagion in a double-layer network. \(A\) and \(B\) and \(B\) and \(C\) are directly linked through the two risk contagion channels. The bankruptcy of \(A\) caused by an external shock will transmit losses to \(B\) through both the interbank business and cross-shareholding channels. If \(B\) goes bankrupt, the losses will also be transmitted to \(C\) through these two channels. If \(B\) does not go bankrupt, the losses will only be spread to \(C\) through the cross-shareholding channel. However, while contagion due to liquidity or default has an immediate effect on the system, contagion due to cross-shareholding value loss may be delayed. Therefore, we assume that the risk contagion of the cross-shareholding channel lags one period behind that of the interbank lending channel.
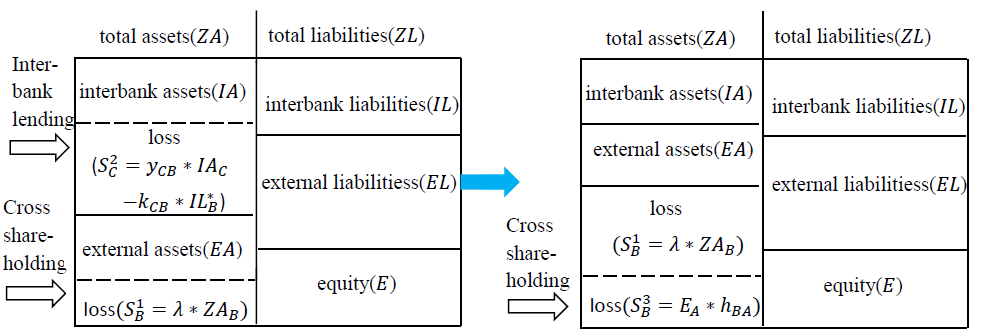
We study the contagion process of risk in two different situations: a normal market and a depressed market. In a normal market, no bank loses its assets due to a depressed financial market environment. Let \(\lambda\) be the asset loss rate, indicating the ratio of asset loss for the financial institutions in the system. The market is normal when \(\lambda=0\), in which no institutions suffer asset losses caused by the common financial market environment. The market is depressed when \(1 \geq \lambda > 0\), and all institutions suffer shocks from the market environment and lose their assets. In the market, all institutions lose \(S^1 = \lambda \ast ZA (0 \leq \lambda \leq 1)\). We start the risk contagion process with the bankruptcy of \(A\) due to external shocks, and its loss is \(S_A = E_A + \theta \ast IL_A > E_A\) at time \(t\) (Figure 2). The loss of \(B\) through its link to \(A\) is \(S_B^2 = k_{BA} \ast \theta \ast IL_A\) at time \(t+1\), and this loss is transmitted through the interbank business channel (Figure 2). Because the risk contagion of the cross-shareholding channels has a one-period lag, \(A\) does not transmit losses to \(B\) through cross-shareholding channels at this time. At time \(t+1\), if \(S_B^1 + S_B^2 > E_B\), \(B\) goes bankrupt, and it passes losses through the interbank business channels to institution \(C\) (Figure 3), so the loss of institution \(C\) at time \(t+2\) is \(S_C^2 = y_{CB} \ast IA_C - k_{cB} \ast IL_B^{\ast}\), where
| $$IL_B^{\ast} = IA_B^{\ast} + EA_B - (S_B^1 + S_B^2 - E_B) - EL_B\text{,} $$ | (20) |
| $$\text{If}\, IL_B^{\ast} < 0\text{, then}\, IL_B^{\ast} = 0$$ | (21) |
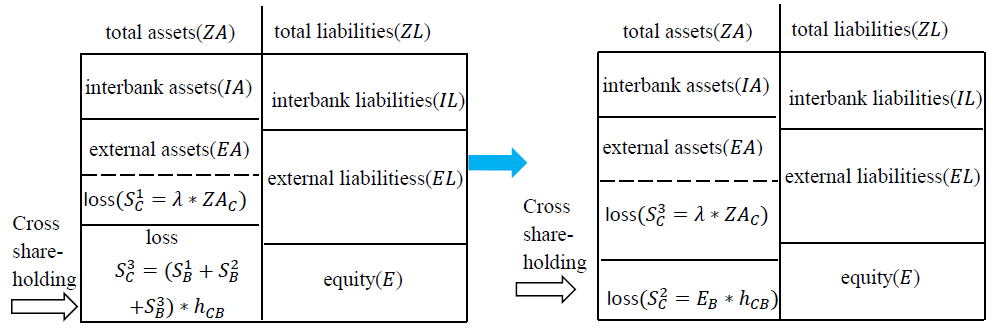
If \(S_B^1 + S_B^2 \leq E_B\) at time \(t + 1\), institution \(B\) does not go bankrupt, but it will be infected by \(A\)'s bankruptcy at time \(t\) through the cross-shareholding channel; then, the loss of \(B\) at time \(t+2\) is \(S_B^3 = E_A \ast h_{BA}\) (Figure 3). Similarly, because of the lag of risk contagion in the cross-shareholding channel, \(C\) is not affected by the loss of \(B\) through the cross-shareholding channel at the same time. If \(S_C^1 + S_C^2 > E_C\), \(C\) goes bankrupt and transmits losses to its associated institution \(D\) through the interbank channels. If \(S_C^1 + S_C^2 \leq E_C\) and \(S_B^1 + S_B^2 + S_B^3 \leq E_B\) at time \(t + 2\), \(B\) will pass its loss to \(C\) through the cross-shareholding channel; then, the loss of \(C\) at time \(t+3\) is \(S_C^3 = (S_B^1 + S_B^2 + S_B^3) \ast h_{CB}\). If \(S_C^1 + S_C^2 \leq E_C\) and \(S_B^1 + S_B^2 + S_B^3 > E_B\), then \(S_C^3 = E_B \ast h_{CB}\) at time \(t+3\) (Figure 4).
Double-Layer Network
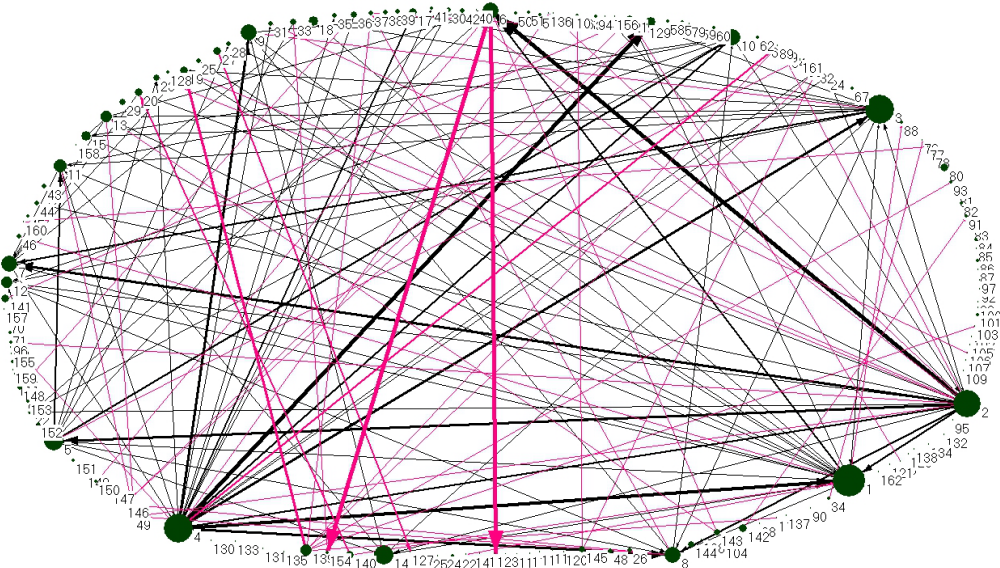
We selected 500 financial institutions to build the double-layer network by referring to the list of “2016 Top Financial Enterprise in China”, published by NetEase finance. However, due to the lack of data, some organizations have been removed according to the following three principles. First, many of these 500 financial institutions were not listed, and their annual reports were not disclosed; thus, we deleted 258 institutions. Second, we could not access interbank liabilities data or interbank assets data for 31 of the 242 remaining institutions, and thus, these were deleted. Finally, we removed 49 of the remaining institutions because they had neither interbank asset data nor interbank liability data, they did not hold shares in any other institution and their shares were not held by any other institution. In the end, we used 162 financial institutions to build China’s financial system network (Figure 5).
To build the interbank business network and cross-shareholding network following the interbank assets, interbank liabilities and cross-shareholding data of these financial institutions in their 2016 annual reports, we adopted the method described in Section 3.1-3.19. Securities companies engage in the lending business in the financial market, which is very similar in essence to the interbank business. Therefore, we classified the financed funds item of the securities companies as liabilities of the same industry and the incorporated funds items in the balance sheet of the securities companies as interbank assets. Therefore, 138 of the 162 financial institutions selected in this paper had interbank business links with their counterparts (see Appendix A). The node number in the network represents the selected sample institutions sorted by node strength, from strong to weak. The node strength here is the sum of the interbank assets and the interbank liabilities. The related data are shown in Appendix A.
The steps for establishing a double-layer network are shown below (the pseudo-code for establishing an interbank lending network matrix see Appendix B).
- Initialization: setting the number of institutions participating in the interbank lending business \(n\) and the number of institutions participating in the cross-shareholding business \(nn\), and the maximum size of banks \(\sup(P_{ab})\);
-
Establishing a double-layer network matrix
- Establishing an interbank lending network matrix
- Generate an adjacency \(\textit{matrix}\). Build a random matrix \(Q = [q_{ij}]_{n \times n} = \sup (P_{ab}) \ast \textit{rand}(n,n)\). For \(\forall i, j\), calculate \(p_{ij} = \sup (P_{ab}) \frac{ZA_i + ZA_j}{2ZA_{\max}}\). If \(q_{ij} \leq p_{ij}\), let \(\textit{matrix}_{ij} = 1\), and otherwise, \(\textit{matrix}_{ij} = 0\). For all institution \(i\), let \(\textit{matrix}_{ij} = 0\);
- For all institutions, calculate \(a'_i = \frac{IA_i}{\sum_i IA_i}\). Then, build \(X^{\ast} = [x^{\ast}_{ij}]_{n \times n}\) with \(x_{ij}^{\ast} = a'_i \times l'_j\). If \(\textit{matrix}_{ij} = 0\), then \(x_{ij}^{\ast} = 0\). Let \(Y = [y_{ij}]_{n \times n} = X^{\ast}\), and then, the RAS algorithm is used to find the interbank lending matrix \(Y\), which represents the interbank lending network;
- Establish a cross-shareholding network matrix \(H = [h_{ij}]_{nn \times nn}\) in which \(h_{ij}\) is the share rate of financial institution \(j\) held by financial institutions \(i\);
- Establish a double-layer network. Based on the interbank lending matrix and the cross-shareholding matrix obtained by (A) and (B), we obtain the connection data between institution \(i\) and institution \(j\) through the interbank lending channel and the cross-shareholding channel and then draw a double-layer network using pajek.
- Establishing an interbank lending network matrix
To distinguish the interbank business network from the cross-shareholding network in Figure 5, the interbank business network links are expressed in black, and the cross-shareholding network links are expressed in red. In the interbank business network, the size of the nodes represents the scale of the total assets of the financial institutions, and the thickness of the links shows the amount of the interbank business funds. It can be seen that in the interbank business network, a few nodes have more and thicker connections than other nodes. However, most nodes have few and relatively thin connections with other nodes. The degree and strength of a few nodes are both high, and this has a strong influence on the whole network, while the degree and strength of most nodes is very low, and these nodes have very limited effects on the whole network. In the cross-shareholding network, the size of the links is positively correlated with the size of the shareholding. It is worth noting that in these two networks, the thicker the connection is, the darker the colour. For example, if the proportion of shares held by institution \(i\) in institution \(j\) is \(S_{ij}\), the equity that \(i\) holds in \(j\) is calculated by \(S_{ij}\) multiplied by the equity of \(j\). It can be seen that in the cross-shareholding network, there are fewer connections between nodes, and most are thinner, which shows that the correlation of each node in cross-shareholding is not as strong as it is in the interbank business network.
Analysis of Simulation and Results
Parameters and algorithm
The asset loss rate from each bankruptcy of the sample institution is calculated. Because the systemic risk under study starts with the bankruptcy of a financial institution, we take the minimum value of these asset loss rates, 0.04, as the upper limit. Therefore, in this paper, the range of the asset loss rate \(\lambda\) is limited to [0, 0.04]. In addition, the value of \(\theta\) is [0, 1]. \(S_i\) is the initial loss of institution \(i\), which is the first bankrupt institution. In addition, \(\sup P_{ab} = 0.8\) and \(\delta = 10^{-8}\) are given in this paper.
\(S_i\) consists of two parts, namely, the asset loss rate multiplied by the total assets \(i\) of and the owner's equity. \(SZ\) is the total losses of the system when the risk spreads in a double-layer network, which is the sum of the losses of all institutions through the risk contagion process and the initial losses. However, \(SS\) indicates the losses caused by risk contagion in the system. The difference between \(SZ\) and \(SS\) is that \(SS\) does not include the loss from the initial bankruptcy of the institution, that is, \(SS = SZ - S_i\). \(S(ty)\) represents the sum of the losses of all institutions caused by risk contagion when the risk spreads in the interbank business channel only, while \(S(jc)\) is the sum of the losses of all institutions caused by risk contagion when the risk spreads in the cross-shareholding channel only. \(SC\) is named "excess losses'' in this paper and equals the losses in the double-layer network minus the sum of the losses caused by risk contagion in the interbank business channel and the losses caused by risk contagion in the cross-shareholding channel alone, namely, \(SC = SS - S(ty) - S(jc)\). \(N\) is the number of institutions that fail due to risk contagion.
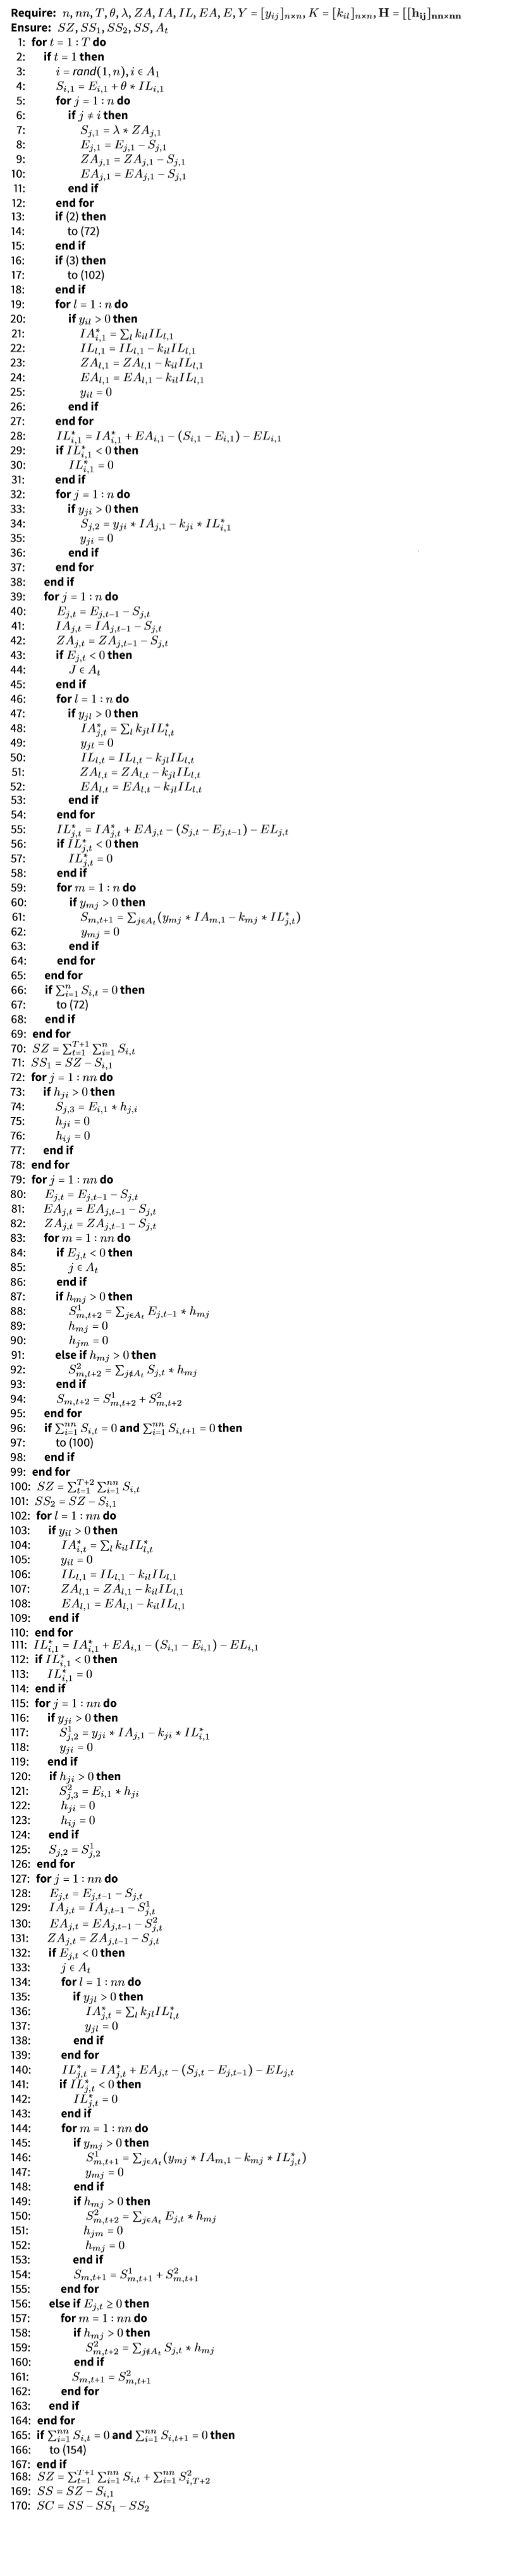
The algorithm for the loss of diffusion in an interbank lending channel independently, a cross-shareholding channel independently and a double-layer contagion channel after one of the financial institutions goes bankrupt with an initial shock are shown below (the pseudo-code is reported in Appendix C).
- Initialize \(n\), \(nn\), \(T\), \(\theta\), \(\lambda\), a set of bankrupt institutions \(A\). Input \(Y\), \(H\), the rate of repayment matrix \(K\), \(ZA\), \(EA\), \(IA\), \(ZL\), \(IL\), \(EL\) and \(E\);
- When \(t = 1\), institutions initially suffer shocks. Let one of the institutions \(i\) go bankrupt with its initial loss \(S_{i,1} = E_{i,1} + \theta \ast IL_{i,1}\). Let the set of bankrupt institutions be \(A_1 = \{ i | E_{i,1} - S_{i,1} < 0 \}\). Compute the loss of the other institutions without bankruptcy \(S_{j,1} = \lambda \ast ZA_{j,1} (0 \leq \lambda \leq 1)\). Update \(E_{j,1} = E_{j,1} - S_{j,1}\), \(ZA_{j,1} = ZA_{j,1} - S_{j,1}\) and \(EA_{j,1} = EA_{j,1} - S_{j,1}\). When losses transmit independently through the cross-shareholding channel, to (6); When losses transmit through both the interbank lending channel and cross-shareholding channel, to (9);
- At \(t=1\), calculate the bankrupt institution \(i\)'s interbank assets \(IA^{\ast}_{i,1} = \sum_{l = 1}^n k_{il} IL_{l,1}\) recovered from its debtors \(l\). Update \(IL_{l,1} = IL_{l,1} - k_{il} IL_{l,1}\), \(ZA_{l,1} = ZA_{l,1} - k_{il} IL_{l,1}\) and \(EA_{l,1} = EA_{l,1} - k_{il} IL_{l,1}\). Calculate the interbank liabilities \(IL^{\ast}_{i,1} = IA^{\ast}_{i,1} + EA_{i,1} - (S_{i,1} - E_{i,1}) - EL_{i,1}\) that \(i\) can repay. If \(IL_{i,1}^{\ast} < 0\), let \(IL_{i,1}^{\ast} = 0\). If \(j\) is the creditor of institution \(i\), that is, \(y_{ji} > 0\), calculate the losses \(S_{j,2} = y_{ji} \ast IA_{j,1} - k_{ji} \ast IL_{i,1}^{\ast}\). Let \(y_{ji}\) and \(y_{ij}\) in the \(Y\) be 0;
- \(t = t + 1\). For all financial institutions, update \(E_{j,t} = E_{j, t - 1} - S_{j,t}\), \(IA_{j,t} = IA_{j, t - 1} - S_{j,t}\) and \(ZA_{j,t} = ZA_{j, t - 1} - S_{j,t}\). If institution \(j\) has been infected by bankrupt institution \(i\) and \(E_{j,t} < 0\), \(j\) goes bankrupt. Let \(j \in A_t = \{ j | E_{j,t} < 0 \textit{and} E_{j,t-1} \geq 0 \}\). The set of all bankrupt institutions is \(A_t = A_t \cup A_{t-1}\). If \(k_{jl} > 0\), compute \(IA^{\ast}_{j,t} = \sum_l k_{jl} IL_{l,t}\) and update \(IL_{l,t} = IL_{l,t} - k_{jl} IL_{l,t}\), \(ZA_{l,t} = ZA_{l,t} - k_{jl} IL_{l,t}\) and \(EA_{l,t} = EA_{l,t} - k_{jl} IL_{l,t}\). Compute \(IL_{j,t}^{\ast} = IA_{j,t}^{\ast} + EA_{j,t} - (S_{j,t} - E_{j,t-1}) - EL_{j,t}\). If \(IL^{\ast}_{j,t} < 0\), let \(IL_{j,t}^{\ast} = 0\). If \(y_{mj} > 0\), compute the loss \(S_{m,t+1} = \sum_j (y_{mj} \ast IA_{m,1} - k_{mj} \ast IL_{j,t}^{\ast})\) of institution \(j\)'s creditor \(m\). For all \(i\), let \(y_{ij}\) and \(y_{ji}\) in \(Y\) be 0;
- To (4) until \(t > T\) or the total loss of all institutions is 0, that is, \(\sum_{i=1}^{nn} S_{i,t+1}=0\). Compute the total loss \(SZ=\sum_{t=1}^{T+1}\sum_{i=1}^{nn}S_i,t\) caused by the initial bankrupt financial institution \(i\) and the contagious loss \(SS_1 = SZ - S_{i,1}\). Count the number of bankrupt institutions in \(A_t\).
- Since institution \(i\) goes bankrupt at \(t=1\), if \(h_{ji}>0\) the loss of its shareholders' equity \(S_{j,3}=E_{i,1}\ast h_{ji}\) recorded at \(t=3\) due to the lag of loss transmitted in cross-shareholding channel for one period. Let the ratio of cross-shareholding \(h_{ij}\) and \(h_{ji}\) be 0;
- \(t=t+1\). For all financial institutions, update \(E_{j,t}=E_{j,t-1}-S_{j,t}\), \(EA_{j,t}=EA_{j,t-1}-S_{j,t}\) and \(ZA_{j,t}=ZA_{j,t-1}-S_{j,t}\). If institution \(j\) has been infected at \(t-1\), there are two cases. One is that \(E_{j,t}<0\), and \(j\) goes bankrupt. Let \(j \in A_t = \{ j | E_{j,t} \textit{and} E_{j,t-1} \geq 0\}\). If \(h_{mj}>0\), calculate the losses \(S_{m,t+2}^1=\sum_{j\in A_t} E_{j,t-1} \ast h_{mj}\) of \(j\)'s shareholder \(m\). The other is that \(E_{j,t}\geq 0\), and \(j\) will not go bankrupt. If \(h_{mj}>0\), compute \(S_{m,t+2}^2=\sum_{j\nin A_t} S_{j,t} \ast h_{mj}\) . Therefore, the total loss of \(m\) in the \(t+2\) period is \(S_{m,t+2} = S_{m,t+2}^1 + S_{m,t+2}^2\). If \(j \in A_t\), let the ratio of cross-shareholding \(h_{mj}\) and \(h_{jm}\) in \(H\) be 0. The set of all bankrupt institutions is \(A_t = A_t \cup A_{t-1}\);
- To (7) until \(t>T\) or the total loss of all institutions both in the \(t\) and \(t+1\) are 0, which means \(\sum_{i=1}^{nn} S_{i,t} = 0\) and \(\sum_{i=1}^{nn}S_{i,t+1} = 0\). Calculate the total loss \(SZ = \sum_{t=1}^{T+2} \sum_{i=1}^{nn} S_{i,t}\) caused by the initial bankrupt financial institution \(i\) and the contagious loss is \(SS_2 = SZ - S_{i,1}\). Count the number of bankrupt institutions in \(A_t\).
- At \(t=1\), calculate bankrupt institution \(i\)'s interbank assets \(IA_{i,1}^{\ast}\) recovered from its debtors \(l\). Update \(IL_{l,1} = IL_{l,1} - k_{il} IL_{l,1}\), \(ZA_{l,1} = ZA_{l,1} - k_{il} IL_{l,1}\) and \(EA{l,1} = EA_{l,1} - k_{il} IL_{l,1}\). Calculate interbank liabilities \(IL_{i,1}^{\ast}\) that \(i\) can repay. If \(y_{ji}>0\), compute its creditor institution \(j\)'s loss \(S_{j,2}^1 = y_{ji} \ast IA_{j,1} - k_{ji} \ast IL_{i,1}^{\ast}\), which is recorded at \(t=2\). If \(h_{ji}>0\), compute the loss \(S_{j,3}^2=E_{i,1}\ast h_{ji}\) of institution \(j\) hold shares in \(i\), which is recorded at \(t=3\). Compute \(S_{j,2}=S_{j,2}^1\). Let \(y_{ji}\), \(y_{ij}\) in \(Y\) and the ratio of cross-shareholding \(h_{ij}\), \(h_{ji}\) in \(H\) be 0;
- \(t=t+1\). For all financial institutions, update \(E_{j,t}=E_{j,t-1}-S_{j,t}\), \(IA_{j,t}=IA_{j,t-1}-S_{j,t}^1\), \(EA_{j,t}=IA_{j,t-1}-S_{j,t}^2\) and \(ZA_{j,t}=ZA_{j,t-1}-S_{j,t}\). If institution \(j\) goes bankrupt in the \(t-1\) period, there is no need to calculate its loss in the cross-shareholding channel in \(t\) period even if institution \(j\) holds shares in some bankrupt institutions, so let \(S_{j,t}=0\);
- If institution \(j\) has been infected at \(t-1\) and \(E_{j,t}<0\), let \(j \in A_t\). In the interbank lending channel, if \(k_{jl}>0\), compute \(IA_{j,t}^{\ast}=\sum_l k_{jl}IL_{l,t}\). Update \(IL_{l,t} = IL_{l,t}-k_{il}IL_{l,t}\), \(ZA_{l,t} = ZA_{l,t}-k_{il}IL_{l,t}\) and \(EA_{l,t} = EA_{l,t}-k_{il}IL_{l,t}\). Compute \(IL_{j,t}^{\ast} = IA_{j,t}^{\ast}+EA_{j,t}-(S_{j,t}-E_{j,t-1})-EL_{j,t}\). If \(IL_{j,t}^{\ast}<0\), let \(IL_{j,t}^{\ast}=0\). If \(y_{mj}>0\), calculate \(S_{m,t+1}^1=\sum_{j\in A_t} (y_{mj} \ast IA_{m,1}-k_{mj}\ast IL_{j,t}^{\ast})\). In the cross-shareholding channel, if \(h_{mj}>0\), calculate \(S_{m,t+2}^2=\sum_{j\in A_t} E_{j,t}\ast h_{mj}\) and \(S_{m,t+1}=S_{m,t+1}^1+S_{m,t+1}^2\). Let \(A_t=A_t\cup A_{t-1}\), \(y_{mj}\) and \(y_{jm}\) in \(Y\) and \(h_{jm}\) and \(h_{mj}\) be 0. To (13);
- If institution \(j\) has been infected \(t-1\) at and the institution \(j\) is not bankrupt at \(t-1\), that is, \(S_{j,t}>0\) and \(E_{j,t-1}>0\), \(j\) will only transmit losses to \(m\) with \(h_{mj}>0\) through the cross-shareholding channel. If \(h_{mj}>0\), compute the loss \(S_{m,t+2}=\sum_{j\nin A_t} S_{j,t}\ast h_{mj}\) and \(S_{m,t+1}=S_{m,t+1}^2\);
- To (10) until \(t>T\) or \(\sum_{i=1}^{nn} S_{i,t}=0\) and \(\sum_{i=1}^{nn} S_{i,t+1}=0\). Calculate the total loss \(SZ=\sum_{t=1}^{T+1}\sum_{i=1}^{nn}S_{i,T+2}^2\), caused by the initial bankrupt financial institution \(i\), the contagious loss \(SS=SZ-S_{i,1}\) and the excess of loss \(SC=SS-SS_1-SS_"\). Count the number of bankrupt institutions in \(A_t\).
Analysis of systemic risk
The influence of the asset loss rate and loss given default on the losses
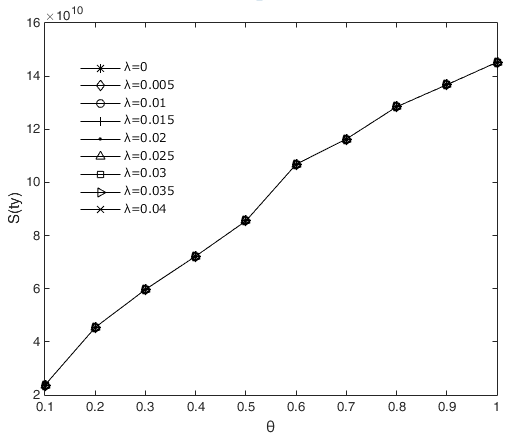
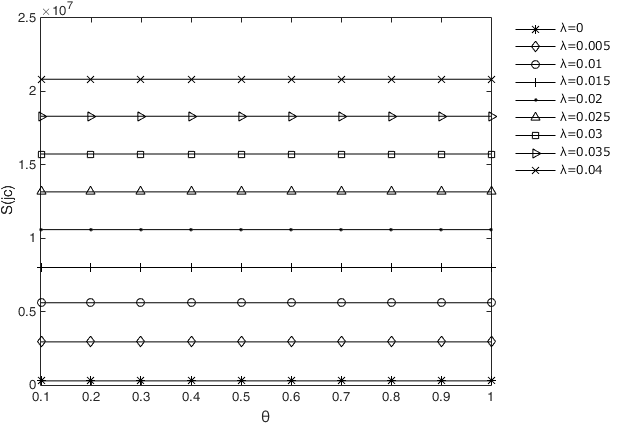
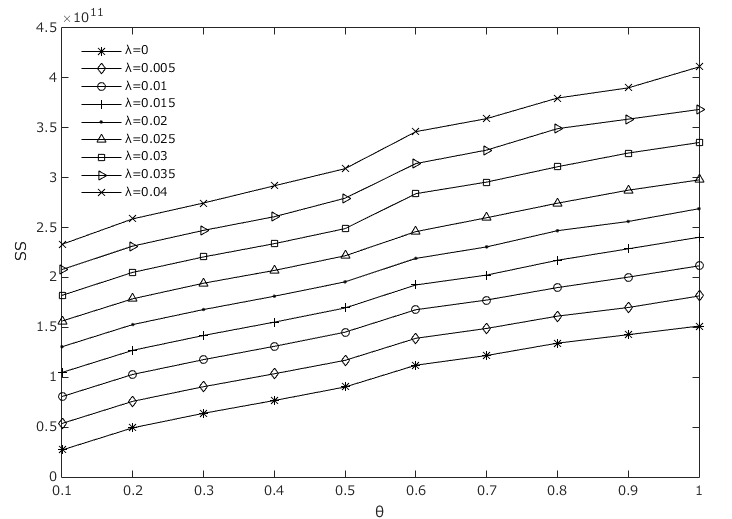
Figures 6 and Figure 7 show the losses from risk contagion separately in the interbank lending channel and cross-shareholding channel, respectively, under different asset loss rates and losses given default. In these two figures, we can see that the increase in loss given default \(\theta\) will increase the contagious losses in the interbank lending channel \(S(ty)\) but has very little effect on the contagious losses in the cross-shareholding channel \(S(jc)\). However, the asset loss rate \(\lambda\) will not affect \(S(ty)\) but will have a positive correlation with \(S(jc)\). This is because when the loss given default \(\theta\) increases, the interbank liabilities that the first insolvent institution cannot repay will also increase, while its lost equity will not change. However, the unrepayable interbank liabilities remain unchanged if the asset loss rate \(\lambda\) increases, but the equity of all institutions will be reduced, which leads to greater bankruptcy risk and more losses. We already know that the interbank liability losses are transmitted through the interbank business channel, while the owner's equity losses are transmitted through the cross-shareholding channel. For this reason, the asset loss rate \(\lambda\) and loss given default \(\theta\) have different impacts on the contagious losses in the interbank business channel. Figure 8 shows that both \(\lambda\) and \(\theta\) have a positive effect on \(SS\). Obviously, our numerical results are consistent with those in Figure 8 shows that both \(\lambda\) and \(\theta\) have a positive effect on \(SS\). Obviously, our numerical results are consistent with those in Figure 6 and 7.
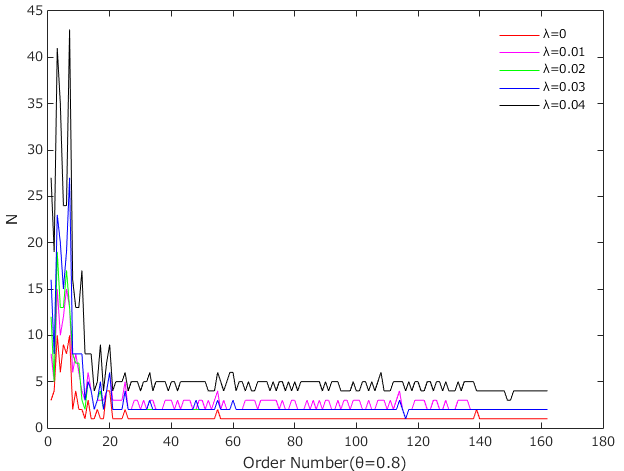
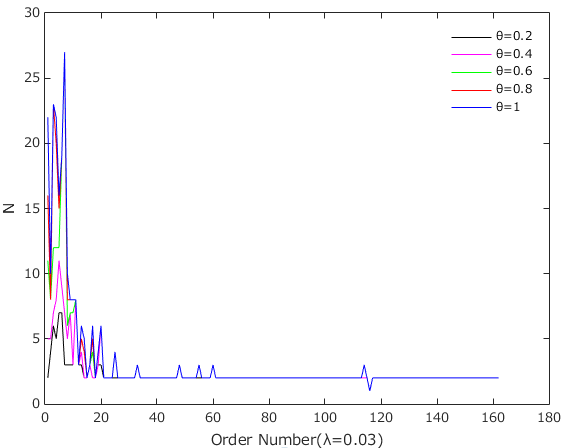
The influence of the asset loss rate and the loss given default on the number of failed institutions
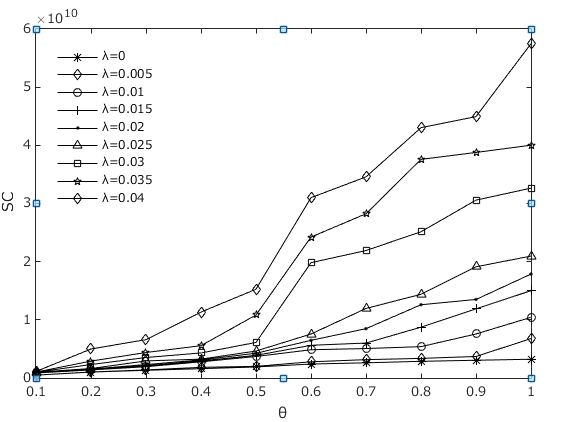
The ability of financial institutions to withstand risks in different market environments may vary. To understand the impact of different asset loss rates and losses given default on the ability of financial institutions to withstand risks, we analysed the impact of the asset loss rate and the loss given default on the number of insolvencies under risk contagion in a double-layer network. Figure 9 shows that when \(\lambda\) increases, the number of bankruptcies increases. This implies that the worse the market environment is, the greater the tendency for institutions to become bankrupt. Similarly, we found that when \(\theta\) increases, the number of bankruptcies also increases (Figure 10). More precisely, the decrease in the volume of total assets and equity of financial institutions is clearly associated with the increase in the asset loss rate, while a higher value of \(\theta\) indicates that the relevant institutions can recover fewer interbank assets and have less equity. Both of these factors can weaken financial institutions’ ability to withstand risks and make them more vulnerable to bankruptcy.
The influence of total assets, interbank assets and interbank liabilities on contagious losses
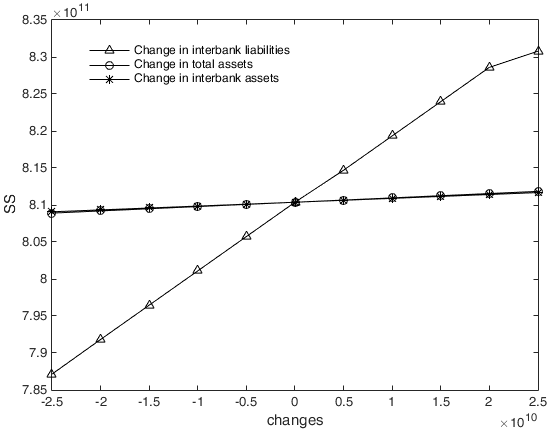
For each repetition, we randomly selected one financial institution from the 162 sample institutions and analysed the contagious losses when it goes bankrupt under different initial conditions. After 10 repetitions, we calculated the average of the contagious losses in 10 experiments, which are shown as the ordinates in Figures 11-13. Abscissas represent the changes in total assets, interbank assets and interbank liabilities.
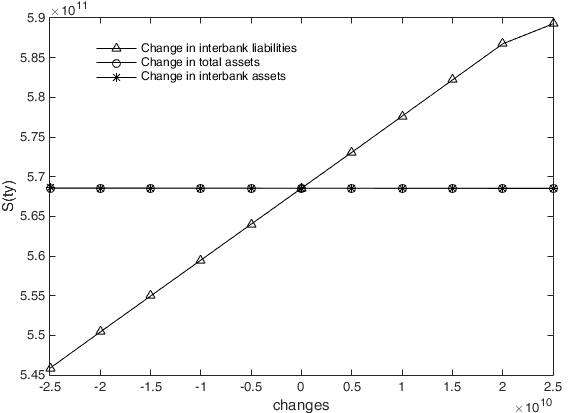
Figure 11 shows that when the risk spreads in an interbank business network, there is a significantly positive impact of the first bankrupt institution's interbank liabilities on \(S(ty)\), that is, a higher interbank liability implies more contagious losses in the interbank business channel. It can also be found that \(S(ty)\) is not affected by total assets. The reason for this conclusion is that a change in the total assets of the institution does not change the interbank business transactions, and thus, \(S(ty)\) is unchanged, whereas additional increases in interbank liabilities add to the interbank liabilities that the failed bank cannot repay. It is worth noting that when the initial bankrupt institution's interbank assets increase, \(S(ty)\) will decrease slightly, but as the figure shows, this is very slight compared to the impact of interbank liabilities on \(S(ty)\). Increases in the interbank assets that the initial failed institution can recover from the debtor institutions are strongly associated with the expansion of interbank assets, which allows the failed institution to repay more interbank liabilities; this is precisely the reason for the reduction in \(S(ty)\).
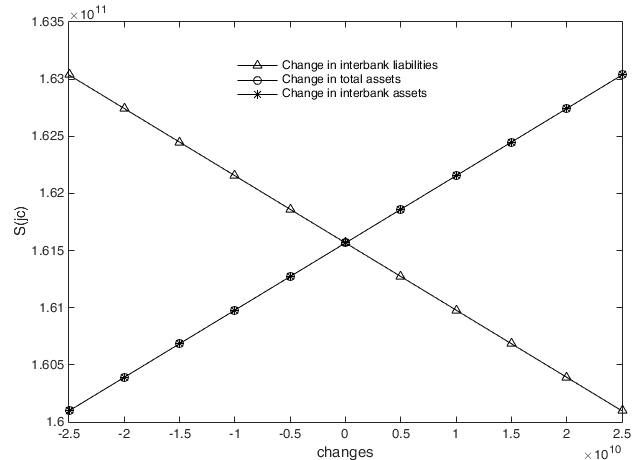
However, when the first bankrupt institution’s interbank assets, interbank liabilities and total assets change, the loss caused by risk transmission in the cross-shareholding channel is obviously different from that caused in the interbank lending channel. As shown in Figure 12, both the total assets and the interbank assets of the first bankrupt institution have the same positive effect on \(S(jc)\). In contrast, the interbank liabilities of the first bankrupt institution have a significant negative effect on \(S(jc)\). The reason is that an equal increase in total assets and interbank assets leads the equity of the first failed institution to increase by the same amount, which in turn leads to the same contagious loss as that expressed in \(S(jc)\). However, greater interbank liabilities mean that lower equity for the first failed institution leads to a decreased loss through \(S(jc)\).
Regarding contagious losses transmitted through the double-layer network under different levels of total assets, interbank assets and interbank liabilities, Figure 13 shows that they are positively correlated with total assets, interbank assets and interbank liabilities of the initial institution. However, it is clear that the impact of the first insolvent institution’s interbank liabilities on contagious losses is more significant, indicating that interbank liabilities are the main factor affecting systemic risk and that the interbank business channel is the main risk contagion channel of systemic risk, while the influence of the cross-shareholding channel on financial systemic risk is relatively small.
Nonlinear evolution of risk
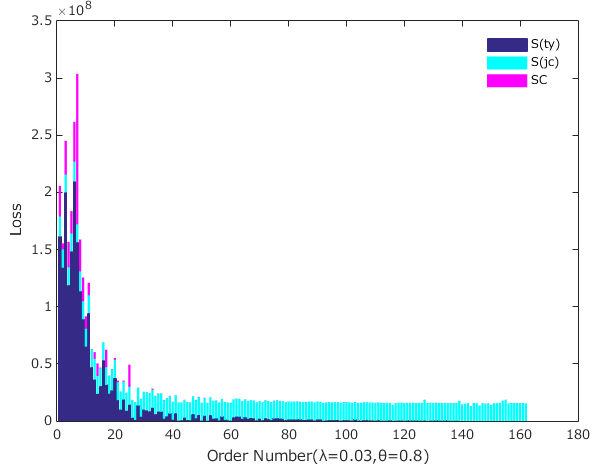
For the convenience of analysis, we only analysed losses in a scenario with \(\lambda=0.03\) and \(\theta=0.8\). Figure 14 shows a comparison of \(SS\), \(S(ty)\) and \(S(jc)\). When institution \(i\) goes bankrupt, \(SS\) is larger than the sum of \(S_i(ty)\) and \(S_i(jc)\), namely, \(SS-S_i(ty)-S_i(cg)>0\), indicating that the infection and the evolution process of risk are nonlinear: focusing only on a single risk contagion channel but ignoring the mutual enhancement effect across two risk contagion channels will lead to an underestimation of systemic risk. This conclusion is similar to the one reached by Poledna et al. (2015). However, we can claim that in the current stage of China's financial system, contagious losses of the interbank business channel account for a large portion of losses of the entire financial system, while the contagious losses of the cross-shareholding channels and excess losses are very small.
Indeed, the nonlinear evolutionary mechanism of risk is manifested by the mutual enhancement effect of the losses propagated among multiple risk channels. There are two main reasons for the nonlinear evolution of risk. On the one hand, when the financial institutions in the double-layer network have been exposed to the risk of the interbank business channel, they will suffer equity losses. Then, this portion of their losses will be transmitted to the cross-shareholding network and continue to spread through that network. Thus, the losses caused by risk contagion in the cross-shareholding network can be enlarged. On the other hand, because of the risk contagion of the cross-shareholding channel, some institutions that did not go bankrupt due to the interbank business channel now go bankrupt. Thus, contagious losses are amplified by bankrupt institutions and continuously transmitted through the interbank business channel. In other words, the mutual enhancement effect of risk contagion among multiple channels is the cause of excess losses in the multilayer network and is also the reason for the nonlinear evolution of risk in the multilayer network.
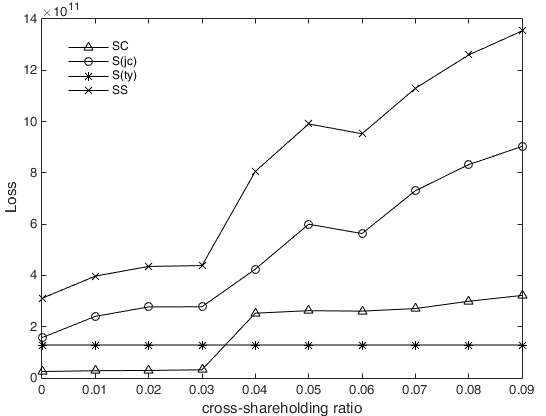
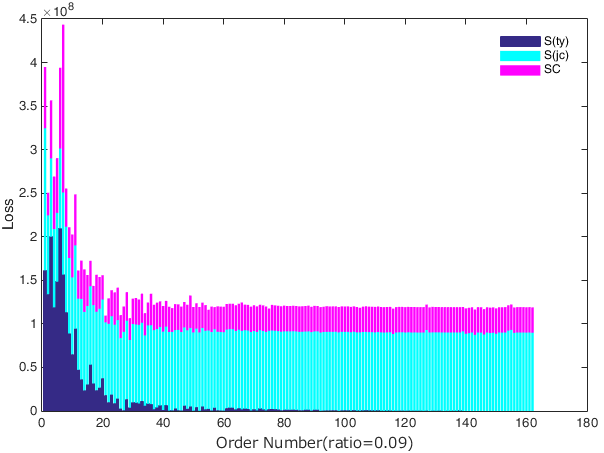
At China’s present stage, the relatively scarce cross-shareholding links among financial institutions may be the reason that the risk contagion of cross-shareholding channels has little impact on contagious losses. To verify this hypothesis, we randomly selected 10 institutions and increased the connections among these institutions; that is, we increased the links of the cross-shareholding network. The probability that a cross-shareholding link exists between institutions is related to the assets of the two institutions. Assume that the scope of the cross-shareholding ratio of newly added links is between 0.01 and 0.09. Through simulation, we find that with the increase in the cross-shareholding ratio, the losses through the cross-shareholding channel increase significantly, as well as the contagious losses in the double-layer network and the excess losses (Figure 15). We further compare the contagious losses in different channels and the excess loss in the double-layer network with a cross-shareholding ratio of 0.09 (Figure 16). Compared to Figure 14, we found that the proportion of excess loss and cross-shareholding channel loss is significantly increased. Therefore, it is probable that if linkages between financial institutions are increased and strengthened in the Chinese financial system, the nonlinear evolutionary effect of risk contagion will be enhanced, increasing its threat to the stability of the financial system.
The influence of the asset loss rate and the loss given default on excess losses
Figure 17 compares the excess losses under different asset loss rates and the losses given default. Results showed that \(SC\) is positively related to the asset loss rate and the loss given default. As one would expect, on the one hand, higher losses given default tend to mean that the first bankrupt institution cannot repay more of its interbank liabilities to the relevant institutions. In this way, the losses experienced by related institutions increase, and they may be more likely to go bankrupt, causing an increase in \(S(ty)\). Because contagious losses spreading throughout the interbank business channel account for a large portion of losses in the whole system, even the effect of risk contagion in the interbank business channel on the one in the cross-shareholding channel is enhanced. On the other hand, a higher asset loss rate tends to lower the equity of all institutions and thereby their ability to withstand risk. Therefore, financial institutions are more likely to go bankrupt. This, in turn, leads to the increase in contagious losses in each single-layer network and strengthens the mutual enhancement effect.
The influence of total assets, interbank assets and interbank liabilities on excess losses
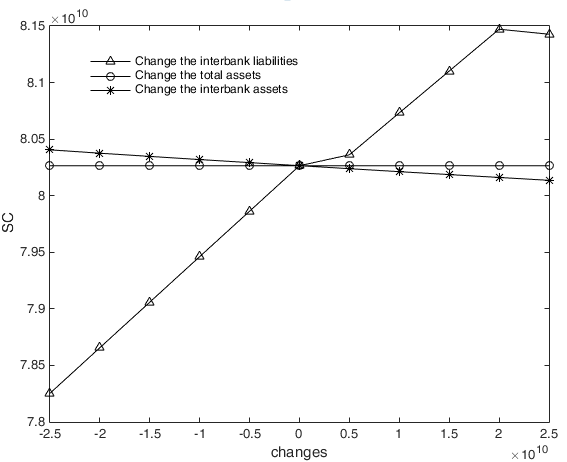
For increasing levels of total assets, interbank assets and interbank liabilities, Figure 18 shows that interbank liabilities and interbank assets have different effects on excess losses; that is, an increase in interbank liabilities has an increasing effect on excess losses, while interbank assets have a decreasing effect on excess losses. In addition, we can easily find that total assets have no effect on excess losses. All these findings are consistent with the effects of interbank liabilities, interbank assets and total assets on \(S(ty)\), as shown in Figure 11, indicating that the mutual enhancement effect between channels is mainly influenced by the interbank business channel in China’s financial system. The interbank business channel is the main risk contagion channel affecting the nonlinear evolution effect of financial risk.
Summary and Conclusion
In this paper, we built a double-layer network and investigated the contagion mechanism of China’s financial systemic risk. By analysing the data on transactions among financial institutions, we found two main risk contagion channels and so we decided to model these two channels using a double-layer network. This new network model allowed us to understand interactions among various risk contagion channels more comprehensively and accurately than what we could achieve by considering only a single-layer network model. Our simulations compared the contagious losses in the double-layer network with those in the interbank lending network and cross-shareholding network separately.
Our results indicated that the sum of contagious losses both in the interbank and in the cross-shareholding network is smaller than that in the double-layer network. This means that there is a nonlinear evolutionary effect of risk contagion. Secondly, we found that in the case of China’s financial system the mutual enhancement effect of these two risk contagion channels could be not obvious in the current situation, while the interbank lending channel is the main channel affecting the mutual enhancement effect. However, we expect that the cross-shareholding channel will become an important channel for contagious loss if the linkages in the cross-shareholding channel are strengthened in the future.
Our findings suggest China’s financial risk regulators to try to manage all risk contagious channels in an integrated way. This would avoid underestimating these risks. Specifically, considering that the interbank lending channel is a crucial channel that greatly affects the mutual enhancement effect, we suggest regulators to focus on monitoring the risk of the interbank lending market.
Furthermore, with regard to the issue of influencing factors, we showed that the asset loss rate, loss given default, total assets, interbank assets and interbank liabilities might have a positive impact on contagious losses. Mainly through the interbank business channel, we expect that the number of bankruptcies caused by risk contagion could increase significantly with the asset loss rate and loss given default. Note that compared with total assets and interbank assets, interbank liabilities are the main factor affecting the losses through financial risk contagion.
In this respect, we suggest regulators to strengthen the assessment of interbank risk exposure and control credit risk to reduce default losses. During financial market depression, only effective measures can avoid the further deterioration of the market and decrease the asset loss rate of financial institutions. Second, to minimize the losses caused by superimposed risk contagion, we suggest regulators to limit the size of financial institutions as well as the interbank liabilities.
Finally, this study has certain limitations. Our findings are based on a double-layer network model describing two main risk contagion channels, i.e., interbank lending and cross-shareholding. As mentioned in Section 3, in China's financial market, other network structures between financial institutions besides the two considered in our model might have an effect on these risks. This makes the relationship between institutions more complex and risk contagion channels more diversified. It is probable that by considering only interbank lending and cross-shareholding channels, we have underestimated the possible sources of systemic risk. On the other hand, the factors related to these risk contagion channels may also be the same ones affecting systemic risk. To fill this gap, in future work, we will establish a multi-level network to reflect the characteristics of risk contagion channels in China's financial market in more detail.
Acknowledgements
This research is supported by National Natural Science Foundation of China (Nos. 71301047, Nos. 71850012).Model Documentation
The model was programmed using Matlab R2014b and the code is available at https://www.comses.net/codebases/106f8802-a5a6-4bda-bde3-bfa315e8edc3/releases/1.0.0/.Notes
- The Free Dictionary. Farlex, Inc. Retrieved 29 September 2014.
- According to the Wind database, there were 232.26 trillion yuan in total assets of banking financial institutions in 2016 and 7.93 trillion yuan in nonbanking financial institutions. The total assets of the banking system accounted for 96.7% of the total assets of financial institutions.
- Ji et al. (2014) build an interbank lending network based on the assumption that the probability of the loan relationship between two banks is positively correlated with the size of their assets.
Appendix
Appendix A
| Order Number | Name | Total Assets | Total Liabilities | Interbank Assets | Interbank Liabilities |
| 1 | Industrial and Commercial Bank of China | 2413726500.00 | 2215610200.00 | 79747300.00 | 201679900.00 |
| 2 | Bank of China | 1814888900.00 | 1666179700.00 | 116486800.00 | 160694400.00 |
| 3 | China construction bank | 2096370500.00 | 1937405100.00 | 75528800.00 | 193554100.00 |
| 4 | Agricultural Bank | 1957006100.00 | 1824847000.00 | 120361400.00 | 145806500.00 |
| 5 | Bank of Communications | 840316600.00 | 777075900.00 | 64774400.00 | 160825400.00 |
| 6 | Industrial Bank | 608589500.00 | 573148500.00 | 7305700.00 | 185101200.00 |
| 7 | Pufa Bank | 585726300.00 | 548432900.00 | 35311500.00 | 143909500.00 |
| 8 | Minsheng Bank | 589587700.00 | 554385000.00 | 37129100.00 | 140801900.00 |
| 9 | China Citic Bank | 593105000.00 | 554655400.00 | 37584900.00 | 106516900.00 |
| 10 | China Merchants Bank | 594231100.00 | 553894900.00 | 58196300.00 | 80448300.00 |
| 11 | Everbright Bank | 402004200.00 | 376897400.00 | 35893500.00 | 92585500.00 |
| 12 | China Import and Export Bank | 333434983.60 | 302014438.20 | 34434217.92 | 47181637.62 |
| 13 | Ping An Bank | 295343400.00 | 275126300.00 | 26433200.00 | 44493700.00 |
| 14 | Postal savings bank | 826562200.00 | 791873400.00 | 36906300.00 | 29584500.00 |
| 15 | Bank of Beijing | 211633900.00 | 197256000.00 | 28331500.00 | 38087900.00 |
| 16 | China Guangfa Bank | 204759172.00 | 194161764.70 | 5029891.00 | 52317679.30 |
| 17 | Zhejiang Merchants Bank | 135485451.90 | 128737914.10 | 9844212.90 | 39410882.10 |
| 18 | Huaxia Bank | 235623500.00 | 220326200.00 | 14964800.00 | 29826300.00 |
| 19 | Bank of Shanghai | 175537110.20 | 163915248.80 | 11567064.00 | 33138661.40 |
| 20 | Bank of Jiangsu | 159829244.60 | 151408548.00 | 8624782.20 | 34729385.10 |
| 21 | Shengjing Bank | 90548264.70 | 85910802.10 | 11192790.00 | 18231943.10 |
| 22 | Chongqing Rural Commercial Bank | 80315773.20 | 74896789.50 | 14715415.60 | 12503801.90 |
| 23 | Bohai Bank | 85611967.80 | 81465631.10 | 663251.20 | 18745145.50 |
| 24 | Chengdu Rural Commercial Bank | 67314945.30 | 63690749.90 | 9703564.40 | 8887838.00 |
| 25 | Bank of Tianjin | 65731010.70 | 61555532.70 | 3989798.60 | 13788332.00 |
| 26 | Beijing Rural Commercial Bank | 72416915.90 | 68418463.80 | 14470297.40 | 2731893.50 |
| 27 | Huarong Asset Management | 141196929.70 | 126188829.70 | 15923223.10 | 1124104.10 |
| 28 | Bank of Jinzhou | 53905952.20 | 49616521.00 | 867363.30 | 13489497.40 |
| 29 | XinDa asset management | 117448092.30 | 102651090.20 | 10207884.80 | 3688597.30 |
| 30 | Huishang Bank | 75477399.40 | 70159067.60 | 3028031.80 | 9856838.70 |
| 31 | Harbin Bank | 53901622.10 | 50168118.70 | 3400006.40 | 9289576.70 |
| 32 | Baoshang Bank | 43158252.00 | 40178253.50 | 3409369.10 | 8580959.40 |
| 33 | EVERGROWING BANK | 120851942.63 | 114517631.71 | 533888.62 | 11440438.76 |
| 34 | Bank of ChongQing | 37310373.40 | 34929182.20 | 5570635.20 | 6035078.50 |
| 35 | Bank of Guangzhou | 44450724.02 | 42283534.31 | 167418.41 | 10285369.46 |
| 36 | Bank of Ningbo | 88502041.10 | 83463429.80 | 2373044.30 | 7941689.80 |
| 37 | CITIC Securities | 59743883.92 | 45165016.95 | 6502119.33 | 1955000.00 |
| 38 | Shanghai Rural Commercial Bank | 71088055.80 | 66318689.30 | 4350148.50 | 3996277.50 |
| 39 | Xiamen International Bank | 56352707.06 | 52353657.14 | 1868447.59 | 6372503.38 |
| 40 | Bank of Quanzhou | 9055009.03 | 8533243.09 | 6757036.69 | 1395155.32 |
| 41 | Bank of DaLian | 30556778.00 | 28254280.90 | 1320366.50 | 6789987.80 |
| 42 | Guotai Junan Securities | 41174904.17 | 30099731.99 | 6889278.54 | 470000.00 |
| 43 | Haitong Securities | 56086584.62 | 43890744.48 | 6391876.79 | 880946.17 |
| 44 | Guangzhou Rural Commercial Bank | 66095111.50 | 62311141.20 | 3676169.40 | 3537925.30 |
| 45 | Guangfa Securities | 35980135.34 | 27844801.75 | 5900129.50 | 1060639.48 |
| 46 | Huatai Securities | 40145039.76 | 31579020.11 | 5660510.39 | 665000.00 |
| 47 | BMW Automotive Finance (China) | 8671889.45 | 7946311.80 | 100000.00 | 5964900.00 |
| 48 | Bank of Hangzhou | 72042417.60 | 68186248.10 | 3520515.80 | 2451157.20 |
| 49 | Bank of Qingdao | 27798810.60 | 26035213.30 | 704103.70 | 5194383.90 |
| 50 | Shenwan Hongyuan Group | 27548926.26 | 22141602.17 | 5586907.59 | 300000.00 |
| 51 | Bank of Zhengzhou | 36614797.20 | 34428659.70 | 1317314.30 | 4491386.40 |
| 52 | China Merchants Securities | 24305842.75 | 18314338.88 | 5335153.78 | 150000.00 |
| 53 | Bank of Longjiang | 24436174.60 | 23030032.40 | 182068.80 | 5215222.80 |
| 54 | Mizuho China | 10849666.26 | 9518993.30 | 3198987.28 | 1999489.87 |
| 55 | Bank of Qinghai | 10828610.20 | 10211111.87 | 2858328.69 | 2232893.74 |
| 56 | Bank of Chengdu | 36094675.70 | 33896299.40 | 4227367.20 | 700987.30 |
| 57 | Jiangnan agricultural firm | 27456194.54 | 25909219.67 | 1096287.64 | 3579085.38 |
| 58 | Everbright Securities | 17763725.87 | 12900059.58 | 3742774.39 | 910756.00 |
| 59 | Bank of Hebei | 19147129.70 | 17774815.10 | 3773380.80 | 768823.10 |
| 60 | Guoxin Securities | 19302946.43 | 14458480.57 | 4015445.43 | 450000.00 |
| 61 | Panzhihua Commercial Bank | 7853893.30 | 7328444.37 | 962490.55 | 3323944.92 |
| 62 | Dongguan agricultural firm | 34768782.00 | 32326351.00 | 479396.00 | 3789377.00 |
| 63 | Micro public bank | 5199549.17 | 4529180.41 | 361677.25 | 3738727.24 |
| 64 | Jiutai Rural Commercial BanK | 31042711.90 | 29245636.30 | 1354705.20 | 2257620.20 |
| 65 | Zhejiang Wenling Agricultural and Commercial Bank | 3260794.17 | 2848120.88 | 282644.00 | 3177300.05 |
| 66 | Leshan Commercial Bank | 10330110.30 | 9720905.90 | 1502189.20 | 1843361.80 |
| 67 | Nanyue bank | 20385970.80 | 19066114.40 | 565755.00 | 2569833.00 |
| 68 | National Development Bank | 14340500.00 | 13177780.00 | 849516.00 | 2277884.00 |
| 69 | Essence Securities | 11660772.27 | 9504650.27 | 2343678.88 | 710000.00 |
| 70 | BanK Of Guiyang | 37225319.40 | 35025348.60 | 558556.40 | 2269359.90 |
| 71 | Bank of Xi'an | 21796804.74 | 20199625.74 | 1873751.03 | 951041.64 |
| 72 | Shaanxi Agricultural and Commercial Bank of Qinnong | 11480167.61 | 10359209.37 | 231462.31 | 2566863.66 |
| 73 | Ningxia Yellow River Agricultural and Commercial Bank | 5317049.09 | 4837868.97 | 970735.22 | 1731825.58 |
| 74 | Shenzhen Rural Commercial Bank | 23605360.09 | 21466819.47 | 1683834.81 | 924094.00 |
| 75 | Yaodu agricultural firm | 7802192.56 | 7219404.64 | 543102.36 | 2063400.00 |
| 76 | Lucheng Agricultural and Commercial Bank, Wenzhou, Zhejiang | 3855320.80 | 3539799.49 | 244820.28 | 2266886.43 |
| 77 | Bank of Jincheng | 8678338.77 | 8134847.77 | 551863.18 | 1946312.43 |
| 78 | Tai'an Commercial Bank | 6300478.03 | 6004050.65 | 624021.41 | 1626954.39 |
| 79 | Fubon Bank | 6815410.76 | 6286826.28 | 1386089.42 | 857387.83 |
| 80 | Huarun Bank of Zhuhai | 137209277.48 | 12762328.70 | 546982.95 | 1625928.54 |
| 81 | Bank of Luoyang | 18300287.50 | 16904813.00 | 492797.50 | 1593126.70 |
| 82 | fudian bank | 19845299.90 | 18401396.10 | 398256.70 | 1632409.30 |
| 83 | Bank of Fuxin | 14864608.56 | 13895617.85 | 566953.42 | 1450537.25 |
| 84 | Chongqing Three Gorges bank | 18150354.06 | 16924100.72 | 544935.55 | 1469763.88 |
| 85 | Jiangsu Zijin Agricultural and Commercial Company | 13380276.86 | 12448868.27 | 1173844.83 | 834120.34 |
| 86 | Bank of Hubei | 18661016.54 | 17473170.40 | 873403.05 | 1084749.89 |
| 87 | Bank of Dandong | 7237375.31 | 6721052.45 | 684219.69 | 1238380.69 |
| 88 | Bank of Dongguan | 23208811.17 | 21549541.93 | 523045.08 | 1353552.65 |
| 89 | Xiamen agricultural firm | 11314621.73 | 10522688.31 | 1306399.16 | 482418.81 |
| 90 | Chery Huiyin Automotive Finance | 2250015.83 | 1980615.81 | 32911.12 | 1697720.46 |
| 91 | Bank of Jiujiang | 22526255.30 | 21166424.20 | 390845.20 | 1266899.00 |
| 92 | industrial securities | 13653482.47 | 10223677.40 | 1552148.19 | 100000.00 |
| 93 | Orient Securities | 21241108.74 | 17147326.20 | 1065158.56 | 510000.00 |
| 94 | Huarong Xiangjiang bank | 26018564.10 | 24574044.60 | 644206.90 | 913343.70 |
| 95 | Foshan agricultural firm | 7571137.90 | 7034833.25 | 616615.39 | 928867.23 |
| 96 | Bank of Handan | 14620374.39 | 13841032.94 | 673232.93 | 795027.92 |
| 97 | Bank of Wuhai | 4450342.40 | 4085539.93 | 408168.35 | 1049496.70 |
| 98 | Bank of Qinhuangdao | 5074671.26 | 4823274.66 | 1168174.71 | 232084.69 |
| 99 | Bank of Chengde | 9294725.49 | 8840552.82 | 564170.02 | 780263.25 |
| 100 | Shanghai Huarui bank | 3098349.97 | 2784587.08 | 462378.66 | 803191.67 |
| 101 | Nanhai agricultural firm | 15689920.34 | 14405850.48 | 376400.00 | 852066.33 |
| 102 | Zhongshan agricultural firm | 8671380.60 | 8037691.77 | 857647.62 | 358001.01 |
| 103 | Bank of Urumqi | 13068374.56 | 11903662.32 | 108355.54 | 1094910.25 |
| 104 | Pangu China | 1560791.48 | 1104425.16 | 860393.24 | 279167.17 |
| 105 | Dongxing Securities | 7263341.52 | 5427833.92 | 957590.26 | 155000.00 |
| 106 | Yantai Bank | 7017123.10 | 6508934.90 | 476298.70 | 628044.50 |
| 107 | Guangdong Huaxing bank | 12286773.65 | 11668752.50 | 174435.28 | 824979.24 |
| 108 | Guizhou Huaxi Agricultural and Commercial Bank | 2063590.64 | 1957083.81 | 306233.91 | 643262.68 |
| 109 | Bank of Yingkou | 12682922.26 | 11625191.14 | 337025.47 | 609222.14 |
| 110 | Shanxi Securities | 4805767.81 | 3502776.88 | 538000.46 | 300000.00 |
| 111 | Bozhou Pharmaceutical Capital Agricultural and Commercial Company | 4186392.63 | 3932977.65 | 55789.30 | 776615.22 |
| 112 | Haian Agricultural and Commercial Bank of Jiangsu Province | 5081657.79 | 4684952.40 | 626187.23 | 176660.70 |
| 113 | Northeast Securities | 7515701.34 | 5855649.63 | 771223.90 | 9000.00 |
| 114 | Wuxi Rural Commercial Bank | 12463266.60 | 11575995.90 | 545584.30 | 150691.90 |
| 115 | China International Capital Corporation | 10194849.13 | 8345173.31 | 304517.74 | 352851.65 |
| 116 | Wujiang agricultural firm | 8134835.50 | 7346957.00 | 597412.00 | 51857.20 |
| 117 | Bank of Tibet | 4849848.37 | 4275838.82 | 484695.74 | 115117.16 |
| 118 | Bank of Ganzhou | 10682295.38 | 10042063.54 | 195491.92 | 372100.35 |
| 119 | Bank of Shizuishan | 5120098.19 | 4692963.25 | 91071.61 | 431892.67 |
| 120 | Zhangjiagang agricultural firm | 9017817.94 | 8272937.15 | 404584.16 | 112317.91 |
| 121 | Wenzhou Longwan Agricultural and Commercial Bank | 3196603.51 | 2905417.65 | 155647.68 | 346992.03 |
| 122 | Straits Bank of Fujian | 15460926.54 | 1468568.76 | 339141.26 | 137598.61 |
| 123 | Taicang agricultural firm | 3627716.89 | 3350067.16 | 370500.79 | 97219.96 |
| 124 | Kunshan agricultural firm | 8214890.54 | 7741308.77 | 337397.09 | 110159.09 |
| 125 | Anhui Tongcheng Agricultural and Commercial Bank | 2582256.78 | 2379880.60 | 316495.33 | 111367.70 |
| 126 | Capital Securities | 1921150.95 | 1552151.09 | 344545.14 | 75000.00 |
| 127 | Bank of Jining | 5697829.35 | 529557.70 | 59471.76 | 323363.74 |
| 128 | HanKou Bank | 21166654.00 | 19480163.50 | 242398.40 | 101606.60 |
| 129 | Zhejiang Deqing Agricultural and Commercial Bank | 2874244.62 | 2587872.76 | 140527.37 | 185146.80 |
| 130 | Chaoyang bank | 6441635.26 | 6019399.73 | 29888.23 | 232557.44 |
| 131 | Bank of Huludao | 5921342.83 | 5375988.02 | 6931.20 | 241847.69 |
| 132 | Qinghai Xining Agricultural and Commercial Bank | 2273428.43 | 2028522.03 | 101107.50 | 96036.17 |
| 133 | Ningxiang Agricultural and Commercial Bank of Hunan Province | 2638704.49 | 2469752.16 | 176090.30 | 5393.06 |
| 134 | Chizhou Jiuhua Agricultural Commercial Bank | 1580430.27 | 1454964.76 | 73211.71 | 75000.00 |
| 135 | Pro bank | 7400831.66 | 6779981.42 | 56150.78 | 83779.08 |
| 136 | Sheyang Agricultural and Commercial Bank of Jiangsu Province | 2764060.09 | 2575027.76 | 97984.65 | 20000.00 |
| 137 | Quzhou Kecheng Agricultural and Commercial Bank | 1557360.27 | 1467009.50 | 75669.85 | 35522.19 |
| 138 | Bank of Zaozhuang | 2022498.49 | 1438116.55 | 6911.21 | 100997.93 |
| 139 | People’s Life Insurance Company of China | 269695100.00 | 238930300.00 | 0.00 | 0.00 |
| 140 | Ping An Life Insurance | 185861785.09 | 55916769.16 | 0.00 | 0.00 |
| 141 | Anbang Life Insurance | 145256063.56 | 136999471.57 | 0.00 | 0.00 |
| 142 | CCB Trust | 130619640.08 | 805690.21 | 0.00 | 0.00 |
| 143 | People's Insurance Company of China | 93214900.00 | 76115500.00 | 0.00 | 0.00 |
| 144 | China Industrial International Trust | 92201673.37 | 365685.93 | 0.00 | 0.00 |
| 145 | China Pacific Insurance | 85160713.20 | 78479856.10 | 0.00 | 0.00 |
| 146 | An-Bang Property Insurance | 79545201.95 | 71213143.44 | 0.00 | 0.00 |
| 147 | Xinhua Life Insurance | 69918100.00 | 64005600.00 | 0.00 | 0.00 |
| 148 | Sino Life Insurance | 45589681.63 | 42364849.41 | 0.00 | 0.00 |
| 149 | Huaxia Life | 39146328.29 | 37366750.49 | 0.00 | 0.00 |
| 150 | PICC LIFE | 37551291.31 | 34244962.36 | 0.00 | 0.00 |
| 151 | Taiping Life Insurance | 35706295.65 | 32726206.03 | 0.00 | 0.00 |
| 152 | Tianan Property and Casualty | 30258440.02 | 27056504.37 | 0.00 | 0.00 |
| 153 | China Galaxy Securities | 24588052.10 | 18752662.13 | 0.00 | 0.00 |
| 154 | Founder Securities | 15233873.02 | 11614188.58 | 0.00 | 0.00 |
| 155 | Ping An Trust | 13033111.38 | 8164965.74 | 0.00 | 0.00 |
| 156 | Tianan Life Insurance | 10131598.00 | 8832906.00 | 0.00 | 0.00 |
| 157 | Soochow Securities | 8947670.17 | 6898748.28 | 0.00 | 0.00 |
| 158 | Jiangsu Qidong Agricultural and Commercial Bank | 4422465.87 | 4187792.67 | 0.00 | 0.00 |
| 159 | Pacific Securities | 4036469.71 | 2777043.64 | 0.00 | 0.00 |
| 160 | Chongqing International Trust | 2596294.70 | 729961.62 | 0.00 | 0.00 |
| 161 | Xiangcai securities | 2542707.25 | 1950453.01 | 0.00 | 0.00 |
| 162 | Anxin trust | 1912569.51 | 540752.85 | 0.00 | 0.00 |
Appendix B

Appendix C
- When losses transmit singly through the interbank lending channel
- When losses transmit singly through the cross-shareholding channel
- When losses transmit through both the interbank lending channel and cross-shareholding channel
References
ALLEN, F., Gale, D. (2000). Financial contagion. Journal of Political Economy, 108(1), 1-33.
ANDRECUT, M. (2016). Systemic risk, maximum entropy and interbank contagion. International Journal of Modern Physics C, 27(12), 1650148. [doi:10.1142/s0129183116501485]
BACHARACH, M. (1965). Estimating Nonnegative Matrices from Marginal Data. International Economic Review, 6(3), 294-310. [doi:10.2307/2525582]
BANK for International Settlements. (1994). 64th Annual Report. Switzerland: Basel.
BARGIGLI, L., Iasio, G. D., Infante, L., Lillo, F. and Pierobon, F. (2015). The multiplex structure of interbank networks. Quantitative Finance, 15(4), 673–691. [doi:10.1080/14697688.2014.968356]
BARTHOLOMEW, P.F, Whalen, G.W. (1995). Fundamentals of Systemic Risk, in Banking, Financial Markets and Systemic Risk. In: G.G. Kaufman (Ed.), Research in Financial Services: Private and Public Policy (pp. 3-17). Greenwich: JAI Press.
BAUM, J. A. C., Rowley, T. J. and Shipilov, A. V. (2004). The small world of Canadian capital markets: Statistical mechanics of investment bank syndicate networks, 1952-1989. Canadian Journal of Administrative Sciences, 21(4), 307-325. [doi:10.1111/j.1936-4490.2004.tb00347.x]
BECHER, C., Millard, S. and Soramäki, K. (2008). The network topology of CHAPS Sterling. Bank of England working papers 355, https://papers.ssrn.com/sol3/papers.cfm?abstract_id=1319277. [doi:10.2139/ssrn.1319277]
BERNANKE, B. (2009). Financial reform to address systemic risk. A Conversation at Council on Foreign Relations: Washington DC.
BETZ, F., Hautsch, N., Peltonen, T. A. and Schienle, M. (2016). Systemic risk spillovers in the European banking and sovereign network. Journal of Financial Stability, 25, 206–224. [doi:10.1016/j.jfs.2015.10.006]
BOND, P., Edmans, A. and Goldstein, I. (2012).The Real Effects of Financial Markets. Annual Review of Financial Economics, 4, 339-360. [doi:10.1146/annurev-financial-110311-101826]
BOSS, M., Elsinger, H., Summer, M. and Thurner, S. (2004). Network topology of the interbank market. Quantitative Finance, 4(6), 677-684. [doi:10.1080/14697680400020325]
CHENG, X., Wu, J. and Liao, S. S. (2017). A Study of Contagion in the Financial System from the Perspective of Network Analytics. Neurocomputing, 264(15): 42-49. [doi:10.1016/j.neucom.2016.10.104]
CONT, R., Moussa, A. and Santos, E. (2010). Network Structure and Systemic Risk in Banking Systems. SSRN, http://ssrn.com/abstract=1733528. [doi:10.2139/ssrn.1733528]
DEGRYSE, H., Nguyen, G. (2007). Interbank exposures: an empirical examination of contagion risk in the Belgian banking system. International Journal of Central Banking, 3(2), 123-172. [doi:10.2139/ssrn.1691645]
DIJKMAN, M. A. (2010). Framework for Assessing Systemic Risk. The World Bank Policy Research Working Paper No.5282.
DUGGAR, E., Mitra, S. (2009). External Linkages and Contagion Risk in Irish Banks. IMF staff papers, 56(4), 758-786. [doi:10.1057/imfsp.2008.38]
ELLIOTT, M., Golub, B. and Jackson, M. O. (2014). Financial networks and contagion. American Economic Review, 104(10): 3115–3153. [doi:10.1257/aer.104.10.3115]
ELSINGER, H., Lehar, A. and Summer, M. (2006). Risk Assessment for Banking Systems. Management Science, 52 (9), 1301–1314. [doi:10.1287/mnsc.1060.0531]
FRICKE D., Lux T. (2015). Core-periphery structure in the overnight money market: evidence from the e-mid trading platform. Computational Economics, 45(3): 359-395. [doi:10.1007/s10614-014-9427-x]
GAI, P., Kapadia, S. (2010). Contagion in financial networks. Proceedings of the Royal Society A, 466(2120), 2401–2423. [doi:10.1098/rspa.2009.0410]
GEORG, C.P. (2013). The effect of the interbank network structure on contagion and common shocks. Journal of Banking & Finance, 37(7), 2216–2228. [doi:10.1016/j.jbankfin.2013.02.032]
GONZÁLEZ-AVELLA, J. C., De Quadros V. H. and Iglesias, J. R. (2016). Network topology and interbank credit risk. Chaos, Solitons & Fractals, 88, 235-243. [doi:10.1016/j.chaos.2015.11.044]
GRANELL, C., Gómez, S. and Arenas, A. (2013). Dynamical interplay between awareness and epidemic spreading in multiplex networks. Physical review letters, 111(12). [doi:10.1103/physrevlett.111.128701]
HART, O., Zingales, L. (2009). How to avoid a new financial crisis. University of Chicago Working Paper, https://www.tau.ac.il/~yashiv/hart_zingales.pdf.
IMF (2009). Global financial stability report: Grappling with crisis legacies. World Economic and Financial Services, Working Paper.
IN ’T VELD, D., van Lelyveld, I. (2014). Finding the Core: Network Structure in Interbank Markets. Journal of Banking & Finance, 49, 27-40. [doi:10.1016/j.jbankfin.2014.08.006]
JAYNES, E. T. (1957a). Information theory and statistical mechanicsⅠ. Physical Review, 106, 620–630.
JAYNES, E. T. (1957b). Information theory and statistical mechanics II. Physical Review, 108, 171–190. [doi:10.1103/physrev.108.171]
JI, C., Dian-Fa, C. & Min, S. (2014). Heterogenerous bank system stability research under complex networks structure. Journal of Systems Engineering, 29(2), 171–181.
KAUFMAN, G. G., Scott, K. E. (2003). What Is Systemic Risk, and Do Bank Regulators Retard or Contribute to It? The Independent Review, 7(3), 371-391.
LANGFIELD, S., Liu, Z., and Ota, T. (2014). Mapping the UK interbank system. Journal of Banking & Finance, 45(8), 288–303. [doi:10.1016/j.jbankfin.2014.03.031]
LEÓN, C., Pérez, J. and Renneboog, L. (2014). A multi-layer network of the sovereign securities market. SSRN, https://ssrn.com/abstract=2532461.
LI, S., Wen, S. (2017). Multiplex Networks of the Guarantee Market: Evidence from China, Complexity, 2017, 1–7. [doi:10.1155/2017/9781890]
LI, S.,He, J., Zhuang, Y. and Shi, Y. (2011). Stability of Inter-bank Markets Based on Complex Networks. Journal of Industrial Engineering /Engineering Management, 25(2), 195-199.
MARTÍNEZ-JARAMILLO, S., Pérez, O. P., Embriz, F. A. and
MAY, R., Levin, S. A. (2008). Sugihara G. Complex system: Ecology for bankers. Nature, 451(7181), 893-891. [doi:10.1038/451893a]
MISTRULLI, P. E. (2011). Assessing financial contagion in the interbank market: Maximum entropy versus observed interbank lending patterns. Journal of Banking & Finance, 35(5), 1114-1127. [doi:10.1016/j.jbankfin.2010.09.018]
MONTAGNA, M., Lux, T. (2017). Contagion risk in the interbank market: a probabilistic approach to cope with incomplete structural information. Quantitative Finance, 17(1), 1-20. [doi:10.1080/14697688.2016.1178855]
NIER, E., Yang, J., Yorulmazer, T. and Alentorn, A. (2007). Network models and financial stability. Journal of Economic Dynamics & Control, 31(6), 2033–2060. [doi:10.1016/j.jedc.2007.01.014]
NATIONAL Research Council of the National Academics. (2007). New Directions for Understanding Systemic: A Report on a Conference Cosponsored by the Federal Reserve Bank of New York and the National Academy of Science. Washington D C: The National Academies.
POLEDNA, S., Molina-Borboa, J. L., Martínez-Jaramillo, S., Van Der Leij, M. & Thurner, S. (2015). The multi-layer network nature of systemic risk and its implications for the costs of financial crises. Journal of Financial Stability, 20, 70–81. [doi:10.1016/j.jfs.2015.08.001]
SACHS, A. (2014). Completeness, interconnectedness and distribution of interbank exposures—a parameterized analysis of the stability of financial networks. Quantitative Finance, 14(9), 1677–1692. [doi:10.1080/14697688.2012.749421]
SENSOY, A., Tabak, B. M. (2014). Dynamic spanning trees in stock market networks: the case of Asia-Pacific. Physica A: Statistical Mechanics and its Applications, 414, 387–402. [doi:10.1016/j.physa.2014.07.067]
SILVA, T. C., da Silva, M. S., and Tabak, B. M. (2016). Financial networks and bank liquidity. The Journal of Network Theory in Finance, 2(4), 51.
SORAMÄKI, K., Bech, M. L., Arnold, J., Glass, R. J. and Beyeler, W. E. (2007). The topology of interbank payment flows. Physica A: Statistical Mechanics and Its Applications, 379 (1), 317–33. [doi:10.1016/j.physa.2006.11.093]
UPPER, C., Worms, A. (2004). Estimating bilateral exposures in the German interbank market: Is there a danger of contagion? European Economic Review, 48(4), 827-849. [doi:10.1016/j.euroecorev.2003.12.009]
UPPER, C. (2011). Simulation methods to assess the danger of contagion in interbank markets. Journal of Financial Stability, 7(3), 111-125. [doi:10.1016/j.jfs.2010.12.001]
WELLS, S. J. (2005). Financial interlinkages in the United Kingdom’s interbank market and the risk of contagion. Bank of England Working Paper No. 230. [doi:10.2139/ssrn.641288]
WRIGHT, B. (2016). There will be another financial crisis. The only question is when? Economy, 2016-2-18.
XU, T., He, J. and Li, S. (2016). A dynamic network model for interbank market. Physica A: Statistical Mechanics and its Applications, 463, 131-138. [doi:10.1016/j.physa.2016.07.013]
ZIGRAND, J. (2014). Systems and systemic risk in finance and economics. Special Papers (No 1). Systemic Risk Centre, London School of Economics and Political Science, London, UK.