
Introduction
This paper describes the Nudge-Emergence-Diversity (NED) model, an Agent-Based Model (ABM) that represents the adoption of energy efficient technology and behaviours within a diverse population, and incorporates: behaviour-driven models of decision making; diversity of the population through rich survey datasets of shifting preferences; and the emergence of behaviours within social systems, including representation of trust-based information networks and influence across social networks.
This model is in line with recent papers arguing that ABM is a very promising approach for helping to build better theories and models of energy demand and the adoption of energy efficient technology (Rai and Henry 2016). It is also in line with the thinking of recent Nobel Prize laureate Richard Thaler and his colleagues who argue that governments can benefit significantly from investing in behaviourally informed policies to nudge community behaviour in cost-effective manners, using energy efficiency as one of the success stories in this context (Benartzi et al. 2017).
The case for reducing household energy use is related to the notion that there are profound impacts from human activity on the planet, which some argue is pushing the planet into a new geological era, the Anthropocene (Zalasiewicz et al. 2010). These are profound changes on the functioning of the planet and from a human perspective, the earth is now outside of its safe operating space, in at least three areas of which one is relating to climate change (Rockström et al. 2009). Among the diverse impacts of climate change, including ecosystem and species loss (Thuiller et al. 2005, Brook and Barnosky 2013), from a human perspective perhaps the most worrying concern is that without staying within the safe operating space, including on climate change, it looks difficult for global food systems to meet food demand on current projections (Conijn et al. 2018). This shows that it is imperative to reduce global greenhouse gas emissions. The residential sector accounts for approximately 30% of worldwide energy use (Swan and Ugursal 2009) and the energy sector is the largest contributor to greenhouse gas emissions in most countries (Höhne et al. 2011).
There are two main approaches to reducing the Carbon Dioxide equivalent (CO2-e) emissions from the residential sector, namely through reducing household energy use (increased energy efficiency) or the adoption of renewable energy technologies. Increasing the energy efficiency of households typically requires both behaviour change and technology change. Residential adoption of more energy efficient technology or change of consumer behaviour is an important strategy for mitigating climate change. This is in the context that human-induced CO2-e emissions from residential energy use have been estimated to represent 11% of total CO2-e emissions in the European Union (Drummond and Ekins 2016), and 21% of CO2-e emissions in the United States (Estiri 2015). In a status quo scenario with a projected growing population, Australia’s CO2-e emissions from residential energy use are expected to grow by 38% by 2050 (Hetherington et al. 2015). In fact, it has been found that without energy efficiency improvements in the past, over a 30 year time period the Organisation for Economic Cooperation and Development (OECD) nations would cumulatively have used 49% more energy than they used as of 1998 (Geller et al. 2006).
Energy efficiency in households particularly relates to lighting and appliances, refrigeration and Heating, Ventilation, and Air-Conditioning as well as water heating. It has been estimated that in Australia, the following was a breakdown of residential overall residential energy use: Heating, Ventilation, and Air-Conditioning 40%, water heating 21%, lighting 6% and appliances including for refrigeration and cooking 33% (Australian Government 2013). In many countries, there are policies in place to promote the uptake of energy efficient technologies. For example, the OECD recommends raising awareness of energy efficient technology, and education of the public about the need for environmental action. The OECD also recommends grants and subsidies focusing on low-income households (OECD 2014). But the question is, what works when promoting the adoption of energy efficient technology and what doesn’t work. Ultimately, the adoption of energy efficient technology by households involves individual consumer choices; a process subject to a complex sets of factors and relationships that is not well-represented by the rational choice model of human behaviour whereby which a person weighs up benefits and costs of different options and maximises utility (Frederiks et al. 2015). To be precise, this type of consumer choice is subject to the usual behavioural tendencies, such as being swayed by social comparisons, being loss and risk-averse, tending to favour status quo over change, and wanting to achieve a smaller set of goals rather than evaluating options more holistically (Frederiks et al. 2015). Furthermore, it has been found that the preferences can vary considerably in a population and that the types of criteria adopted depend strongly on the type of technology that is chosen; for example, thermal comfort is the most important factor for Heating, Ventilation, and Air-Conditioning systems, but the light quality is the most important factor for lighting. In fact, this highlights an important aspect of consumer choice here: energy efficiency or even financial aspects are often mere secondary factors.
There is extensive research on the factors that household decision makers consider when they make decisions whether or not to adopt energy efficient technologies in their homes. For example, when households consider purchasing Light-Emitting Diode (LED) lighting, they may consider the level of illumination and the ability to render colours naturally, the expected life of a bulb, the toxicity of materials, the total harmonic distortion (a technical term relating to electricity supply), the temperature emitted from the bulb and the overall environmental impacts of the lighting technology (Aman et al. 2013; Di Maria et al. 2010; Khan and Abas 2011; Hicks and Theis 2014). When households consider the purchase of an Heating, Ventilation, and Air-Conditioning system, they may consider the level of improvement in thermal comfort, the level of inconvenience of making the change, the expected increase in the resale value of the property, any disturbing noise from the system, or any financial issues such as split incentives (Noonan et al. 2013; Wilson et al. 2015; Chua et al. 2013). There are also behavioural tendencies influencing the adoption of technology (Frederiks et al. 2015), such as the free-riding effect (trying to gain benefits without paying), variable trust in information sources (seeking judgments from trusted sources), and availability bias (drawing on knowledge or information that is easily available). Furthermore, how decision maker(s) in a particular household make their choice is highly variable depending on the particular preferences. Thus, the process of adopting technology ought to be modelled in a way that considers diversity in the population, social influence, influence from information flows, and ultimately how these factors play out at an individual decision maker scale, but create emergent outcomes at an aggregate scale, and ABM provides such a modelling framework (Rai and Henry 2016).
The ABM described in this paper has been named NED after these functions, i.e. N for “Nudging” to reflect the representation of behavioural science, E for “Emergence” to reflect the representation of aggregate outcomes from a complex ecosystem of agents, and D for “Diversity” to reflect the representation of a diverse community.
In this paper, the justification, design, implementation and application of the NED model are described. First the context of the study will be explained, then other similar ABMs are reviewed, subsequently, a description and justification of the model will be described, and then its application will be showcased in one case, followed by a discussion about how to use the model, limitations, and potential for improvements.
The Use of ABM to Describe Innovation Diffusion
Innovation diffusion modelling, first introduced by Rogers (1962), is a field of research which arose out of the analogy between the physical process of particle intermingling thereby allowing heat transfer, and the socio-technical process by which technology is dispersed through a population of humans, with a particular focus on the role of communication. For years, innovation diffusion modelling was based on the use of equations, such as the epidemic model (Gupta and Jain 2012), the logistic model (Gruber and Verboven 2001), or the Bass diffusion model (Bass 1969, 2004). Equation-based models have some limitations, however, as was observed and noted for example by Higgins and colleagues (2011, 2014). Even with highly refined equations based models, whilst very useful and pushing the boundaries of what is possible, it still struggles to adequately represent complex decision rules, full heterogeneity in actor attributes, the role of multiple actors types and social networks (Higgins et al. 2012). Faced with these limitations, Moglia and colleagues reviewed alternatives for overcoming them and identified that ABM with a socio-psychological foundation is a viable alternative (Moglia et al. 2017). Furthermore it can be argued that ABM has the same limitations of all models because prediction is always conditional, i.e. subject to the conditions set out in the model (Boschetti et al. 2011). Therefore, it is suggested that ABM is explored as an alternative to equation-based diffusion modelling of technology diffusion processes in particular in order to support ex-ante policy assessment in areas such as when wanting to promote energy efficient technology.
ABM is a type of computational model used for simulation and which emerged out of the research fields of Artificial Intelligence and Cellular Automatons. ABM allows for software representation of agents’ dynamic behaviours and decision making in interaction with each other and with their environment (Gilbert and Troitzsch 2000; Perez and Batten 2006). ABM has been used in a diverse number of topics, including archaeology, biological sciences, economics, ecology, electricity market analysis, financial analysis, social science, transport systems and water management, among others (Macal 2016; Macal and North 2005; Moglia et al. 2010). More recently, ABMs have been proposed as a particularly suitable alternative for describing innovation diffusion processes in the energy and resource efficiency context (Rai and Henry 2016; Moglia et al. 2017).
The modelling of innovation diffusion using ABM is growing in maturity, as indicated by the review by Kiesling and colleagues (2012). In addition, it is noted that if calibrated and when compared to a more standard approach for describing innovation diffusion, i.e. equation-based models, ABM has similar predictive capacity (Mao et al. 2015) but greater flexibility in the ex-ante assessment of policy options as illustrated by Sopha and colleagues (Sopha et al. 2017). Examples of existing ABMs applied to the energy efficiency context are explorations of the adoption of hybrid electric vehicles (Tran 2012); alternative fuel vehicles (Zhang et al. 2011); biomass fuels (Günther et al. 2011); wood pellet heating systems (Sopha et al. 2013); natural gas vehicles (Sopha et al. 2017); alternative fuels (Vliet et al. 2010); and commercial buildings retrofits (Marquez et al. 2013).
The models by Sopha and colleagues (2013) are particularly promising as they consider an advanced socio-psychological model of household decision making based on the Consumat theory, yet they also lack the wider range of agents that contribute to the adoption process, i.e. information or sales agents. Our model is similar to that by Sopha et al. but slightly adjusts the Consumat decision-making algorithm and also introduces actions by sales agents and information agents.
Another related model, the Community Energy Demand Social Simulator (CEDSS), was developed by Gotts and Polhill (2017) with very similar aims to the NED model. The household decision making in CEDSS is based on goal-framing theory where householders focus either on hedonic, egoistic or biospheric goals and explore the full market of products rather than individual products separately. CEDSS focuses primarily on describing householder decision making and not so much on additional agent types. It has also been shown that the way that the goal-framing theory is deployed can lead to significantly different implementation and results, as described by Polhill and Potts (2017). This raises concerns about the application of ABM and highlights the need to be careful in the specification of decision-making models.
The Agent-Based Model
This section describes the model using the Overview-Design concepts-Details (ODD) protocol which has been proposed as a standardised protocol for reporting ABMs (Grimm et al. 2006; Grimm et al. 2010).
Purpose
The purpose of developing this model is to describe ‘the uptake of low carbon and energy efficient technologies and practices by households and under different interventions’. There is a particular focus on modelling non-financial incentives as well as the influence of social networks and the decision making by multiple types of agents in interaction, not just households.
Implementation
The model has been implemented in NetLogo 5.3.1 (Wilensky 1999).
To promote usability, the principle for the model is to allow the user as much flexibility as possible in exploring assumptions and sensitivity to model parameters through the user interface.
The modelling has been informed through a co-design process whereby we have involved the potential users of the model as collaborators in the research project. The potential users we have involved are at the Office of Environment and Heritage which is part of the New South Wales (NSW) State Government.
The model co-design was carried out by embedding collaborators in ongoing project team meetings, involving other collaborators in regular discussions about iterations of the model with presentations and feedback sessions. The co-design can best be described as group model building, as described by Hovmand (2013). Vennix (1996) specifies four distinguishing factors of group modelling and our approach is based on:
- Firstly, the core issue was specified based on learning from previous efforts at building innovation diffusion models to address a known user need. In previous studies with the collaborators, innovation diffusion models were based on equation-based approaches (Higgins et al. 2011, Higgins et al. 2014).
- Secondly, an unstructured group process was adopted based on regular team meetings and ongoing conversations about data and assumptions. This was supported by collaborators having good working knowledge of ABM based on previous studies and their own research.
- Thirdly, the process was first focused on the informal causal map to generate a shared understanding, which eventually allowed the team to move towards a formal computer simulation model. This learning process was based on iterations of presentations and feedback sessions.
- Fourthly, the team started with a relatively blank slate with no preconceived model. However, the approach was informed by previous modelling efforts, and quite quickly the team settled on the Consumat approach as a meta-framework for modelling household decision making.
Throughout the coding of the model, efforts have been made to attempt to ensure that there are as few errors and defects in the code as possible. This has been done by means of unit testing during coding, i.e. all methods have been tested to explore outputs individually to ensure they do what they are expected to do. Secondly, the developer, as well as potential users, have been running the simulation system to explore anything that looks odd, and that the system produces accurate representations. In other words, whenever any unexpected results are reported or found, attempts have been made to verify whether this is a true representation of the conceptual model or whether it is the outcome of a software bug. Throughout development, numerous bugs have been removed, and hopefully, there are none left.
State variables and scales
The model has been developed in interaction with potential users through the mapping of a set of interventions to increase the penetration of energy efficient products within a community. By mapping out potential interventions we have identified three types of agents to represent in the model as per Table 1. State variables are shown in Table 2 to 5. In addition to the agents described in Table 1, technologies are described representing energy-efficient products, and their alternatives. Therefore, there are two types of technologies for which the attributes are shown in Table 3.
| Agent type | Role |
| Household | Residents make decisions about whether to adopt an energy-efficient product. |
| Sales agent | Sales agents may sell energy-efficient products, sometimes instigated through subsidies. Sales-agents are assumed to primarily focus on maximising profits. |
| Information agents | Information agents are those who provide recommendations to households on whether to purchase an energy efficient products. These include retailers, state government, tradespeople, builders and media sources such as TV home improvement programs and online forums (Podkalicka 2018; Office of Environment and Heritage NSW 2014b; Office of Environment and Heritage NSW 2014a). |
| Household variables | Description | Comments |
| ID | An integer | A unique number to represent the agent |
| Dwelling type | Detached house, Apartment / Unit / Townhouse, Semi-detached or Terrace, or Other. | User-specified to reflect knowledge or data describing the target geographical area. |
| Household type | Type of household, as per household typology. | |
| Location | Coordinates on the map, representing a physical location. | Currently randomly assigned. However, if the geographical locations of households are known, this can easily be added as a household variable and mapped in the GIS component in the user interface. |
| Personality | A normalised value between 0 and 1 as per the Consumat theory (Jager and Janssen 2012). | Responses to questions in a household survey that reflect personality are used to calculate a ‘personality’ score. |
| Financial vulnerability | A ‘financial vulnerability’ score, which is normalised to a value between 0 and 1. | Based on the household survey, i.e. responses to questions that reflect financial vulnerability are used to calculate. |
| Preferences | A set of eight numbers between 0 and 1, normalised so that the total score adds up to 1. | Weights associated with each of the performance criteria. Based on the household survey, i.e. responses to questions that reflect preferences. |
| Peers | A number of peers (i.e. a list of their IDs) | Describing the household social network. Initialised based on a specified social network. This is static as it would otherwise be computationally too expensive to run the simulations and a static network is considered an adequate approximation. |
| Information source profile | For each of the information sources, a value 0 or 1. | This denotes which of the information sources the household agent seeks recommendations from. Based on responses in the household survey. |
| Technology ownership | A zero or a one to indicate ownership. Plus another number to indicate the age (in years) of the associated product. | Ownership of an energy efficient product (denoted by 1), or a non-energy efficient product (denoted by 0). Also, the age of the product. Ownership is dynamically updated and initialised based on surveys or expert opinion. The age of the technology is assigned based on a probability distribution, as per an input file. |
| Decision profile (dynamically evaluated in the simulation) | Mode of decision making, i.e. Inquire, Imitate, Repeat or Optimise | As per Consumat theory (Jager and Janssen 2012). Assigned dynamically in the model on the basis of evaluated satisfaction and uncertainty. |
| Satisfaction, i.e. a value of 0, 1, 2 or 3 | The fulfilment of three satisfaction criteria. | |
| Uncertainty, i.e. 0 or 1 | Dynamically determined based on inconsistency in criteria fulfilment. | |
| My-performance, i.e. a value between 0 and 1. | As per Equation 1 | |
| Social needs satisfaction, i.e. a value between 0 and 1. | As per Equation 2 | |
| Local-adoption-rate | The adoption rate of the energy efficient product within their friends’ network. Updated regularly. |
In Table 3, the relative performance of the technologies is specified by the user within input files. The input files describe how the performance factors change over time. These can be estimated based on literature, survey and/or expert opinion. The performance values are normalised values between 0 and 1, where 0 is considered ‘completely inferior to the alternative’ and 1 is considered ‘completely superior to the alternative’. The sum of the performance values for the two types of products add up to 1. If for example at a certain point in time, the upfront cost of the Energy Efficient (EE) technology is $100 and the upfront cost of the OLD technology is $50 then the Non-Energy Efficient (referred to as OLD) technology performs twice as well as the EE technology. Converted to performance attribute values, this translates to a value of ~0.67 for the OLD technology compared to ~0.33 for the EE technology. A subsidy for EE that would reduce the price from $100 to $75 would change the performance value for the EE product to 0.4 and the performance value for the OLD product to 0.6. Currently, the model only describes the choice between two types of technologies (EE: energy efficient, and OLD: not energy efficient). The state variables of technologies related to a large extent to the performance factors of the technologies, i.e. issues that have been identified as important within a literature review (Moglia et al. 2017).
| State variable | Description |
| Price | People tend to be influenced by monetary considerations which in turn are influenced by socio-economic factors (Hall et al. 2013). The upfront price of a product is particularly important because energy efficient technologies tend to come at a higher initial cost and access to capital can be an important limiting factor in the adoption process (Wilson et al. 2015). |
| Return on investment | |
| Ongoing cost | |
| Aesthetics | Aesthetics and taste anxiety are common drivers for home renovation or upgrade decisions (Rosenberg 2011). The influence of aesthetics, however, vary depending on the type of product. For example, for lighting, aesthetics relates to the ability to render colours naturally, and the level of illumination (Aman et al. 2013). Importantly, the perception of light quality, based on hearsay and experience, is likely to be as important as the actual light quality. |
| Comfort | Some energy efficient products are associated with greater reported home comfort, especially if this comfort can come with less guilt about using energy and emitting greenhouse gases (Chua et al. 2013, Wilson et al. 2015). |
| Resale value | Energy efficient products may make the property more attractive and thus are sometimes believed to create higher resale values (Noonan et al. 2013). |
| Electricity use | Not everyone is motivated by energy savings and environmental benefits, but some certainly are and this is seen as a function of environmental attitudes and awareness (Hall et al. 2013: Liu et al. 2013; Newton and Meyer 2013) |
| Environment – other | There are also other environmental impacts of products beyond greenhouse gas emissions, for example, some lighting types emit levels of mercury (Hg) which have been banned in some countries, but the sale of these persist in other locations (Aman et al. 2013). |
| Proportion of energy use | This represents on average how much of a household's energy is being used by the particular product’s end-use category. This information can be sourced from government websites or industry sources (Platinum Electricians 2018). |
| Technology efficiency | This represents the proportional reduction of the household energy use (within the end-user category) based on adopting the energy-efficient variety. This information can be sourced from government websites or industry sources. |
| Probability of “end-of-life” (EOL) as a function of age | This is the probability of a product being at the end of its productive life as a function of age in years. Different technologies have different ageing patterns and expected productive lives so this is specified for each product type. This can be established based on expert opinion or informed by manufacturers’ specifications etc. |
| State variable | Description | Change |
| Records of sales success and failure | Track record in selling energy efficient products to allow appropriate updating of the sales strategy. | Dynamic |
| Expenses | Expenses when purchasing and selling the energy efficient product. | Dynamic |
| Income | Income associated with selling the energy efficient product. | Dynamic |
| Sales price | The price at which the sales agent will sell the product. This is updated based on the sales track record and estimated return on investments. | Dynamic |
| Administration cost factor | The cost of administering the subsidy scheme. In the context of New South Wales, this is the Energy Savings Scheme (NSW Government 2018). Default value: 1.05 i.e. 5% on top of price estimated. | Static |
| Cost of sales attempt | The cost of an attempt to sell the product, regardless of success. | Static |
| Purchasing discount | The discount that the sales agent could receive when purchasing the product. Default value: 0.15, i.e. 15% discount. Based on expert opinion. | Static |
| State variable | Description |
| Preferences | A set of normalised weights (between 0 and 1 and adding up to 1) associated with the performance criteria: price, aesthetics, electricity use, environmental issues, comfort, the return on investments, ongoing costs, and impact on resale value. These are based on expert opinion or survey and are entered by the user through an input file. |
| Recommendation | Evaluated dynamically on request based on a choice model equation to estimate the probability of recommending the EE product. |
Process overview and scheduling
The process of the model is conceptually described in Figure 1.
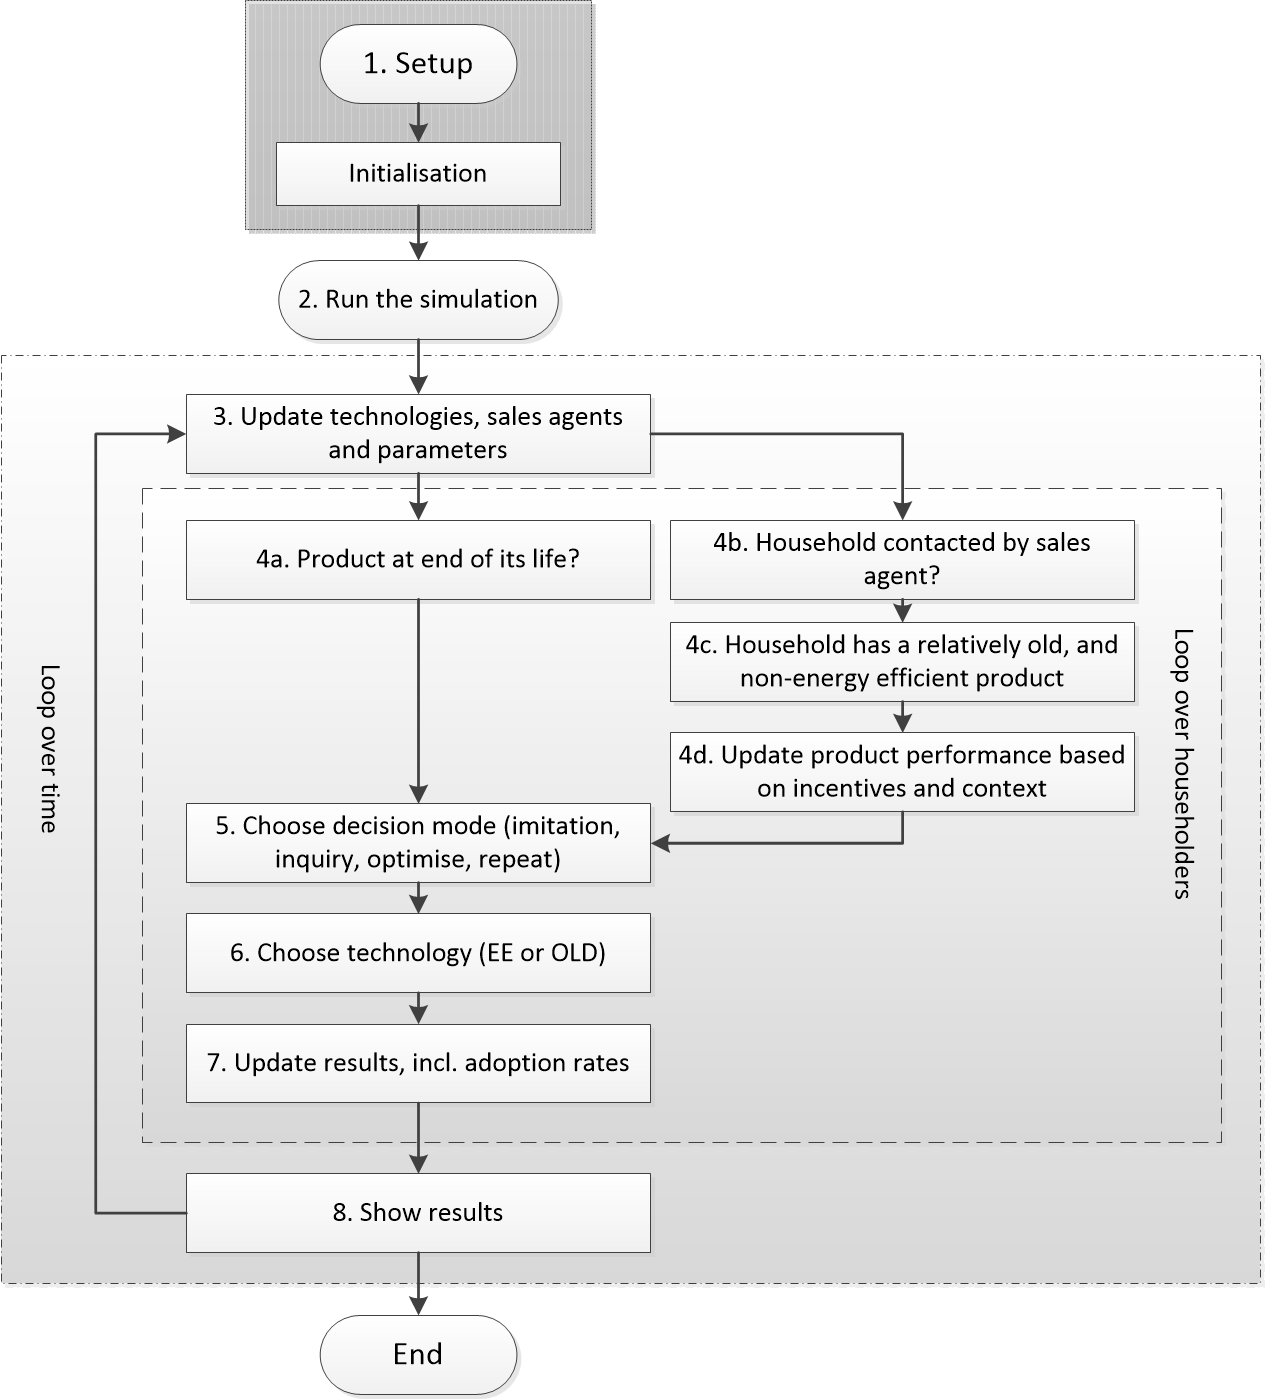
Household agent decision making
Modelling the household decision making is a two-step process. Firstly, the household is only considering purchasing a product in certain circumstances. Secondly, once the household considers purchasing a product, the approach for choosing which product to buy is determined by the Consumat theory. For the first part of this process, there are two decision trigger points, as shown in Table 6.
| Decision trigger points | Description |
| Product at end-of-Life | When the product (i.e. hot water system etc.) has reached the end of its life, the consumer will consider purchasing a replacement. |
| Being approached by sales-agent | In each time period, sales-agents will randomly contact a proportion of the population and attempt to sell an energy efficient product. This does not always trigger a decision point, as described below. |
Once a household agent initiates the decision making process, the process follows the Consumat theory which is based on social psychology whereby the mode of decision making hinges on two issues, i.e. firstly the level of satisfaction and secondly, the amount of uncertainty, i.e. the amount of cognitive effort required in making a decision. Depending on high and low needs satisfaction, and high and low uncertainty, the four modes of decision making are as follows. The level of needs satisfaction and the level of uncertainty when a household agent makes a decision is in turn based on three criteria, Existential Needs Satisfaction (see Equation 1), Social Needs Satisfaction (see Equation 2) and Primary Focus Satisfaction, i.e. whether the highest priority performance > 0.5 as this means that the option outranks the alternative (the performance values are normalised in order to add up to 1). These criteria are thought to be satisfied when the value is above 0.5.
| $$\text{Existential Needs Satisfaction (i)} = \Biggl(\sum_{j = 1 \, \text{to} \, 8} w_{i,j} \cdot p_{i,j} \Biggr) + \text{Behaviour-Adjustment}$$ | (1) |
| $$\text{Social Needs Satisfaction (i)} = (a_i \cdot u) + (1 - u) \cdot (1 - a_i)$$ | (2) |
| $$\text{Behaviour-Adjustment} = \text{Delta(hassle)} + \text{Delta(discount)} + \\ \text{Delta(free)} + \text{Delta(word-of-mouth)} + \text{Delta(status-quo-bias)}$$ | (3) |
Here,
- \(i\) refers to household number i,
- \(w(i,j)\) refers to the preference weight of household i regarding performance factor \(j\).The weights add up to 1.
- \(p_j\) refers to the performance of the energy efficient product against factor \(j\). This is a normalised number between 0 and 1.
- \(a_i\) refers to the personality value of household i
- \(u\) refers to the adoption rate of energy efficient products.
The behaviour adjustment factors and their values are further described in the supplementary materials. The choice of the decision mode is based on how many criteria are being fulfilled, which is an adaptation of the Consumat theory, as per Jager and Janssen (2012). The Consumat meta-theory of decision making considers existential needs satisfaction and social needs satisfaction, as well as an evaluation of uncertainty in expected outcomes. After deliberation within the team, it was thought that it is beyond householders’ consideration to consider uncertainty in statistical expectations, but within their capacity to consider inconsistency between social and existential needs satisfaction, and other criteria. We also wanted to consider a crowding out effect, where particular preference is given to the householder’s most important issue. Therefore we consider that satisfaction and uncertainty are based on the overall weight of the three criteria, in the following manner: 1) no criterion fulfilled: unsatisfied and certain, 2) one criterion fulfilled: unsatisfied and uncertain, 3) two criteria fulfilled: satisfied and uncertain, 4) three criteria fulfilled: satisfied and certain. The decision modes are as follows.
- Repetition: Satisfied and certain. Repeating the behaviour of the past, i.e. if a household agent already has an EE product, the household agent will then also upgrade with an EE product, and vice versa.
- Imitation: Satisfied and uncertain. Copying the behaviour of a household within the social network. Only friends that are “satisfied” are considered. If the household has no satisfied friends, then the household will consider the adoption rate in the broader community, i.e. if the uptake of EE is 25% then the likelihood that a household will adopt EE is 25%.
- Optimisation: Unsatisfied and certain. Choosing the product with the highest overall performance, i.e. the weighted sum of product performance and individual priority weights, plus behavioural factors.
- Inquiry: Unsatisfied and uncertain. Seek recommendations from the information sources that the household agent will consider (as per attributes in Table 2). A probability p of adopting EE is calculated as the weight of recommendations for EE divided by the weight of recommendations for EE and OLD.
Information agent decision making
Information agents provide recommendations to households (i.e. ‘you should buy an energy efficient product’, etc.) when households are in the ‘inquiry’ decision mode. In the default model, there are nine types of information sources, i.e. family and friends, TV home improvement programs (based on expert opinion, two different types of shows are included due to their current dominant position in the Australian market, i.e. Grand Designs and The Block), retailers (two included), tradespeople, online forums, builders, government information sources; these are chosen and parameterised based on information in industry reports (Office of Environment and Heritage NSW 2014b, 2014a) and academic papers (Rosenberg 2011; Podkalicka 2018). To determine which recommendation to provide, information agents have the same type of attributes as households regarding prioritising different performance measures (see Table 5) on performance measures for each of the technology options to calculate the probability of recommending an EE product based on a discrete choice logit model:
| $$P(\text{recommendation} = EE) = \frac{e^{(k \cdot \mu)}}{e^{(k \cdot \mu)} + e^{(k \cdot (1 - \mu)}}$$ | (4) |
Here, \(μ\) is the weighted performance of the EE products, and where the weights are the information agents’ priorities, as per Table 2. \(k\) is a weighting factor which should ideally be fitted based on choice experiment data; however in the absence of this data the parameter has been set to 5 so that the equation reproduces what is considered realistic behaviour.
Sales agent decision making
Sales agents represent actors who will contact households directly to attempt to get them to upgrade to an energy efficient type of product. In the context of the Energy Savings Scheme in New South Wales, these may be what are called the ‘aggregators’ who create energy saving certificates on behalf of clients, and who thus can claim the financial reward of doing so (each certificate can be claimed at a price which is adjusted on an ongoing basis). However, sales agents do not necessarily need a subsidy from the government, but may also simply be able to create a financially viable business by purchasing discounted products and having an acceptable level of success in their sales activities.
In each time step (as per Figure 1), sales agents contact a certain number of households and attempt to sell an energy efficient product. In the model, a household will make a decision based on the following rules:
- If the household does not already own an energy efficient product, and if the existing non-energy-efficient product is past its half-life (here defined as when half of all products have reached the end of their useful life), the household will consider purchasing an energy efficient product (i.e. initiate a decision-making process). This rule is based on the acknowledgement that householders may sometimes, in some circumstances, consider replacing a product even when it isn’t broken, for lifestyle reasons or due to a perceived opportunity to “get a good deal”.
- In this context, the household will only initiate a decision making process for purchasing an EE product if they believe that a good deal can be made that will soon be unavailable, i.e. if it is sold either at or below current market price. Once the decision-making process has been initiated, all the usual performance issues will be considered as per household preferences (see Table 2 and 3).
- Then, if the household escalates to the decision making process, the eventual decision will be on the basis of the Optimise decision mode, i.e. on the basis of existential needs satisfaction (Equation 1), but with adjustment for the price provided by the sales agent, and with the usual behaviour-adjustments.
Furthermore, in each time step, each sales agent will update their attributes and decision rules on the basis of the assumption that they will act as financial rational actors and maximise their profits (which is consistent with indications from qualitative research in the project, from medium-sized to large businesses; but not appropriate for smaller companies):
- Calculating the success rate, i.e. the number of successful sales calls divided by the total number of sales calls.
- Calculating the return on investments by dividing the profit with costs.
- Adjusting the outreach (i.e. the number of sales calls made in each time step), on the basis of:
- If more than 3 times target return on investments, then grow this number by 25%
- If more than 1.5 times target return investments, then grow this number by 10%
- If more than target return on investments, then grow this number by 1%
- If making a loss, then halve this number
- Adjusting the sales price on the basis of an expected success rate and on the basis of ensuring a target return on investments (by calculating the expenses ‘per sale’ and choosing a price at the 25% mark between the estimated cost and the market price of the system).
Design concepts
Key aspects of the NED are mapped out and described, as per Kiesling et al. (2012), in Table 7. This table has a number of concepts and notions that are not described in detail here but which are described in more detail in the earlier part of the paper.
| Model features | NED design feature |
| Method for agent adaptation | Household agents make decisions using decision rules, as per the social psychology approach based on the Consumat theory (Jager and Janssen 2012; Janssen and Jager 1999; Jager, Janssen and Viek 2001). |
| Emergence | The Consumat model allows for decision rules, two of which enable a degree of emergent behaviour due to interaction with other agents. These two decision rules are imitation and inquiry. |
| Fitness | Households calculate the fitness of adopting a technology based on their perceived capacity to fulfil social and existential needs. |
| Interaction | Households interact with each other through imitation, inquiry and social comparison. Social needs evaluations are dependent on the behaviour of other households. In addition, households are influenced by information agents in the inquiry decision mode and sales agents trigger household decision points. |
| Level of social influence (micro, meso or macro) | There is an influence at the micro-scale (via connected friends), mesoscale (via aggregate measures within groups of friends), and macro-scale (via aggregate measures at the community level). Imitation occurs at the micro-level. The user can provide input through a ‘slider’ to decide to what extent social comparison occurs at the mesoscale or the macro-scale. The default is set to the mesoscale. |
| Social network typology | There is a social network connecting household agents. The user can choose between friends’ network based on a small world network, random network, or a spatially based network (i.e. neighbours). The social networks are based on synthetic data generated using various algorithms such as the: small-world networks (Watts and Strogatz 1998) or scale-free networks (Barabási 2002). |
| Consumer heterogeneity and collectives | A household survey was used to describe heterogeneity in 1) priorities; 2) level of financial vulnerability; 3) types of the households as per typology; 4) preferred information sources used. |
Setup and initialisation
The model is being set up in a process that involves 1) user inputs to choose parameters and model settings, 2) reading input files, 3) creating agents to represent households, information agents, and sales agents, 4) creating a social network between households, and 5) creating technologies and assign their attribute values as per input files.
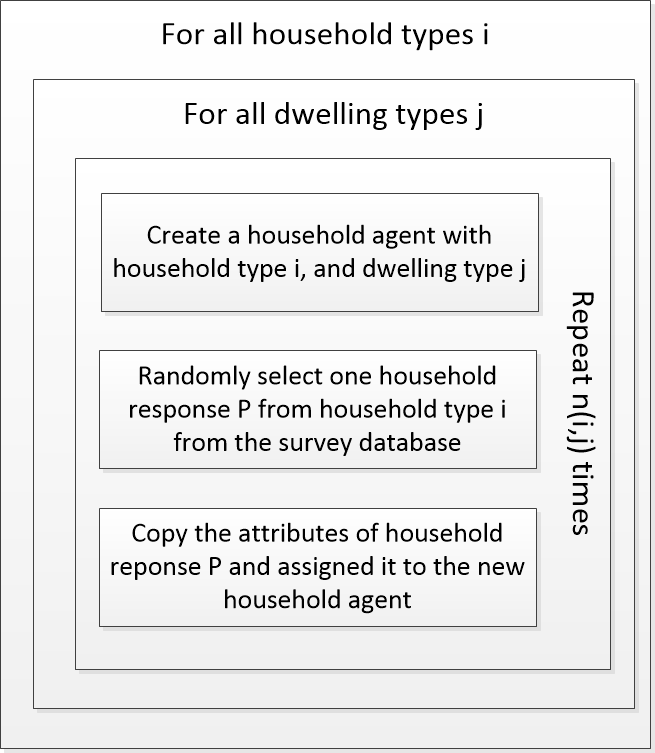
The number of household agents of different dwelling types and household types (with categories as per Table 2) are defined in an input file, typically representing census data of the target area. An example of the information structure is shown in the supplementary materials.
When a household agent is created, it receives its attributes copied from the survey responses, currently a database of 954 responses (Office of Environment and Heritage NSW 2014a). Rather than providing the raw survey data, this file represents the result of statistical analysis of the survey data. Python scripts were used to process the initial survey responses into a format that is appropriate as an input file for the simulator. The assignment of attributes is carried out as per Figure 2. There are also input files to specify the attributes of the information and sales agents (examples provided in the supplementary materials).
Input
A key driver for the model dynamics is the technology performance which is specified through input files. Due to limitations in space required and to illustrate the approach, we only focus on hot water systems here. The values on technology performance of hot water systems are shown in Table 8.
| Performance metric | Start | End | Data source |
| Price | 0.18 | 0.40 | Consumer websites in Australia put the price of a solar hot water system in the range of $3,000 - $7,000 fully installed (Choice 2017); whilst an alternative system would cost $450 - $1,800 (www.australianhotwater.com.au 2017). |
| Aesthetics | 0.50 | 0.50 | It is assumed that there are no discernible differences between systems in this respect. |
| Electricity use | 0.71 | 0.90 | Numbers on annual electricity use from Moore et al. (2017). 15,260 MJ/y for an electric storage system; and 6,104 MJ/y for a solar electric system. It is assumed that these numbers will improve over the time frame. |
| Environmental issues (other) | 0.50 | 0.50 | It is assumed that there are no discernible differences between systems in this respect, as there have been no such findings reported. |
| Comfort | 0.55 | 0.65 | Expert opinion. To be estimated using surveys in the future. This represents the notion that using hot water without the added guilt of spending much money or overly polluting the environment makes for a more comfortable home. |
| Long-term cost | 0.58 | 0.80 | Calculated based on initial price and electricity use plus $0.25 per kWh (Australian prices) and the cost over a 12-year time frame; as 12 years is an approximate expected life of a hot water system. |
| Ongoing cost | 0.71 | 0.90 | Assumed to be perfectly aligned with electricity use. |
| Impact on resale value | 0.52 | 0.55 | Expert opinion. To be estimated using surveys in the future. |
Furthermore, based on conversations with experts and review of the literature, we adopt a set of assumptions that relate to hot water systems and to the interventions to attempt to increase adoption rates; as shown in Table 9.
| Input setting | Explanation |
| Initial adoption rate, i.e. p-start | The adoption rate at the start of the simulation is 21% based on data from Beal et al. (Beal et al. 2012). It is noted that this is data from Queensland rather than New South Wales (i.e. a similar jurisdiction). |
| Urgency of replacement | It is assumed that when a hot water system breaks down, due to the urgency of the situation, households will not analyse the problem in detail; and thus we set the uncertainty as high which will trigger the inquiry or imitate modes of decision making. The only time, for the case of hot water systems, that a decision will be made through careful evaluation (optimise mode) is when being approached by a sales agent. |
| Promoting solar hot water systems amongst plumbers | Working with plumbers to achieve a greater rate of recommendations of solar hot water systems, thus for this scenario, we put the tradespersons’ priorities to be: 30% price, 50% electricity use, and 20% comfort. |
| Subsidy | Providing a 20% subsidy on all purchases of solar hot water systems. |
| Energy savings scheme certificates | Making a subsidy available to sales agents via energy savings certificates (say at $20, or $30 per certificate). The idea is that this prompts sales agents to be proactive in their attempts to sell solar hot water systems to the community. |
| Social network | For the purposes of this paper, a small world social network is employed, generated using the Kleinberg model with a clustering component set to 2, as is considered to be optimal (Easley and Kleinberg 2010). |
| Awareness | It is assumed that everyone knows about solar hot water systems as an option so the AwarnessImpact is set to 0 (meaning that awareness is 100% from the start). |
| Time frame of simulation | We have chosen to simulate the adoption of technology over the time frame of 2017-2047. We recognise that this means that much will change during this time frame and that it is unlikely that things will stay as they are described in the model. However, we also like a longer time frame in order to highlight the long term benefits of decisions being made now. |
Sub-models
An important aspect of the model is to calculate reductions in carbon emissions, and therefore the carbon accounting component estimates reductions in carbon emissions. For example for the solar hot water systems, the assumptions are shown in Table 10.
| Parameter | Explanation |
| Proportion of household energy use | Hot water is assumed to account for 21% of the household energy use (NSW Government 2016). |
| Reduction in energy use | A solar hot water system is assumed to reduce energy use for producing hot water by 60% (Moore et al. 2017). |
| Household energy use per year | An average household in New South Wales, Australia, is assumed to use approximately 5,920kWh per year (ACIL ALLEN Consulting 2015). |
| Emissions factor | For New South Wales the emissions factor is set to 0.86 kg CO2-e/kWh (Australian Government 2014). |
| Emissions factor gradient | It is assumed that with the gradual installation of renewable energy and other cleaner energy sources, the emissions factor will continually drop at a rate of 0.01 per annum. |
Scenario Results
To illustrate the use of the model, we will report on the following explorations:
- Testing the model for stability: does the model have significant amounts of randomness embedded or does it produce similar results every time?
- Sensitivity analysis to policy interventions: what interventions are more efficient in increasing adoption rates?
Testing the stability and validity of the model
Running the model multiple times with a baseline scenario, i.e. with no intervention, helps to explore whether the model provides repeatable results. As there is a range of stochastic aspects of the model, it would seem likely that different simulation runs would provide significantly different results but this does not seem to be the case, as illustrated by Figure 3.
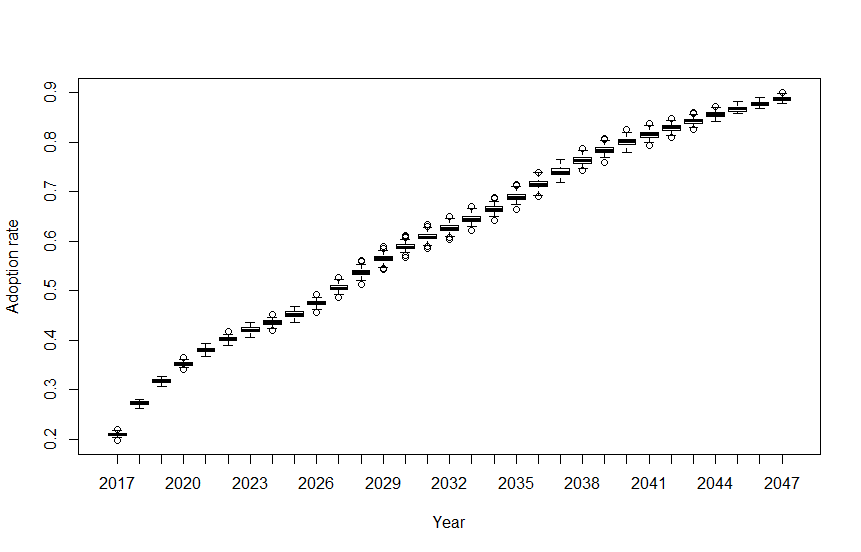
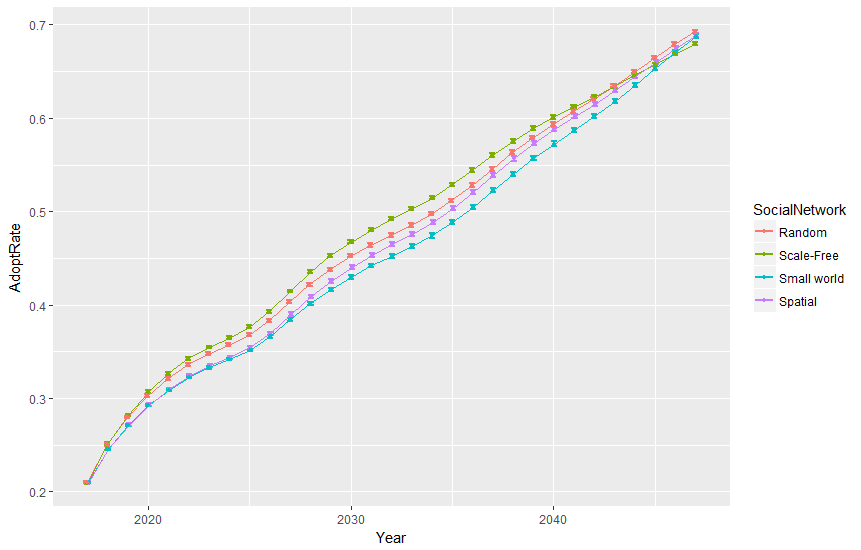
The average adoption rates of 50 simulation runs each for four different types of social network, are shown in Figure 5 which shows only limited variability between runs. There are some systematic differences depending on the underlying social network structure however with slightly higher rates of adoption in the scale-free social networks. We believe this relatively small difference in results arising from variable social network typology is due to adoption rates being fairly homogenous across the population. Other observations from the simulations are:
- Sales agent never gets activated in this baseline scenario because the return on investment never gets above the critical threshold as the certificate price is $0 so the sales agent struggles to generate profit.
- Adoption rate curve seems to follow what will have to be assumed the ‘middle part’ of an S-curve (standard in innovation diffusion), which is consistent with starting at a starting adoption rate of 21% and not reaching a plateau during the simulation time frame.
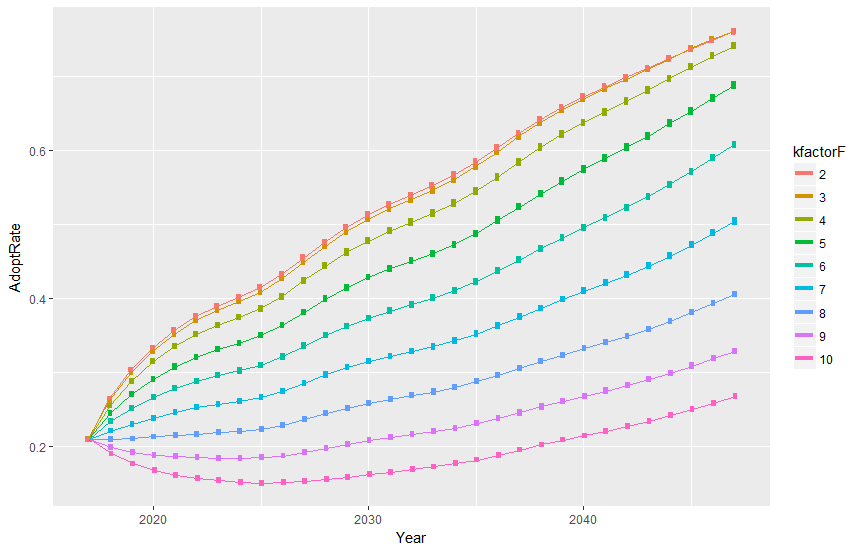
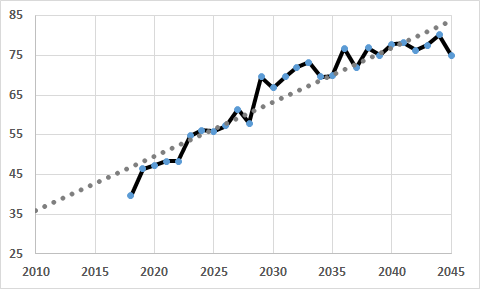
It is unfortunate that there is no accessible longitudinal data on uptake of solar hot water systems available in Australia in order to validate the model against. In terms of validation, only limited comparison with historical data is possible but a paper by Ferrari et al. (2012) with data on sales of solar hot water systems shows that the 35% of hot water systems sold in 2010 in New South Wales were solar hot water systems. This is consistent with the linear trend in the sales rate (i.e. the proportion of new products being solar hot water systems) extracted from the model when the trend in the sales rate is extended back in time (see Figure 6). This is promising, considering none of the parameters in the model were calibrated to fit with historical data. Explorations of the parameter space is warranted, however full sensitivity analysis is beyond the scope of this paper due to the complexity of the model. Gotts and Polhill (2017) suggest a suitable approach for complex models such as these, i.e. 1) enter parameter values which seem to reasonably fit with empirical data, 2) systematically vary parameters that seem likely to most influence results. The sensitivity analysis can easily be supported in the NetLogo BehaviourSpace tool, and through the relatively intuitive user interface, as is illustrated with the sensitivity analysis for the k weighting factor in Equation 4 (representing approximately the inertia in getting information sources to recommend energy efficient technologies). See Figure 4 for the result of this sensitivity analysis.
Evaluating interventions
The types of interventions that the model could explore include: 1) activating sales agents to attempt to sell more energy efficient products to the community, 2) influencing retailers and other key actors such as tradespeople to recommend the adoption of energy-efficient products, and 3) providing direct subsidy to community members for purchasing energy efficient products through cheap loans and/or subsidies. Specifically, to illustrate the use of the model, here we describe a couple of interventions to promote the adoption of hot water systems, including:
- The Energy Savings Scheme (NSW Government 2018) whereby so-called aggregators apply for energy savings certificates after installing, improving or replacing energy savings equipment. They may choose to proactively target householders to increase sales of energy efficient products and they may also choose to use some of the energy savings certificates to reduce the price of products. We explore three settings on the energy savings certificates, i.e. $0, $20, and $30.
- Working with plumbers to increase the rate of recommendations of solar hot water systems. The plumber is often contacted by householders when a hot water system breaks down. In this scenario, the recommendations of plumbers are based on a choice model of hypothesized priorities as per the supplementary materials.
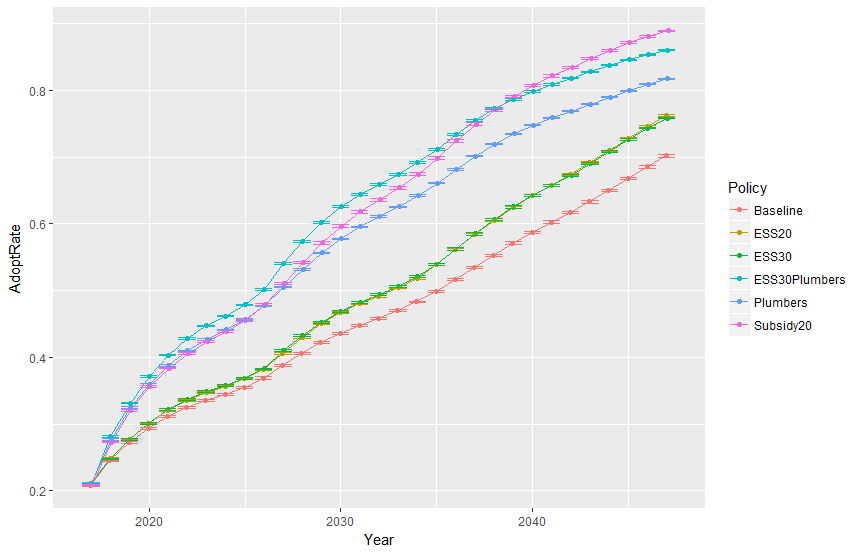
- Providing a 20% subsidy directly to households when they choose whether to purchase an energy efficient product, regardless how or where they purchase it.
These options have been explored individually as well as in combination as per Figure 7 and Table 11. It is clear that in this case, the monetary incentive through the Energy Savings Scheme is less efficient than the approach of influencing the recommendations of plumbers, and also less efficient than the 20% subsidy. Whether working with plumbers is more cost effective than providing a subsidy is unknown due to the difficulty in estimating the cost of influencing plumber recommendations.
| CO2-e reduction per householda | Cost per hh per year (C) | Adoption rate 2047 (%) | Additional reduction (Δ)b | |
| Baseline, i.e. no intervention | 3.81 | $0 | 68.6 | - |
| ESS - $20 | 4.39 | $19 | 75.5 | 0.58 |
| ESS - $30 | 4.54 | $29 | 76.5 | 0.73 |
| Working with plumbers | 5.93 | Unknown | 81.5 | 2.12 |
| 20 % subsidy | 6.32 | $17 | 88.9 | 2.51 |
Reflections
The scenario analysis demonstrates that running model simulations provide insights beyond what is accessible with human cognitive functions. The model is able to explore where in the supply chain it is most cost-effective to incentivise decision making in order to promote the adoption of energy-efficient products.
Furthermore, as is the strength of many ABMs when embedding socio-psychological models, the NED model is able to explore less tangible issues like common human biases in decision making, for example, the status quo bias, and the benefits of making adoption less of a hassle.
In terms of specific results, the scenario analysis has shown that in the case of solar hot water systems and with of the described population, it is more cost effective to provide a subsidy to households rather than to incentivise sales agents via energy savings certificates. This is despite the fact that sales agents generate decision points that otherwise would not occur. This is somewhat counter-intuitive because otherwise subsidies only get activated when a product reaches the end of its life. Thus without marketing activities from sales agents, the maximum rate of the upgrade is dependent on the ageing of products and is limited.
To validate this finding, regarding the effectiveness of providing a subsidy to households vs. incentivising sales agents, it will be necessary to collect better data on the model parameter, the ‘discount-effect’, which relates to the behavioural biases of mental accounting (Thaler 1985).
Nonetheless, it seems likely it is more cost-effective to promote plumbers to recommend solar hot water systems. This shows the importance of providing the right information at the right time to households. In the case of solar hot water systems, plumbers engage with householders and have the opportunity to provide them with the right information at the right time.
At a higher level, the model explorations also show that when modelling adoption processes, it is critical to understand the process of adoption, which can vary significantly depending on the type of intervention into the system. Embedding insights from behavioural science as much as possible allows for fine-tuning some key parameters in the delivery of interventions.
Regarding the viability of the modelling approach, we believe it has potential to support plans to increase resource efficiency in society and thus can help improve sustainability outcomes. The approach is adaptable to many types of situations but will require some effort to tweak and update the models.
To adapt the model to new contexts and interventions, the main task is in collecting the appropriate data, including surveys of households and key actors. Other actors that need to be surveyed are sales agents, information agents and supply chain actors. To illustrate the extent of data collection required, in a subsequent project where an adaptation of model is being developed on the topic of water conservation, the team has developed a standardised survey (requiring a couple of days to a week to adjust to new context next time), and in that context we surveyed 500 households which should suffice in most situations. The data collection for other agents, such as plumbers, supply chain actors or retailers, may be based on knowledge elicitation in a one-day workshop setting for each category.
For those unfamiliar with ABM, the coding of the model is relatively straightforward, yet requires familiarity with the model itself, as well as some training in Agent-Based Modelling.
The modelling capability described in this paper has here been applied to residential energy efficiency but adjustments of the model are being built to allow the analysis of interventions to increase household water conservation as well as shifting suburban commuter travel modes to low carbon alternatives.
Conclusions
This paper provides the description of an ABM that represents the adoption processes of energy-efficient products. The computational engine has two sides of it, i.e. the Consumat meta-model of human behaviour which is based on social psychology theory, as well as the mapping of the processes of adoption. By applying the model to the case of solar hot water systems, a number of insights were generated, including the need to influence households at the right time and place, i.e. when the existing hot water system breaks down. The best approach for doing so is by influencing plumbers to recommend the installation of solar hot water systems. This can be achieved by providing them with training or educational materials. A particularly important insight is that it is not only residents that need to be incentivised; there can be an ecosystem of types of agents, and it is necessary to identify the most effective intervention point in the system. In the case of solar hot water systems, this intervention point appears to be the plumbers. In the future, this model will also be applied to the context of water conservation and low carbon transport.
Appendix
TPseudo-code to describe the NED model. The total code is several thousand lines, but here is an extract of some key methods.
Go method, i.e. providing the main time step
to go
  while [year < endYear] [
    update-technologies
    update-discount
    set-price-of-energy-efficient-products
    evaluate-emissions-savings
    if InfluenceRecommendations = "a-strategy"
[update-sales-agent-cost-parameters]
    update-decision-parameters
    ask-householders-to-make-upgrade-decisions
    ask-sales-agents-to-sell-energy-efficient-products
    updated-uptake-levels
    set year year + timesteplength
    updateCO2eSavings
    tick]
end

Householders making a decision:
to make-decision
  if mode = "imitate" [imitate]
  if mode = "repeat" [upgrade-with-same]
  if mode = "inquire" [inquire]
  if mode = "optimize" [optimize]
end

Householders setting their mode of decision making
to set-householder-mode
  check-social-satisfaction
  check-existential-satisfaction
  ask householders [set-mode]
end

Setup method, i.e. creating the model:
to setup
  clear-all
  read-survey-data
  set-model-parameters
  setup-technology-options
  setup-gis-and-maps
  setup-social-network ;; this includes creating householder agents
  setup-householders
  setup-information-sources
  setup-sales-agents
  Reset-ticks
end
References
ACIL ALLEN CONSULTING (2015). Electricity Bill Benchmarks for Residential Customers. A Report to the Australian Energy Regulator.
AMAN, M. M., Jasmon, G. B., Mokhlis, H. and Bakar, A. H. A. (2013). Analysis of the performance of domestic lighting lamps. Energy Policy, 52, 482-500.
AUSTRALIAN GOVERNMENT. (2013). Energy | Your Home [Online]. Available: http://www.yourhome.gov.au/energy [Accessed 1st September 2016. Archived by WebCite® at http://www.webcitation.org/6wBBx1crL 2016].
AUSTRALIAN GOVERNMENT. (2014). National greenhouse accounts factors. Australian Government.
BARABÁSI, A.-L. (2002). Linked: The New Science of Networks. New York, NY: Perseus.
BASS, F. (1969). A new product growth for model consumer durables. Management Science, 15(5), 215–227. [doi:10.1287/mnsc.15.5.215]
BASS, F. M. (2004). Comments on "A new product growth for model consumer durables". Management Science, 50, 1833-1840.
BEAL, C. D., Bertone, E. and Stewart, R. A. (2012). Evaluating the energy and carbon reductions resulting from resource-efficient household stock. Energy and Buildings, 55, 422-432.
BENARTZI, S., Beshears, J., Milkman, K. L., Sunstein, C. R., Thaler, R. H., Shankar, M., Tucker-Ray, W., Congdon, W. J. and Galing, S. (2017). Should Governments Invest More in Nudging? Psychological Science, 28, 1041-1055. [doi:10.1177/0956797617702501]
BOSCHETTI, F., Grigg, N. J. and Enting, I. (2011). Modelling=conditional prediction. Ecological Complexity, 8, 86-91.
BROOK, B. W. and Barnosky, A. D. (2013). 'Quaternary extinctions and their link to climate change.' In L. Hannah (ed.), Saving a Million Species: Extinction Risk from Climate Change. Heidelberg: Springer, pp. 179-198.
CHOICE (2017). Prices on solar hot water systems [Online]. Available: https://www.choice.com.au/home-improvement/energy-saving/solar/buying-guides/solar-hot-water-systems [Accessed 4th December. Archived by WebCite® at http://www.webcitation.org/6wBBahPOf 2017].
CHUA, K. J., Chou, S. K., Yang, W. M. and Yan, J. (2013). Achieving better energy-efficient air conditioning - A review of technologies and strategies. Applied Energy, 104, 87-104.
CONIJN, J. G., Bindraban, P. S., Schröder, J. J. and Jongschaap, R. E. E. (2018). Can our global food system meet food demand within planetary boundaries? Agriculture, Ecosystems and Environment, 251, 244-256. [doi:10.1016/j.agee.2017.06.001]
DI MARIA, C., Ferreira, S. and Lazarova, E. (2010). Shedding light on the light bulb puzzle: The role of attitudes and perceptions in the adoption of energy efficient light bulbs. Scottish Journal of Political Economy, 57, 48-67. [doi:10.1111/j.1467-9485.2009.00506.x]
DRUMMOND, P. and Ekins, P. (2016). Reducing CO2 emissions from residential energy use. Building Research and Information, 44, 585-603.
EASLEY, D. and Kleinberg, J. (2010). Networks, Crowds, and Markets: Reasoning about a Highly Connected World. Cambridge University Press. [doi:10.1017/CBO9780511761942]
ESTIRI, H. (2015). Household Energy Consumption and Housing Choice in the U.S. Residential Sector. Housing Policy Debate, 26(1), 231–250.
FERRARI, D., Guthrie, K., Ott, S. and Thomson, R. (2012). Learning from interventions aimed at mainstreaming solar hot water in the Australian market. Energy Procedia, 30, 1401-1410. [doi:10.1016/j.egypro.2012.11.154]
FREDERIKS, E. R., Stenner, K. and Hobman, E. V. (2015). Household energy use: Applying behavioural economics to understand consumer decision-making and behaviour. Renewable and Sustainable Energy Reviews, 41, 1385-1394.
GELLER, H., Harrington, P., Rosenfeld, A. H., Tanishima, S. and Unander, F. (2006). Polices for increasing energy efficiency: Thirty years of experience in OECD countries. Energy Policy, 34(5), 556-573. [doi:10.1016/j.enpol.2005.11.010]
GILBERT, N. and Troitzsch, K. G. (2000). Simulation for the Social Scientist. Buckingham, PA: Open University Press.
GOTTS, N. M. and Polhill, G. (2017). Experiments with a model of domestic energy demand. Journal of Artificial Societies and Social Simualtion, 20(3), 11: https://www.jasss.org/20/3/11.html. [doi:10.18564/jasss.3467]
GRIMM, V., Berger, U., BastianseN, F., EliasseN, S., Ginot, V., Giske, J., Goss-Custard, J., Grand, T., Heinz, S. K., Huse, G., Huth, A., Jepsen, J. U., Jørgensen, C., Mooij, W. M., Müller, B., Pe'er, G., Piou, C., Railsback, S. F., Robbins, A. M., Robbins, M. M., Rossmanith, E., Rüger, N., Strand, E., Souissi, S., Stillman, R. A., Vabø, R., Visser, U. and DeAngelis, D. L. (2006). A standard protocol for describing individual-based and agent-based models. Ecological Modelling, 198, 115-126.
GRIMM, V., Berger, U., DeAngelis, D. L., Polhill, J. G., Giske, J. and Railsback, S. F. (2010). The ODD protocol: A review and first update. Ecological Modelling, 221, 2760-2768. [doi:10.1016/j.ecolmodel.2010.08.019]
GRUBER, H. and Verboven, F. (2001). The diffusion of mobile telecommunications services in the European Union. European Economic Review, 45, 577-588.
GÜNTHER, M., Stummer, C., Wakolbinger, L. M. and Wildpaner, M. (2011). An agent-based simulation approach for the new product diffusion of a novel biomass fuel. Journal of the Operational Research Society, 62, 12-20. [doi:10.1057/jors.2009.170]
GUPTA, R. and Jain, K. (2012). Diffusion of mobile telephony in India: An empirical study. Technological Forecasting and Social Change, 79, 709-715.
HALL, N., Romanach, L., COOK, S. and Meikle, S. (2013). Increasing energy-saving actions in low income households to achieve sustainability. Sustainability, 5(11), 4561-4577. [doi:10.3390/su5114561]
HETHERINGTON, J., Roetzel, A. and Fuller, R. (2015). The impact of occupant behaviour on residential greenhouse gas emissions reduction. Journal of Green Building, 10, 127-140.
HICKS, A. L. and Theis, T. L. (2014). An agent based approach to the potential for rebound resulting from evolution of residential lighting technologies. International Journal of Life Cycle Assessment, 19, 370-376. [doi:10.1007/s11367-013-0643-8]
HIGGINS, A., Foliente, G. and McNamara, C. (2011). Modelling intervention options to reduce GHG emissions in housing stock - A diffusion approach. Technological Forecasting and Social Change, 78, 621-634.
HIGGINS, A., Paevere, P., Gardner, J. and Quezada, G. (2012). Combining choice modelling and multi-criteria analysis for technology diffusion: An application to the uptake of electric vehicles. Technological Forecasting and Social Change, 79, 1399-1412. [doi:10.1016/j.techfore.2012.04.008]
HIGGINS, A., Syme, M., Mcgregor, J., Marquez, L. and Seo, S. (2014). Forecasting uptake of retrofit packages in office building stock under government incentives. Energy Policy, 65, 501-511.
HÖHNE, N., Blum, H., Fuglestvedt, J., Skeie, R. B., Kurosawa, A., Hu, G., Lowe, J., Gohar, L., Matthews, B., De Salles, A. C. N. and Ellermann, C. (2011). Contributions of individual countries' emissions to climate change and their uncertainty. Climatic Change, 106, 359-391. [doi:10.1007/s10584-010-9930-6]
HOVMAND, P. S. (2013). 'Group Model Building and Community-Based System Dynamics Process.' In Hovmand, P. S. (ed.), Community Based System Dynamics, New York, NY: Springer.
JAGER, W. and Janssen, M. (2012). An updated conceptual framework for integrated modeling of human decision making: The Consumat II. Complexity in the Real World @ ECCS 2012 - from policy intelligence to intelligent policy. Brussels.
JAGER, W., Janssen, M. A. and Viek, C. (2001). Experimentation with household dynamics: the consumat approach. International Journal of Sustainable Development, 4(1), 90-100.
JANSSEN, M. and Jager, W. (1999). An Integrated Approach to Simulating Behavioural Processes: A Case Study of the Lock-in of Consumption Patterns. Journal of Artificial Societies and Social Simulation, 2(2), 2: https://www.jasss.org/2/2/2.html. [doi:10.1504/IJSD.2001.001548]
KHAN, N. and Abas, N. (2011). Comparative study of energy saving light sources. Renewable and Sustainable Energy Reviews, 15(1), 296-309.
KIESLING, E., Günther, M., Stummer, C. and Wakolbinger, L. M. (2012). Agent-based simulation of innovation diffusion: A review. Central European Journal of Operations Research, 20(2), 183-230. [doi:10.1007/s10100-011-0210-y]
LIU, J.-L., Chang, P.-I. and Den, S.-J. (2013). Consumer willingness to pay for energy conservation: a comparison between revealed and stated preference method. Procedia Environmental Sciences, 17, 620-629.
MACAL, C. M. (2016). Everything you need to know about agent-based modelling and simulation. Journal of Simulation, 10(2), 144-156. [doi:10.1057/jos.2016.7]
MACAL, C. M. and North, M. J. (2005). Tutorial on agent-based modeling and simulation. Proceedings - Winter Simulation Conference, 2005. 2-15.
MAO, C., Zou, M., Liu, Y., Xue, W. and Li, M. (2015). Comparison of Agent-Based Modeling and Equation-Based Modeling for Transportation Behavioral Studies. CICTP 2015 - Efficient, Safe, and Green Multimodal Transportation - Proceedings of the 15th COTA International Conference of Transportation Professionals, 2015. 3610-3625. [doi:10.1061/9780784479292.334]
MARQUEZ, L., Higgins, A., Sendaba, B. and Mcgregor, J. (2013). Understanding Influence Networks Using An Agent-Based Model of Technology Adoption for Commercial Building Retrofits. ISORAP 2013. Marrakesh, Morocco.
MOGLIA, M., Cook, S. and Mcgregor, J. (2017). A review of Agent-Based Modelling of technology diffusion with special reference to residential energy efficiency. Sustainable Cities and Society, 31, 173-182. [doi:10.1016/j.scs.2017.03.006]
MOGLIA, M., Perez, P. and Burn, S. (2010). Modelling an urban water system on the edge of chaos. Environmental Modelling & Software, 25(12), 1528-1538.
MOORE, A. D., Urmee, T., Bahri, P. A., Rezvani, S. and Baverstock, G. F. (2017). Life cycle assessment of domestic hot water systems in Australia. Renewable Energy, 103, 187-196. [doi:10.1016/j.renene.2016.09.062]
NEWTON, P. and Meyer, D. (2013). Exploring the attitudes-action gap in household resource consumption: Does "Environmental Lifestyle" segmentation align with consumer behaviour? Sustainability, 5(3), 1211-1233.
NOONAN, D. S., Hsieh, L. H. C. and Matisoff, D. (2013). Spatial Effects in Energy-Efficient Residential HVAC Technology Adoption. Environment and Behavior, 45(4), 476-503. [doi:10.1177/0013916511421664]
NSW GOVERNMENT (2016). Draft Plan to Save NSW Energy and Money. Sydney, Australia.
NSW GOVERNMENT (2018). Energy Savings Scheme [Online]. Available: https://www.ess.nsw.gov.au/Home [Accessed 3rd January. Archived by WebCite® at http://www.webcitation.org/6wBBn8WgZ 2018].
OECD (2014). Greening Household Behaviour: A Review for Policy Makers. OECD Publishing.
OFFICE OF ENVIRONMENT AND HERITAGE NSW (2014a). Sustainable households survey of homeowners for the NSW Office of Environment and Heritage. In: Donnelly, D., Vittles, P. and Bacchetto, M. (eds.). Sydney, Australia.
OFFICE OF ENVIRONMENT AND HERITAGE NSW (2014b). Sustainable households: Survey of tradespeople. Sydney, Australia.
PEREZ, P. and Batten, D. F. (2006). Complex Science for a Complex World: Exploring Human Ecosystems with Agents. Canberra: ANU E Press.
PLATINUM ELECTRICIANS (2018). How Much Power is Needed to Run an Average Home? [Online]. Available: https://www.platinumelectricians.com.au/blog/power-needed-run-average-home/ [Accessed 3rd January. Archived by WebCite® athttp://www.webcitation.org/6wBDTqsVu 2018].
PODKALICKA, A. (2018). Actor, intermediary, and context: locating media as part of consumption and home renovation practice. Journal of Communication Research and Practice, In Press.
POLHILL, G. and Gotts, N. (2017). How precise are the specifications of a psychological theory? Comparing implementations of Lindenberg and Steg’s goal-framing theory of everyday pro-environmental behaviour. In Advances in Social Simulation 2015, (pp. 341–354). Berlin/Heidelberg: Springer. [doi:10.1007/978-3-319-47253-9_31]
RAI, V. and Henry, A. D. (2016). Agent-based modelling of consumer energy choices. Nature Climate Change, 6(6), 556-562.
ROCKSTRÖM, J., Steffen, W., Noone, K., Persson, A., Chapin III, F. S., Lambin, E., Lenton, T. M., Scheffer, M., Folke, C., Schellnhuber, H. J., Nykvist, B., De Wit, C. A., Hughes, T., Van Der Leeuw, S., Rodhe, H., Sörlin, S., Snyder, P. K., Costanza, R., Svedin, U., Falkenmark, M., Karlberg, L., Corell, R. W., Fabry, V. J., Hansen, J., Walker, B., Liverman, D., Richardson, K., Crutzen, P. and Foley, J. (2009). Planetary boundaries: Exploring the safe operating space for humanity. Ecology and Society, 14(2), 32. [doi:10.5751/ES-03180-140232]
ROGERS, E. (1962). Diffusion of Innovations. New York: Simon and Schuster.
ROSENBERG, B. C. (2011). Home Improvement: Domestic Taste, DIY, and the Property Market. Home Cultures, 8(1), 5-24. [doi:10.2752/175174211X12863597046578]
SOPHA, B. M., Klӧckner, C. A. and Febrianti, D. (2017). Using agent-based modeling to explore policy options supporting adoption of natural gas vehicles in Indonesia. Journal of Environmental Psychology, 52, 149-165. [doi:10.1016/j.jenvp.2016.06.002]
SOPHA, B. M., Klöckner, C. A. and Hertwich, E. G. (2013). Adoption and diffusion of heating systems in Norway: Coupling agent-based modeling with empirical research. Environmental Innovation and Societal Transitions, 8, 42-61.
SWAN, L. G. and Ugursal, V. I. (2009). Modeling of end-use energy consumption in the residential sector: A review of modeling techniques. Renewable and Sustainable Energy Reviews, 13(8), 1819-1835.
THALER, R. H. (1985). Mental accounting and consumer choice. Marketing Science, 4(3), 199-214. [doi:10.1287/mksc.1070.0330]
THUILLER, W., Lavorel, S., Araújo, M. B., Sykes, M. T. and Prentice, I. C. (2005). Climate change threats to plant diversity in Europe. Proceedings of the National Academy of Sciences of the United States of America, 102(23), 8245-8250.
TRAN, M. (2012). Agent-behaviour and network influence on energy innovation diffusion. Communications in Nonlinear Science and Numerical Simulation, 17(9), 3682-3695. [doi:10.1016/j.cnsns.2012.01.016]
VENNIX, J. (1996). Group model building. New York, NY: Wiley & Sons.
VLIET, O. V., Vries, B. D., Faaij, A., Turkenburg, W. and Jager, W. (2010). Multi-agent simulation of adoption of alternative fuels. Transportation Research Part D: Transport and Environment, 15(6), 326-342. [doi:10.1016/j.trd.2010.03.006]
WATTS, D. J. and Strogatz, S. H. (1998). Collective dynamics of 'small-world' networks. Nature, 393(6684), 409-410.
WILENSKY, U. (1999). NetLogo [Online]. Available: https://ccl.northwestern.edu/netlogo/.
WILSON, C., Crane, L. and Chryssochoidis, G. (2015). Why do homeowners renovate energy efficiently? Contrasting perspectives and implications for policy. Energy Research and Social Science, 7, 12-22.
WWW.AUSTRALIANHOTWATER.COM.AU/. (2017). 6 Steps to Calculating the Price of a Hot Water System [Online]. Available: https://australianhotwater.com.au/6-steps-calculating-price-hot-water-system/ [Accessed 4th December. Archived by WebCite® at http://www.webcitation.org/6wBAaqZH1 2017].
ZALASIEWICZ, J. A. N., Williams, M., Steffen, W. and Crutzen, P. (2010). The new world of the anthropocene. Environmental Science and Technology, 44, 2228-2231. [doi:10.1021/es903118j]
ZHANG, T., Gensler, S. and Garcia, R. (2011). A study of the diffusion of alternative fuel vehicles: An agent-based modeling approach. Journal of Product Innovation Management, 28(2), 152-168.