
Introduction
The quantity of data and processes used in modeling projects has been dramatically increasing in recent years due to the progress in computation capability and to the popularity of new approaches such as open data. Modelers face an increasing difficulty in analyzing and modeling complex systems that consist of many heterogeneous entities.
Today, a large number of models exist to represent various complex phenomena. Adapting existing models would be relevant in order to avoid dealing with the complexity of writing and studying a new model from scratch, but this faces the major difficulty to reuse them because of a lack of transparency in descriptions (Richiardi et al. 2006; Hinkelmann et al. 2011; Müller et al. 2014; Donkin et al. 2017).
The need for a standard protocol to describe and share agent-based models has emerged from the community. Such descriptions make it easier to understand and replicate models by researchers from various disciplines. Grimm et al. (2006) promoted a description protocol calledODD (Overview, Design concepts, Details) to structure the information about an ABM in the same sequence. Updated in Grimm et al. (2010), this protocol is widely used by the scientific community for describing and comparing variant models. It was also extended to meet other aims not supplied in the original version, such as collaboration design (Nguyen et al. 2011) and modeling human decision-making (Müller et al. 2013).
The ODD protocol and extensions, languages (e.g., AUML (Bauer et al. 2001)), methodologies (e.g. Gaia (Zambonelli et al. 2003), INGENIAS (Pavón et al. 2005), TRACE (Schmolke et al. 2010)) and ontologies (Livet et al. 2010) focus on the model itself. They describe model structure, dynamics, inputs, and outputs. This is sufficient to resolve significant problems and satisfy most purposes such as dissemination, comprehension, assessment, development, replication, comparison and theory building (Müller et al. 2014).
However, no standard or practice manual formalizes the use of models within a contextualized and empirical project (Smajgl & Barreteau 2014; Bruch & Atwell 2015). Neither protocol nor methodology gives a data point of view in the development of agent-based models. It is quite urgent to promote such an approach because of the growing popularity of empirical multi-agent models over the last few years (Geller 2014). The community needs more transparency in the use of theory and empirical data in modeling process (Barreteau & Smajgl 2014).
Overview of ODD Protocol and Extensions
ODD protocol
The ODD (Overview, Design concepts, Details) (Grimm et al. 2006) was introduced to describe agent-based models, with a novel specification approach. Grimm et al. (2006) propose a minimal plain text structure to specify entities, equations, rules, and schedules contained by ABMs. They advise to always keep the same sequence to ease the read, the understanding, and the replication, and definitely to make ODD a standard protocol.
After evaluating previous uses of the ODD, Grimm et al. (2010) were convinced that the protocol needs improvement to fix limitations and ambiguities. In their paper, they promoted a slightly modified structure of the protocol to guarantee greater clarity and efficiency.
ODD upgrades contributed to the extensive use of ODD (1794 citations for the first version, 1245 for the second one – Google Scholar, the December/15/2017). For the complex systems community, ODD also appears as an excellent tool to disseminate, evaluate and assess various multi-agent models (Polhill et al. 2008; Le et al. 2010; Lammoglia 2011; Balbi et al. 2013).
In fact, creating together textual descriptions and models by following methodologies (e.g. ODD, UML, ...) improves modeling process and exchanges between scientific disciplines. It opens new perspectives such as dissemination, comprehension, assessment, replication, comparison, theory building, and code generation (Müller et al. 2014). However, major modeling projects focus on the model design from the theory of the literature. Data are not taken into account in the model design, and they are separately integrated in an ad-hoc manner (Truong et al. 2013; Wang 2014; Holm et al. 2016; Groeneveld et al. 2017). That is why developed models are often very theoretical and tend to be far away from the reality (Bykovsky 2010; Filatova 2015).
Using data to design and parameterize models is still a methodological challenge (Geller 2014) for which protocols such as ODD seem to respond to. Also, some relevant issues have been raised by ODD creators (Grimm et al. 2006), who advised to share input files and the source code of the model. But, sometimes it is not possible or suitable due to legacy and privacy. This practice is nowadays still rare (O’Sullivan et al. 2016) but under growth (Janssen 2017).
ODD+D: an extension of ODD
Some researchers noticed that ODD does not give sufficient response to their needs. They extended the original structure and adapted it to their specific cases. For instance, Nguyen et al. (2011) created a common representation (called CoODD) to specify collaboration/participation rules, while Hinkelmann et al. (2011) added an algebraic specification to describe ABMs with algebraic structure.
ODD was designed for ecological modeling and is not much suitable for socioeconomic models (Müller et al. 2013). ODD shows its limits when intelligent and social entities (as humans) are integrated into the model. The protocol does not support human behaviors (decisions, adaptation, and learning) well.
To overcome this limitation, the authors presented a new extension called ODD+D (ODD + Decision) that aims at introducing human decision-making. For that purpose Müller et al. (2013) added some blocks into ODD without modifying the original form. This new extension was used and discussed in many research studies focusing on modeling human societies to describe agent-based models with decision aspect (Filatova 2015; Klabunde et al. 2015).
However, ODD+D still has the same limits as ODD about integrating data. Authors of ODD+D (Müller et al. 2013) tried to include some purposes of this work in their protocol, under the element "Theoretical and empirical background". But it does not satisfy all the modeling needs about formalizing the use of empirical data in the model.
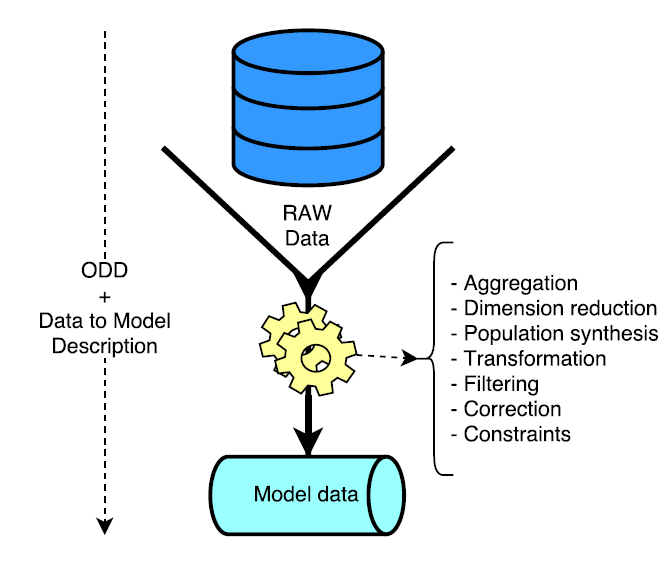
In what follows, we fill this gap by extending ODD+Dand introducing data-oriented directives in the "Input data" block. This improvement emphasizes the link between data and model. This accurate description facilitates using and re-using a model with other data sets, such as raw data from surveys or unprocessed databases (Figure 1).
Shortcomings of the ODD Protocol for Describing Data Linking
Why using data?
In recent years, agent-based models are becoming more and more designed based on empirical data in the aim of approaching the reality (Hassan et al. 2008), particularly in social sciences where research is more data-driven and inherently empirical (Sun et al. 2016; Groeneveld et al. 2017; Williams et al. 2017). Positioning models in a theoretical context (toy models) increases the gap between the model and the reality. It may question the contribution of such models (Lammoglia 2011; Klabunde & Willekens 2016) for the case study, especially when realism is the goal of the modeling process (Smajgl & Barreteau 2014). Therefore, empirical knowledge has to be integrated in modeling practice through specific strategies and methods (Boero & Squazzoni 2005; Filatova 2015), since it can directly address essential modeling needs, such as spatiality, temporal resolution, and behavioural rules (Altaweel et al. 2010).
Hence, data are not used just at the end of the modeling process to obtain results. It is a crucial resource along the modeling process to produce knowledge, configure agents, determine behaviors, validate, select scenarios (Geller 2014), and reveal the relevant data sources and how they were implemented (Barreteau & Smajgl 2014). This kind of data-driven models can contribute to obtaining simulation results that fit into observations of the corresponding target (Hassan et al. 2010).
Creating a model from empirical data favors the confidence of end-users because it reproduces an observed phenomenon and could be validated thanks to real data (Hassan et al. 2008). Hence, consistent use of empirical data increases the trust of various stakeholders in any model (Filatova 2015). Nevertheless, the use of real data must be justified by the research goal.
Introducing data has an impact on the model complexity for the dynamics and complicatedness of the model structure (Grimm et al. 2005). Thus, such a model becomes more difficult to understand, explain, share and disseminate (Hassan et al. 2008). Modelers are faced with a trade-off between designing theoretically-grounded models (with global assumptions) and empirical models (with contextualized assumptions) (Boero & Squazzoni 2005; O’Sullivan et al. 2016; Sun et al. 2016).
It is difficult to associate disciplinary theory with empirical data, but it is necessary to bring actual response for decision-making. What is the suitable amount of data that should be introduced in a model? It is a real debate within the agent-based community (Sansores et al. 2005; Bruch & Atwell 2015; Sun et al. 2016). Filatova (2015) outlines some challenges such as:
- Maintaining a link between empirical data and theory;
- The necessity to collect case-specific data to match the design of an ABM;
- The difficulty in replication and generalization of the results;
- The translation of qualitative data into formal rules when coding.
Providing methods and languages that describe data, the model and relationships between them may ease the development and the promotion of an environment for decision-making. This is the research we are developing by combining natural descriptive model (ODD) and implementation models (Geller 2014; Sun et al. 2016) with data-model mapping description.
Shortcomings of existing descriptions
In this subsection, we will show the most critical shortcomings of the current descriptions, and how describing data and data-model connections can improve the empirical foundations of agent-based models.
For example, Klabunde et al. (2015) and Filatova (2015) promote an agent-based decision model of migration and an empirical agent-based land market, respectively. These two models (as major ODD+D descriptions) use their own manner to describe data. It shows an inconsistency in the description, and a lack of a unified and comprehensible approach. They do not provide sufficient information about empirical data, and how it is structured and used to design and develop the model. The connection between data and model entities is quite confusing: (i) agents’ state variables are hard to locate in data; (ii) the relationships between the data structure and the model architecture are omitted. Also, the few information and descriptions given about data are dispersed between overall the ODD+D document, which hinders reading and understanding.
This insufficiency makes it very difficult to reproduce the data-model connections of the two previous examples. Hence, the gap between data and model persists and needs more description to be bridged. We tried to solve the problem by extending the two descriptions with our proposal (Appendices B and C).
Despite the popularity of agent-based models, there is still no accepted methodological standard for thesemodels (Richiardi et al. 2006; Hinkelmann et al. 2011) especially in the empirical research (Bruch & Atwell 2015). Popper & Pichler (2015) argue that the ODD protocol covers foremost the aspect of model definition, but it does not document: (i) the process of modeling; (ii) the theoretical knowledge involved; (iii) the development of the model; and (iv) the analysis of results. A model description should also make transparent where and which data have been used for its creation, development, calibration, and validation (Barreteau & Smajgl 2014; Groeneveld et al. 2017). By answering questions about the choice of methods and parameterization, the reader can reproduce not only the model but also get a holistic view of its context. Such a view may reduce misunderstandings and misinterpretations about the model and help to successfully replicate its structure and dynamics (Donkin et al. 2017).
How to solve the empirical challenge?
To solve the empirical challenge of agent-based models, methods should take into account the following points:
Relation to related data – a formal link between data structure and model entities must be established. According to the collection approach and the size of the sample, data have a limited validity domain. The modeler has to consider that along the modeling process. Thus, metadata and the initial context are vital points to assess the relevance of these data to the research question (Altaweel et al. 2010).
Note that data are often used for unforeseen projects intended to address various questions. A preprocessing must be done to understand and to format them to the new question. It conducts to filter away unnecessary data complexity (Hassan et al. 2008; Geller 2014) and contributes to creating new knowledge throughout the employed expertise. This scientific work should be formalized and capitalized for further research (Siebers & Aickelin 2008).
Relation to involved participants – experts give meaning to data. Their knowledge helps to identify the structure (agents, environment) and dynamics (behaviors) of the model (Hassan et al. 2010; Filatova 2015). Indeed, from interdisciplinary collaboration (experts, modelers, stakeholders), new points of view will emerge. That is why this progressive knowledge should be formalized along the modeling process (Barreteau et al. 2003; Barreteau & Smajgl 2014).
Transparency – it allows to redo the modeling process by any scientist outside the initial team. A transparent approach implies notifying scientific choices, analysis methods, tools and source codes. Transparency is essential for the capitalization of scientific knowledge (Janssen 2017).
For example, a transparent model that reproduces urban dynamics based on urban data can be used again for another city. The initial preprocessing could also be discussed and applied strictly to analyze the data of the new city. Such reuse is allowed by the readability of description/code, the accuracy of analysis details that results from a modeling project. Also, transparency eases confidence given by any disciplines and exchanges about the expected model (Anh et al. 2015).
Structuring – the structure is a guideline for users, which permits to ask the right modeling questions, to obtain correct answers and to formalize them comprehensively. Therefore it must ensure transparency, relation to related data and relation to involved participants.
A data-modeling method must invite involved participants to follow structures and outlines, to produce accurate and understandable descriptions. It is also a manual for anyone to read these descriptions, to analyze and to replicate the process (Barreteau & Smajgl 2014). Such a method is based on suitable languages, protocols and a suite that: (i) eases modeling process and data mapping; (ii) allows multidisciplinary exchanges; (iii) and simulates.
ODD+2D: Extending ODD+D for Describing Data in ABMs
ODD can be overdone for straightforward models (Grimm et al. 2010). In such a case the documentation may be done by using continuous text instead of separate document subsections for each ODDelement (Popper & Pichler 2015). Also, any structured method that organizes data to be directly applicable for modeling projects can facilitate model creation (Altaweel et al. 2010). However, ODD is more efficient in disseminating, understanding and structuring the design of models (Polhill et al. 2008; Wolf et al. 2013) in comparison to other frameworks such as MR POTATOHEAD framework (Parker et al. 2008), Dahlem ABM Documentation Guidelines (Wolf et al. 2013) and Characterization and Parameterization (CAP) framework (Smajgl & Barreteau 2014).
Therefore, an extension of ODD protocol would be suitable and much easier to understand and use than another dedicated method of describing data, such as Delineate, Structure, and Gather (DSG) proposed by Altaweel et al. (2010). The emphasis on data to design models can be reflected by soft adaptations of the ODD protocol (Geller 2014).
The next subsection presents a collaborative approach to developing and describing empirically agent-based models called DAMap. It is based on a diagram that maps data to the model. This diagram permits to generate GAML (GAma Modeling Language) implementation model and a textual model extending the ODD protocol.
DAMap (Data to Agent Mapping) approach
The experience shows that elaborating both textual model and design model in the same modeling process favors taking into account participants’ interests (researchers and stakeholders) (Sargent 2011). Exchanges between participants from various domains should be engaged to collect input data, conceptualize, and generalize the model with scientific knowledge and hypothesis. They are the key to the success to build a usable model in line with the local case study and scientific advances. A short iterative cycle between these two models establishment is a reliable approach to ensure the development of a usable model.
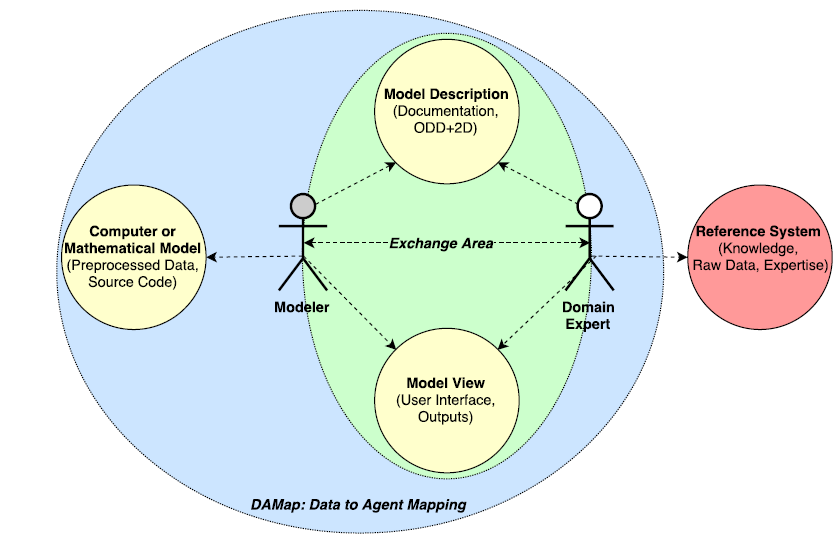
We propose to make describing the model part of the development cycle and keep the connection between the three parts: model code, description, and view. We call this scheme DAMap (Data to Agent Mapping) approach as shown in Figure 2. The modeler elaborates the model code and collaborates with the domain expert at the same time, to produce the model description interactively. The two actors test and validate the simulation results and outputs (View), and update the other components: Code and Description. This architecture simplifies model comprehension and encourages the reusability of each part outcomes. Domain experts, stakeholders and modelers are actors of the modeling process and take roles according to their skills (Jones et al. 2009) (Figure 2).
To make this approach possible, we are developing in parallel a graphical user interface (GUI) called DAMap (Laatabi et al. 2016). This interface allows the user to design a diagram of mapping between data elements and components of the agent model. Thanks to dedicated tools, the user is guided to generate a natural (ODD+2D description) and implementation (GAMA code) models.
As Groeneveld et al. (2017) argued, the model description should be conducted in collaboration with someone who has not implemented the model. This actor may identify redundant, confusing and forgotten details: people outside classical modeling process are not burdened with the technical difficulties of the project.
Note that this paper focuses on the ODD+2D extension, so details on DAMap method (Laatabi et al. 2016) are not given here. Nevertheless, DAMap diagram is provided because it is included as a part of theODD+2Ddescription.
ODD+2D: ODD + Decision + Data
The ODD+2D protocol extends ODD+D and allows specifying the usage of data inside a model. It gives new ways to understand and consider data, for a better integration into agent models. By using this protocol, we ought to favor model reuse for another case study. Data-model specification determines using application domains of a model and data that could be applied. It also helps to feed a model with new data of a new case study.
ODD based protocols are also tools for modelers to check if all necessary information is available for the model understanding and replicating (Groeneveld et al. 2017). ODD+2D adds this aspect for data description.
Such protocol can also be assimilated to a media that synthesizes available data in an understandable form. Such description is vital in modeling process to collect data and to make an efficient contextualized analysis of them to extract information and feed the modeling process.
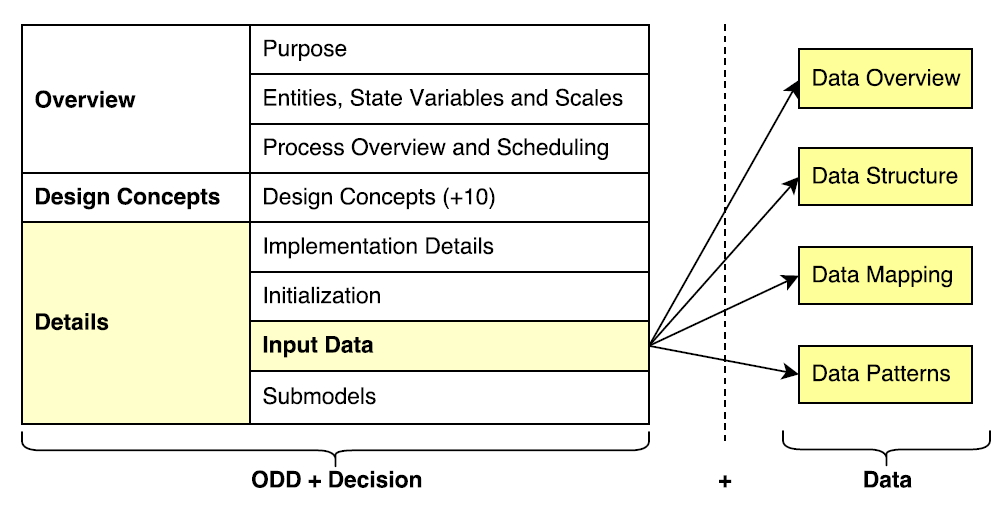
ODD+2DreusesODD+Darchitectureandadds four newblocks inside InputData part (Figure 3): (i) data overview; (ii) data structure; (iii) data mapping; (iv) data patterns. The overview permits to disseminate data context. Structure is about data scheme and hierarchy. Mapping allows to project structure on the model. Patterns describes the mapping and models dynamics. These four parts are detailed in this section after that.
This add-on was imagined in order to: (i) be synthetic and precise; (ii) keep sources and understand the done usage of data; (iii) give enough information to use the model with another data; (iv) inform readers about the validity of domain model; (v) facilitate exchanges between disciplines. As such, ODD+2D combines both textual and graphical descriptions, to be understood by a large community.
Data overview
Questions to answer: Where does data come from? How is it collected? What is the level of available data? How is it structured? How are data tables built from the survey? These are the central questions that users should answer to qualify the data they introduce in the model.
Format: Plain text.
Contents: Used databases are titled and associated with a short description. Authors must not forget to explain their role in the modeling project and which parts are used. Giving a complete overview of data is beneficial to keep in mind available data along the modeling process (Hassan et al. 2008) and to know briefly which kind of data are required by the model. Finally, authors should not forget to associate a hypertext link with each database to allow readers to look for more information.
Data structure
Questions to answer: What are the variables, entities and classes available in data? What do they represent? What is their format? What are their properties? How are they linked?
Format: Plain text, tabular, diagrams.
Contents: This block describes the structure of the dataset, and specifies the different classes that can become agents in the model. Users are free to explain data structure with plain text, tabular or diagrams, but the clarity and the accuracy of the description is the key to the understanding. Thus, we advise to describe each database with a formalized and unified language such as basic tabular or UML Class diagram; one diagram per database is required. Additional plain text can be fair to give more information about schema for a better understanding and to assume an expertise about data.
Describing data structure plays an essential role in the DAMap method because it allows having an excellent overview of available data and facilitates conceptualization of the model then (Hassan et al. 2008). Additionally, all data of database may be described in schema (used and unused data) to avoid hidden links that can make data-model confusing (Groeneveld et al. 2017).
Data mapping
Questions to answer: How are data selected to form the agent entities? How is agent population generated and synthesized? How are data transformed to meet the purpose of the study and the model needs? What are the transformations that were made? How are variables structured? How are behaviors built based on relationships between attributes? How are new attributes constructed? What are the constraints that were applied to the original variables?
Format: Plain text, DAMap diagram.
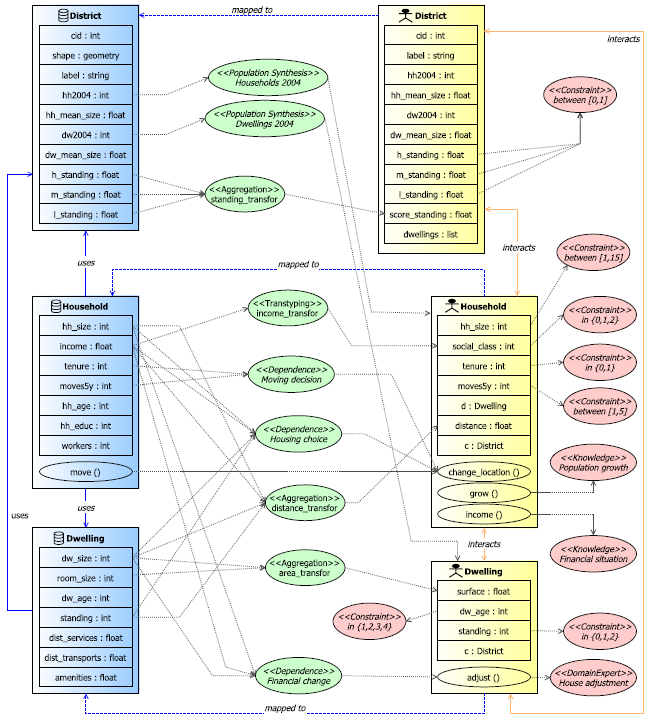
Contents: This block describes the links between data and the agent-based model. Users are welcome to create a DAMap diagram (e.g. Figure 5) that gives a synthetic and accurate model of these links. The diagram shows the overall mapping between database schema model (left) and agent-based model (right), and the processing required to transform empirical data into agent characteristics. It shows, for example, how few columns of database tables are aggregated to determine one characteristic of an agent thanks to a mapping pattern of type aggregation.
DAMap proposes two categories of patterns, mapping patterns, and assumption patterns.
Mapping patterns determine the category of the link between data and agent and also the mapping/transformation processing. We distinguish five patterns:
«mapped to»: – this pattern tells about which agent is linked to which data entity. It means that state variables of agents are linked by name to data attributes. It allows reducing displayed links and prevents overfull models.«aggregation»: – this element explains how new variables are built from separated attributes. It defines thus transformations by using expressions composed of operators such "sum" or "mean".«transtyping»: – indicates casting rules between a data attribute and a state variable of an agent, for example,to convert incometo a social category (social_class).«pop_synthesis»– determines which entity is generatedandthe synthetic population size (Household, n=hh2004).«dependence»– indicates how data attributes are associated to explain behaviors.
«constraint»– determines a constraint on a state variable, to prevent the unexpected use of model variables. It permits to keep the integrity of the model (between [0,1], in{0,1,2}).«knowledge»– expresses a knowledge about the phenomenon from the literature. It allows justifying current choices by previous studies, research and results.«domainExpert»– outlines knowledge that comes from the experience and practice of the domain expert. This knowledge might not often be found in the scientific literature.
Note that, the DAMap meta-model is explained in more details in (Laatabi et al. 2016). It was developed accordingly to recommendations that argue for the incorporation of UML diagrams into agent-based documentations (Amouroux 2011; Bersini 2012; Bruch & Atwell 2015; Sun et al. 2016), and the emphasis on the importance of using a graphical model for a better design of attractive, readable and reproducible models (Groeneveld et al. 2017).
Data patterns
Questions to answer: What are the relationships and patterns that exist in data? Are they translated into actions and behaviors in the model? And how do some attribute variations affect other variables and then agent behaviors?
Format: Plain text, formal language, algorithm.
Contents: This block gives a list of patterns and formalizes relations between the database and the agents. It is an excellent description of transformation rules that convert data to agent characteristics. As a result, modelers are advised to specify with accuracy rules by writing equations, formal predicates or algorithms. Plain text documentation could accompany these specifications for a better understanding.
Users do not concede the accuracy of this specification of these patterns because the transparency, the readability and the understanding of data analysis are depending on it. Thanks to it, modelerswhoread the ODD+2D description can redo data analysis and apply or modify it for another case study.
Describing Residential Mobility in Marrakesh with ODD+D
This section follows the ODD+D protocol to describe an agent-based model that reproduces residential mobility observed in Marrakesh.
Marrakesh has undergone profound structural changes to tend to a more sustainable city. Urban programs are now redrawing transportation, housing, services: (i) a new urban transportation system based on ecological vehicle is projected; (ii) new districts are under construction; and (iii) economical services are evolving. Consequently, daily mobility, residential mobility, and citizen habits are profoundly changing and affecting the relevance of structural decision. A consensus should be found to take into account environmental objectives, economic developments, and inhabitant wishes.
We developed a model of residential dynamics to understand the impact of the decision on urban dynamics. The model focuses on the main factors that make people decide to change their places of living, such as income (Jordan et al. 2012), household size (Clark 2012), and properties of the dwelling such as size (expressed by the surface area or by the number of bedrooms) and standing.
Urban decision makers consider residential migration as a process of push and pull between an origin and a destination (Lee 1966). Households try to adjust their dwelling to the evolution of their needs over time. It is caused by many socioeconomic, housing and environmental factors that can be used and analyzed to study its consequences.
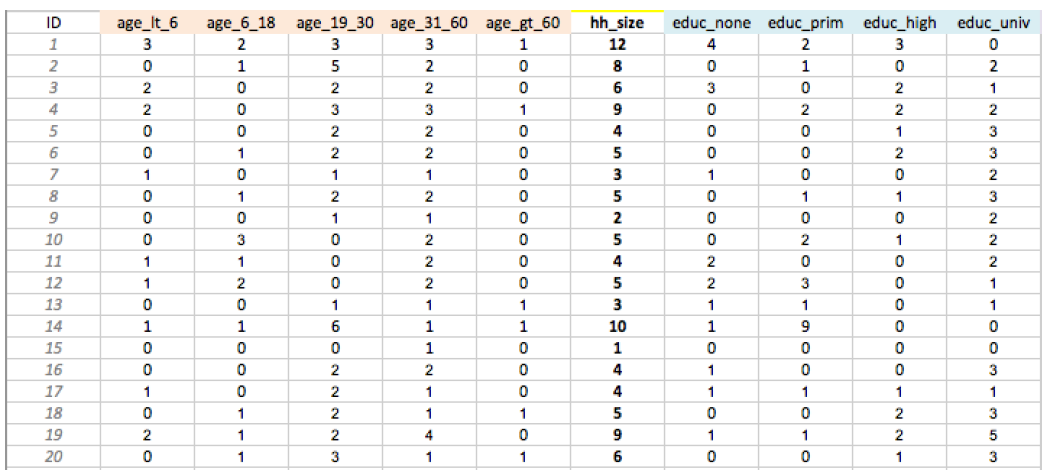
To conduct this study, we collected various types of data: (i) a survey on residential mobility that we performed; reports produced by the administration of the municipality; (iii) exchanges with local administrations, especially the housing observatory. Data were compiled in few spreadsheets and GIS with their own structure. For example, the dataset storing the survey is organized into categories regrouping 69 attributes about the house-hold structure, the actual dwelling and the next preference that the household wishes to have. Most of the values are coded in numerical form as depicted in Figure 4, and a codebook is joined with data to explain the meaning of each value (the corresponding file data.xlsx is provided in Appendix A).
We now present the model we are developing, following the structure of the ODD+D protocol. In this paper, this model is considered as a case study to outline the limits of ODD+D to describe data and show how ODD+2D gives a response.
Overview
Purpose
The purpose of the model is to simulate residential mobility of Marrakesh over time to understand how different factors (demographic, socioeconomic, housing, environmental) affect this phenomenon. The model is designed for urban researchers who can use the simulation to test their hypotheses and scenarios, to help the decision makers. Urban dynamics are modeled by agents (Districts, Dwellings, and Households) and interactions between them such as moving decisions and relocation.
Entities, state variables, and scales
This model focuses on the residential dynamics at the town scale during 25 years. Stakeholders usually measure this mobility year by year. To get the same output data and enough accuracy in simulation, time step represents one month. The model is composed of three entities: household, dwelling, and district.
Household – models a group of people that belong to the same family. Four state variables qualify it: (i) social_class (income) with three classes: poor, middle and rich class; (ii) hh_size for the number of inhabitants living in the family; (iii) tenure (housing tenure) with two classes (owner or renter); and (iv) moves5y for the number of relocations during the last five years.
Dwelling – represents the habitat unit, an accommodation that can be shared by one or many households. According to the number of bedrooms, a house or an apartment in Marrakesh is sometimes shared by few families. The dwelling is characterized by: (i) surface of the internal area; (ii) dw_age representing the dwelling age in years; and (iii) standing which tells about the level of housing standing (low, medium or high standing).
District – models an area of the city containing a set of dwellings. The model focuses on Marrakesh. It extracts data from a GIS (shapefile) to configure the simulation at the start-up. This file references six districts; each of them is described by an identifier (cid), a label (label) and a space occupation. In addition, they are qualified by a set of parameters about dwellings and households, namely: (i) initial number of dwellings (dw2004) and households (hh2004); (ii) dwelling (dw_mean_size) and household (hh_mean_size) mean sizes; and (iii) the standing rates of dwellings (l_standing, m_standing, h_standing).
Process overview and scheduling
At each time step (each month), a set of households (a percentage given as a parameter) constrained by their number of past moves and their homestead mode, check all the districts to see if there is one closer to their needs. In the chosen district (which may be the same as the current one), each household checks a given number of available dwellings to see if there is a better choice (a dwelling that is closer to its profile) and if it is the case they move to the best available choice. The distance between the household’s preference and both the district and the dwelling is calculated as the Euclidean distance between the attributes of each entity: house-hold (income, size), dwelling (standing, size) and district (mean standing, mean size). This dynamic alternates the state of districts, households, and dwellings.
Design concepts
- Theoretical and empirical background – migration and housing decisions are the central concepts of the model. The complexity comes from the competition to access the restricted resources that affect the household choice when they migrate. Deciding to move or not is based on the perception of the household about the availability of a better alternative that will increase the household satisfaction. This decision is constrained by its characteristics especially the income and the household size. The concept of choice-preference in the context of residential mobility is discussed in the literature (Lee 1966; Zinas & Jusan 2010). It was already used in a previous work about residential relocation in Marrakesh (Laatabi et al. 2015). Statistics from a local administration called HCP (http://rgphentableaux.hcp.ma/) give household growth and building rates.
- Individual decision-making – each household agent decides to move or not from the current dwelling to a new one. By performing this action, it wishes to maximize its housing satisfaction (minimize the distance between the current choice and the preference). This decision is taken in two stages: inter-district choice and intra-district (dwelling) choice. An agent moves when it finds a house that is closer to its profile. Constraints such as income and household size are taken into account in the distance calculation. At each step, some attributes may change. As a consequence, the household may move again to adjust its dwelling to its new needs.
- Learning – the decision process does not include any learning.
- Individual sensing – every household has only a limited random set of choices (dwellings) at every time step. The chosen dwelling may not be the best one, and the household may never find the closest house to its preference as its knowledge and perception of the environment are limited. The decision is uncertain.
- Individual prediction – the agents do not make any predictions.
- Interaction – the interactions are between households, dwelling and district agents. Each household compares its housing needs (preference) to its current choice (dwelling), and to its available choices be-fore making a decision. Due to the limited number of available dwellings, there is a competition between households to access these limited resources. So the model is only based on stigmergic interactions, but not direct ones.
- Collectives – dwellings are located in a unique district. Dwellings inside a district are impacted by the evolution of the housing stock and by human migration. Households of the same district form also a community that is altered by migration and population growth.
- Heterogeneity – we do not have a real heterogeneity in the model, as agents (households and dwellings) differ only in their state variables and location. The computation of the distance and the decision-making process are done in the same way.
- Stochasticity – dwellings and households are randomly localized in the space by district. According to the district characteristics, normal law parameters are determined to initialize state variables for dwellings and households. At initialization, households are randomly placed inside dwellings.
- Observation – the model outputs several data identified by stakeholders to make a decision or for validation such as (i) the spatial distribution of households over dwellings, (ii) the evolution of population and housing stock by district, (iii) the main characteristics of the agents and their movements between districts. The satisfaction level is also plotted to compare it with the different socioeconomic factors of the population, as well as dwellings characteristics and vacancy rates.
Details
Implementation details
The model is implemented in GAML language under Gama platform (Taillandier et al. 2010), an open-source and multi-platform so ware for multi-agent simulations.
Initialization
The simulation is initialized with the available statistics saved in the GIS shapefile (number of dwellings and households, mean values for household and dwelling sizes). Continuous state variables are initialized using a function of normal distribution. Categorical variables are initialized by using a uniform law. Used data are loaded from source files at the initialization of the model.
Input data
ODD+2D protocol has extended this block. To avoid repetition, we will detail this part in the following section: "ODD+2D improvements to describe a model".
Submodels
This block aims to explain the agents’ behaviors. At each time step (each month), households consider their state and try to find a better option for them, e.g. moving to a dwelling nearby their preferred area.
Three main behaviors conduct household dynamics:
- change_location – the household checks if each one of the selected free dwellings, is closer to the preference than his current choice. If it is, it moves and updates all dependent variables (current district, current dwelling, degree of satisfaction, number of previous moves). This behavior is executed with a probability p1.
- grow – the household gives birth to a new household with nearby social characteristics with a probability p2.
- income – the household may increase or decrease its total revenue and changes its social class. Such a change affects the decision to move or to stay, as well as the choice of the next destination. This behavior runs with a specific probability p3.
Dwellings dynamics are governed by a behavior called adjust. According to household needs (family size – hh_size) and capabilities (financial status – income), this behavior adjusts the standing (standing) and the number of bedrooms that affects the surface area (surface) of the building.
ODD+2D Improvements to Describe a Model
The improvements of ODD+2D focus on data description which takes place inside the block "Input Data" of ODD+D. ODD+2D distinguishes four sub-blocks called Data Overview, Data Structure, Data Mapping and Data Patterns. The block "Data Overview" incorporates the contents of the old "Input Data" of ODD and ODD+D protocols, while the three other rubrics introduce new details that seem to be important to understand and replicate the agent-based model successfully. The use of these extended rubrics may help bridge the gap be-tween data and model and push forward solving related problems as introduced in Section 3: "Shortcomings of the ODD protocol for describing data linking".
Input data
Data overview
Data are synthesized based on a survey that was elaborated to collect information about residential mobility and households in Marrakesh, their housing choice and preferences. The database is alimented with broad statistics of Marrakesh extracted from the General Census of Population and Housing (GCPH 2004). The map we are going to simulate comes from a GIS shapefile of the city we obtained from an online database (open-streetmap.org/node/508040941, January 2017). The original dataset is composed of 69 variables we extracted from 19 questions of the survey, which are grouped into four categories: household attributes, dwelling, choice and preference attributes.
Data structure
A data analysis and design using UML led to classifying all our selected variables into three classes (Table 1). Household describes the household as the entity chosen to model the population. We define household as an atomic element to reduce complexity because the decision to move is taken at this level. Dwelling represents the house as the housing unit, but we can also use the district for a macro-level modeling. The city of Marrakesh is composed of six districts (zones), and every District represents a collection of dwellings. Table 1 describes the three entities of data.
| Attribute | Type | Description |
| District | ||
| cid | Discrete | A unique identifier of the district |
| shape | Geometry | A shapefile representing spatial data of the district |
| label | Text | Name of the district |
| hh2004 | Continuous | Initial number of households in 2004 |
| hh_mean_size | Continuous | Mean size (number of persons) of all households of the district |
| dw2004 | Continuous | Initial number of dwellings in 2004 |
| dw_mean_size | Continuous | Mean size (number of bedrooms) of all dwellings of the district |
| h_standing | Continuous | Proportion of dwellings with a standing of type high |
| m_standing | Continuous | Proportion of dwellings with a standing of type medium |
| l_standing | Continuous | Proportion of dwellings with a standing of type low |
| Household | ||
| hh_size | Discrete | Household size (number of individuals) |
| income | Continuous | Total income of the household (all working members) |
| tenure | Discrete | Housing tenure (owner, renter, ...) |
| moves5y | Discrete | Household moves in the last five years |
| hh_age | Discrete | Householder (the head of a household) age in years |
| hh_educ | Discrete | Householder education level |
| workers | Discrete | Number of working persons in the household |
| Dwelling | ||
| dw_size | Discrete | Number of bedrooms in the dwelling |
| room_size | Continuous | Mean room surface of the dwelling |
| dw_age | Discrete | Age of dwelling in years since its construction |
| standing | Discrete | Standing level of the dwelling (high, medium, low) |
| dist_services | Continuous | Mean distance from the dwelling to services |
| dist_transports | Continuous | Mean distance from the dwelling to transports |
| amenities | Continuous | Mean distance from the dwelling to amenities |
Data mapping
The overall mapping diagram is depicted in Figure 5 which represents the transformations and operations applied to data before being loaded into the model:
- Households2004 and Dwellings2004 – these two operations of population synthesis are used to generate agents for each district: households with a number of
hh2004and dwellings with a number ofdw2004. These operations use the conditional probabilities method. - standing_transfor – creates the variable score_standing of the agent entity
District, with an aggregation of three variables (h_standing, m_standing, l_standing) from the data classDistrict. This aggregation uses the simple function mean. - income_transfor – converts the attribute income of type float to a state variable of type integer (
social_class), to express the social class of the household in three categories. - distance_transfor – uses two attributes from Household data entity (
hh_size, income), and two attributes fromDwelling(dw_size, standing) to build a new state variable distance which represents the Euclidean distance between a household and a dwelling. - area_transfor– builds the variable surface of the agent
Dwellingby a multiplication of two attributes ofDwellingdata entity (dw_size, room_size). This variable expresses the surface of a dwelling based on the number of bedrooms and a mean room area. - Moving decision – expresses the dependence between the decision to move and two variables of the Household entity (
tenureandmoves5y). - Housing choice – expresses the dependence between the chosen destination and the principal variables of the two entities: household and dwelling. These variables are the same as those used to calculate the distance variable by the previous distance_transfor pattern. This variable is used to decide what dwelling to choose.
- Financial change – this dependence tells about the positive correlation that exists between the house-hold size (
hh_size) and the dwelling size (dw_size). When there are new individuals in the family, the household has to move, or the dwelling has to be adjusted. The household income restricts this operation.
Data patterns
Distance transformation: the distance between a household and a dwelling is a function of four variables (1).$$\begin{cases} hh \in households, \quad dw \in dwellings \\ hh.distance(dw) \leftarrow |dw.dw\_size - hh.hh\_size| + |dw.standing - hh.income| \end{cases}$$ (1) Moving decision: the propensity to move depends on tenure and previous moves (2).$$\begin{cases} yes, \quad if \quad flip ( 0.2 * ((1 - moves5y / 5) - (tenure * 0.1)) ) = true \\ no, \quad else \end{cases}$$ (2) Housing choice: the choice of the best dwelling as the one with the minimum distance (3).
| $$ \label{equa:equa3} \begin{cases} hh \in households, \quad dw \in dwellings \\ hh.d \leftarrow dw \quad / \quad hh.distance(dw) = min \quad of \quad hh.distance(dw_i) \end{cases}$$ | (3) |
Discussion and benefits of newly added parts
ODD+2D is a guideline that organizes information and ideas according to a determined schedule. This architecture prevents repetitions and favors understanding. Nevertheless, modelers are free in their choices to describe a complex system.
Classical ODD descriptions do not give enough information about data use and imputation in agent-based models. ODD+2D gives a response to this lake by (i) keeping the role of Input data block of ODD+D thanks to "Data Overview"; and (ii) expanding it by new blocks ("Data Structure", "Data Mapping" and "Data patterns"). These newly added parts of (Input Data) are necessary to understand the relationship between data and model as we explained before. The two sections "Entities, state variables and scales" and "Input data" seem to have redundant contents, but they are complementary. The former represents the agent entities and variables of the model. The latter describes data entities, their attributes, and the link between data and the model.
A clear distinction between "Data Structure" and "Data Mapping" has to be made. The two parts detail the structure of empirical data. Nevertheless the first one "Data Structure" describes the structure of native data coming from literature and stakeholders for the case study, whereas "Data Mapping" focuses on used data and the link between them and the agent-based model. Some information is repeated, but it shows which data are used and which one is not. Note that in further works, "Initialization" block and "Input data" should be switched to be in accordance with empirical models where data have an impact on the initialization process.
ODD+2D gives a response to some scientific issues raised by Boero & Squazzoni (2005); Hassan et al. (2008); Lammoglia (2011); Filatova (2015); Klabunde & Willekens (2016). It will undoubtedly benefit researchers in combining models and data because it favors:
- Data analysis transparency by describing the data preprocessing.
- Understanding the structure of data by providing graphical views of data.
- Avoiding too complicated models by highlighting only reliable data.
- Establishing the link between data and agents by using a dedicated graphical language.
- Model engineering by so ware that generates the ODD+2D description and GAML implementation model in a semi-automatic way.
- Interpreting simulation results by keeping in mind the context of research, from the beginning to the end of the modeling process.
- Validating models by controlling and documenting modeling process.
- Readability of ODD descriptions by grouping information about data under one block and specifying which information is required.
Conclusions and Perspectives
In this paper, we argue that the use of data should be more detailed to ease the understanding, developing, validating, replicating and disseminating. ODD+2D description through DAMap diagram prompts the user to choose data, to analyze them, and to link them with an agent-based model. Establishing these direct links synthesizes the whole experience of participants in the modeling process.
DAMap diagram is based on graphical languages inspired by UML. A Graphical User Interface permits to draw such visual model and to generate GAML implementation model and ODD+2D textual model. This interface becomes the shared space to discuss knowledge and data to consider.
The ODD+2D intends to describe the role of data inside an agent-based model. It takes advantages of ODD and ODD+D protocols because of their efficiency and their popularity. ODD+2D improves ODD+D by providing new building blocks dedicated to data integration in ABMs. It keeps ODDs philosophy and recommendations: generic, structured, and detailed.
Four blocks are added to the Input Data. Data Overview and Data Structure give an excellent description of input data. Data Mapping and Data Patterns detail migration processing from data to model.
ODD+2D and DAMap diagram are already used to model the residential mobility of Marrakesh. This work was completed in collaboration with the local housing observatory administration. Thanks to this approach, we convinced stakeholders of the perspective offered by agent modeling to simulate mobility based on their data. This work shows the efficiency of the approach to support multidisciplinary exchanges and integrate data into ABMs.
Stakeholders’ acceptance of the approach depends on the ease of drawing models with empirical concepts and to play simulation as a shared game. DAMap Graphical Interface gives a response to this challenge. ODD+2D should also be disseminated among the scientific community. The use of this extension for various case studies may provide experience to evaluate and to add improvements.
The panel of ODD add-ons is expanding while ODD is increasingly used. A jungle of extensions may appear in the next few years. It may hinder e orts of making ODD as a standard for the complex systems community. Therefore, extending ODD protocol has to be regulated by creating an ODD "meta-protocol" (as MOF for UML). Such meta-protocol gives a set of rules to normalize ODD extensions. It also: (i) limits conflicts and redundancies between extensions; and (ii) permits to merge few extensions given a case study to benefit from features of each one of them. For example, to design and develop a participating game of urban migration in Marrakesh: CoODD (Collaborative ODD) and ODD+2D could be merged to introduce both urban data and collaboration description into an agent-based model of urban mobility.
Acknowledgements
This work is completed in collaboration with the housing observatory of Marrakesh (Observatoire régional de l’habitat). We acknowledge stakeholders for their data, their cooperation and their availability. We thank the editor and two anonymous reviewers for their recommendations and constructive comments, which helped us to improve the manuscript.Appendix
Appendix A: Related data
Additional residential mobility data used in this article can be found in the data.xlsx file: https://github.com/Damapproject/damapp/blob/master/data.xlsx.
Appendix B: ODD+2D description of Klabunde et al. (2015)
This appendix extends the "Input data" rubric of the ODD+D description of an agent-based decision model of migration embedded in the life course (Klabunde et al. 2015).
As we mentioned in the previous section "Shortcomings of existing descriptions", this model described with ODD+D still have some issues in term of the relationship with empirical data. Klabunde et al. (2015) give a short introduction of the dataset used in their model under the "Design Concepts / Theoretical and empirical background" building block, specifying the partnerships and funding of the project. Then they outline which data are available at the individual level. In the next rubric "Individual Decision-Making", they specify that the dataset comprises information on individuals migrating to a wide range of different countries. After that, at the "Initialization" rubric, they say that initial values will be based on data. In the "Input Data" element, the model is said to use external data files for all the demographic processes. "Submodels" element specifies parameters that are estimated from data: (i) the waiting time distributions between demographic transitions; (ii) the probability to be married to specific individuals with given characteristics; (iii) and the maximum number of children.
As we can see from this summarized description, information about data are distributed over all the document. It is hard to make a clear insight into data integration while reading such a description. The handicap of ODD protocols in term of data-model connection is obvious, and our extension will significantly help to bridge this gap by (i) grouping data description under one block; and (ii) giving more details about data structure and its mapping to model agents.
The whole description is given in the original paper. We focus here only on the new blocks added by the ODD+2D.
Input data
Data overview
The model uses external input files from MAFE-Senegal data (http://mafeproject.site.ined.fr/fr/donnees/). It contains all the demographic processes using the MicSim package in R. This is achieved through the ’r’-extension in Netlogo (Klabunde et al. 2015). Data about migration from Senegal to many countries is available in the household and in the individual level. The MAFE-Senegal survey contains 1141 individuals and 1225 variables.
Data structure
In the MAFE data, all survey weights have been normalized. Individuals are organized in households and can be connected through a social network. The dataset contains 20 files, and the two principals are:
- "
sn_qm_household" – containing information about 1141 households with 197 - attributes; "
sn_qm_indiv" – representing 12350 individuals with 136 attributes.
Hence, the dataset is too complicated and cannot be represented by a UML diagram or a data table. The solution would be to represent only selected and related data. Since we did not develop the model, we cannot identify exactly which data are used to build model entities. Nevertheless, we give a sample (Table 2) to show data-model mapping according to our understanding.
| Attribute | Type | Description |
| sn_qm_household | ||
| reg | Discrete | Residence region of the current migrants |
| quartvill | Discrete | Dakar neighborhood |
| hworkers | Continuous | Number of persons living in the household with a professional activity |
| hhwealth | Continuous | Wealth index of the household |
| hhmember | Continuous | Total number of persons in the household (living in or outside) |
| sn_qm_indiv | ||
| n_menage | Continuous | Household number |
| e7a | Discrete | In which year did you get married |
| a21 | Discrete | Current socio-economic status (household head) |
| b1_1 | Discrete | 1st reason of departure |
| b1_2 | Discrete | 2nd reason of departure |
| b1_preci | Discrete | Another reason of departure |
Data mapping
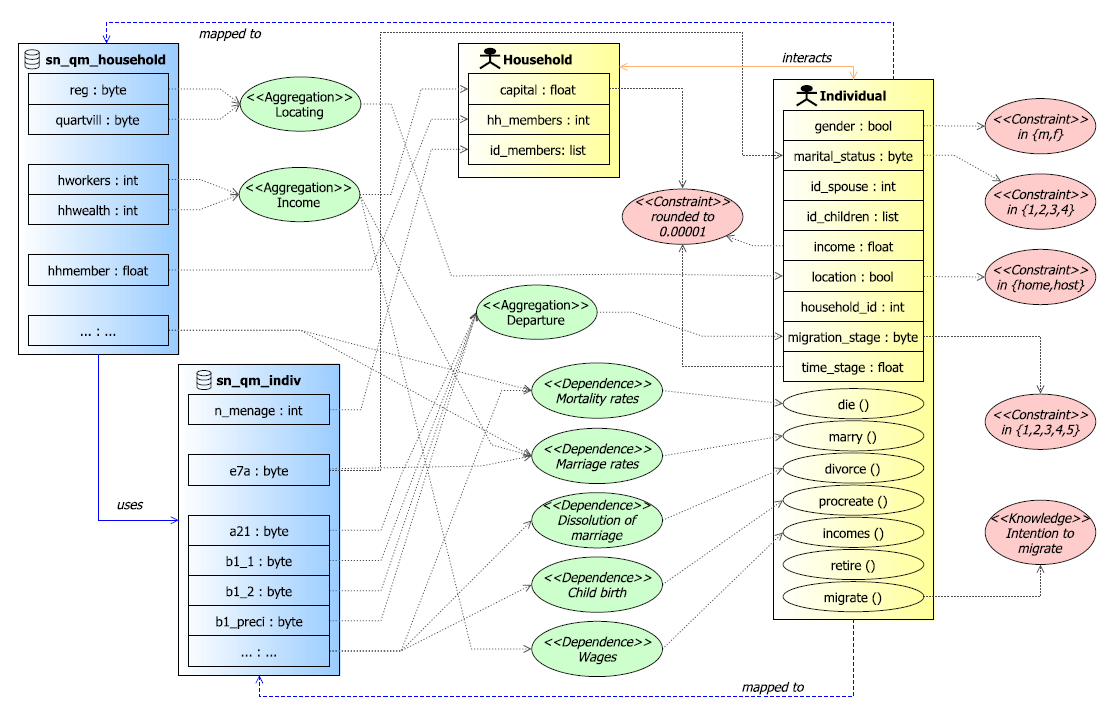
Given ODD+D description (Klabunde et al. 2015), we deduce the DAMap diagram (Figure 6). It gives the structure of the agent-based model (in yellow), data structure model (in blue), and the mapping between these two sub-models (by linked mapping patterns).
The data sub-model is a sample of available data. Only used attributes are shown in this diagram. For the others, the reader can refer to tables "sn_qm_household" and "sn_qm_indiv" at https://mafeproject.site.ined.fr/fr/donnees/. Note that mapping patterns depicted in Figure 6 are deducted from the initial ODD+D description (Klabunde et al. 2015). Due to the lack of information about both data and mapping links, the mapping we give here is undoubtedly incomplete. Details about some patterns (e.g. Mortality rates) were improvised.
- Locating – creates the state variable location from two attributes: reg and quartvill;
- Income – aggregates two attributes hworkers and hhwealth to one state variable capital;
- Departure – creates variable migration_stage from a set of attributes in the entity sn_qm_indiv;
- Mortality rates – are assumed to depend on age and gender.
- Marriage rates – are assumed to depend on age only for the unmarried population from the age of 16 until the age of 65.
- Dissolution of marriage – it depends on age and duration of the marriage.
- Childbirth – fertility rates depend on age, marital status and time elapsed since last birth.
- Wages – depend on location (home country or host country) and are drawn from an empirically deter-mined distribution.
Data patterns
Given the ODD+D description of Klabunde et al. (2015), the following data patterns are identified: Intention to migrate – based on many elements such as the agent attitude, social norms and the individuals perceptions of their ability to perform a migration.
Additional constraints are applied to the two agents (Household and Individual) as depicted in Figure 6. These patterns guarantee the integrity of the model and ensure simulation achievement.
Appendix C: ODD+2D description of Filatova (2015)
This appendix extends the "Input data" block of the ODD+D description of an empirical agent-based land market integrating adaptive economic behavior in urban land-use models (Filatova 2015).
Under "Entities, state variables and scales", Filatova (2015) presents a spatially explicit model based on GIS (Geo-graphical Information System) and cadaster data coming from different sources. These empirical data are used to initialize spatial landscape and to determine agents’ properties ("Theoretical and empirical background"). In the rubric "Input Data", the author specifies that, during the initialization, the model uploads vector data from multiple GIS data-sets. The paper also proposes a UML class diagram of the bilateral housing market: agents, their properties and their functions.
Similar to the previous example, it is hard to understand what data is used, and how it was loaded to the agent-based model by reading only the given ODD+D description. Additional details and information are required to fully understand and replicate the model with its data basis.
The whole description is given in the original paper. Additional data can be found in Bin et al. (2008). We focus here only on the new blocks added by the ODD+2D.
Input data
Data overview
"RHEA is applied to the coastal town of Beaufort. The area is in general low lying and is prone to flooding with a probability of 1:100 and 1:500 in certain zones. At initialization, RHEA uploads vector data from multiple GIS data-sets on the locations of residential housing, coastal amenities (measured regarding distance from coastal water and sound, and a Boolean measure of waterfront), flood probabilities, distances to the CBD and national parks, and data on structural characteristics of properties. Distance to CBD in the GIS dataset is measured as the distance to the nearest main employment center in the area - a neighboring town Morehead (Bin et al. 2008). Also at initialization, realtor-agents get the empirical hedonic function (Bin et al. 2008) based on the real estate transactions from 2000 to 2004 after a period of active hurricane seasons from the middle of the 1990s to 2003. Data on households’ incomes and preferences is taken from various sources". Extracted from Filatova (2015) ODD+D description.
The model uses GIS and cadaster data (flood zones and residential property sales) from Carteret County North Carolina. These data are produced by the National Flood Insurance Program.
Data structure
"Entity" data entity (Table 3) is the result of merging many sources of unknown origin. In Filatova (2015), no data are related to Households, Market and Realtors agent entities. So data structures and the meaning of their attributes cannot be retrieved to consolidate used data.
| Attribute | Type | Description |
| Entity | ||
| PRICE | Continuous | House sales price adjusted to September 2004 |
| BATHRM | Discrete | Number of bathrooms |
| AGE | Continuous | Year house was built subtracted from 2004 |
| SQFT | Continuous | Total structure square footage |
| LOTSIZE | Discrete | Total lot size measured in acres |
| NEWHOME | Binary | Dummy variable for new home (1 if sold within a year a er built, 0 otherwise) |
| POSTFIRM | Binary | Dummy variable for post-FIRM properties (1 if post-FIRM, 0 otherwise) |
| FLOOD | Binary | Dummy variable for house within any floodplain (1 if inside, 0 otherwise) |
| FLOOD100 | Binary | Dummy variable for house within a 100-yr floodplain (1 if inside, 0 otherwise) |
| FLOOD500 | Binary | Dummy variable for house within a 500-yr floodplain (1 if inside, 0 otherwise) |
| COASTFRONT | Binary | Dummy variable for the first row from coastal water (1 if on, 0 otherwise) |
| COASTDIST | Continuous | Distance in feet to the sound or Intracoastal waterways |
| CBD | Continuous | Distance in feet to downtown Morehead City |
| HIGHWAY | Continuous | Distance in feet to nearest highway |
| PARK | Continuous | Distance in feet to nearest park, forest, or game land |
| TOWN1..TOWN15 | Binary | Dummy variables for a township (1 if Morehead, 0 otherwise) |
| YEAR00..YEAR04 | Binary | Dummy variables for sales year (1 if sold in 2000..2004, 0 otherwise) |
Data mapping
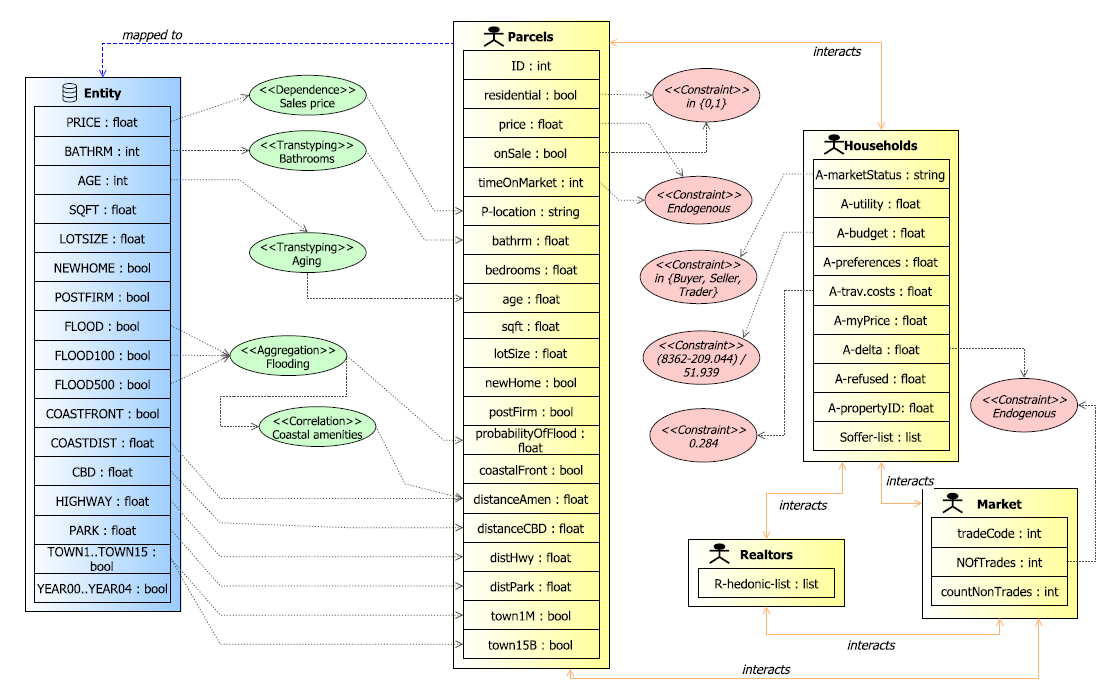
DAMap diagram (see Figure 7) shows that (i) available data are summarized by "Entity" data entity; (ii) and four agent entities are identified in the ABM (Parcels, Households, Realtors, and Market). Due to the lack of information about data structure, Households, Realtors and Market cannot be associated with the dataset. Parcels entity is linked with "Entity" data entity by following mapping patterns:
Sales price – parcels prices depend on their location. Bathrooms – BATHRM attribute is converted to type: float. Aging – AGE attribute is converted to type float. Flooding – three variables (FLOOD, FLOOD100, and FLOOD500) are aggregated to build the boolean state variable probabilityOfFlood. Coastal amenities – the state variable distanceAmen of agent Parcels depends on the result of previous pattern (Flooding).Data patterns
The following data patterns were deduced from two works using the same dataset: Bin et al. (2008) and Filatova (2015). Data patterns are given in the following list:
- We identify a spatial dependence in data. Residential properties sharing common features tend to cluster in space.
- Sales prices tend to cluster in space because houses in a neighborhood share similar location amenities.
- A strong positive correlation between coastal amenities and flood hazard.
Additional constraints are applied to the four agents (Parcels, Households, Realtors and Market) as depicted in Figure 7. These patterns guarantee the integrity of the model and ensure the success of simulation.
References
ALTAWEEL, M. R., Alessa, L. N., Kliskey, A. & Bone, C. (2010). A framework to structure agent-based modeling data for social-ecological systems. Structure and Dynamics, 4(1)
AMOUROUX, E. (2011). KIMONO, a descriptive agent-based modelling method for the exploration of complex systems: an application to epidemiology. (Doctoral dissertation, Université Pierre et Marie Curie-Paris VI).
ANH, B. T. M., Stinckwich, S., Ziane, M., Roche, B. & Vinh, H. T. (2015). Kendrick: A domain specific language and platform for mathematical epidemiological modelling. In Computing & Communication Technologies-Research, Innovation, and Vision for the Future (RIVF), 2015 IEEE RIVF International Conference on, (pp. 132-137). IEEE.
AUGUSIAK, J., Van den Brink, P. J. & Grimm, V. (2014). Merging validation and evaluation of ecological models to ’evaludation’: a review of terminology and a practical approach. Ecological Modelling, 280, 117–128.
BALBI, S., Giupponi, C., Perez, P. & Alberti, M. (2013). A spatial agent-based model for assessing strategies of adaptation to climate and tourism demand changes in an alpine tourism destination. Environmental Modelling & Software, 45, 29–51 [doi:10.1016/j.envsoft.2012.10.004]
BARRETEAU, O. & Smajgl, A. (2014). Designing empirical agent-based models: An issue of matching data, technical requirements and stakeholders expectations. In Empirical Agent-Based Modelling-Challenges and Solutions, (pp. 239–249). Springer, New York, NY.
BARRETEAU, O., Antona, M., D'Aquino, P., Aubert, S., Boissau, S., Bousquet, F., ... & Trébuil, G. (2003). Our companion modelling approach. Journal of Artificial Societies and Social Simulation, 6(2), 1: https://www.jasss.org/6/2/1.html.
BAUER, B., Müller, J. P. & Odell, J. (2001). Agent UML: A formalism for specifying multiagent so ware systems. International Journal of Software Engineering and Knowledge Engineering, 11(03), 207–230
BERSINI, H. (2012). UML for ABM. Journal of Artificial Societies and Social Simulation, 15(1), 9: https://www.jasss.org/15/1/9.html. [doi:10.18564/jasss.1897]
BIN, O., Kruse, J. B. & Landry, C. E. (2008). Flood hazards, insurance rates, and amenities: Evidence from the coastal housing market. Journal of Risk and Insurance, 75(1), 63–82
BOERO, R. & Squazzoni, F. (2005). Does empirical embeddedness matter? methodological issues on agent-based models for analytical social science. Journal of Artificial Societies and Social Simulation, 8(4), 6: https://www.jasss.org/8/4/6.html.
BRUCH, E. & Atwell, J. (2015). Agent-based models in empirical social research. Sociological Methods & Research, 44(2), 186–221.
BYKOVSKY, V. K. (2010). Data-driven modeling of complex systems. In Unifying Themes in Complex Systems, (pp. 34–41). Springer, Berlin, Heidelberg. [doi:10.1007/978-3-540-85081-6_5]
CLARK, W. A. (2012). Do women delay family formation in expensive housing markets? Demographic Research, 27(1), 1.
DONKIN, E., Dennis, P., Ustalakov, A., Warren, J. & Clare, A. (2017). Replicating complex agent based models, a formidable task. Environmental Modelling & Software, 92, 142–151. [doi:10.1016/j.envsoft.2017.01.020]
FILATOVA, T. (2015). Empirical agent-based land market: Integrating adaptive economic behavior in urban land-use models. Computers, Environment and Urban Systems, 54, 397–413.
GELLER, A. (2014). Building empirical multiagent models from first principles when fieldwork is difficult or impossible. In Empirical Agent-Based Modelling-Challenges and Solutions, (pp. 223–237). Springer, New York, NY. [doi:10.1007/978-1-4614-6134-0_12]
GRIMM, V., Berger, U., Bastiansen, F., Eliassen, S., Ginot, V., Giske, J., Goss-Custard, J., Grand, T., Heinz, S. K., Huse, G. et al. (2006). A standard protocol for describing individual-based and agent-based models. Ecological Modelling, 198(1-2), 115–126.
GRIMM, V., Berger, U., DeAngelis, D. L., Polhill, J. G., Giske, J. & Railsback, S. F. (2010). The ODD protocol: a review and first update. Ecological Modelling, 221(23), 2760–2768 [doi:10.1016/j.ecolmodel.2010.08.019]
GRIMM, V., Revilla, E., Berger, U., Jeltsch, F., Mooij, W. M., Railsback, S. F., Thulke, H.-H., Weiner, J., Wiegand, T. & DeAngelis, D. L. (2005). Pattern-oriented modeling of agent-based complex systems: lessons from ecology. Science, 310(5750), 987–991.
GROENEVELD, J., Klabunde, A., O’Brien, M. L. & Grow, A. (2017). How to describe agent-based models in population studies? In Agent-Based Modelling in Population Studies, (pp. 237–254). Springer, Cham. [doi:10.1007/978-3-319-32283-4_9]
HASSAN, S., Antunes, L., Pavon, J. & Gilbert, G. (2008). Stepping on Earth: A Roadmap for Data-driven Agent-Based Modelling. In Proceedings of the 5th Conference of the European Social Simulation Association (ESSA08).
HASSAN, S., Pavón, J., Antunes, L. & Gilbert, N. (2010). Injecting data into agent-based simulation. In Simulating Interacting Agents and Social Phenomena, (pp. 177–191). Springer, Tokyo. [doi:10.1007/978-4-431-99781-8_13]
HINKELMANN, F., Murrugarra, D., Jarrah, A. S. & Laubenbacher, R. (2011). A mathematical framework for agent based models of complex biological networks. Bulletin of Mathematical Biology, 73(7), 1583–1602.
HOLM, S., Lemm, R., Thees, O. & Hilty, L. M. (2016). Enhancing agent-based models with discrete choice experiments. Journal of Artificial Societies and Social Simulation, 19(3), 3: https://www.jasss.org/19/3/3.html. [doi:10.18564/jasss.3121]
JANSSEN, M. A. (2017). The practice of archiving model code of agent-based models. Journal of Artificial Societies and Social Simulation, 20(1), 2: https://www.jasss.org/20/1/2.html. [doi:10.18564/jasss.3317]
JONES, N. A., Perez, P., Measham, T. G., Kelly, G. J., d’Aquino, P., Daniell, K. A., Dray, A. & Ferrand, N. (2009). Evaluating participatory modeling: developing a framework for cross-case analysis. Environmental Management, 44(6), 1180–1195. [doi:10.1007/s00267-009-9391-8]
JORDAN, R., Birkin, M. & Evans, A. (2012). Agent-based modelling of residential mobility, housing choice and regeneration. In Agent-based models of geographical systems, (pp. 511–524). Springer, Dordrecht.
KLABUNDE, A. & Willekens, F. (2016). Decision-making in agent-based models of migration: state of the art and challenges. European Journal of Population, 32(1), 73–97. [doi:10.1007/s10680-015-9362-0]
KLABUNDE, A., Willekens, F. J., Zinn, S. & Leuchter, M. (2015). An agent-based decision model of migration, embedded in the life course - model description in ODD+D format. (No. WP-2015-002). Max Planck Institute for Demographic Research, Rostock, Germany.
LAATABI, A., Babram, M. A. & Hbid, M. L. (2015). Generating and mapping a synthetic population of Marrakesh. In Complex Systems (WCCS), 2015 Third World Conference on (pp. 1-6). IEEE. [doi:10.1109/ICoCS.2015.7483306]
LAATABI, A., Marilleau, N., 2.-Huu, T., Hbid, H. & Babram, M. A. (2016). Formalizing Data to Agent Model Mapping Using MOF: Application to a Model of Residential Mobility in Marrakesh. In Agent and Multi-Agent Systems: Technology and Applications (pp. 107-117). Springer, Cham.
LAMMOGLIA, A. (2011). Évolution spatio-temporelle d’une desserte de transport flexible simulée en sma. enjeux méthodologiques et perspectives. Cybergeo: European Journal of Geography [doi:10.4000/cybergeo.24720]
LE, Q. B., Park, S. J. & Vlek, P. L. (2010). Land Use Dynamic Simulator (LUDAS): A multi-agent system model for simulating spatio-temporal dynamics of coupled human–landscape system: 2. Scenario-based application for impact assessment of land-use policies. Ecological Informatics, 5(3), 203–221.
LEE, E. S. (1966). A theory of migration. Demography, 3(1), 47–57. [doi:10.2307/2060063]
LIVET, P., Muller, J.-P., Phan, D. & Sanders, L. (2010). Ontology, a mediator for agent-based modeling in social science. Journal of Artificial Societies and Social Simulation, 13(1), 3: https://www.jasss.org/13/1/3.html.
MÜLLER, B., Balbi, S., Buchmann, C. M., De Sousa, L., Dressler, G., Groeneveld, J., Klassert, C. J., Le, Q. B., Millington, J. D., Nolzen, H. et al. (2014). Standardised and transparent model descriptions for agent-based models: current status and prospects. Environmental Modelling & Software, 55, 156–163. [doi:10.1016/j.envsoft.2014.01.029]
MÜLLER, B., Bohn, F., Dreßler, G., Groeneveld, J., Klassert, C., Martin, R., Schlüter, M., Schulze, J., Weise, H. & Schwarz, N. (2013). Describing human decisions in agent-based models–ODD+ D, an extension of the ODD protocol. Environmental Modelling & Software, 48, 37–48.
NGUYEN, T. K., Marilleau, N., Ho, T. V. & El Fallah, A. (2011, October). New protocol supporting collaborative simulation. In Proceedings of the Second Symposium on Information and Communication Technology, (pp. 137–145). ACM. [doi:10.1145/2069216.2069244]
O’SULLIVAN, D., Evans, T., Manson, S., Metcalf, S., Ligmann-Zielinska, A. & Bone, C. (2016). Strategic directions for agent-based modeling: avoiding the YAAWN syndrome. Journal of Land Use Science, 11(2), 177–187.
PARKER, D. C., Brown, D., Polhill, J. G., Manson, S. & Deadman, P. (2008). Illustrating a new conceptual design pattern for agent-based models and land use via five case studies: the MR POTATOHEAD framework. In Agent-based modelling in natural resource management. Universidad de Valladolid.
PAVÓN, J., Gómez-Sanz, J. J. & Fuentes, R. (2005). The INGENIAS methodology and tools. In Agent-oriented methodologies, (pp. 236–276). IGI Global.
POLHILL, J. G., Parker, D., Brown, D. & Grimm, V. (2008). Using the ODD protocol for describing three agent-based social simulation models of land-use change. Journal of Artificial Societies and Social Simulation, 11(2), 3: https://www.jasss.org/11/2/3.html.
POPPER, N. & Pichler, P. (2015). Reproducibility. In Agent-based Modeling and Simulation in Archaeology, (pp. 77–98). Springer, Cham.
RICHIARDI, M., Leombruni, R., Saam, N. & Sonnessa, M. (2006). A common protocol for agent-based social simulation. Journal of Artificial Societies and Social Simulation, 9(1), 15: https://www.jasss.org/9/1/15.html.
SANSORES, C., Pavón, J. & Gómez-Sanz, J. (2005, July). Visual modeling for complex agent-based simulation systems. In International Workshop on Multi-Agent Systems and Agent-Based Simulation, (pp. 174–189). Springer, Berlin, Heidelberg.
SARGENT, R. G. (2011). Verification and validation of simulation models. In Proceedings of the 2011 Winter Simulation Conference, (pp. 183–198). Winter Simulation Conference. [doi:10.1109/WSC.2011.6147750]
SCHMOLKE, A., Thorbek, P., DeAngelis, D. L. & Grimm, V. (2010). Ecological models supporting environmental decision making: a strategy for the future. Trends in Ecology & Evolution, 25(8), 479–486.
SIEBERS, P. O. & Aickelin, U. (2008). Introduction to multi-agent simulation. https://arxiv.org/abs/0803.3905.
SMAJGL, A. & Barreteau, O. (2014). Empiricism and Agent-Based Modelling. In Empirical Agent-Based Modelling-Challenges and Solutions, (pp. 1–26). Springer New York.
SUN, Z., Lorscheid, I., Millington, J. D., Lauf, S., Magliocca, N. R., Groeneveld, J., Balbi, S., Nolzen, H., Müller, B., Schulze, J. et al. (2016). Simple or complicated agent-based models? A complicated issue. Environmental Modelling & Software, 86, 56–67. [doi:10.1016/j.envsoft.2016.09.006]
SOBKOWICZ, P. (2009). Modelling opinion formation with physics tools: Call for closer link with reality. Journal of Artificial Societies and Social Simulation, 12(1), 11: https://www.jasss.org/12/1/11.html.
TAILLANDIER, P., Vo, D.-A., Amouroux, E. & Drogoul, A. (2010, November). GAMA: a simulation platform that integrates geographical information data, agent-based modeling and multi-scale control. In International Conference on Principles and Practice of Multi-Agent Systems (pp. 242-258). Springer, Berlin, Heidelberg.
TRUONG, M. T., Amblard, F. & Gaudou, B. (2013, January). Combination framework of bi solution & multi-agent platform (cfbm) for multi-agent based simulations. In 13eme Conference francophone sur le Gestion et l’Extraction de Connaissances: Journée Atelier aide à la Décision à tous les Etages (AIDE@ EGC 2013), (pp. 35–42).
WANG, M. (2014). Data assimilation for agent-based simulation of smart environment. Dissertation, Georgia State University. http://scholarworks.gsu.edu/cs_diss/91.
WILLIAMS, N. E., O’Brien, M. L. & Yao, X. (2017). Using survey data for agent-based modeling: design and challenges in a model of armed conflict and population change. In Agent-Based Modelling in Population Studies, (pp. 159–184). Springer, Cham.
WOLF, S., Bouchaud, J.-P., Cecconi, F., Cincotti, S., Dawid, H., Gintis, H., van der Hoog, S., Jaeger, C. C., Kovalevsky, D. V., Mandel, A. et al. (2013). Describing economic agent-based models–Dahlem ABM documentation guidelines. Complexity Economics, 2(1). [doi:10.7564/13-COEC12]
ZAMBONELLI, F., Jennings, N. R. & Wooldridge, M. (2003). Developing multiagent systems: The Gaia methodology. ACM Transactions on Software Engineering and Methodology (TOSEM), 12(3), 317–370.
ZINAS, B. Z., & Jusan, M. M. (2017). Choice behaviour of housing attributes: Theory and measurement. Asian Journal of Environment-Behaviour Studies, 2(2), 23-37. [doi:10.21834/aje-bs.v2i2.175]