
Introduction
Protest demonstrations are not new, but counter-protests are a relatively new phenomena. For example, on the 1st April 2017 Unite Against Fascism demonstrated as a counter-protest to a demonstration by the English Defence League (McIntyre 2017; Barry 2017), and often a pro-choice demonstration is arranged to be at the same time and location of a pro-life demonstration (Quinn 2012; Hatch 2017; CTV 2016). This social phenomenon requires more policing than a united demonstration of an equivalent size. However, what is the best strategy for police to keep these two opposing groups apart? For example, should police be keen to approach protesters, or remain as a single-file human barrier between the two groups?
Protest models to date consider the propensity of a given agent (potential protester) to become 'active', i.e., to protest. Essentially building upon the seminal paper by Granovetter (1978). Factors such as grievance, threshold and risk aversion are considered. Probably the most well-known work in this area is that of Epstein (2002), where the author models the state of civil violence involved in a decentralized rebellion against a central authority. They also consider the scenario where the rebellion is composed of two warring groups. Under these models there are three types of agents, protesters who may be active or inactive, and police. Protesters decide whether to become active based upon the probability that they'll be arrested (a function of police and active protesters within sight) and their grievance (a function of the perceived hardship and legitimacy). Kim and Hanneman (Kim & Hanneman 2011) modify the grievance function to be more specific for a worker's protest, such that difference in wages is included. The models of Epstein (2002) and Kim & Hanneman (2011) found intermittent bursts of rebellion.
The strength and success of Epstein's model lies in its simplicity, however the assumptions are crude and thus others have developed upon this simple model. For example, Goh et al. (2006) allow for a game theory interaction between active protester and police; and agents are modelled from multi-disciplinary perspectives and their behavioural strategies evolve over time via collective co-evolution and independent learning. Whilst these additions make this model more realistic than its predecessor (Epstein 2002), it does not include other important factors such as applause or media (Lemos & Coelho 2013).
Davies et al. (2013) modelled the London Riots of 2011, and Fonoberova et al. (2012) modelled crime and violence over 2005-2009 in many US cities. These models are unique in that they are verifiable with real data. But generally, models of protester behaviour, such as Epstein (2002), Goh et al. (2006) and Kim & Hanneman (2011), are not verified with real data.
Although Epstein (2002) modelled two warring groups, the situation is regarding civil violence over a longer time period. For example, Epstein (2002) does not have a spatial separation of the groups, and agents can be killed by other agents. As far as the author is aware, there are currently no models for protest and counter-protest behaviour. This paper presents a simple agent-based model to better understand how to police two opposing protests. The model consists of two different protesting groups, of varying size (that is, one group may be larger than the other), with varying individual aversion to police interaction. The two groups of protesters are separated by the 'thin blue line' of police. The effect of the following parameters are explored:
- the aversion of protesters to police (to mimic peaceful, average and volatile protests),
- the angle of vision of the protesters,
- the number of police,
- the width of the 'thin blue line',
- the keenness of the police to approach protesters,
- the angle of vision of the police.
The last three points essentially question how mobile an officer should be. Since this paper aims to provide information regarding policing strategy, police are assumed to have united behaviour, that is, the same keenness to approach protesters. (Whereas protesters have an aversion to police drawn from a distribution, to reflect individuality.) The results indicate that a wide 'thin blue line' comprising many keen police is the most effective. However, a single line of police separating the two groups is nearly as effective. Therefore, when resources do not permit a single police officer for every two to four protesters, then the model implies that the second strategy of a single line of police separating the two groups is preferred. The model is in Netlogo, and the code is available as a supplementary file.
Method
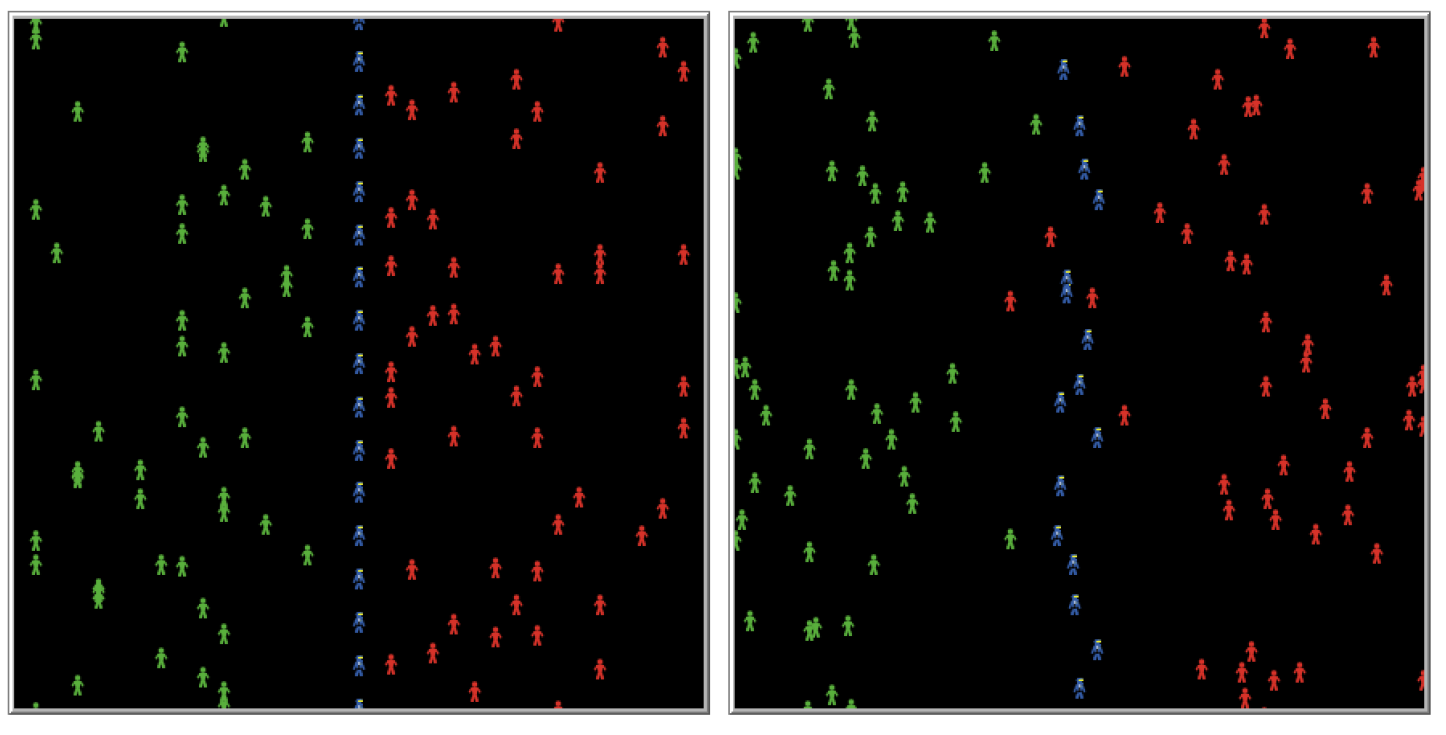
The model considers three agents: protesters from one group, protesters from the counter-group, and police. The 'world' is a 32 by 32 grid, \(x = [-16,16]\), \(y=[ -16, 16]\), the protesters are separated by the \(x=0\) line, which is the 'thin blue line' of police, see Figure 1. The police are initially equidistant within the 'thin blue line' which is centred around \(x=0\). The width \(w\) of the blue line varies under different simulated scenarios. The protesters are initially distributed randomly within their half of the world, but are not within the 'thin blue line'.
All protesters are considered active, that is, if a protester is present, we assume that they are active. Active in this context indicates that they wish to cross over the 'thin blue line', and enter the territory of their opponent. However, each agent has a different aversion to the police, that is each protester has a minimum distance between itself and police before it moves one step directly backwards, away from the police. Three different distributions are assumed,
- The aversion of a given protester is drawn from a normal distribution with mean \(\bar{A}\) and variance \((\bar{A}-\bar{A}/2)\), see Figure 2.
- The aversion of a given protester is drawn from a gamma distribution with mean \(\bar{A}\) and standard deviation \(\sigma_l^2\), so that few protesters are very averse to police interaction (left-skewed), see Figure 3.
- The aversion of a given protester is drawn from a gamma distribution with mean \(\bar{A}\) and standard deviation \(\sigma_r^2\), which is reflected about the mean so that many protesters are very averse to police interaction (right-skewed), see Figure 4.
Arrests are not included in the model meaning that no agents leave or enter the 'world', and all protesters have a minimum aversion of 1 (police and protester do not occupy the same space). It is assumed that the number of trespassers is directly proportional to the probability of conflict, so the success of the police is determined by how many agents have not crossed to the opposing territory.


There are \(N_1\) protester agents in one group and \(N_2\) agents protesters in the counter group. The behavioural rules for a protester which is initially placed at \((\pm x_i, y_i)\), \(x_i \in \{w/2, w/2+1, \ldots, 16\}\), \(y \in \{-16, 15, \ldots, 16\}\) and has aversion \(a_i\) (\(i = 1 \ldots N_1+N_2\)), are that
- the protester has the destination \((\mp 16, y_i)\), and is always facing the destination such that the angle of direction is \(\theta=0\).
- if any police are visible within the angle of vision (default is \(300 \leq \theta \leq 60\)), and within distance \(a_i\), the protester takes a step back, otherwise the protester moves towards its destination.
- if no police are visible within the angle of vision (default is \(300 \leq \theta \leq 60\)), then the protester moves forward (facing destination) by a random angle \(\theta \in [325,45]\).
There are \(P\) police agents. The behavioural rules for a single police agent which is initially placed at \((x_j, y_j)\), and has keenness \(k\), are
- the police agent has the destination \((x_j, y_j)\).
- if the police agent is outside the 'thin blue line', it takes one step towards its destination.
- at each iteration, the police may face either group of protesters. The direction is determined from a binomial distribution where the probability of facing a given group is determined by the ratio of that group to the total number of protesters.
- if a protester is visible within the angle of vision (default is \(300 \leq \theta \leq 60\)), and within distance \(k\), the police agent moves towards the protester.
- if no protesters are within the police vision, the police agent takes a step toward its destination.
Numerical Simulations
The number of simulations are categorised by the following: the first set of simulations explore the effect of the number of police agents, the width of the 'thin blue line', and the keenness of the police agents; the second set explore the effect of the number of protesters; and the third set explore the effect of police and protester angle of vision. Each simulation of 5000 time steps is run 10 times with a given set of parameters, and the number of trespassers is noted from each run as a proxy measure for the success of the given police strategy. Each simulation took 96 hours on a standard desktop computer. For this reason, the number of runs is limited to 10, which is sufficient since the variance between runs is small, see Figure 5-9. The results from these simulations are now discussed.
The first numerical simulations consider 100 protesters in each group (\(N_1 = N_2 = 100\)), with the number of police varying such that \(P = 16, 17, \ldots, 100\). The width of the 'thin blue line' varies such that \(w = 1,3, 5\), and the keenness of the police varies such that \(k = 2,6, 10\). The model is run for the three different groups of protester aversion behaviour, as shown in Figure 2-4.
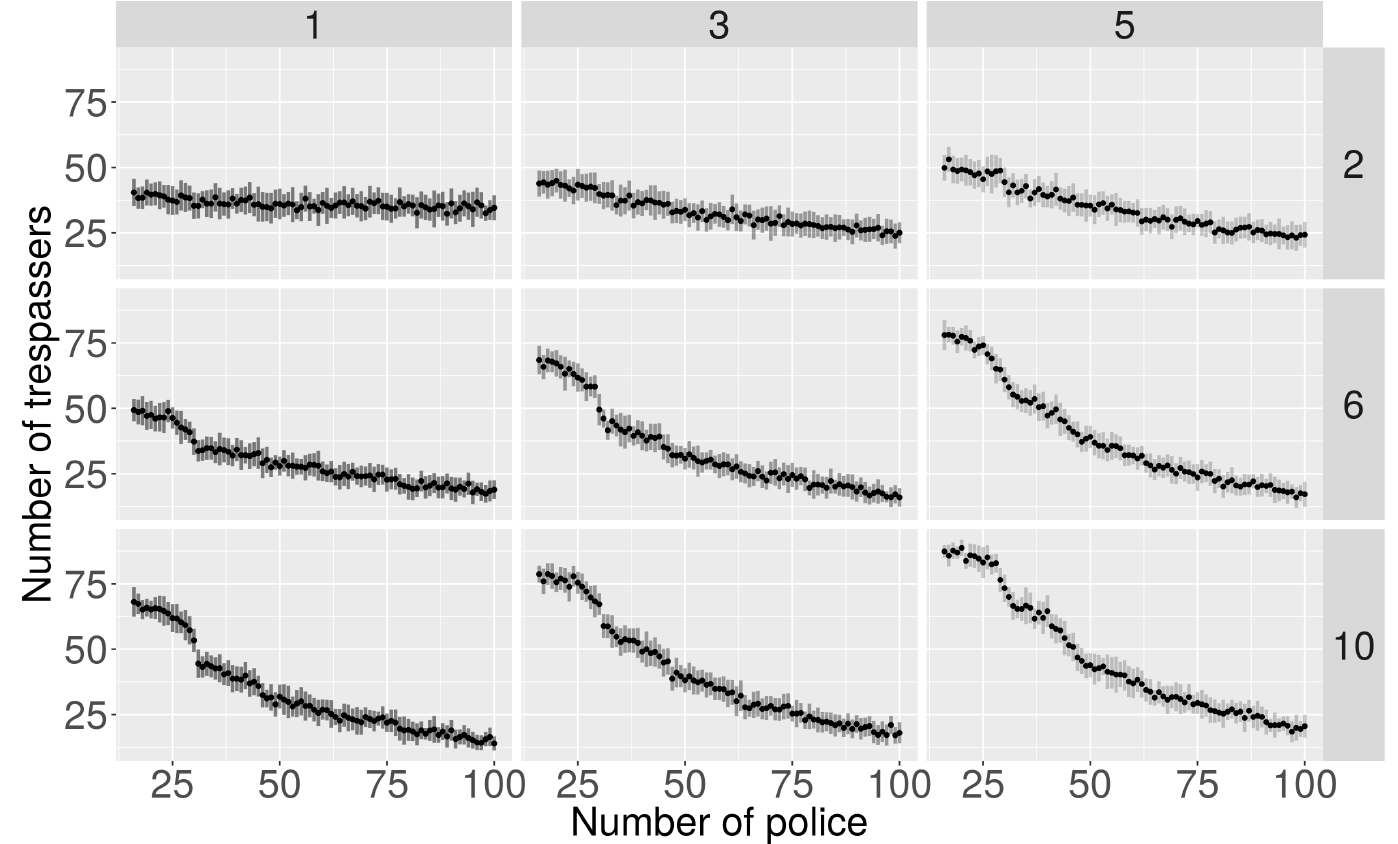
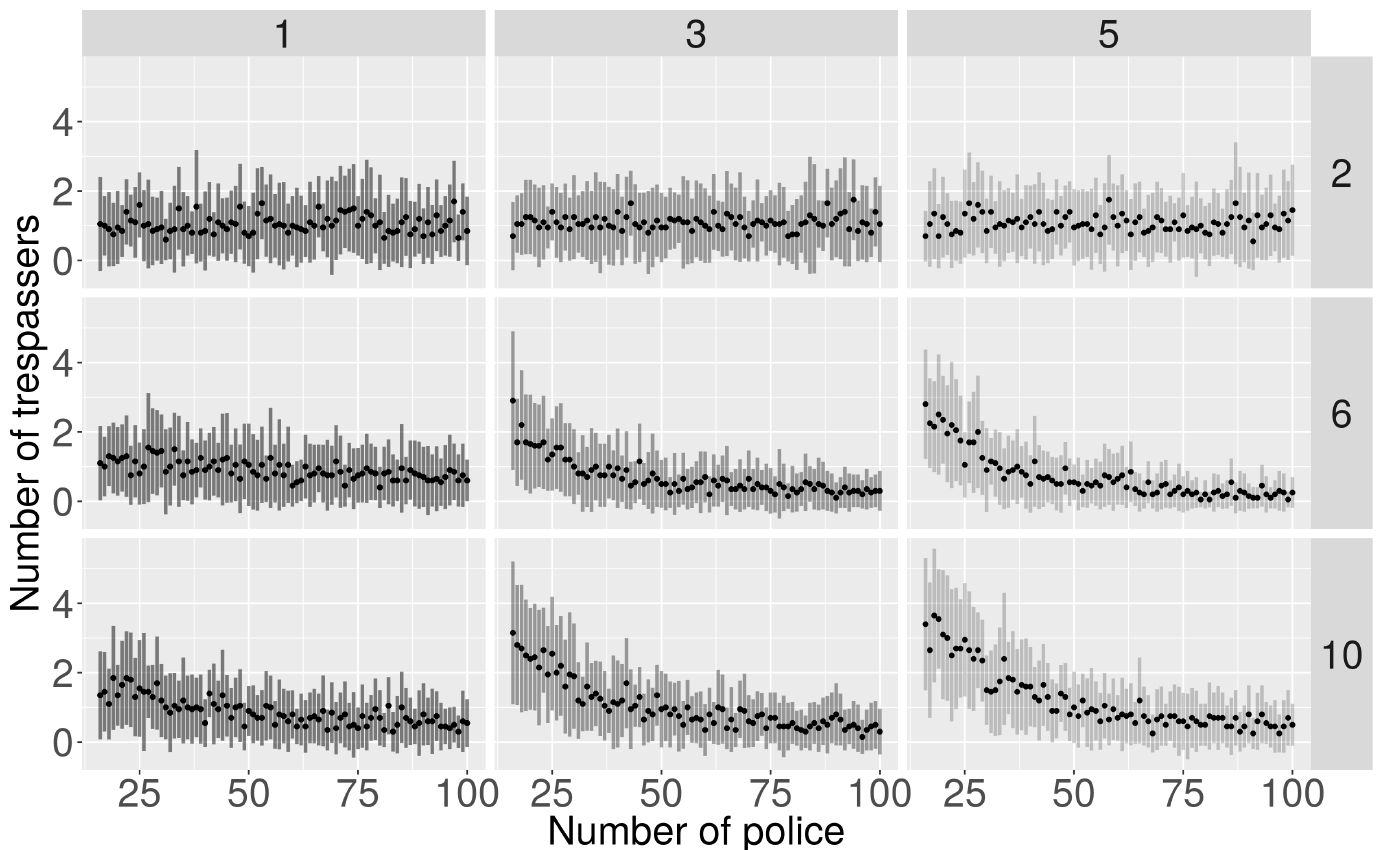
The most effective strategy is to have as many police as possible occupy a wide 'thin blue line', with a high keenness to approach protesters, see Figure 5-7. Under this strategy, as the number of police increases, the number of trespassers decreases, especially when the number of police is between 16 and approximately 32 (note that the height of the world, that is, the length of the 'thin blue line' is 32). The diminishing effect of the number of police holds for all distributions of aversion, however it is most notable when protesters are not very averse to police, see Figure 6.
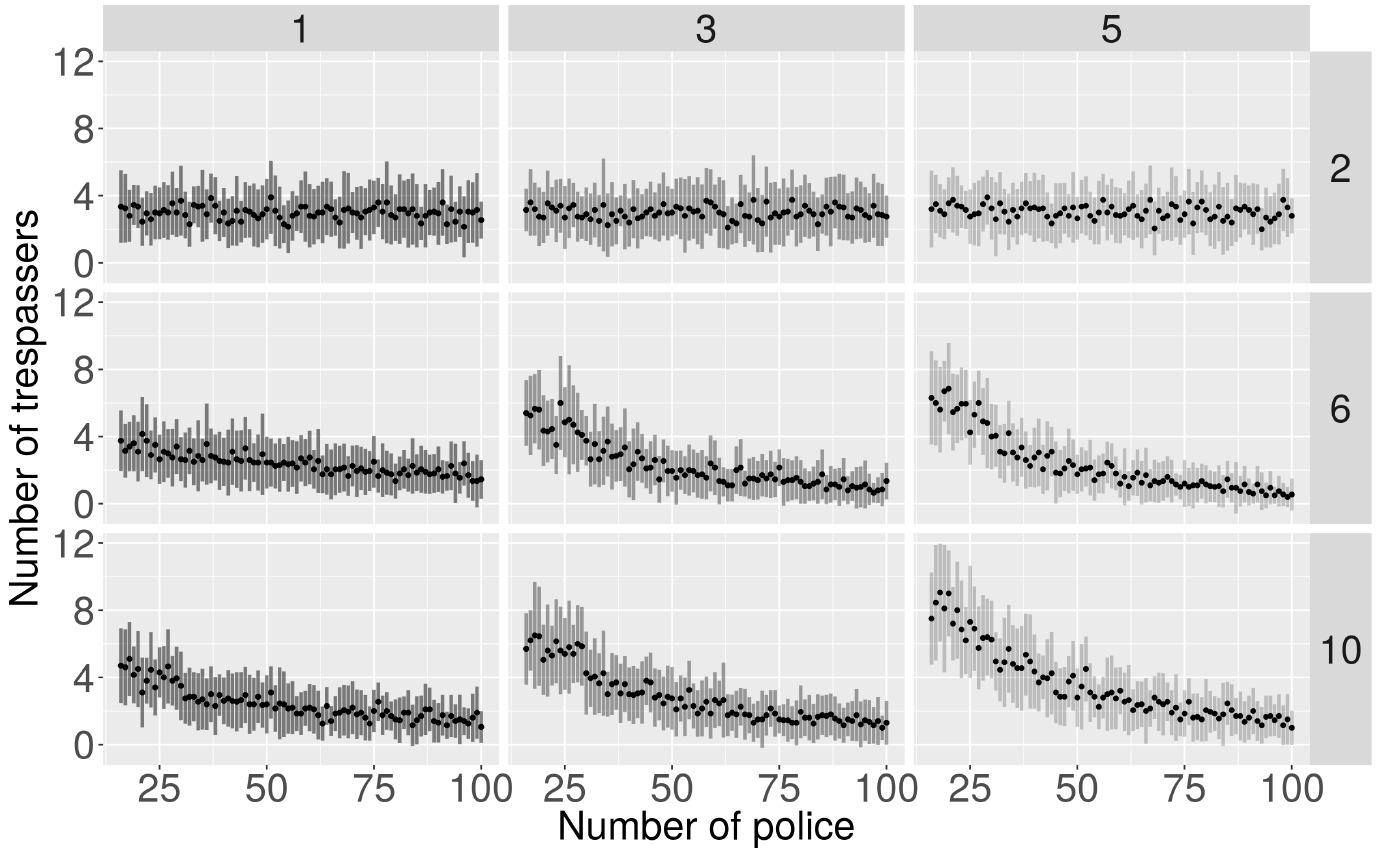
Nonetheless, the effect of the number of police is generally only a factor when the 'thin blue line' is wider than a single line of police (width is 1), and the police keenness is greater than 2 (that is, a police agent only moves towards a protester agent which is within distance 2 from itself). This single-file strategy is effective irrespective of the number of police agents, even when there are less than approximately 32 police.
Therefore one can identify two effective strategies. Either there are many police agents occupying a wider divide between the two groups, and the police agents approach protester agents which are further away; or the 'thin blue line' comprises few police agents who form a single file, and do not break out of form unless a protester is very close. Once the number of police agents exceeds approximately 50, the first strategy of a wide divide is more effective than the second.
The second numerical simulations consider \(N_1 = \{25, 50, 75, 100\}\) and \(N_2 = \{25, 50, 75, 100\}\), with the number of police varying such that \(P = 16, 17, \ldots, 100\), the width of the 'thin blue line' varies such that \(w = 1,3, 5\), and the keenness of the police is \(k=2\). The model is run with the normal distribution of protester only, Figure 2.
The model is symmetric such that a simulation where \(N_1, N_2 = 50\) has a similar number of protesters to when \(N_1 = 25\) and \(N_2=75\), and vica versa. The mean number of trespassers for a given number of total protesters \((N_1 + N_2) = \{50, 75, 100, 125, 150, 175, 200\}\) follows a linear relationship with the number of protesters, see Figure 8-9.
In line with the first numerical simulations, when police keenness is high, \(k=10\), the number of trespassers increases as the width the of the 'thin blue line' increases. The effect of the width of the 'thin blue line' is more noticeable as the number of protesters increases, see Figure 8. Continuing this comparison, when police keenness is low, \(k=2\), the width of the 'thin blue line' makes no difference to the number of trespassers, see Figure 9. In fact, in this circumstance, the line of best fit is almost identical to the line of best fit for the case where \(k=10\) and \(w=5\).
Again, this corresponds to the findings from the first group of numerical simulations since the mean is from an average over varying number of police agents, \(P = 16, 17, \ldots, 100\), meaning that in most simulations the first strategy, which is most effective when \(P> 50\) is preferred (large width and high keenness).


The third numerical simulations vary the width of the 'thin blue line' and the angle of vision of the protesters and police, see Figure 10. The protesters have a normally distributed aversion to the police (100 protesters in each group and 100 police with keenness 10). These simulations highlight again that when police are more mobile due to occupying a wide area, and having more possible 'targets' due to a large cone of vision (angle of vision combined with keenness), more trespassers occur. The effect of a more focused angle of vision is also noticeable with the protesters - when they have a wide angle of vision they are less successful at trespassing. Perhaps protesters with a wide scope of vision is more realistic, however, the model does not account for more complex protester behaviour such as intentionally creating a distraction.

Discussion and Conclusions
Protester behaviour is often simulated using agent-based modelling (see review paper by Lemos & Coelho 2013). Frequently a researcher is not blessed with data to validate such models. Nonetheless, simple, yet well thought out simulations highlight important features. For Epstein (2002) and Kim & Hanneman (2011) found rebellious behaviour, such as violence, to occur in intermittent bursts.
Extending upon this framework, this paper presents an agent-based model to study how police can best keep two opposing protest groups apart. No agents leave the region, meaning that arrests do not occur, and it is assumed that all protesters are active, that is, they wish to trespass into the opposing groups territory. A line of police agents separate the two groups. Individuality in protester behaviour is implemented by each protester agent having a different aversion to police. In contrast, police agents are not treated as individuals and are instead assigned a uniform 'keenness', which states how close a protester gets to the police agent before it moves towards the protester.
Simulations were run with different distributions for protester aversion, and different numbers of protesters, as well as the number of police agents, the keenness of the police agents, the width of the 'thin blue line', and the angle of vision of protesters and police. For each parameter set, the effectiveness of the 'thin blue line' is assessed by the number of trespassers, which is the total number of protesters who have crossed over the 'thin blue line'. The Netlogo code used for these paper is provided as a supplementary file.
The difference in the size of protester group had no effect, that is, if there were 25 in one group and 75 in the other, this scenario had the same number of trespassers to a scenario with 50 protesters on either side. However, this is because police agents faced each group proportionally, so with a 25/75 split, 25% of police agents faced the smaller group.
Two clear strategies arose. The most effective strategy is to use as many police as possible, and for the 'thin blue line' to be wide, and police agents to be keen to approach protesters. The second strategy is nearly as effective, and uses as few as approximately 32 police agents (the length of the 'thin blue line' is 32), in a single file, and police agents approach a protester agent when it is very close.
When the average protester aversion is high, the first strategy is only marginally better. Therefore, with limited resources, and under most conditions, the second strategy is preferred. However, in the scenario where many protesters are not averse to police, which may be the case for some volatile protests, the difference between the strategies is greater. So should an upcoming protest be known to be volatile, and resources allow, perhaps the more effective strategy is preferred despite the additional cost.
Further work would include interactions, such as arrests or violence between opposing protesters. Interactions can be modelled using game theory as presented in Goh et al. (2006). Alternatively, protester aversion could be updated over time, where aversion is influenced by surrounding events, similar to traits such as anger and fear being updated, as in the model of Pechenkina and Bennet (2017). More simply, an alternative model may follow more traditional models and consider all protesters to be present, but not 'active', meaning that they do not initially wish to cross the 'thin blue line', but may become 'active'. Or even the reverse of this, so that protesters are 'active' but can become 'inactive', perhaps due to an event like an arrest.
References
BARRY, R. (2017). Protesters clash with Britain First and EDL supporters in London. Accessed web 3 May 2017: http://www.dailymail.co.uk/wires/pa/article-4370788/Tensions-run-high-protesters-clash-Britain-First-EDL-supporters.html.
CTV Ottawa (2016). Pro-choice protestors crash anti-abortion rally. Accessed web 3 May 2017: https://ottawa.ctvnews.ca/pro-choice-protestors-crash-anti-abortion-rally-1.2900105.
DAVIES, T. P., Fry, H. M., Wilson, A. G., & Bishop, S. R. (2013). A mathematical model of the London riots and their policing. Scientific Reports, 3, 1303. [doi:10.1038/srep01303]
EPSTEIN, J. M. (2002). Modeling civil violence: An agent-based computational approach. Proceedings of the National Academy of Sciences, 99(suppl 3), 7243–7250.
FONOBEROVA, M., Fonoberov, V. A., Mezic, I., Mezic, J. & Brantingham, P. J. (2012). Nonlinear dynamics of crime and violence in urban settings. Journal of Artificial Societies and Social Simulation, 15(1), 2: https://www.jasss.org/15/1/2.html. [doi:10.18564/jasss.1921]
GOH, C. K., Quek, H. Y., Tan, K. C. & Abbass, H. A. (2006). Modeling civil violence: An evolutionary multi-agent, game theoretic approach. In Evolutionary Computation, 2006. CEC 2006. IEEE Congress, (pp. 1624–1631).
GRANOVETTER, M. (1978). Threshold models of collective behavior. American Journal of Sociology, 83(6), 1420–1443. [doi:10.1086/226707]
HATCH, J. (2017). Want to support planned parenthood? Don't counter-protest outside their clinics. Accessed web 3 May 2017: https://www.huffingtonpost.com/entry/want-to-support-planned-parenthood-dont-counter-protest-outside-their-clinics_us_5898eb41e4b040613138a29c.
KIM, J. W. & Hanneman, R. (2011). A computational model of worker protest. Journal of Artificial Societies and Social Simulation, 14(3), 1: https://www.jasss.org/14/3/1.html. [doi:10.18564/jasss.1770]
LEMOS, C., Coelho, H., & Lopes, R. J. (2013, December). Agent-based modeling of social conflict, civil violence and revolution: State-of-the-art-review and further prospects. In 11th European Conference on Multi-Agent Systems (pp. 124-138).
MCINTYRE, N. (2017). Police make 14 arrests as rival groups clash at joint Britain First-EDl protest in London. Accessed web 3 May 2017: http://www.independent.co.uk/news/uk/home-news/britain-first-english-defence-league-march-westminster-far-right-a7661561.html.
PECHENKINA, A. O., & Bennett, D. S. (2017). Violent and Non-Violent Strategies of Counterinsurgency. Journal of Artificial Societies and Social Simulation, 20(4), 11: https://www.jasss.org/14/3/1.html.
QUINN, B. (2012). Anti-abortion and pro-choice activists to stage rival protests outside clinic. Accessed web 3 May 2017: https://www.theguardian.com/world/2012/mar/30/anti-abortion-pro-choice-protests.