
Introduction
Traditional approaches to the social-scientific study of religion have difficulty accounting for the varied ways in which education, existential security, and social networks shape the religiosity of an individual and a collective of individuals. Existential security reflects the extent of economic, socioeconomic and human development provided by society (Norris & Inglehart 2011). Furthermore, understanding the dynamics of the relationship among these factors over time adds complexity. Simulated environments have been used to test different theories of religious extremism and different proposals for reducing religious violence (Upal 2005; Bainbridge 2006; Iannaccone & Makowsky 2007). However, we are unaware of any previous work to model the relationships of the aforementioned factors with respect to a collective of individuals in agent-based model using established empirical data sources. In this paper we explore this issue.
Our model can be parameterized for a given country and time period. Each agent has variables that reflect their education level, their existential insecurity, and different facets of their religiosity. In addition to these characteristics, each agent is connected to a social network of other agents. Based on their interactions with one another, the existential insecurity and religiosity variables of the agents change. We explore the behavior of the model to highlight those conditions that drive a collective of individuals over time to become more or less: (1) religious and (2) existentially secure.
Next, we conduct an evaluation which demonstrates that, for the countries and time periods studied, our model provides a more accurate forecast of changes in existential security and religiosity than two alternative approaches. Both the data processing in our model that leverages existing data sets and the relative accuracy of the forecasts are novel contributions. We conclude the paper by discussing the context in which of our model is valid and our model’s limitations. Despite the identified limitations, the model reflects an e ort to link empiricism and theory within an ABM as advocated by (Flache et al. 2017).
Background
In this section, we provide a brief overview of some of the major theoretical concerns related to the main variables in our model: religiosity, education, and existential security. In the sections that follow, we point to some of the previous simulation research related to these topics and present our own agent-based model.
Our first main variable is religiosity. Although the use of this term is highly contested, there is significant research from a wide variety of disciplines indicating that cohesion-enhancing ritual behaviors intended to engage super-natural agents that are believed to be interested in human affairs are virtually universal across cultures. These behaviors are the result of cognitive tendencies that are culturally evoked in a variety of ways (Atran 2004; McCauley & Lawson 2002; Wildman 2009; Shults 2015). In addition to this contextual variance, scholars of religion have also identified many ways in which these features vary across individuals in human populations. Despite this variance, the relevant features recur across cultures in recognizable patterns (Schuurmans-Stekhoven 2016; Caldwell-Harris 2012; Gebauer et al. 2012; Barber 2014).
The second main variable is education. The relationship between education and religiosity is well researched. Most studies show that there is a significant negative correlation between education and religiosity (Blancke et al. 2012; Hill 2014; Hungerman 2014; Lewis 2015). It is well known that scientists, for example, are typically less religious than the general population; this is often attributed to their educational background, which trains them to be analytical thinkers (Larson & Witham 1998; McCauley 2011; Norenzayan & Gervais 2013). There is some research that challenges the idea that education is always negatively related to religiosity. One study, for example, found that education was negatively associated with religiosity only for individuals with a weak religious background (Ganzach et al. 2013). However, the consensus in the literature is that analytical thinking skills taught in higher education are negatively correlated with religiosity even when controlling for the strength of one’s religious background (Dutton & Van der Linden 2017; Lynn et al. 2009). For the purposes of our model, we use a specific measure of education from an international survey as a proxy for education variables (i.e. analytical thinking) that negatively correlate with religiosity.
Existential security is our third main variable. The definition of existential security we adopt is related to the security axiom, which is based on the idea that "societies around the world differ greatly in their levels of economic and human development and socioeconomic equality - and consequently, in the extent to which they provide their people with a sense of existential security" (Norris & Inglehart 2011). This axiom is based on cross-cultural survey analyses that show that "the emergence of high levels of existential security tends to diminish anxiety and stress, promoting feelings of psychological well-being" - which, in turn, they argue, reduces the importance of religious values in people’s lives (Norris & Inglehart 2011, 2015).
Other research has shown that as secular institutions increasingly provide existential security for a population, there is a reduced reliance on religious institutions, which appears to cause a decline in religious belief and participation (Norenzayan 2015; Stolz et al. 2016; Kay et al. 2010; Habel & Grant 2013). This is particularly clear in Scandinavian societies such as Norway, where people feel they are protected by a strong social safety net, and report higher levels of existential security (and lower levels of religiosity) than most other countries (Kvande et al. 2015). Quantifying existential security, as we do in our model, is similar to the quantification of other human perceptions such as happiness (Helliwell et al. 2012; Gore et al. 2015; Dodds et al. 2011; Mitchell et al. 2013) or well-being (Deaton 2008; McMahan & Estes 2011; Decancq & Lugo 2013).
The agent-based model we describe in Section 4 explores the relationship between religiosity, education, and existential security. In future work, we plan to explore other factors that influence religiosity, such as pluralism and freedom of expression. While related research e orts have included the use of statistics to support their analyses, none have used agent-based models to forecast the way in which these factors affect changes in the religiosity of a population over time. Our work begins to fill this gap.
Related Work
Our model draws on social influence modeling and is related to a number of existing agent-based models. We review social influence modeling first and then describe the ABMs which are most closely related to our work.
Social influence modeling
Social influence is an important factor in human interaction. In encounters, individuals can modify their opinions, attitudes, beliefs, or behavior to mimic or to oppose those they interact with. These modifications can be the result of persuasion, uncertainty or peer pressure (Flache et al. 2017).
Initial social influence models included actors whose opinion on a position was socially influenced on a continuous spectrum (Abelson 1967; Berger 1981; DeGroot 1974; Lehrer 1975). Examples of these models include agents determining the appropriate speed on an interstate. Later, modelers assumed that opinions did not vary on a continuous scale but instead reflected a choice between mutually exclusive options (Axelrod 1997; Latané 1996; Liggett 2012; Sznajd-Weron & Sznajd 2000). Here, examples include political parties, music and movies. In some cases it is possible to model mutually exclusive options as nominal traits on a continuous spectrum (Nowak et al. 1990; Flache et al. 2017).
Recently, researchers have identified three classes of social-influence models that are the most popular in agent-based modeling. These classes of social influence models are: (1) assimilative social influence (Durkheim 2014; Myers 1982; Vinokur & Burnstein 1978; Akers et al. 1979), (2) similarity biased influence (Axelrod 1997; Carley 1991; Deffuant et al. 2000; Hegselmann et al. 2002; Mark 1998) and (3) repulsive influence (Jager & Amblard 2005; Macy et al. 2003; Mark 2003).
In assimilative social influence models, individuals are connected by a structural relationship and always influence each other to reduce opinion differences. Here, if the network is connected the influence dynamics eventually create consensus (Flache et al. 2017).
For models with similarity biased influence, only sufficiently similar individuals can influence each other to reduce opinion differences. How much similarity is sufficient depends on other mechanisms included in the model (e.g. social identity, confidence in others, etc). With similarity based influence consensus can be avoided. However, if the similarity bias is sufficiently strong, then multiple homogenous but distinct clusters of individuals emerge. Opinions, however, never leave the initial range (Deffuant et al. 2000; Hegselmann et al. 2002; Flache et al. 2017).
In models with repulsive influence, when individuals are too dissimilar they can influence each other to increase opinion differences. The amount of dissimilarity needed to trigger repulsive influence depends on other mechanisms included in the model (e.g. social identity, ego-involvement). Here, consensus can be avoided. Also, clusters can form and adopt maximally opposing views (bi-polarization). These dynamics allow opinions to leave the initial range (Flache et al. 2017).
It is important to note that most social influence models represent opinions as a one-dimensional variable. However, recent research has shown the importance of using a multidimensional model to study opinion polarization (Li & Xiao 2017). We employ this multi-dimensional representation in our representation of religiosity.
Related simulations
Other researchers have employed modeling and simulation methodologies to simulate culturally relevant change within individuals and collectives of individuals. Axelrod’s dissemination of culture model simulated a variety of mechanisms showing how interaction between different cultural features challenges intuitive assumptions about individuals’ beliefs and interpersonal behavior (Axelrod 1997). Chattoe and Hamill used an agent-based model to demonstrate that social networks situate beliefs. Specifically, the model shows that what one knows depends largely on who one knows (Chattoe & Hamill 2005). Chattoe also demonstrated how church survival, in terms of membership, is a function of rational choice theory (Chattoe 2006).
More recently, Upal and Gibbon developed an agent based system for simulating the dynamics of social identity beliefs that aimed at isolating factors that contribute to intergroup conflict (Upal & Gibbon 2015). Shults et al. developed two different computer simulations to demonstrate the impact of mortality salience on religiosity (Shults et al. 2018). At the same time, other researchers have used simulations of artificial societies composed of agents of two psychological types to create preferential self-organization into groups of ideological affinity (Abrica-Jacinto et al. 2017). Finally, agent-based modeling has also been used to study role of the emergence of a priestly class in solving large-scale social network coordination (Dávid-Barrett & Carney 2016), as well as the mechanisms that shape different modes of ritual interaction (Whitehouse et al. 2012).
The Simulation Model
The goal of our model is for a given time period and country to predict changes in the existential security and the religiosity of a collective of individuals using an agent-based model. Here we describe the architecture of our model including: (1) the entities within the model, (2) the data sources used to initialize the entities, and (3) the rules that dictate the interactions among them.
| Model Entity Name | Attributes | Representation |
| Agent | Religious Formation (RF) | Real number in [0,1] |
| Religious Practice (RP) | Real number in [0,1] | |
| Supernatural Beliefs (SB) | Real number in [0,1] | |
| Belief In God (BIG) | Real number in [0,1] | |
| Education (ED) | Integer from (1) no formal education to (6) university level with degree | |
| Existential Insecurity (EI) | Real number in [0,1] | |
| Social Network (SN) | Strength of relationship between any two agents | 2-D Matrix of Real numbers in [0,1] |
| Existential Security of Environment (ES) | NA | Real number in [0,1] |
Model entities
Our model is made up of agents interacting through social networks in an environment defined by its existential security level. Recall, existential security reflects the extent of economic, socioeconomic and human development provided by a country (Norris & Inglehart 2011). Each agent has an education level, an existential insecurity level, and four variables that reflect their religiosity. Each agent is also connected to a subset of the other agents in the model through a social network. An overview of these entities, with their attributes and representation, is shown in Table 1.
Religiosity variables
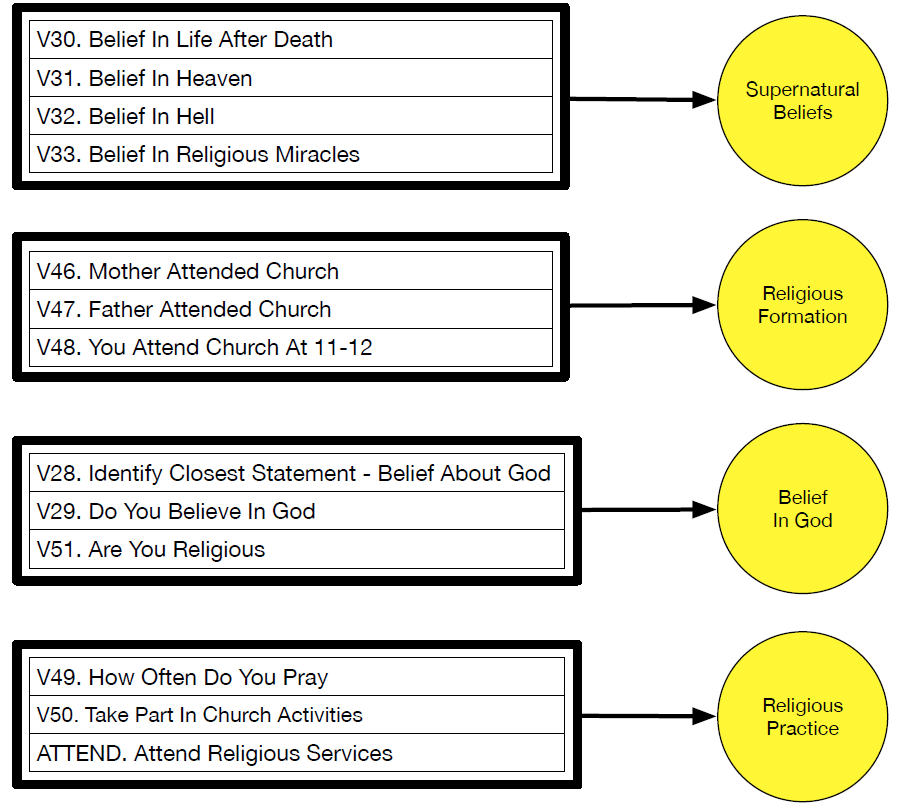
The four variables that reflect religiosity in each agent are: (1) religious formation, (2) religious practice, (3) supernatural beliefs, and (4) belief in God. The identification of these variables is based on a rigorous statistical analysis of questions and responses from the International Social Survey Programme Religion Module (ISSP) (Davis & Jowell 1989). This data contains the cumulated variables of the ISSP “Religion” surveys of 1991, 1998 and 2008 and includes 102,454 respondents from more than 20 countries.
Table 2 shows the questions selected for statistical analysis as well as the questions’ labels, number of valid Likert levels, and an indication of if we performed polarity inversion on the question. Questions V11-16 tap attitudes and values that are often explored in relation to religiosity. Questions V20-24 were included to study the correlation between religiosity and confidence in institutions. Questions V25-27 are related to the relationship between religion and politics. Questions V28-33, V35, V37 and V51 are related to beliefs in the “supernatural,” particularly in God (V28-29 and V35). Questions V46-48 are related to the attendance of the respondent’s mother and father, and self-attendance during a formative period (ages 11-12), which is often considered to be particularly influential on religious belief and practice later in life (Henrich 2009; Gervais & Najle 2015; Lanman 2012). Questions V49 (frequency of praying), V50 (participation in church activities other than regular religious services) and ATTEND (frequency of participation in regular religious services) are related to the respondent’s current religious practice. Since science is often in competition with supernatural beliefs, we also included questions V64-65.
The goal of the analysis of this data was to filter and aggregate the 31 questions in Table 2 into a lower number of unobserved variables called factors. The analysis results in a factor score for each respondent, for each factor, based on the respondent’s answers to the questions included in the factor. Factor scores are continuous numbers, which reflect the extent to which each respondent manifests each factor. For each factor, scores are distributed normally with a mean of 0 and a standard deviation of 1. However, we normalize scores for each factor on a 0 to 1 scale. Thus, a value of 1 reflects a respondent where the factor is heavily present and a value of 0 reflects a respondent where the factor is not present at all (DiStefano et al. 2009).
Ultimately, we identified 13 questions that form the aforementioned four religiosity factors. These questions and the factors they form are shown in Figure 1. Additional details about the choices associated with each question, iterative steps within the factor analysis, and the resulting measures of fit and statistical significance are provided in (Lemos et al. 2017).
| Label | Question Text | # of Levels | Inversion |
| V11 | Do you think it is wrong or not wrong if a man and a woman have sexual relations before marriage? | 4 | Yes |
| V12 | What about a married person having sexual relations with someone other than his or her husband or wife? | 4 | Yes |
| V13 | What about sexual relations between two adults of the same sex? | 4 | Yes |
| V14 | Is it wrong to have an abortion if there is a strong chance of serious defect in the baby? | 4 | Yes |
| V15 | Is it wrong to have an abortion if the family has a very low income and cannot afford any more children? | 4 | Yes |
| V16 | Agree/Disagree: A husband’s job is to earn money; a wife’s job is to look after the home and family | 5 | Yes |
| V20 | How much confidence do you have in Parliament (i.e. national legislature)? | 5 | Yes |
| V21 | How much confidence do you have in business and industry? | 5 | Yes |
| V22 | How much confidence do you have in churches and religious organizations? | 5 | Yes |
| V23 | How much confidence do you have in courts and the legal system? | 5 | Yes |
| V24 | How much confidence do you have in schools and the educational system? | 5 | Yes |
| V25 | Agree/Disagree: Religious leaders should not try to influence how people vote in elections. | 5 | No |
| V26 | Agree/Disagree: Religious leaders should not try to influence government decisions. | 5 | No |
| V27 | Do you think that churches and religious organizations in this country have too much power or too little power? | 5 | No |
| V28 | Please indicate which statement comes closest to expressing what you believe about God. | 6 | No |
| V29 | Which best describes your beliefs about God? | 4 | No |
| V30 | Do you believe in life after death? | 4 | Yes |
| V31 | Do you believe in heaven? | 4 | Yes |
| V32 | Do you believe in hell? | 4 | Yes |
| V33 | Do you believe in religious miracles? | 4 | Yes |
| V35 | Agree/Disagree: There is a God who concerns Himself with every human being personally? | 5 | Yes |
| V37 | Agree/Disagree: To me, life is meaningful only because God exists. | 5 | Yes |
| V46 | When you were a child, how often did your mother attend religious services? | 9 | No |
| V47 | When you were a child, how often did your father attend religious services? | 9 | No |
| V48 | What about when you were around 11 or 12, how often did you attend religious services then? | 9 | No |
| V49 | About how often do you pray? | 11 | No |
| V50 | How often do you take part in the activities or organizations of a church or place of worship other than attending services? | 11 | No |
| V51 | Would you describe yourself as religious? | 7 | Yes |
| V64 | Agree/Disagree: Overall, modern science does more harm than good. | 5 | Yes |
| V65 | Agree/Disagree: We trust too much in science and not enough in religious faith. | 5 | Yes |
| ATTEND | How often do you attend religious services? | 6 | Yes |
Existential security
Each agent is connected to the existential security level of the environment. The existential security level of the environment reflects the percentage of the agents that feel the level of economic, socioeconomic and human development support provided to them is sufficient. An agent determines if they feel existentially secure by checking if their value for existential insecurity is below the existential security value of the environment. The initialization of these entities and the variables that make up each agent are described next. Then the description of the interactions among agents and the environment are presented.
Data sources used to initialize entities
The initialization of each entity is based on the country and time period being modeled. For a given country and a given year, the existential security level of the environment is initialized using data from the Human Development Report (HDR). The HDR is an annual multi-facetted analysis of wellbeing focused on key dimensions of human development including a long life, a healthy life, and a decent standard of living. The Human Development Index (HDI) is the summary measure used in the HDR for a country’s achievement across these dimensions (Anand 1994).
Similarly, based on a specific country and a specific year, an agent is initialized by randomly sampling an ISSP respondent. Using the respondent’s data, the characteristics of an agent are parameterized. Specifically, the factor scores for the four religiosity factors of the chosen ISSP respondent initialize the agent’s religiosity variables and the education level of the respondent parameterizes the agent’s education level.
The education level of the respondent is based on the answer to the question: "What is the highest level of education you’ve achieved?" Responses to the question are coded on a 6-point scale from: (1) no formal education to (6) university level with degree. We do not employ factor analysis for the education variable because this question measures a response that is very close to the variable we want to capture and there are no additional questions related to education within the ISSP.
Finally, the existential insecurity level of an agent is parameterized by sampling a uniform distribution between 0 and 1. While this parameterization is not based on data, the interactions of the model tie each individual’s existential insecurity to the existential security level of the environment. This relationship is described further in Section 4.25.
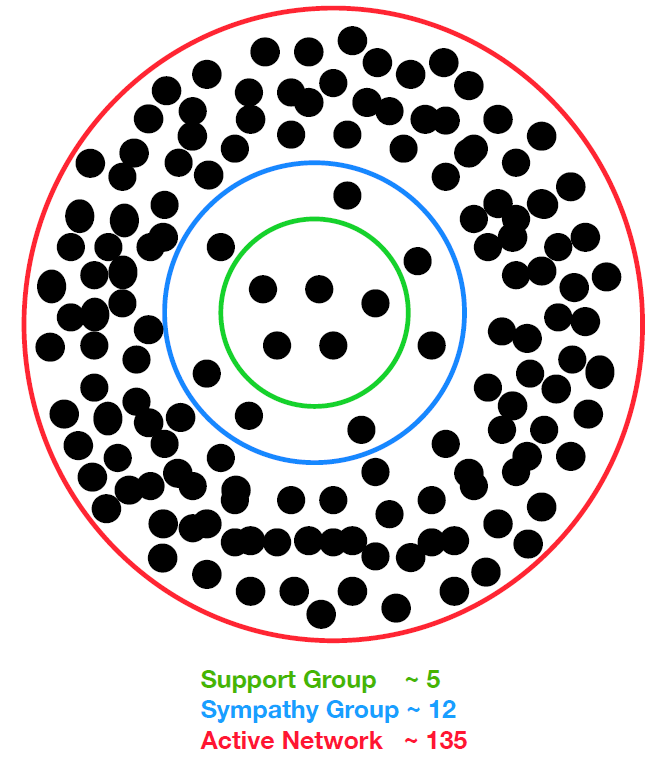
Each agent is also assigned a social network. The social network reflects an agent’s set of active social relationships. The number of and weight of the links within the network is constructed by an algorithm (Conti et al. 2011) that mirrors human social networks observed in the wild (Hill & Dunbar 2003; Dunbar & Shultz 2007). This research indicates that human relationships have a hierarchical structure and an individual has \(\sim\) 135 active social relationships (Dunbar 2009).
This limit is due to cognitive and time constraints of the individual (Hill & Dunbar 2003). The hierarchical structure of the network consists of a series of concentric layers of acquaintance with increasing sizes. The layers are hierarchically inclusive, so that each layer includes all inner levels. The innermost layer is the support group of the individual (size \(\sim\) 5) followed by the sympathy group (size \(\sim\) 12) and then entire active network (size \(\sim\) 135). This structure is depicted in Figure 2.
Within the network each relationship is also characterized by a level of emotional closeness. Strong relation-ships have a higher level of emotional closeness than weaker ones. The closeness reflects both the frequency of contact and time since last contact within the period of one week (Roberts & Dunbar 2011; Conti et al. 2011). In our implementation the emotional closeness is also correlated with the similarity in the education level of agents. This relationship has been observed in a several different social anthropology studies (McPherson et al. 2001, 2006; Mark 2003; Salzarulo 2006; Chattoe & Hamill 2005). The degree to which the educational level of the agent is correlated to the emotional closeness is determined by the parameter, Education Homophily (EH).
Interactions among entities
Given these initialized entities we define rules that govern the interactions among our entities. First, we review rules that dictate how changing religiosity variables influence one another. Next, we describe how agent’s interactions within their social network influence their existential insecurity and religiosity. Finally, we describe the rules related to agent interactions with the existential security level of the environment.
Organizing agent religiosity
We use structural equation modeling (SEM) to organize the relationships among the four religiosity factors. SEM enables us to hypothesize an architecture of the relationships among the factors and assess the extent to which the hypothesized architecture matches the observed data from the ISSP. Using our four factors it is possible to construct 588 unique SEM architectures. Of those 588, four models have identical fit statistics that are superior to the other 584. Of the four models with the best fit statistics, one places the factors in an order that is consistent with theories of religiosity posited in the scientific study of religion (Shults 2014; Holbrook et al. 2015; Crescentini et al. 2014; Ramsay et al. 2015; Davidson et al. 2003; Lutz et al. 2008; Norenzayan et al. 2012). This model is shown in Figure 3. Additional details and fit statistics for this and other candidate models are provided in (Lemos et al. 2017).
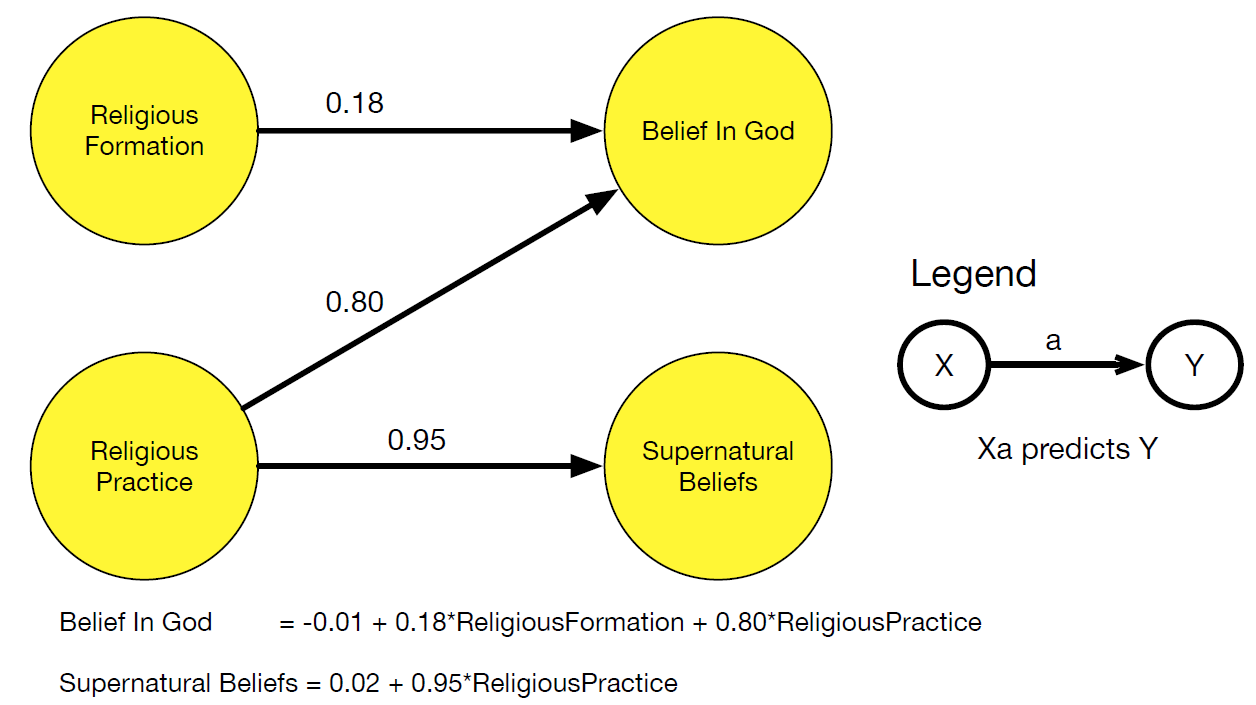
The model describes quantitatively how changes in religious practices and religious formation factors of an agent predict changes in the agent’s belief in God and the agent’s supernatural beliefs. Religious formation reflects questions related to the religious upbringing of the agent. Since this factor reflects events that have happened in the agent’s past, we do not update the value of this variable in our model.
Recent research has shown the importance of using a multidimensional representation of opinion to study the dynamics of social influence on polarization (Li & Xiao 2017). We employ this same idea in our multi-dimensional representation of religiosity shown in Figure 3. This capability can create a situation where two agents come to a consensus in one dimension of religiosity (i.e. supernatural beliefs) while being influenced to have polar opposite opinions on another (i.e belief In God).
Next, we describe how the value of an agent’s religious practice and existential insecurity variables can change based on influence from the social network.
Updating agent religiosity values based on social network interactions
At each time step agents interact with the agents in their social network. Each time step corresponds to one week. In this interaction the religious practice variable and existential insecurity within the agent are influenced by the respective values of these variables in other agents within their social network. The extent to which the variable is influenced is determined by a time-dependent weighted average. Given a matrix \(IN\) that includes an entry for the influence of each of the \(N\) agents on every other agent, the total influence exerted on agent \(i\) is show in Equation1.
| $$TotalInfluence_{i} = {\sum_{\substack{j=1 \\ i\neq j}}^{N} IN {i,j}}$$ | (1) |
\(TotalInfluence_{i}\) and a set \(A\) that includes all agents enables us to define, \(A_{SN_{v,t,i}}\). Set \(A\) contains the value of each variable \(v\), at each time step \(t\), for each agent \(j\), throughout the simulation (\(A_{v,t,j}\)). \(A_{SN_{v,t,i}}\) is the influence exerted on agent \(i\) by his/her social network (\(SN\)) for a given variable \(v\) at time \(t\). Formally it is shown in Equation 2.
| $$A_{SN_{v,t,i}} = \sum_{\substack{j=1 \\ i\neq j}}^{N} \frac{A_{{v,t,j}} \times IN {i,j}}{TotalInfluence_{i}}$$ | (2) |
Based on the influence exerted on the agent's religious practice variable from their social network at time \(t\) \((A_{SN_{RP,t,i}}\)), new values for the agent's supernatural belief \((A_{SN_{SB,t,i}}\)), and belief in God \((A_{SN_{BIG,t,i}}\)) variables are generated using the equations in the model shown in Figure 3.
Finally each value, based on the influence of the agent's interaction with the social network \((A_{SN_{RP,t,i}}\), \(A_{SN_{SB,t,i}}\), \(A_{SN_{BIG,t,i}}\), \(A_{SN_{EI,t,i}}\)), is combined with the agent’s existing value for the respective variable. This combination is computed using Cobb-Douglas function (Cobb & Douglas 1928). We employ the Cobb-Douglas function because it is an established, flexible, and widely used method to aggregate the influence of the environment with the existing value of a variable though the parameter \(\beta\). Formally, given a variable v, this combination is shown in Equation 3.
| $$A_{v,t+1,i}={A_{v,t,i}}^{\beta} \times {A_{SN_{v,t,i}}}^{1-\beta}$$ | (3) |
Interacting with the environment
Once every agent has computed the influence of their social network on the applicable variables, every agent interacts with the environment. An agent interacts with the environment by checking if their value for existential insecurity is below the existential security value of the environment. Recall for a given country and a given year, the environment is initialized with the country’s HDI value. Also, recall that the existential insecurity value of agents is initialized with a random number sampled from a uniform distribution between 0 and 1.
This check reflects whether or not the agent is provided sufficient existential security by the environment. Formally, the process of applying this check to all \(N\) agents at time step \(t\) to determine the influence of the agents on the existential security level of the environment \((ES_{agentInf,t}\)) is shown in Equation 4. Agents with high \(EI\) values are less likely to be provided sufficient existential security, while agents with low \(EI\) values are more likely to be provided sufficient existential security.
| $$ES_{agentInf,t} = \frac{1}{N} \times \sum_{i=1}^{N} \begin{cases} 1 & \mbox{if } {A_{EI,t,i}} < ES_{t} \\ 0 & \mbox{if } {A_{EI,t,i}} \geq ES_{t} \end{cases}$$ | (4) |
Finally, the value for the existential security of the environment in the next time step \((t+1\)) is computed by combining the value of the existential security value of the environment at time \(t\)with \(ES_{agentInf,t}\) at time step \(t\). This combination is also done with Cobb-Douglas function as described in Equation 3. The choice to reuse this function and its parameter, \(\beta\), improves parsimony by reducing the total number of parameters in our model. Recall, it also an established and widely used method to combine the intrinsic value of a variable with an environmental influence on the variable. An overview of the model and the data sources used to initialize the entities within the model is shown in Figure 4. Appendix A contains a parameter table for the model indicating the value of each parameter and the source of each parameter’s value.

Each of the interactions among the entities use assimilative social influence. Recall, this social influence model leads to general consensus amongst agents. However, employing social networks with educational homophily and a multi-dimensional representation of religiosity allows our model to avoid consensus. These dynamics can grow societies where two individuals with the same initial religious practices (or belief In God, or supernatural beliefs) evolve differently based on the educational backgrounds of the individuals with which they surround themselves. In the next section we evaluate our model against two alternatives to determine its effectiveness in forecasting changes in religiosity and existential security.
Evaluation
The effectiveness of our agent-based forecasts for changes in religiosity and existential security is elucidated through empirical evaluation against alternative modeling approaches. Specifically, we compare our agent-based approach to: (1) a baseline approach based entirely on historical data and (2) a statistical approach that uses linear regression modeling (LR).
For a given period of time, each model predicts changes in the religious practice, supernatural beliefs, belief In God, and existential security of the population of a given country. The baseline approach assumes there will be no changes in these factors from the most recent previous data. This approach mirrors predicting that the weather tomorrow will be the same as the weather today. The statistical approach uses regression to predict future changes in a variable using a weighted linear combination of the current variables (religious practice, education level, religious formation, existential security, supernatural beliefs, and belief in God).
| Model Type | Parameters |
| Baseline | None, fitting is unnecessary. |
| LR \(\overline{RP}\) Prediction | \(\:\:\:\,0.053 + (0.90 \times \overline{RP_{current}})\) |
| LR \(\overline{SB}\) Prediction | \(0.01 + (0.89 \times \overline{SB_{current}})\) |
| LR \(\overline{BIG}\) Prediction | \(-0.01 + (0.91 \times \overline{BIG_{current}})\) |
| LR \(ES\) Prediction | \(\:\:\:\,0.07 + (0.99 \times ES_{current})\) |
| ABM Predictions | \(\beta\) = \(9.4 \times 10^{-4}\) |
We evaluate each of these candidate models using a three part process. First, we identify similar time periods of measurement between the ISSP and HDR data. ISSP data was collected in 1991, 1998, and 2008 while HDR data was collected in 1980, 1985, 1990, 1995, 2000, 2005, 2010, and 2011-2014. Given that there is no intersection of common data collection we use time periods of HDR data that are closest to the ISSP time periods. These time periods are ISSP: 1991 - 1998 / HDR: 1990 - 2000 and ISSP: 1998 - 2008 / HDR: 2000 - 2010.
Next, for these time periods we identify the countries where data was collected in the ISSP and the HDR. There are 11 countries where data is collected in both time periods for both data sources. These countries are: Germany, Hungary, Ireland, Italy, Netherlands, New Zealand, Norway, Philippines, Poland, United Kingdom, and United States. The full availability of all country data within the ISSP and HDR is described in Appendix B.
Finally, we fit the parameters of each model. The baseline approach does not require this final step because it does not have any parameters. However, to fit the parameters of the LR models and our agent-based model, we perform an automated search over all the combinations of possible values for the parameters using data for all countries in the previous time period for which there is both ISSP and HDR data.
The automated search identifies the parameters for the model that minimize the root mean squared error (RMSE) of the absolute error of the mean forecast (\(\bar{e_{a}}\)) for each variable for each country. The \(\bar{e_{a}}\) for a country is determined taking the absolute value of the difference between the mean value of a forecasted variable and the mean of the actual data for the variable in the ISSP and HDR.
For the LR models this entails identifying the regression coefficients for each variable used as input. For our agent-based model this entails identifying values for the parameters: (1) Education Homophily (EH) and (2) Douglas-Cobb Function \(\beta\). Since the ABM is stochastic, 100 replications of each trial are performed and the mean of the 100 outputs is used.
To avoid overfitting the LR models, we only include LR models with statistically significant variables. Furthermore, since the ISSP does not collect longitudinal data, each LR model is only trained on country-level data (i.e. mean RP, mean SB, mean BIG) as opposed to individual-level data. These two factors (statistical significance and only country-level data) result in LR models which include only one variable, the current country-level value of the variable being predicted.
Recall, our data set only has two different time periods (ISSP: 1991 - 1998 / HDR: 1990 - 2000 and ISSP: 1998 - 2008 / HDR: 2000 - 2010). As a result, we fit the parameters of the regression models and the agent-based model using data from the first time period. Then we evaluate the accuracy of each model’s forecasts using data from the second time period. Since one time step in our agent-based model corresponds to one week, we simulation 520 time steps (10 years) in training and evaluation. The models and their parameters are shown in Table 3.
Next, we use the identified parameters to forecast the ISSP and HDR values for the upcoming time period. Accuracy of a forecast is measured by the RMSE of the \(\bar{e_{a}}\)for each variable for each country from the actual data ( ISSP: 1998 - 2008 / HDR: 2000 - 2010). In addition, we evaluate the RMSE of the absolute error of the standard deviation of the forecast (\(\sigma{e_{a}}\)) for each country for the variables religious practice, supernatural beliefs, and belief in God from the actual data. We cannot evaluate the RMSE of \(\sigma{e_{a}}\) for the existential security variable because the HDR data is recorded on a per country level, not a per person level. This limitation means that the existential security data for each country is a single number and does not have a distribution or variance. The overall accuracy of each model is reported in Table 4. The results for each individual country for all approaches are reported in Appendix C and the results for our ABM are shown in Figure 6.
| RMSE | Religious Practice | Supernatural Beliefs | Belief In God | Existential Security | ||||||||
| Base | LR | ABM | Base | LR | ABM | Base | LR | ABM | Base | LR | ABM | |
| RMSE | ||||||||||||
| \(\bar{e_{a}}\) | 0.052 | 0.059 | 0.039 | 0.058 | 0.070 | 0.058 | 0.057 | 0.037 | 0.028 | 0.039 | 0.024 | 0.008 |
| \(\sigma{e_{a}}\) | 0.032 | 0.035 | 0.032 | 0.034 | 0.040 | 0.030 | 0.020 | 0.020 | 0.018 | NA | ||
Table 4 shows that our parameterized ABM outperforms the baseline and LR approaches. Recall, each approach forecasts changes in the four variables for a given country over a given time period. For each of the four variables that each model predicts, the ABM has the lowest RMSE for the: (1) \(\bar{e_{a}}\) - absolute error of the mean forecast and (2) \(\sigma{e_{a}}\) - absolute error of the standard deviation of the forecast. This means that the forecasts for each of the four variables from the ABM better match the central tendency and variation of changes observed in the ISSP and HDR than the competing alternatives. Based on the factor and the evaluation measure, the ABM ranges from as accurate (\(RP_{\sigma{e_{a}}}\)) to 3 \(\times\) more accurate (\(ES_{\bar{e_{a}}}\)) than the next best alternative.
Next, we evaluate how effectively each of the trained models forecast changes in the four factors for a set of countries they have not been trained on. In this evaluation we use the 11 countries for which we have ISSP and HDR data from the most recent time period (ISSP 1998 - 2008 / HDR 2000 - 2010), but do not have data from the training time period (ISSP: 1991 - 1998 / HDR: 1990 - 2000). These countries are: Chile, Cyprus, Czech Republic, France, Portugal, Slovenia, Spain, Sweden, Switzerland, Denmark, and Japan.
This evaluation gives us insight into the robustness of the parameterizations identified in training. We use the term robust to reflect forecast accuracy for previously unseen countries and time periods. Again, we evaluate the RMSE of \(\bar{e_{a}}\) and \(\sigma{e_{a}}\) of each of the three modeling approaches for the 11 new countries. The overall accuracy of each model is reported in Table 5. The results for each individual country for all approaches are reported in Appendix D and the results for our ABM are shown in Figure 6.
| RMSE | Religious Practice | Supernatural Beliefs | Belief In God | Existential Security | ||||||||
| Base | LR | ABM | Base | LR | ABM | Base | LR | ABM | Base | LR | ABM | |
| RMSE | ||||||||||||
| \(\bar{e_{a}}\) | 0.032 | 0.041 | 0.032 | 0.065 | 0.105 | 0.065 | 0.039 | 0.037 | 0.033 | 0.41 | 0.024 | 0.011 |
| \(\sigma{e_{a}}\) | 0.024 | 0.029 | 0.019 | 0.023 | 0.035 | 0.017 | 0.029 | 0.028 | 0.012 | NA | ||
The evaluation shows that the ABM continues to perform as well as the best approach even when it is applied to forecast countries where training data did not exist. Furthermore, for several evaluation measures it continues to be multiple times more accurate than the best alternative. These results provide some evidence that our model can be used to forecast current changes in the religiosity and existential security for other countries not included in the evaluation. However, it should be noted the performance of our model in Table 5 (no training data) relative to the alternative approaches is not as strong as in Table 4 (training data).
This could be a result of incorrectly fitting our model. Recall, the use of our model in the evaluation follows a logic: first parameters within our model are fit using a data set and then the accuracy of a forecast is evaluated using a different data set from the same data source. However, an ABM fit in this manner, like any other model, may offer predictions at a certain level of accuracy despite using inaccurate parameter values (Chattoe-Brown 2014; Gore et al. 2017). This can happen because relevant variables that should be included in the model (i.e. gender and ethnicity) are not included.
We are aware of this limitation of our model and it may be manifested in the results of our evaluation. However, we are not aware of any other data sets, besides the ones we are currently employing, that could be used to evaluate our model and the two alternative models. Furthermore, our statistical analysis of the data sets has yet to reveal relevant significant differences across other possibly relevant variables (i.e. gender and ethnicity) with respect to the religiosity factors identified in Figure 1. Next, we explore the features of the model that distinguish it from alternative approaches included in the evaluation. Then, we discuss this issue further along with other limitations of our model.
Model Exploration
Three features distinguish our model from the alternative approaches included in the evaluation. These features are: (1) the existence of social networks with educational homophily, (2) the ability of agents to influence the religious practice and existential insecurity variables of one another via social networks, and (3) the ability of agents to influence the existential security level of the environment. To highlight how these features create conditions that enable accurate forecasts we explore the dynamics of our ABM predictions.
First, we consider how the existence of social networks with educational homophily affect change in the agent’s religious practice variable throughout the simulation. Existing research has shown that the level of education one has is inversely correlated with the extent of one’s religious practice (Albrecht & Heaton 1984; Larson & Witham 1998; Glaeser & Sacerdote 2008; McCauley 2011; Norenzayan & Gervais 2013). This relationship also exists within the ISSP dataset where the two variables have a -0.14 correlation with a p-value less than 0.01.
Our ABM implements this correlation through the educational homophily (EH) parameter. Recall, the EH parameter controls the degree of educational uniformity within one’s social network. This feature is important because it provides a means for the sustained existence of groups of individuals with high religious practices, belief in God, and supernatural beliefs in countries where the majority of the population has low religious practices, belief in God, and supernatural beliefs. In other words, this feature ensures that every agent in the population does not take on all the preferences of the majority.
Figure 5 elucidates this feature in our ABM. It shows the amount of change for agents in the ABM with similar initial values for their religious practices, belief in God, and supernatural beliefs broken down by education level. For each variable (religious practice, belief in God, and supernatural beliefs) the population is formed by running the ABM for all 22 countries and then matching each agent attached to a network where the majority of the members completed higher secondary education with a similar agent attached to a network where the majority of the members did not complete higher secondary education. Agents are considered similar if the initial values of the variable for the two agents differs by less than 0.01.
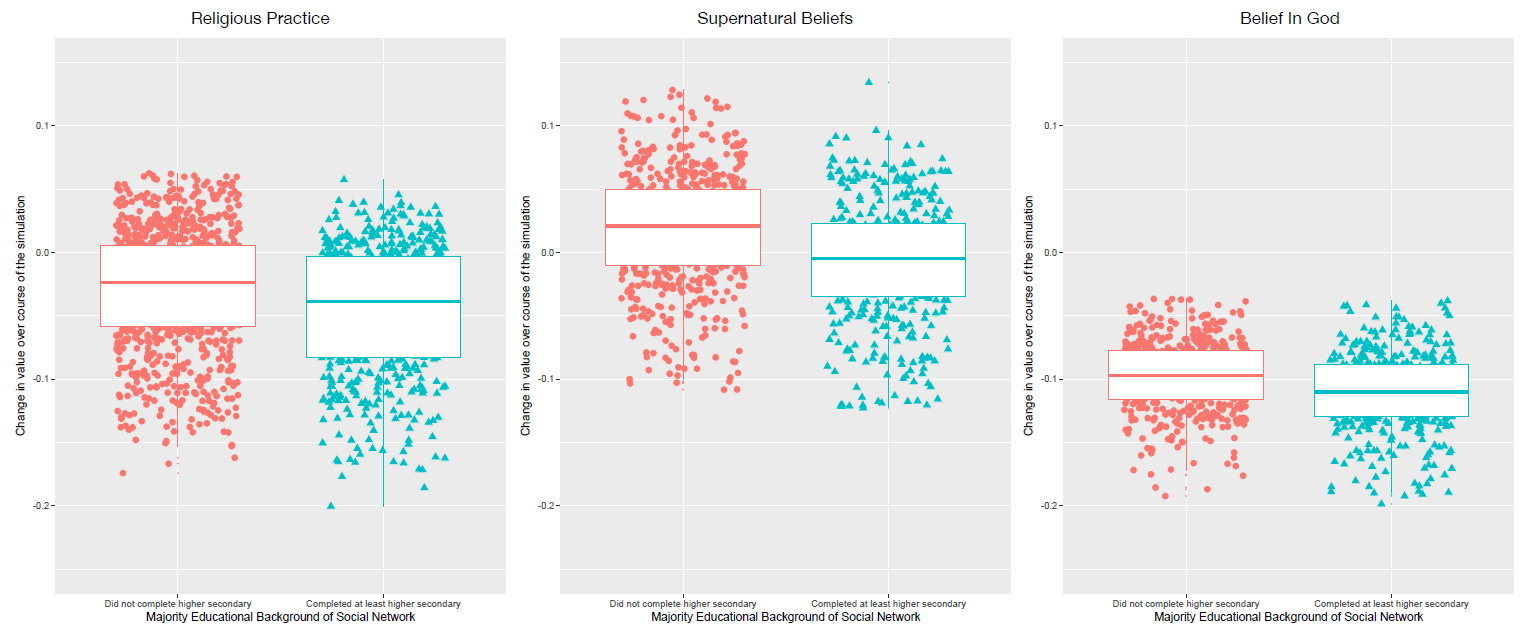
Figure 5 shows that within our ABM, in social networks where the majority of agents have completed post secondary education, agents have on average a steeper decline in their religious practices and belief in God than agents connected to social networks where the majority of agents have not completed post secondary education. Furthermore, Figure 5 shows that agents connected to social networks where the majority of agents have completed post secondary education, on average, do not increase their supernatural beliefs, while those agents connected to social networks where the majority of agents have not completed post secondary education, do increase their supernatural beliefs.
These dynamics can grow a society where two individuals with the same initial religious practices (or belief In God, or supernatural beliefs) evolve differently based on the educational backgrounds of the individuals with which they surround themselves.
Next, we explore: (1) how the social networks in our ABM create changes in existential security for each of the countries and (2) how those changes in the existential security level of the ABM environment correlate with changes in religious practice, supernatural beliefs and, belief In God. For each of the 22 countries presented in our evaluation, the ABM predicts that the existential security of the environment will increase over time. The extent of that increase, how accurate the prediction is, and how the predictions correlates with predicted changes in the religiosity variables are shown in Figure 6.
Figure 6 shows that when the existential security level of the environment in our ABM is high (\(>\)0.80) almost all agents feel existentially secure and the existential security level of the environment immediately increases. These types of predictions for our ABM are seen for countries including: Denmark, France, Germany, Ireland, Japan, Netherlands, New Zealand, Norway, Sweden, Switzerland, United Kingdom, and United States.
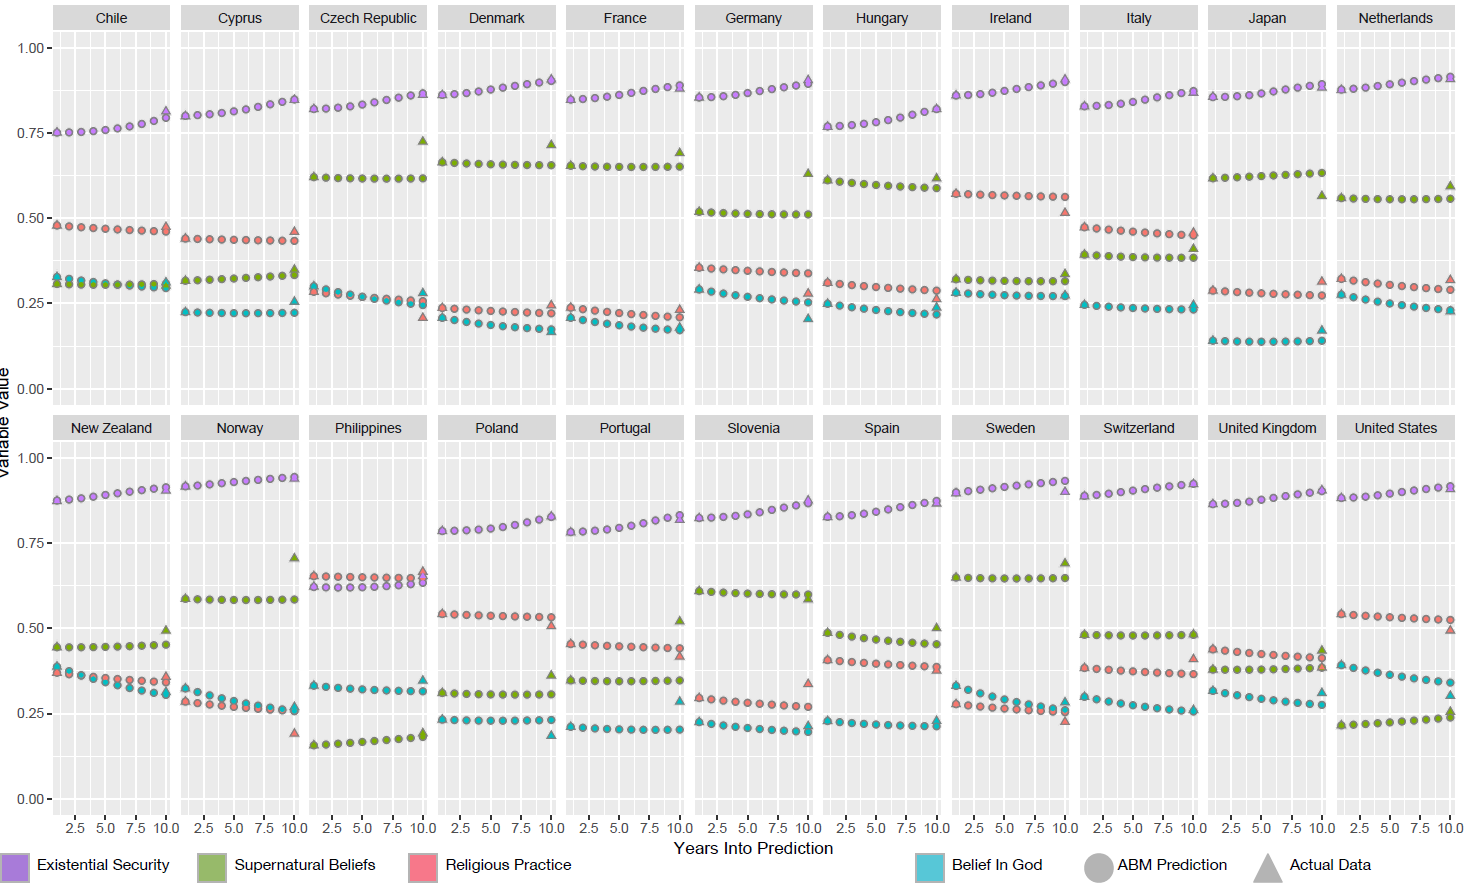
However, if the initial existential security level of the environment is less than 0.80, there is not any growth in the existential security of the environment during the first three years. Eventually, the social network interactions of the agents within the ABM result in fewer agents with extreme existential insecurity values, creating fewer agents that feel existentially insecure and ultimately creating an increase in the existential security of the environment starting after year three. This increase continues through year ten. These types of predictions for our model are seen for countries including: Chile, Cyprus, Hungary, Italy, Poland, Portugal, Slovenia, and Spain.
This pattern of predicting staggered existential security growth is even more pronounced for countries where the initial existential security value is less than 0.65. This is the case with our ABM’s prediction for the Philippines. Here there is no growth in the existential security of the environment for the first seven years of the prediction until finally there are enough social network interactions of the agents within the ABM to create a sufficient number of agents that feel existentially secure resulting in an increase in the existential security of the environment from years seven to ten.
It is important to note that our model does not predict existential security growth for countries where the initial existential security value of the environment is below 0.50. Under these conditions the existential security of the environment decreases over time. Recall, the existential insecurity level of agents is uniformly distributed from [0,1]. As the agents interact, the existential insecurity level of each agent becomes less extreme, but since the existential security of the environment is below 0.50 most agents in the population still feel existentially insecure despite less extreme existential insecurity values.
The behavior of our model under these conditions needs to be explored further and refined. The HDR data shows that the existential security value of the environment increases for many countries with an initial value less than 0.50. As currently constructed our model cannot replicate this behavior. However, it is also important to note that all the countries in the HDR that show a decrease over time in the existential security value of the environment are countries where the initial value is less than 0.50. In future work we will look to produce a more refined algorithm that takes into account each of these possible trajectories for countries with low existential security.
Figure 6 also shows that each increase in existential security predicted by our ABM is coupled with predictions for a decrease in belief in God. Furthermore, the magnitude of the predicted increase in existential security is almost exactly the same as the magnitude of the predicted decrease in belief in God. It is important to note that this relationship between existential security and belief in God is not encoded in any of the rules or interactions within our model. It emerges from the model interactions and the data that parameterizes the model for each of the countries. We will explore this result and gather more data as to why the same trend does not exist for supernatural beliefs and religious practice in future work.
Model Validity and Limitations
Construct, internal, and external validity threats affect our model. In addition to these validity threats, our model has a number of limitations. Here we review each of these areas and discuss how they relate to our model.
Construct validity
Threats to construct validity concern the appropriateness of the measures used to represent the entities in our model. While the data processing we use to leverage existing data sets reflects a novel means to construct an ABM, it limits the construct validity of our model in four ways.
First, recall that we employ factors scores to aggregate and convert the Likert scores in the ISSP survey into continuous variables in the construction of the religious architecture for our agents (Figure 3). Constructing agents that reason with a continuous representation of discretized data (i.e. Likert scores) can bias the manner in which the survey data informs the model in some cases (Flache & Macy 2006). It is important to note though, that often fundamental results for models that use a continuous representation of discrete data generalize to other models that with a similar formalization of social influence (Flache et al. 2017).
Second, constructing a SEM that is based on aggregate data may reduce the means in which agents can store and change their individual opinions in the model (Epstein 1999; Chattoe-Brown 2014). However, the previous section shows that our model is capable of producing societies where two individuals with the same initial religious practices (or belief In God, or supernatural beliefs) evolve differently based on the educational backgrounds of the individuals with which they surround themselves.
Third, the social networks employed in our model are static. While the networks enable the variables associated with each agent to change over time, the structure of the network and the weight of each link does not change. As a result, our networks do not reflect exogenous events (e.g., work change, death of a node, marriages, etc.). In future work we will explore the interplay of individual behavior and network dynamics by taking advantage of existing research in computational sociology. Specifically we will explore work on the co-evolution of behaviour and social network structure (Fehl et al. 2011) as well as approaches to study the coevolution of networks in social dilemmas (Corten 2014; Bravo et al. 2012). We expect that work in this direction may enable us to highlight the self organization of religious groups related to education and existential security as shown in (Abrica-Jacinto et al. 2017).
Finally, the largest concern related to construct validity involves equifinality. The construction of our model required us to make a series of reasonable assumptions to fill unanticipated specificity gaps. While we did our best to address each gap with the most reasonable assumption, many other reasonable assumptions could also have been made, and it is likely that some of the models resulting from those assumptions would produce models with similar, possibly even superior, levels of forecast accuracy (Poile & Safayeni 2016). The choices in our model serve as recommendations for other researchers tasked within similar problems but we are also open to a dialog on alternative selections within our model construction.
Internal and external validity
Internal validity threats arise when factors affect the dependent variables without the modelers knowledge. It is possible that some implementation flaws could have affected the evaluation results. However, the algorithms we used to within our model passed several internal code reviews and the RMSE of the \(\bar{e_{a}}\) and \(\sigma{e_{a}}\) of the model for each of the countries reflect the mean value taken over 100 replications.
Threats to external validity occur when the results of the model cannot be generalized. Although the evaluation was performed for using \(\sim\) 20 years of data from two well known sources the results of our model cannot be generalized to: (1) other countries, (2) during different years or (3) different data sets.
Limitations
It is important to note that our model does not offer a more accurate prediction for religious practice, supernatural beliefs, belief In God and existential security than the two alternative models for every country. However, for the countries on which the models were trained our model offers more accurate predictions for: 8/11 countries for Religious Practice, 7/11 countries for Supernatural Beliefs, 6/11 for Belief In God, 11/11 for Existential Security. This reflects a statistically significant superior level of accuracy for our model compared to the best of the two alternatives for each country with p < 0.05 (p = 0.012). This is evidence that the superior level of accuracy for our model on countries for which it was trained is more than just random noise in the output of the models.
For the countries on which the models were not trained our model offers more accurate predictions for: 4/11 countries for Religious Practice, 6/11 countries for Supernatural Beliefs, 2/11 for Belief In God, 9/11 for Existential Security. This does not reflect a statistically significant superior level of accuracy for our model compared to the best of the two alternatives for each country. As discussed in the Evaluation, this may be a result of over fitting the model for countries on which it was trained or under fitting the model by not including enough relevant variables. Additionally, the lack of a statistically significant superior level of accuracy may indicate that our assumption that religious practice, supernatural beliefs, belief In God and existential security are all times series that are instances of the underlying data generation process is incorrect. Each of these possible explanations will be explored in future work.
Finally, we emphasize that we have only evaluated our ABM against two alternative approaches, neither of which is an ABM. While, the Baseline and LR models reflect accessible alternate strategies to forecasting religious practice, supernatural beliefs, belief In God and existential security, they are simple models. However, our evaluation serves as a platform for other researchers to try and construct alternative ABMs with superior accuracy in the same manner. Providing such a platform is a necessary step to creating models of complex systems that can inform policy decisions (Ahrweiler et al. 2015).
Conclusion
Our work employs existing data sets and agent-based modeling to forecast changes in the religiosity and existential security among a collective of individuals over time. Our model includes agents in social networks interacting with one another based on the education level of the agents, the religious practices of the agents, and each agent’s existential security within their natural and social environments. The data used to inform the values and relationships among these variables is based on rigorous statistical analysis of the International Social Survey Programme Religion Module (ISSP) and the Human Development Report (HDR).
Our results show that for a given country and a given time period, our model provides a more accurate forecast of changes in the existential security and the religiosity than two alternative approaches for a specific time period for specific countries. While the context in which of our model is valid is constrained and the model has a number of limitations it reflects an e ort to link empiricism and theory within an ABM. In future work, we will explore additional mechanisms that may help to further clarify the changes in religiosity observed in our model and the possible adaptive role of secularization.
Appendix
A - Model parameters and references
| Variable | Description | Value | Source |
| Model Parameters | |||
DOUGLAS_COBB_BETA | Value of \(\beta\) in Douglas-Cobb Function | \(9.4 \times 10^{-4}\) | Trained w/ ISSP and HDR |
Country | Country to forecast | Identified in Table 6. | ISSP and HDR |
startYear | Initial year to forecast | 1998 | ISSP |
endYear | Final year to forecast | 2008 | ISSP |
numberOfAgents | Number of agents to simulate | 5,000 | Sensitivity analysis shows this value |
| yields stable results between runs | |||
COUNTRY_ES | Existential security level of country | HDI value for Country | HDR (Anand 1994) |
| Agent Parameters | |||
supernaturalBeliefs | supernatural beliefs of agent | [0,1] | randomly sampled ISSP respondent |
| normalized factor score* | |||
religiousFormation | religious formation of agent | [0,1] | randomly sampled ISSP respondent |
| normalized factor score* | |||
beliefInGod | belief in God of agent | [0,1] | randomly sampled ISSP respondent |
| normalized factor score* | |||
religiousPractice | religious practice of agent | [0,1] | randomly sampled ISSP respondent |
| normalized factor score* | |||
educationLevel | education level of agent | response on 6-point scale | randomly sampled ISSP respondent* |
| (1) no formal education to | |||
| (6) university level w/ degree | |||
securityLevel | existential security level of agent | U [0,1] | Compared against COUNTRY_ES |
| * denotes that the same randomly | |||
| sampled respondent is used to | |||
| initialize all parameters for an agent | |||
| Network Parameters | |||
EDUCATION_HOMOPHILY | Educational similarity between agents in the network | 0.40 | Trained w/ ISSP and HDR |
timeStepLength | Length in weeks to interact w/all agents in network | 1 | specified in Conti et al. (2011) |
W_MEAN | \(\mu\) normal distribution for support group size | 0.3217 | \(f_{w}\) in Conti et al. (2011) |
W_STD | \(\sigma\) of normal distribution for ratio determining support group size | 0.1608 | \(f_{w}\) in Conti et al. (2011) |
S_ALPHA | \(\alpha\) of gamma distribution of sympathy group size | 4.1 | \(f_{s}\) in Conti et al. (2011) |
S_BETA | \(\beta\) of gamma distribution of sympathy group size | 3.49 | \(f_{s}\) in Conti et al. (2011) |
B_ALPHA | \(\alpha\) of gamma distribution of network construction time budget | 205.48 | \(f_{b}\) in Conti et al. (2011) |
B_BETA | \(\beta\) of gamma distribution of network construction time budget | 8.5264 | \(f_{b}\) in Conti et al. (2011) |
E_K_ALPHA | \(\alpha\) of gamma distribution of weight of kin relationships in the network | 1.85 | \(f_{e,k}\) in Conti et al. (2011) |
E_K_BETA | \(\beta\) of gamma distribution of weight of kin relationships in the network | 2.296 | \(f_{e,k}\) in Conti et al. (2011) |
E_NK_MEAN | \(\mu\) of gamma distribution of weight of non-kin relationships in the network | 0.485 | \(f_{e,nk}\) in Conti et al. (2011) |
E_NK_STD | \(\sigma\) of gamma distribution of weight of non-kin relationships in the network | 0.17 | \(f_{e,nk}\) in Conti et al. (2011) |
E_K_SUP_LOWER_LIMIT | lower limit on weight of kin relationship in support group | 0.8582 | \(low_{k,sup}\) in Conti et al. (2011) |
E_K_SYM_LOWER_LIMIT | lower limit on weight of kin relationship in sympathy group | 0.7247 | \(low_{k,sym}\) in Conti et al. (2011) |
E_NK_SUP_LOWER_LIMIT | lower limit on weight of non-kin relationship in support group | 0.8185 | \(low_{nk,sup}\) in Conti et al. (2011) |
E_NK_SYM_LOWER_LIMIT | lower limit on weight of kin relationship in sympathy group | 0.6852 | \(low_{nk,sym}\) in Conti et al. (2011) |
E_MAX | maximum weight of a relationship in network | 1.0 | \(e_{max}\) in Conti et al. (2011) |
E_MIN | minimum weight of a relationship in network | 0.0 | \(e_{min}\) in Conti et al. (2011) |
B - Country data availability
| Data Availability | Data Availability | Data Availability | |
| Country | ISSP 1991 / HDR 1990 | ISSP 1998 / HDR 2000 | ISSP 2008 / HDR 2010 |
| Austria | NO / YES | YES / YES | NO / YES |
| Chile | NO / YES | YES / YES | YES / YES |
| Cyprus | NO / YES | YES / YES | YES / YES |
| Czech Republic | NO / YES | YES / YES | YES / YES |
| France | NO / YES | YES / YES | YES / YES |
| Germany | YES / YES | YES / YES | YES / YES |
| Hungary | YES / YES | YES / YES | YES / YES |
| Israel | NO / YES | NO / YES | YES / YES |
| Latvia | NO / YES | YES / YES | YES / YES |
| Netherlands | YES / YES | YES / YES | YES / YES |
| Poland | YES / YES | YES / YES | YES / YES |
| Portugal | NO / YES | YES / YES | YES / YES |
| Slovenia | NO / YES | YES / YES | YES / YES |
| Spain | NO / YES | YES / YES | YES / YES |
| United Kingdom | YES / YES | YES / YES | YES / YES |
| United States | YES / YES | YES / YES | YES / YES |
| New Zealand | YES / YES | YES / YES | YES / YES |
| Sweden | NO / YES | YES / YES | YES / YES |
| Switzerland | NO / YES | YES / YES | YES / YES |
| Ireland | YES / YES | YES / YES | YES / YES |
| Denmark | NO / YES | YES / YES | YES / YES |
| Japan | NO / YES | YES / YES | YES / YES |
| Australia | YES / YES | NO / YES | YES / YES |
| Italy | YES / YES | YES / YES | YES / YES |
| Norway | YES / YES | YES / YES | YES / YES |
| Philippines | YES / YES | YES / YES | YES / YES |
C - Results for countries models were trained on
| Country | Religious Practice | Supernatural Beliefs | Belief In God | Existential Security | ||||||||
| Base | LR | ABM | Base | LR | ABM | Base | LR | ABM | Base | LR | ABM | |
| Germany | ||||||||||||
| \(\bar{e_{a}}\) | 0.088 | 0.102 | 0.067 | 0.119 | 0.175 | 0.124 | 0.085 | 0.056 | 0.046 | 0.051 | 0.009 | 0.009 |
| \(\sigma{e_{a}}\) | 0.006 | 0.029 | 0.005 | 0.003 | 0.035 | 0.009 | 0.004 | 0.026 | 0.021 | NA | ||
| Hungary | ||||||||||||
| \(\bar{e_{a}}\) | 0.048 | 0.068 | 0.022 | 0.020 | 0.051 | 0.006 | 0.013 | 0.013 | 0.023 | 0.051 | 0.009 | 0.006 |
| \(\sigma{e_{a}}\) | 0.01 | 0.014 | 0.004 | 0.001 | 0.034 | 0.018 | 0.010 | 0.032 | 0.028 | NA | ||
| Ireland | ||||||||||||
| \(\bar{e_{a}}\) | 0.067 | 0.059 | 0.059 | 0.023 | 0.127 | 0.039 | 0.006 | 0.022 | 0.005 | 0.047 | 0.013 | 0.006 |
| \(\sigma{e_{a}}\) | 0.048 | 0.064 | 0.013 | 0.013 | 0.039 | 0.005 | 0.014 | 0.008 | 0.019 | NA | ||
| Italy | ||||||||||||
| \(\bar{e_{a}}\) | 0.019 | 0.022 | 0.011 | 0.022 | 0.065 | 0.037 | 0.004 | 0.021 | 0.014 | 0.040 | 0.020 | 0.007 |
| \(\sigma{e_{a}}\) | 0.01 | 0.016 | 0.018 | 0.013 | 0.021 | 0.012 | 0.044 | 0.021 | 0.032 | NA | ||
| Netherlands | ||||||||||||
| \(\bar{e_{a}}\) | 0.002 | 0.021 | 0.036 | 0.039 | 0.101 | 0.038 | 0.072 | 0.042 | 0.011 | 0.032 | 0.028 | 0.006 |
| \(\sigma{e_{a}}\) | 0.023 | 0.005 | 0.001 | 0.091 | 0.055 | 0.084 | 0.032 | 0.007 | 0.002 | NA | ||
| New Zealand | ||||||||||||
| \(\bar{e_{a}}\) | 0.011 | 0.025 | 0.006 | 0.035 | 0.086 | 0.034 | 0.091 | 0.052 | 0.008 | 0.031 | 0.029 | 0.007 |
| \(\sigma{e_{a}}\) | 0.009 | 0.038 | 0.006 | 0.006 | 0.044 | 0.003 | 0.015 | 0.013 | 0.017 | NA | ||
| Norway | ||||||||||||
| \(\bar{e_{a}}\) | 0.081 | 0.106 | 0.052 | 0.106 | 0.172 | 0.096 | 0.051 | 0.019 | 0.023 | 0.023 | 0.037 | 0.005 |
| \(\sigma{e_{a}}\) | 0.081 | 0.055 | 0.025 | 0.049 | 0.012 | 0.044 | 0.015 | 0.010 | 0.017 | NA | ||
| Philippines | ||||||||||||
| \(\bar{e_{a}}\) | 0.023 | 0.038 | 0.031 | 0.027 | 0.044 | 0.010 | 0.007 | 0.041 | 0.028 | 0.031 | 0.031 | 0.013 |
| \(\sigma{e_{a}}\) | 0.020 | 0.003 | 0.090 | 0.020 | 0.037 | 0.021 | 0.012 | 0.037 | 0.008 | NA | ||
| Poland | ||||||||||||
| \(\bar{e_{a}}\) | 0.039 | 0.035 | 0.046 | 0.043 | 0.078 | 0.071 | 0.053 | 0.029 | 0.049 | 0.043 | 0.018 | 0.007 |
| \(\sigma{e_{a}}\) | 0.023 | 0.041 | 0.032 | 0.014 | 0.043 | 0.001 | 0.015 | 0.007 | 0.021 | NA | ||
| United Kingdom | ||||||||||||
| \(\bar{e_{a}}\) | 0.057 | 0.06 | 0.028 | 0.054 | 0.096 | 0.053 | 0.022 | 0.011 | 0.029 | 0.041 | 0.019 | 0.002 |
| \(\sigma{e_{a}}\) | 0.007 | 0.033 | 0.009 | 0.007 | 0.052 | 0.010 | 0.005 | 0.019 | 0.002 | NA | ||
| United States | ||||||||||||
| \(\bar{e_{a}}\) | 0.049 | 0.045 | 0.028 | 0.045 | 0.068 | 0.006 | 0.097 | 0.058 | 0.035 | 0.026 | 0.034 | 0.010 |
| \(\sigma{e_{a}}\) | 0.003 | 0.028 | 0.031 | 0.029 | 0.054 | 0.006 | 0.015 | 0.010 | 0.016 | NA | ||
| RMSE | ||||||||||||
| \(\bar{e_{a}}\) | 0.052 | 0.059 | 0.039 | 0.058 | 0.070 | 0.058 | 0.057 | 0.037 | 0.028 | 0.039 | 0.024 | 0.008 |
| \(\sigma{e_{a}}\) | 0.032 | 0.035 | 0.032 | 0.034 | 0.040 | 0.030 | 0.020 | 0.020 | 0.018 | NA | ||
D - Results for countries models were not trained on
| Country | Religious Practice | Supernatural Beliefs | Belief In God | Existential Security | ||||||||
| Base | LR | ABM | Base | LR | ABM | Base | LR | ABM | Base | LR | ABM | |
| Chile | ||||||||||||
| \(\bar{e_{a}}\) | 0.001 | 0.003 | 0.019 | 0.015 | 0.046 | 0.004 | 0.033 | 0.001 | 0.012 | 0.062 | 0.001 | 0.014 |
| \(\sigma{e_{a}}\) | 0.003 | 0.021 | 0.023 | 0.002 | 0.026 | 0.015 | 0.016 | 0.007 | 0.023 | NA | ||
| Cyprus | ||||||||||||
| \(\bar{e_{a}}\) | 0.018 | 0.012 | 0.026 | 0.024 | 0.059 | 0.001 | 0.040 | 0.062 | 0.040 | 0.048 | 0.012 | 0.004 |
| \(\sigma{e_{a}}\) | 0.054 | 0.067 | 0.004 | 0.049 | 0.074 | 0.030 | 0.044 | 0.062 | 0.005 | NA | ||
| Czech Republic | ||||||||||||
| \(\bar{e_{a}}\) | 0.067 | 0.091 | 0.035 | 0.096 | 0.166 | 0.080 | 0.024 | 0.006 | 0.039 | 0.042 | 0.018 | 0.006 |
| \(\sigma{e_{a}}\) | 0.010 | 0.016 | 0.023 | 0.018 | 0.018 | 0.004 | 0.012 | 0.036 | 0.008 | NA | ||
| France | ||||||||||||
| \(\bar{e_{a}}\) | 0.012 | 0.039 | 0.020 | 0.032 | 0.105 | 0.019 | 0.037 | 0.014 | 0.007 | 0.033 | 0.027 | 0.010 |
| \(\sigma{e_{a}}\) | 0.014 | 0.011 | 0.037 | 0.009 | 0.027 | 0.001 | 0.038 | 0.013 | 0.009 | NA | ||
| Portugal | ||||||||||||
| \(\bar{e_{a}}\) | 0.042 | 0.046 | 0.026 | 0.170 | 0.208 | 0.166 | 0.066 | 0.088 | 0.081 | 0.037 | 0.024 | 0.012 |
| \(\sigma{e_{a}}\) | 0.030 | 0.051 | 0.002 | 0.035 | 0.065 | 0.028 | 0.030 | 0.005 | 0.011 | NA | ||
| Slovenia | ||||||||||||
| \(\bar{e_{a}}\) | 0.031 | 0.010 | 0.061 | 0.029 | 0.040 | 0.003 | 0.033 | 0.008 | 0.008 | 0.052 | 0.008 | 0.006 |
| \(\sigma{e_{a}}\) | 0.010 | 0.014 | 0.012 | 0.024 | 0.012 | 0.016 | 0.044 | 0.019 | 0.005 | NA | ||
| Spain | ||||||||||||
| \(\bar{e_{a}}\) | 0.023 | 0.034 | 0.009 | 0.014 | 0.068 | 0.055 | 0.002 | 0.022 | 0.017 | 0.040 | 0.020 | 0.006 |
| \(\sigma{e_{a}}\) | 0.004 | 0.026 | 0.010 | 0.010 | 0.023 | 0.009 | 0.010 | 0.032 | 0.006 | NA | ||
| Sweden | ||||||||||||
| \(\bar{e_{a}}\) | 0.047 | 0.071 | 0.020 | 0.031 | 0.104 | 0.036 | 0.053 | 0.02 | 0.028 | 0.004 | 0.050 | 0.029 |
| \(\sigma{e_{a}}\) | 0.032 | 0.009 | 0.005 | 0.017 | 0.016 | 0.015 | 0.002 | 0.024 | 0.027 | NA | ||
| Switzerland | ||||||||||||
| \(\bar{e_{a}}\) | 0.019 | 0.007 | 0.040 | 0.003 | 0.056 | 0.004 | 0.042 | 0.012 | 0.006 | 0.036 | 0.020 | 0.001 |
| \(\sigma{e_{a}}\) | 0.026 | 0.002 | 0.027 | 0.032 | 0.001 | 0.029 | 0.045 | 0.021 | 0.002 | NA | ||
| Spain | ||||||||||||
| \(\bar{e_{a}}\) | 0.004 | 0.023 | 0.024 | 0.047 | 0.121 | 0.061 | 0.04 | 0.018 | 0.006 | 0.046 | 0.010 | 0.002 |
| \(\sigma{e_{a}}\) | 0.004 | 0.015 | 0.020 | 0.003 | 0.034 | 0.006 | 0.022 | 0.003 | 0.005 | NA | ||
| Japan | ||||||||||||
| \(\bar{e_{a}}\) | 0.024 | 0.002 | 0.041 | 0.049 | 0.019 | 0.065 | 0.029 | 0.044 | 0.031 | 0.027 | 0.033 | 0.005 |
| \(\sigma{e_{a}}\) | 0.014 | 0.004 | 0.027 | 0.005 | 0.023 | 0.001 | 0.009 | 0.029 | 0.012 | NA | ||
| RMSE | ||||||||||||
| \(\bar{e_{a}}\) | 0.032 | 0.041 | 0.032 | 0.065 | 0.105 | 0.065 | 0.039 | 0.037 | 0.033 | 0.41 | 0.024 | 0.011 |
| \(\sigma{e_{a}}\) | 0.024 | 0.029 | 0.019 | 0.023 | 0.035 | 0.017 | 0.029 | 0.028 | 0.012 | NA | ||
References
ABELSON, R. P. (1967). Mathematical models in social psychology. Advances in Experimental Social Psychology, 3, 1-54. [doi:10.1016/S0065-2601(08)60341-X ]
ABRICA-JACINTO, N. L., Kurmyshev, E. & Juárez, H. A. (2017). Effects of the interaction between ideological affinity and psychological reaction of agents on the opinion dynamics in a relative agreement model. Journal of Artificial Societies and Social Simulation, 20(3), 3: https://www.jasss.org/20/3/3.html. [doi:10.18564/jasss.3377 ]
AHRWEILER, P., Schilperoord, M., Pyka, A. & Gilbert, N. (2015). Modelling research policy: Ex-ante evaluation of complex policy instruments. Journal of Artificial Societies and Social Simulation, 18(4), 5: https://www.jasss.org/18/4/5.html. [doi:10.18564/jasss.2927 ]
AKERS, R. L., Krohn, M. D., Lanza-Kaduce, L. & Radosevich, M. (1979). Social learning and deviant behavior: A specific test of a general theory. American Sociological Review, 44(4), 636-55.
ALBRECHT, S. L. & Heaton, T. B. (1984). Secularization, higher education, and religiosity. Review of Religious Research, 26, 43-58. [doi:10.2307/3511041 ]
ANAND, S. (1994). Human development index: methodology and measurement. Tech. rep., Human Development Report Office (HDRO), United Nations Development Programme (UNDP).
ATRAN, S. (2004). In Gods we trust: The evolutionary landscape of religion. New York, NY: Oxford University Press.
AXELROD, R. (1997). The dissemination of culture a model with local convergence and global polarization. Journal of Conflict Resolution, 41(2), 203-226.
BAINBRIDGE, W. S. (2006). God from the machine: Artificial intelligence models of religious cognition. Lanham, MD: Rowman Altamira.
BARBER, J. (2014). Believing in a purpose of events: Cross-cultural evidence of confusions in core knowledge. Applied Cognitive Psychology, 28(3), 432-437.
BERGER, R. L. (1981). A necessary and sufficient condition for reaching a consensus using Degroot’s method. Journal of the American Statistical Association, 76(374), 415-418. [doi:10.1080/01621459.1981.10477662 ]
BLANCKE, S., De Smedt, J., De Cruz, H., Boudry, M. & Braeckman, J. (2012). The implications of the cognitive sciences for the relation between religion and science education: The case of evolutionary theory. Science & Education, 21(8), 1167–1184
BRAVO, G., Squazzoni, F. & Boero, R. (2012). Trust and partner selection in social networks: An experimentally grounded model. Social Networks, 34(4), 481-492. [doi:10.1016/j.socnet.2012.03.001 ]
CALDWELL-HARRIS, C. L. (2012). Understanding atheism/non-belief as an expected individual-differences variable. Religion, Brain & Behavior, 2(1), 4-23.
CARLEY, K. (1991). A theory of group stability. American Sociological Review, 56, 331-354. [doi:10.2307/2096108 ]
CHATTOE, E. (2006). Using simulation to develop testable functionalist explanations: a case study of church survival. The British journal of sociology, 57(3), 379-397.
CHATTOE, E. & Hamill, H. (2005). It’s not who you know - it’s what you know about people you don’t know that counts: Extending the analysis of crime groups as social networks. British Journal of Criminology, 45(6), 860-876. [doi:10.1093/bjc/azi051 ]
CHATTOE-BROWN, E. (2014). Using agent based modelling to integrate data on attitude change. Sociological Research Online, 19(1), 16: http://www.socresonline.org.uk/19/1/16.html.
COBB, C. W. & Douglas, P. H. (1928). A theory of production. The American Economic Review, 18(1), 139-165.
CONTI, M., Passarella, A. & Pezzoni, F. (2011). A model for the generation of social network graphs. In World of Wireless, Mobile and Multimedia Networks (WoWMoM), 2011 IEEE International Symposium on a, (pp. 1–6).
CORTEN, R. (2014). Computational Approaches to Studying the Co-evolution of Networks and Behavior in Social Dilemmas. Chichester: John Wiley & Sons. [doi:10.1002/9781118762912 ]
CRESCENTINI, C., Aglioti, S. M., Fabbro, F. & Urgesi, C. (2014). Virtual lesions of the inferior parietal cortex induce fast changes of implicit religiousness/spirituality. Cortex, 54, 1-15.
DÁVID-BARRETT, T. & Carney, J. (2016). The deification of historical figures and the emergence of priesthoods as a solution to a network coordination problem. Religion, Brain & Behavior, 6(4), 307-317. [doi:10.1080/2153599X.2015.1063001 ]
DAVIDSON, R. J., Kabat-Zinn, J., Schumacher, J., Rosenkranz, M., Muller, D., Santorelli, S. F., Urbanowski, F., Harrington, A., Bonus, K. & Sheridan, J. F. (2003). Alterations in brain and immune function produced by mind-fulness meditation. Psychosomatic medicine, 65(4), 564-570.
DAVIS, J. A. & Jowell, R. (1989). ‘Measuring national differences: an introduction to the international social survey programme (ISSP)’. In R. Jowell, S. Witherspoon & L. Brook (Eds.), British Social Attitudes: Special International Report. Aldershot: Gower, pp. 1-13.
DEATON, A. (2008). Income, health, and well-being around the world: Evidence from the Gallup world poll. The Journal of Economic Perspectives, 22(2), 53-72.
DECANCQ, K. & Lugo, M. A. (2013). Weights in multidimensional indices of wellbeing: An overview. Econometric Reviews, 32(1), 7-34. [doi:10.1080/07474938.2012.690641 ]
DEFFUANT, G., Neau, D., Amblard, F. & Weisbuch, G. (2000). Mixing beliefs among interacting agents. Advances in Complex Systems, 3(01n04), 87-98.
DEGROOT, M. H. (1974). Reaching a consensus. Journal of the American Statistical Association, 69(345), 118-121. [doi:10.1080/01621459.1974.10480137 ]
DISTEFANO, C., Zhu, M. & Mindrila, D. (2009). Understanding and using factor scores: Considerations for the applied researcher. Practical Assessment, Research & Evaluation, 14(20), 1-11.
DODDS, P. S., Harris, K. D., Kloumann, I. M., Bliss, C. A. & Danforth, C. M. (2011). Temporal patterns of happiness and information in a global social network: Hedonometrics and Twitter. PloS one, 6(12), e26752. [doi:10.1371/journal.pone.0026752 ]
DUNBAR, R. I. (2009). The social brain hypothesis and its implications for social evolution. Annals of Human Biology, 36(5), 562-572.
DUNBAR, R. I. & Shultz, S. (2007). Evolution in the social brain. Science, 317(5843), 1344-1347. [doi:10.1126/science.1145463 ]
DURKHEIM, E. [1901] (2014). The rules of sociological method: and selected texts on sociology and its method. New York, NY: Free Press.
DUTTON, E. & Van der Linden, D. (2017). Why is intelligence negatively associated with religiousness? Evolutionary Psychological Science, 4(3), 392-40. [doi:10.1007/s40806-017-0101-0 ]
EPSTEIN, J. M. (1999). Agent-based computational models and generative social science. Complexity, 4(5), 41-60.
FEHL, K., van der Post, D. J. & Semmann, D. (2011). Co-evolution of behaviour and social network structure promotes human cooperation. Ecology letters, 14(6), 546-551. [doi:10.1111/j.1461-0248.2011.01615.x ]
FLACHE, A. & Macy, M. W. (2006). What sustains cultural diversity and what undermines it? Axelrod and beyond. arXiv preprint physics/0604201: https://arxiv.org/abs/physics/0604201.
FLACHE, A., Mäs, M., Feliciani, T., Chattoe-Brown, E., Deffuant, G., Huet, S. & Lorenz, J. (2017). Models of social influence: Towards the next frontiers. Journal of Artificial Societies and Social Simulation, 20(4), 2: https://www.jasss.org/20/4/2.html. [doi:10.18564/jasss.3521 ]
GANZACH, Y., Ellis, S. & Gotlibovski, C. (2013). On intelligence education and religious beliefs. Intelligence, 41(2), 121-128.
GEBAUER, J. E., Sedikides, C. & Neberich, W. (2012). Religiosity, social self-esteem, and psychological adjustment on the cross-cultural specificity of the psychological benefits of religiosity. Psychological Science, 23(2), 158-160. [doi:10.1177/0956797611427045 ]
GERVAIS, W. M. & Najle, M. B. (2015). Learned faith: The influences of evolved cultural learning mechanisms on belief in Gods. Psychology of Religion and Spirituality, 7(4), 327-335.
GLAESER, E. L. & Sacerdote, B. I. (2008). Education and religion. Journal of Human Capital, 2(2), 188-215. [doi:10.1086/590413 ]
GORE, R., Diallo, S., Lynch, C. & Padilla, J. (2017). Augmenting bottom-up metamodels with predicates. Journal of Artificial Societies and Social Simulation, 20(1), 4: https://www.jasss.org/20/1/4.html. [doi:10.18564/jasss.3240 ]
GORE, R. J., Diallo, S. & Padilla, J. (2015). You are what you tweet: Connecting the geographic variation in America’s obesity rate to Twitter content. PloS one, 10(9), e0133505. [doi:10.1371/journal.pone.0133505 ]
HABEL, P. & Grant, J. T. (2013). Demand for god and government: The dynamics of religion and public opinion. Politics and Religion, 6(2), 282-302.
HEGSELMANN, R., Krause, U. et al. (2002). Opinion dynamics and bounded confidence models, analysis, and simulation. Journal of Artificial Societies and Social Simulation, 5(3), 2: https://www.jasss.org/5/3/2.html.
HELLIWELL, J., Layard, R. & Sachs, J. (2012). World Happiness Report: http://worldhappiness.report.
HENRICH, J. (2009). The evolution of costly displays, cooperation and religion. Evolution and Human Behavior, 30(4), 244-260. [doi:10.1016/j.evolhumbehav.2009.03.005 ]
HILL, J. P. (2014). Rejecting evolution: The role of religion, education, and social networks. Journal for the Scientific Study of Religion, 53(3), 575-594.
HILL, R. A. & Dunbar, R. I. (2003). Social network size in humans. Human nature, 14(1), 53-72. [doi:10.1007/s12110-003-1016-y ]
HOLBROOK, C., Izuma, K., Deblieck, C., Fessler, D. M. T. & Iacoboni, M. (2015). Neuromodulation of Group Prejudice and Religious Belief. Social Cognitive and Affective Neuroscience, 11(3), 387-394.
HUNGERMAN, D. M. (2014). The effect of education on religion: Evidence from compulsory schooling laws. Journal of Economic Behavior & Organization, 104, 52-63. [doi:10.1016/j.jebo.2013.09.004 ]
IANNACCONE, L. R. & Makowsky, M. D. (2007). Accidental atheists? Agent-based explanations for the persistence of religious regionalism. Journal for the Scientific Study of Religion, 46(1), 1-16.
JAGER, W. & Amblard, F. (2005). Uniformity, bipolarization and pluriformity captured as generic stylized behavior with an agent-based simulation model of attitude change. Computational & Mathematical Organization Theory, 10(4), 295-303. [doi:10.1007/s10588-005-6282-2 ]
KAY, A. C., Shepherd, S., Blatz, C. W., Chua, S. N. & Galinsky, A. D. (2010). For god (or) country: the hydraulic relation between government instability and belief in religious sources of control. Journal of Personality and Social Psychology, 99(5), 725.
KVANDE, M. N., Reidunsdatter, R. J., Løhre, A., Nielsen, M. E. & Espnes, G. A. (2015). Religiousness and social support: A study in secular Norway. Review of Religious Research, 57(1), 87-109. [doi:10.1007/s13644-014-0171-4 ]
LANMAN, J. A. (2012). The Importance of Religious Displays for Belief Acquisition and Secularization. Journal of Contemporary Religion, 27(1), 49-65.
LARSON, E. J. & Witham, L. (1998). Leading scientists still reject god. Nature, 394(6691), 313-313. [doi:10.1038/28478 ]
LATANÉ, B. (1996). Dynamic social impact: The creation of culture by communication. Journal of Communication, 46(4), 13-25.
LEHRER, K. (1975). Social consensus and rational agnoiology. Synthese, 31(1), 141-160. [doi:10.1007/BF00869475 ]
LEMOS, C., Gore, R. & Shults, L. (2017). Exploratory and Confirmatory Factor Analyses of Religiosity. A Four-Factor Conceptual Model. arXiv:1704.06112v1: https://export.arxiv.org/pdf/1704.06112.
LEWIS, J. R. (2015). Education, irreligion, and non-religion: Evidence from select anglophone census data. Journal of Contemporary Religion, 30(2), 265-272. [doi:10.1080/13537903.2015.1025556 ]
LI, J. & Xiao, R. (2017). Agent-based modelling approach for multidimensional opinion polarization in collective behaviour. Journal of Artificial Societies & Social Simulation, 20(2), 4: https://www.jasss.org/20/2/4.html. [doi:10.18564/jasss.3385 ]
LIGGETT, T. (2012). Interacting particle systems. New York, NY: Springer.
LUTZ, A., Brefczynski-Lewis, J., Johnstone, T. & Davidson, R. J. (2008). Regulation of the neural circuitry of emotion by compassion meditation: Effects of meditative expertise. PLoS ONE, 3(3), e1897.
LYNN, R., Harvey, J. & Nyborg, H. (2009). Average intelligence predicts atheism rates across 137 nations. Intelligence, 37(1), 11-15. [doi:10.1016/j.intell.2008.03.004 ]
MACY, M. W., Kitts, J. A., Flache, A. & Benard, S. (2003). 'Polarization in dynamic networks: A Hopfield model of emergent structure.' In R. Breiger, K. Carley & P. Pattison (Eds.), Dynamic Social Network Modeling and Analysis: Workshop Summary and Papers. Washington, DC: The National Academies Press, pp. 162–173.
MARK, N. (1998). Beyond individual differences: Social differentiation from first principles. American Sociological Review, 63, 309–330. [doi:10.2307/2657552 ]
MARK, N. P. (2003). Culture and competition: Homophily and distancing explanations for cultural niches. American sociological review, 68(3), 319-345.
MCCAULEY, R. N. (2011). Why religion is natural and science is not. New York, NY: Oxford University Press.
MCCAULEY, R. N. & Lawson, E. T. (2002). Bringing ritual to mind: Psychological foundations of cultural forms. New York, NY: Cambridge University Press.
MCMAHAN, E. A. & Estes, D. (2011). Hedonic versus eudaimonic conceptions of well-being: Evidence of differential associations with self-reported well-being. Social Indicators Research, 103(1), 93-108. [doi:10.1007/s11205-010-9698-0 ]
MCPHERSON, M., Smith-Lovin, L. & Brashears, M. E. (2006). Social isolation in America: Changes in core discussion networks over two decades. American Sociological Review, 71(3), 353-375.
MCPHERSON, M., Smith-Lovin, L. & Cook, J. M. (2001). Birds of a feather: Homophily in social networks. Annual Review of Sociology, 27(1), 415-444. [doi:10.1146/annurev.soc.27.1.415 ]
MITCHELL, L., Frank, M. R., Harris, K. D., Dodds, P. S. & Danforth, C. M. (2013). The geography of happiness: Connecting Twitter sentiment and expression, demographics, and objective characteristics of place. PLoS ONE, 8(5), e64417.
MYERS, D. G. (1982). Polarizing effects of social interaction. Group Decision Making, 26(4), 187–193.
NORENZAYAN, A. (2015). Big questions about big gods: Response and discussion. Religion, Brain & Behavior, 5(4), 327-342.
NORENZAYAN, A. & Gervais, W. M. (2013). The origins of religious disbelief. Trends in Cognitive Sciences, 17(1), 20-25. [doi:10.1016/j.tics.2012.11.006 ]
NORENZAYAN, A., Gervais, W. M. & Trzesniewski, K. H. (2012). Mentalizing deficits constrain belief in a personal God. PLoS ONE, 7(5), e36880.
NORRIS, P. & Inglehart, R. (2011). Sacred and Secular: Religion and Politics Worldwide. New York, NY: Cambridge University Press. [doi:10.1017/CBO9780511894862 ]
NORRIS, P. & Inglehart, R. (2015). 'Are high levels of existential security conducive to secularization? A response to our critics'. In S. D. Brunn (Ed.), The Changing World Religion Map, Berlin Heidelberg, Springer, pp. 3389-3408.
NOWAK, A., Szamrej, J. & Latané, B. (1990). From private attitude to public opinion: A dynamic theory of social impact. Psychological Review, 97(3), 362. [doi:10.1037/0033-295X.97.3.362 ]
POILE, C. & Safayeni, F. (2016). Using computational modeling for building theory: A double edged sword. Journal of Artificial Societies and Social Simulation, 19(3), 8: https://www.jasss.org/19/3/8.html.
RAMSAY, J. E., Pang, J. S., Shen, M. J. & Rowatt, W. C. (2015). Rethinking Value Violation: Priming Religion Increases Prejudice in Singaporean Christians and Buddhists. The International Journal for the Psychology of Religion, 24(1), 1-15. [doi:10.1080/10508619.2012.761525 ]
ROBERTS, S. G. & Dunbar, R. I. (2011). Communication in social networks: Effects of kinship, network size, and emotional closeness. Personal Relationships, 18(3), 439-452.
SALZARULO, L. (2006). A continuous opinion dynamics model based on the principle of meta-contrast. Journal of Artificial Societies and Social Simulation, 9(1), 13: https://www.jasss.org/9/1/13.html.
SCHUURMANS-STEKHOVEN, J. (2016). Are we, like sheep, going astray: is costly signaling (or any other mechanism) necessary to explain the belief-as-benefit effect? Religion, Brain & Behavior, 7(3), 258-262.
SHULTS, F. L. (2014). Theology after the birth of God: Atheist conceptions in cognition and culture. New York, NY: Palgrave Macmillan. [doi:10.1057/9781137358035 ]
SHULTS, F. L. (2015). How to survive the Anthropocene: Adaptive atheism and the evolution of Homo Deiparensis. Religions, 6(2), 724-741.
SHULTS, F. L., Lane, J. E., Wildman, W. J., Diallo, S., Lynch, C. J. & Gore, R. (2018). Modelling terror management theory: computer simulations of the impact of mortality salience on religiosity. Religion, Brain & Behavior, 8(1), 77-100. [doi:10.1080/2153599X.2016.1238846 ]
STOLZ, J., Könemann, J., Purdie, M. S., Englberger, T. & Krüggeler, M. (2016). (Un) Believing in Modern Society: Religion, Spirituality, and Religious-Secular Competition. London, UK: Routledge.
SZNAJD-WERON, K. & Sznajd, J. (2000). Opinion evolution in closed community. International Journal of Modern Physics C, 11(06), 1157-1165. [doi:10.1142/S0129183100000936 ]
UPAL, M. A. (2005). Simulating the emergence of new religious movements. Journal of Artificial Societies and Social Simulation, 8(1), 6: https://www.jasss.org/8/1/6.html.
UPAL, M. A. & Gibbon, S. (2015). Agent-based system for simulating the dynamics of social identity beliefs. In Proceedings of the 48th Annual Simulation Symposium, (pp. 94-101). Society for Computer Simulation International.
VINOKUR, A. & Burnstein, E. (1978). Depolarization of attitudes in groups. Journal of Personality and Social Psychology, 36(8), 872.
WHITEHOUSE, H., Kahn, K., Hochberg, M. E. & Bryson, J. J. (2012). The role for simulations in theory construction for the social sciences: case studies concerning divergent modes of religiosity. Religion, Brain & Behavior, 2(3), 182-201. [doi:10.1080/2153599X.2012.691033 ]
WILDMAN, W. J. (2009). Science and Religious Anthropology. A Spiritually Evocative Naturalist Interpretation of Human Life. London, UK: Routledge.