
Introduction
Agriculture is an important contributor to nitrogen (N) pollution (Sutton et al. 2011). In many Western European countries, policies such as command and control instruments or economic incentives to reduce N emissions are under discussion (Jayet & Petsakos 2013). The latter have the advantage of higher cost efficiency, but raise more questions about their actual impacts. Therefore, the introduction of economic incentives requires a thorough ex ante analysis of potential incentive-based instruments, for which bio-economic models are appropriate.
In order to estimate the effects of economic incentives on the environment, these models need to be effectively linked to environmental indicators (e.g., N surplus, net GHG emissions, nitrate leaching). An often used indicator is the N balance at farm level, which is represented by a subtraction of N inputs from N outputs of a farm. One of the advantages of N balance is the consideration of various N losses through all pathways such as nitrate and dissolved organic N leaching, ammonia and nitrous oxide emissions, as well as N gas losses by denitrification and thus its ability to reveal N use inefficiencies (Oenema et al. 2003). N farm gate balances can be calculated at farm scale (Mamardashvili et al. 2014) or at sectoral scale (Spiess 2011). Some bio-economic models integrate N balances (Jayet & Petsakos 2013), yield functions (Ramilan et al. 2007) or they link their economic model with a biogeochemical model to evaluate environmental impact (Merel et al. 2013). Some bio-economic models consider only one farm activity (Finger 2012; Feinerman & Komen 2005; Bourgeois et al. 2014), whereas other models include several animal and plant production activities (Vibart et al. 2015; Happe et al. 2011).
Switching to an agricultural policy of multifunctionality, the Swiss government formulated ambitious agri-environmental goals (BAFU & BLW 2008). These goals have been reached to some extent, but in the case of N emissions little progress has been recorded and the N surpluses remains at a level of kg* 108 ha-1 (Spiess 2011). Consequently, the Swiss government is considering strategies to further reduce N emissions from agriculture (Ricklin 2013).
The SWISSland model (German acronym for Swiss structural change information system) (Möhring et al. 2016) is an agent-based agri-economic sector model providing a realistic description of the Swiss agriculture systems. Although, the model accounts for different management activities, its ability to assess the environmental impact of adopted measured is yet limited.
In the present study, we evaluated the effectiveness and efficiency of different N policies such as an N input levy or an input tax in mitigating N surpluses at the farm scale. Therefore, we integrated an N farm gate balance that represents all losses of N in the whole farm system in the model SWISSland. To evaluate the model’s ability to assess the N surplus, we conducted a structured full factorial sensitivity analysis and investigated how sensitive the modelled N surplus was with respect to selected parameter. In the end, we applied the model SWISSland for three levy scenarios on N content of fertilizers and imported concentrates and evaluated their effectiveness.
In Section 2, we describe the SWISSland model and the extension of the N balance estimation. In Section 3, we present the sensitivity analysis results. In Section 4, the results of the N input levy are presented and discussed. Finally, further implications and conclusions are drawn in Section 5.
Model description
Model SWISSland
We extended the agent-based agri-economic sector model SWISSland (Möhring et al. 2016) with an estimation of an N farm gate balance in order to analyse the effects of a levy on N content of concentrates and fertilizer on N farm gate surpluses in the Swiss agricultural sector. The model optimizes for the farm income under the restriction of land endowment and was developed to obtain a realistic description of the Swiss agriculture systems in order to support policy decisions (Möhring et al. 2016). An ODD (Overview Design Concepts and Details) - protocol of the model is provided by Zimmermann et al. (2015).
The data used for the representation of the different agents was based on the Swiss farm accountancy data network (FADN) averages from 2011 to 2013 (hereafter referred to as base year) for about 3,000 farms across the whole Swiss agricultural area. This database provides information on workforce availability, costs as well as the revenues from prices and direct payments for about 20 crop and 15 animal production activities (e.g., milk, wheat). The model therefore accounts for different management options (Möhring et al. 2016). The FADN data set was considered to be insufficiently representative of the whole Swiss agricultural situation, due to over-representation of certain farm types such as dairy farms, and underrepresentation of other farm types such as farms with sheep, goats and horses. To correct for this in the model development, the farm types that were underrepresented were replicated and some of the farms from the overrepresented types were omitted. Additionally, different upscaling factors were applied to every farm type to achieve a representative result for the whole sector (Zimmermann et al. 2015).
Within given restrictions such as land endowment and limitations on animal stocking, the agents behaved rationally and maximized their farm income Z (Equ. 1). A positive mathematical programming (PMP) approach was used to simulate the farm behaviour based on the observed preferences in the past (Möhring et al. 2016).
| $$maxZ =\sum p_{i}x_{i} + d_{i}x_{i} -\frac{1}{2}x_{i}Q_{ii}x_{i} $$ | (1) |
| $$subject\: to:\; A_{w,i}x_{i}\le B_{w}\: and\: x_{i}\ge0 $$ | (2) |
| $$Qii=\frac{1}{\rho_{ii}}*\frac{revenue^{+}}{x_{i}^{+}} $$ | (3) |
The model shows income trends at farm and sectoral scale as well as structural change and its consequences on land use, livestock population and prices. Prices were determined by a partial equilibrium model (market module). The agents were clustered in spatial community structures, which allow agents to quit the agricultural sector and lease their land to neighbouring agents (Möhring et al. 2016).
N balances
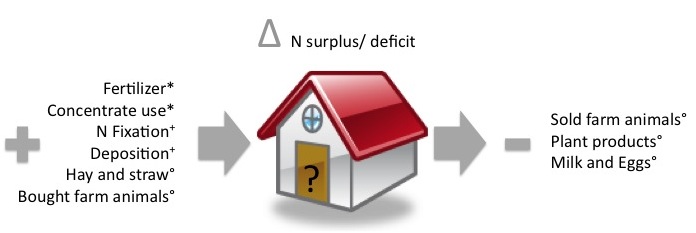
There are several types of N balances: farm gate, soil surface and soil balance. The farm gate balance accounts for all N inputs that enter the farm and all N outputs in plant and animal products that leave the farm. By contrast, the soil surface N balance considers only N inputs to the soil and N removed by plants. Lastly, the soil N balance tracks individual soil processes (Oenema et al. 2003). The advantages of the N farm gate balance is the ease of calculation as it does not account for the processes within the farm and the consideration of the N losses in both animal and plant production (see Figure 1). However, it has the disadvantage of not locating the surplus generated on the farm, and the individual pathways of N losses are therefore not detectable (Oenema et al. 2003). The ”Suisse-Bilanz” (Amaudruz et al. 2003), which is part of the Swiss cross-compliance scheme, is a combination of a farm gate and a soil surface balance, as it accounts for the applied N fertilizer including the farmyard manure that must not exceed the plant N requirements by more than 10%. This scheme already includes a certain level of N losses in the animal house and on the field.
The single farm optimization model, which determines the production decisions of the agents, required an N balance estimation that would assess the consequences of the measures adopted. The model was therefore extended by the calculation of the N farm gate balance and the restrictions embraced in the ”Suisse-Bilanz”. The farm N inputs and outputs were estimated for every agent included in the analysis based on the prices of farm inputs/outputs, their quantities and N content (Flisch et al. 2009). The N fertilizer input of all crop production activities was estimated based on the expenses for N fertilizer derived from the FADN data set. The fertilizer cost per farm distributed between crop production activities was based on the fertilizer recommendations for Switzerland (Agridea 2013). This methodology led to an underestimation of the amount of fertilizer use by 10% in comparison with reported values from Swiss Farmers Union (2013) in the base year. Therefore, the final fertiliser use has been corrected by this figure. Concentrate inputs for animal production activities were estimated and distributed in a similar manner using typical feed mixtures and their N contents (Agridea 2013). For N in-puts by atmospheric deposition, an average value representative of Swiss conditions of 19 kg N ha -1 was used (Jan et al. 2013). For inputs by biological fixation, typical values depending on pasture intensity were chosen (Boller et al. 2003). Overall, the modelled N surplus was underestimated by 8% in comparison with literature data (Spiess 2011).
The model constraints on the farmyard manure and N fertilizers were set up according to the ”Suisse-Bilanz” as follows:
| $$\sum N_{farmyardmanure}+ \sum N_{mineralfertilizer} = \sum N_{plantneed}*1.1 $$ | (4) |
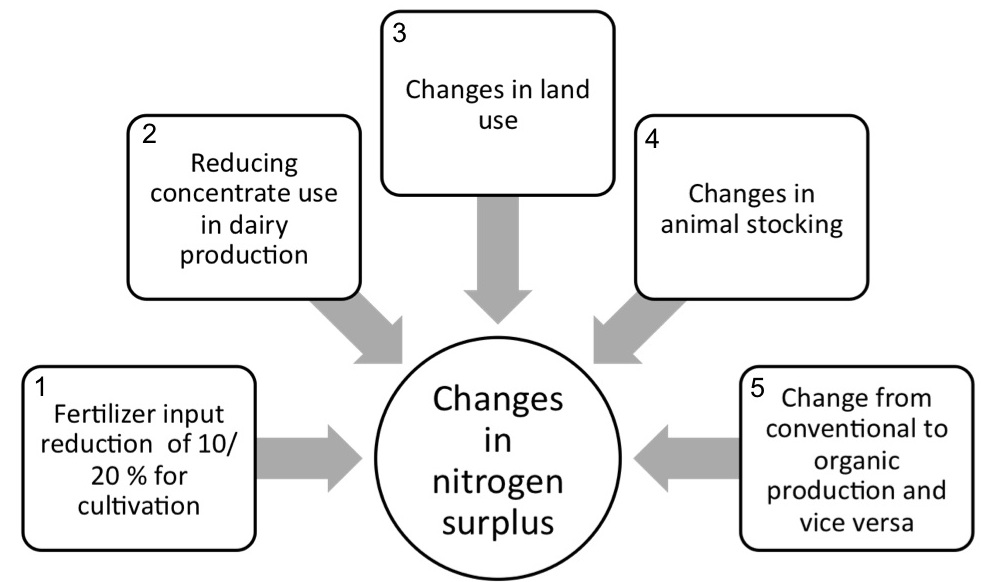
Figure 2 presents various options available to the agents to reduce their modelled N farm gate surplus in the model. Option 1 to 4 are implemented in the model constraints, while option 5 is defined by a Bayesian Network. Option 1 allows agents to reduce the amount of applied fertilizers for the main crop activities by 10 or 20%. We modelled the N fertilizer intensity reduction impact on crop production using input-yield functions for cereals, maize, potatoes, sugar beet and rape seed (Möhring et al. 2016). A 20% reduction in N fertilizer corresponds to extensive production as defined in a current agri-environmental program for Swiss farms and consequently this reduction is concomitantly associated with receiving direct payments for extensive production (extenso). In milk production, option 2 allows to optimize the concentrate inputs. A reduction in concentrate inputs below 10% of the feed ratio leads to receiving direct payments from the Grassland-based Milk and Meat Production (GbMMP) program offered by the Swiss Federation. In addition to this, the agents are able to change their cultivation patterns (option 3) or animal stocking (option 4). In option 5, the agents have the possibility to transform their farming practices from conventional to organic. This decision option is modelled using the Bayesian network embedded in the SWISSland organic module. The probability to change to organic production is determined by the farmer’s income and age, the farm size, animal stocking and the working force requirements. The organic module estimates the farmer income based on higher prices for organic products, different costs for farm activities, takes into account higher direct payments and also lower yields. A change to organic production reduces the agent’s N input from fertilizers and possibly their concentrate use, but it also reduces their N outputs due to lower yields. The farm has to stay at least three years in the organic option, as only after three years, they receive the full price for organic products (Möhring et al. 2016).
Sensitivity of the N surplus per area with respect to selected model parameters
Sensitivity analysis approach
We conducted a sensitivity analysis in order to a) to investigate how the modelled N surplus per area (kg N ha-1) responds to systematic variation in the management options adopted by the agents in order to reduce the N surplus; b) to identify which decision options have a small or large influence on the modelled N surplus; c) to detect interaction effects between selected management options.
There are several approaches to determine how sensitive the model output is with respect to the model factors (i.e., model parameters or inputs). One commonly used way is ”One factor at a time”. This approach is the most intuitive. However, since it varies one model factor at a time, while the other factors are fixed, it does not take into account interactions between the factors (Saltelli & Annoni 2010). For our analysis we decided to implement a global sensitivity method that is not too computationally demanding, but still reveals interaction effects between selected factors. The variance of N surplus was studied with respect to selected model factors at a restricted number of levels within their uncertainty intervals using a full factorial design and analysis of variance (ANOVA) (Wallach et al.2014). Sensitivity analysis help to identify the parameters that influence the uncertainty of the model output (Troost & Berger 2015).
The sensitivity analysis was conducted in several runs and the structured full factorial design was applied to three selected factors at a time. The influence of each factor was studied at two to three restricted levels, depending on the model factor variability. This approach resulted in 2*3*3 model scenarios for each phase of the sensitivity analysis, as we studied one dichotomous parameter in combinations with parameters at low, medium and high levels. The full factorial design analysis allows detection of some interaction effects at lower computational cost than the sensitivity analysis based on Monte Carlo or Latin hypercube sampling of the uncertainty intervals.
Selected factors were assumed to influence the farmer’s decision to reduce their N input (see Table 1). The SWISSland organic module allows agents to convert to organic farming, whereas the intensity reduction and the milk yield function provide opportunities to reduce intensity levels. The PMP elasticities (ρii, see equ 3) influence the changes in the animal stocking and land use. Direct payments and prices affect all decisions, as they influence the revenues and costs of various farm activities. The price levels were chosen based on observed maximum and minimum prices of the products in the last ten years.
| Parameters | Description | Applied values | Units |
|---|---|---|---|
| Organic module (OM) | The organic module allows agent to change to organic farming. The module influences several parameters, such as prices, cost of different farm activities especially fertilizer application, direct payments and yield, but can be switched on or off (See paragraph 2.8) | ON, OFF | - |
| Intensity reduction (IR) | Defines the percentage of N fertilizer reduction necessary to obtain extenso payments | 0.7, 0.8, 0.9 | - |
| Land elasticity (LE) | Represents the elasticity of the PMP factor for land use | 0.5, 1, 1.5 | - |
| Animal elasticity (AE) | Represents the elasticity of the PMP factor for animal production | 0.5, 1, 1.5 | - |
| Milk yield function (MYF) | Determines how much concentrates are used to produce a certain level of milk | low, status quo, high | - |
| Wheat price (WP) | Price of wheat the when partial equilibrium model is switched off (price range of the last 10 years) | 48, 52, 61 | CHF per 100 kg |
| Milk price (MP) | Price of milk when the partial equilibrium model is switched off | 0.55, 0.61, 0.78 | CHF per L |
| Price for N input | Price of N input by fertilizers and concentrates | 1.22, 1.57, 2.24 | CHF per kg |
| Direct payment for ensuring food security (EFP) | An area based payment | 0, 900, 1800 | CHF per ha |
The most sensitive factor and also the interactive effects between the factors were determined using an analysis of variance (ANOVA) in R so ware package (R Core Team 2015). For this reason we calculated the mean of N surplus per ha of the region weighted by each agent’s area. The most sensitive parameter identified in the previous run of the sensitivity analysis was included in the following run along with two new additional factors.
For the sensitivity analysis, we ran the model with only one spatial community in order to further reduce the computational cost of the simulations from the base year (average from 2011-2013) to 2024. The spatial community characterized by 73 agents in the base year represented the ratio between organic and integrated production farms and the proportion of valley, hill and mountain farms as well as the proportion of dairy farms in the whole model SWISSland. As a consequence of applying only one spatial community, the market module could not be used and prices were given exogenously for the sensitivity runs.
Result and discussion
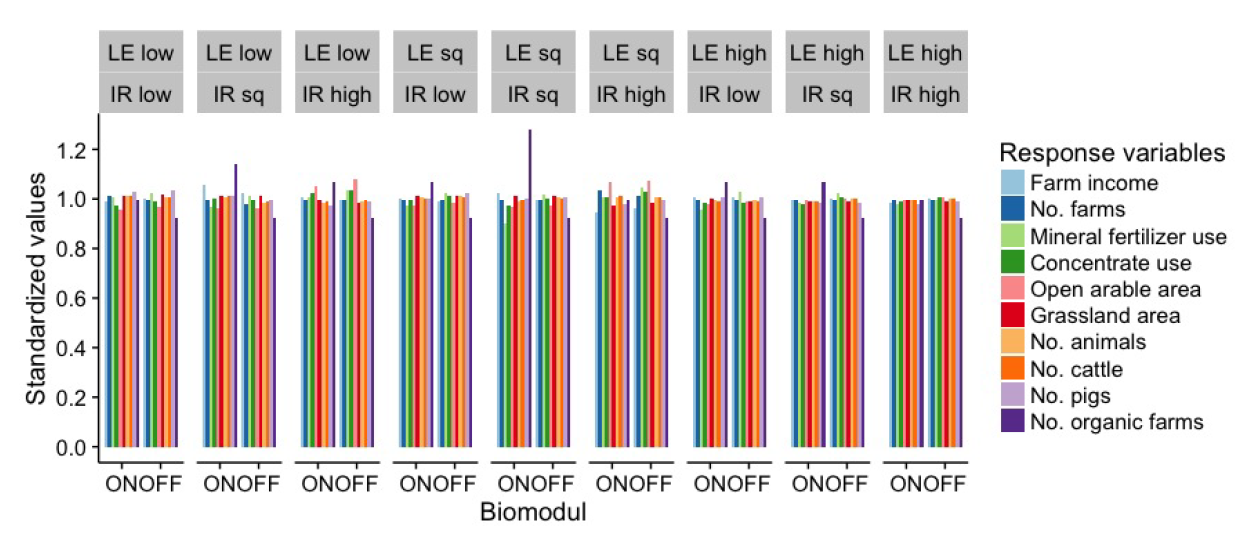
In the first sensitivity run, modelled N surplus showed similar patterns in response to the systematic variation in PMP elasticities of land use, the input reduction level of N fertilizer, and the option of converting to organic farming (see Figure 3a). The average modelled N surplus for the spatial community decreased from 69.5 kg N ha-1 in the base year to 62.1 to 65.2 kg N ha-1 in the last year of the study (2024).
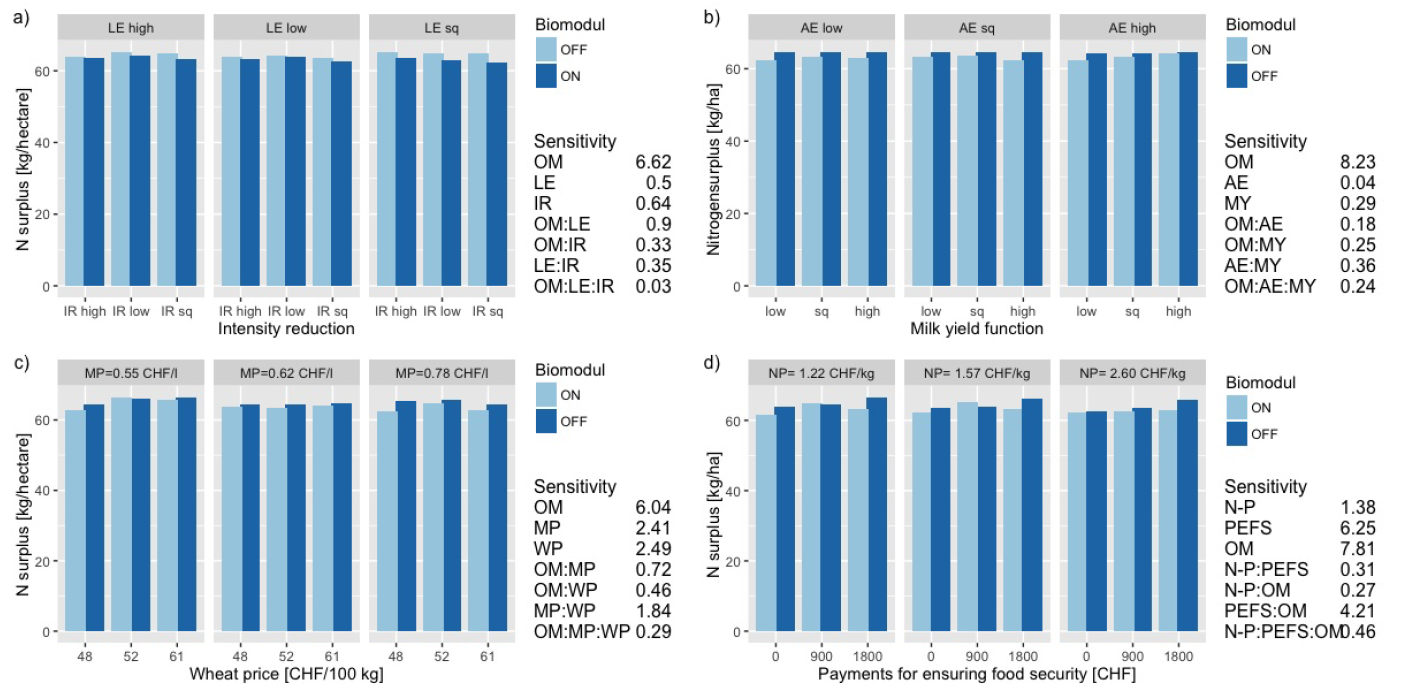
The most sensitive parameter for the modelled N surplus, i.e., the parameter that explains the highest variability in the modelled N surplus, was the organic module. The organic module increased the number of organic farms by about 5% on average (Figure 5 Appendix). The higher number of organic farms and their lower N surplus per area lead to a lower modelled N surplus per ha on average. The input reduction level of N fertilizer only affected a small number of agents (i.e., arable farms), particularly farms with a high proportion of arable area. As the PMP elasticity of land use showed only negligible effects on the distribution of grassland and open arable land, it affected the modelled N surplus very little.
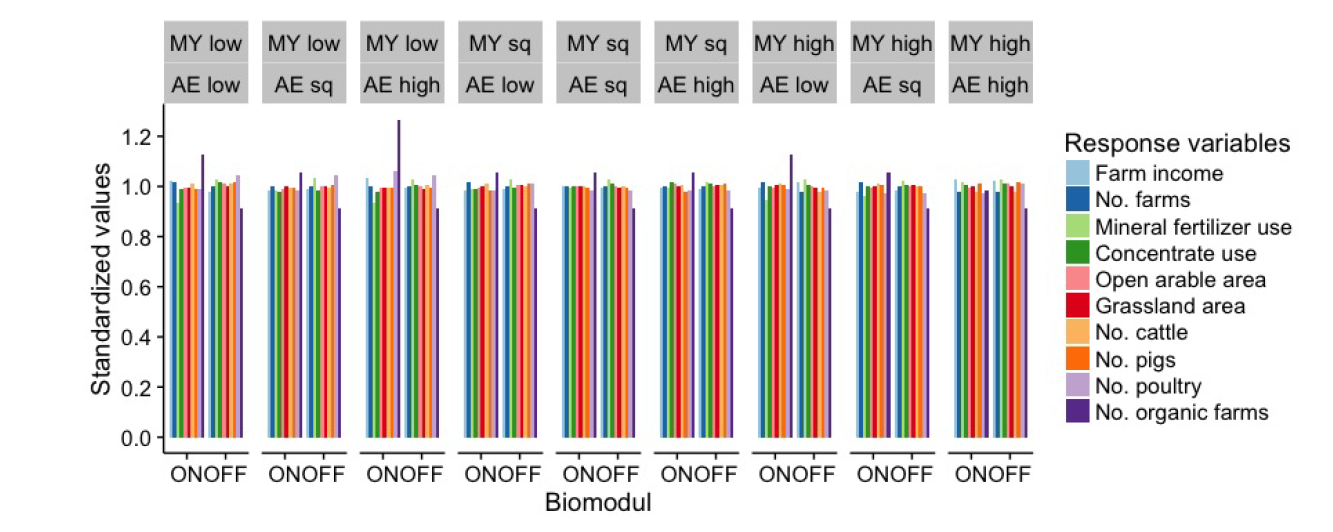
In the second sensitivity run, the values of modelled N surplus for 2024 ranged from 62.2 to 64.7 kg N ha-1 on average, while varying the PMP elasticity of animal stocking, milk yield function and the option of changing to organic farming (Figure 5b). Similarly to the first sensitivity run, the organic module was the most influential parameter for the modelled N surplus. The number of animals was restricted by factors other than the PMP-factor for animal stocking, such as housing capacities and limits on animal stocking. Therefore, the influence of the PMP- factor for animal stocking on modelled N surplus was negligible. Similarly, the variation of the milk yield function level of concentrate input affected only the N efficiency of milk production, with very minor effects on the modelled N surplus.
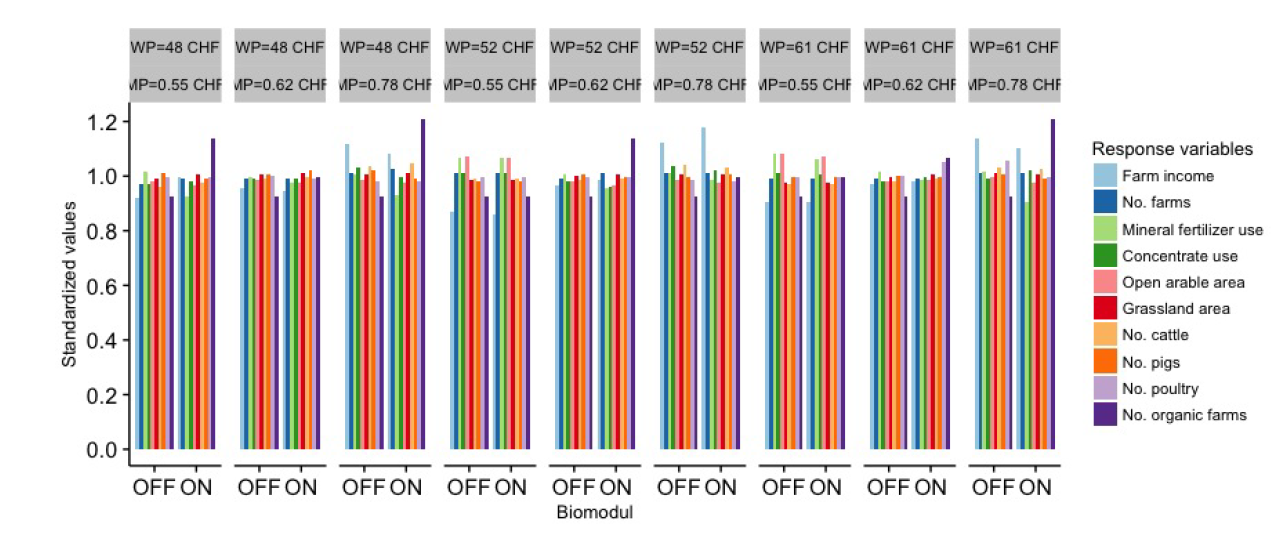
The third sensitivity run led to an average N surplus ranging from 62.3 to 66.4 kg N ha-1. In this run, prices of milk and wheat were varied in combination with the organic module (Figure 3c). Again, the organic module parameters variation had the highest influence on the N surplus as a single parameter. Despite this, some of the variance of N surplus was explained by the interaction of milk price and wheat price as the variation in the product prices influenced the distribution of open arable land and grassland.
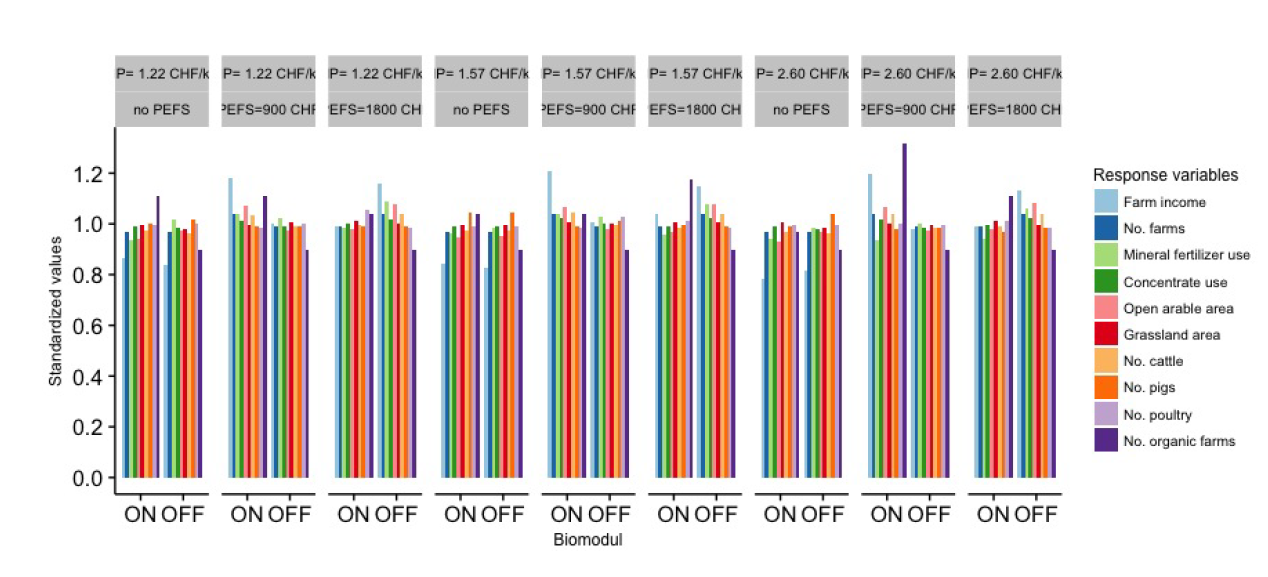
In the fourth sensitivity run, the organic module again had the highest influence on the average modelled N surplus in comparison with the direct payment for ensuring food security and the price of a kilogram of N (Figure 3d). The observed model response with respect to the selected parameters was highest in the fourth sensitivity run; however, the modelled N surplus ranged only from 61.6 to 66.6 kg N ha-1 on average. A reduction in payments for ensuring food security caused a higher cultivation of ecological compensatory areas as a result of receiving lower payments. The price for N had only a small effect on N surplus.
Unexpectedly, the sensitivity analysis showed only small responses of the modelled N surplus to systematic variation in the selected model parameters. The levels of the selected parameters were assumed to cover the maximum and minimum feasible values. Therefore, the possible reasons for the low sensitivity of modelled N surplus to selected parameters are: a) the N surplus is a result of many complex calculations and might be influenced by many parameters and biophysical and management restrictions embedded in the model. Based on our prior knowledge of the model, we assumed that all selected model parameters have an influence and thus have an effect on N surplus. However, there are also other influencing parameters in the model that have a rather indirect effect on N surplus. E.g., in addition to the organic module that was highly sensitive and its effect was expected, we found that the parameter ensuring food security payments influenced N surplus more than expected; b) the modelled agents within the spatial community react differently in response to variation in the individual parameter values, but at the regional scale the modelled N surpluses do not change that much. This was supported by the observation that the influence of individual farms’ decisions on the average modelled N surplus is much higher when only a subsample of farms is considered compared to the analysis when all farms are included (i.e., 3,000 farms, data not shown).
The option of switching to organic farming and payments for ensuring food security were identified as key parameters with the largest influence on the modelled N surplus. The lower N surplus was observed for scenarios with the organic module ON in all four runs. In the first run, the scenario with the intensity reduction at the intermediate position reduced the N surplus the most. The second run was mainly influenced by the organic module. In the third run, a high milk price and a low wheat price led to a low N surplus on average. High payments for ensuring food security increased the N surplus. This is surprising, as the payments for food security were expected to buffer the model response.
Model response to a levy on N in fertilizers and imported concentrates
Levy scenarios
To model an N input levy, we extended the cost function of the model. Based on the estimated N content of fertilizer and concentrates, we added the levy to the fertilizer and feeding costs and ran the model for 12 years from 2013 to 2024. The agents’ levy costs were extrapolated to the sectoral scale and divided by the total utilized land area. The tax revenues were equally paid back to the agents based on the agent’s land area in the following modelling year in order to lower the impact of the levy on the farm income. This has been recommended by Rougoor et al. (2001) to prevent the reduction of competitiveness of the agricultural sector. In this way, farmers with low N inputs per area, profited from the levy, while farmers with high N inputs per area had to bear higher costs.
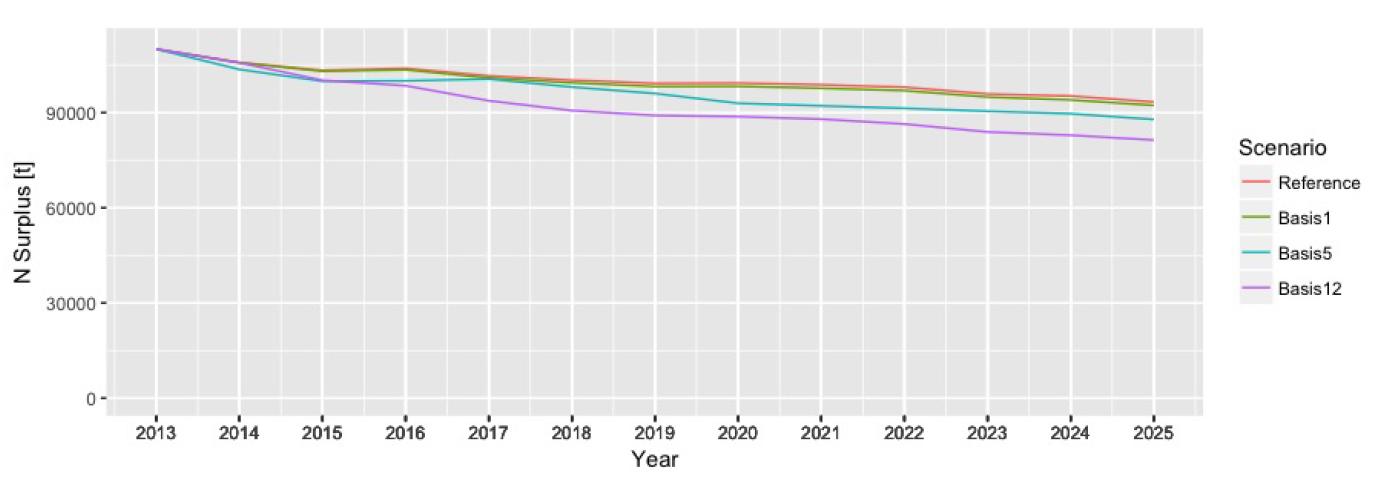
We evaluated the impact of four levy scenarios on N surplus reduction: 1) the reference scenario representative of the current agricultural policy (AP 14-17); 2) Basis1 scenario with the levy equal to 1 CHF per kg N , which is about 70 % of the N price); 3) Basis5 scenario with the levy equal to 5 CHF per kg N (360% of the N price) and lastly 4) Basis12 scenario with levy equal to 12 CHF per kg N (800% of the N price). In each scenario, the levy was reimbursed to the sector based on the agent’s land area and the levy rose continually up to the final level of the levy from 2015 to 2019.
The average surpluses were calculated with the assumption that the inputs of mineral N fertilizer derived from the FADN data set were underestimated by 10% in the base year in comparison with the data from the Swiss farmer’s association (Swiss Farmers Union 2013). The surplus was corrected by a factor 1.08 to match the values reported for the Swiss agricultural sector (Spiess 2011). Due to a lack of data on inputs of concentrates, no further corrections were conducted.
Result and discussion
Increasing N price by 70% (Scenario basis 1) led to a reduction of modelled sectoral N surplus on average by 1.35%; with an eight times higher N price (Scenario basis 12) the reduction was 9.8 % (Figure 4, Table 2). The reduction was mainly achieved by a reduction in N fertilizer use, while the use of concentrates was barely affected by a higher N price. There are three reasons for this. Firstly, feed concentrates for roughage-consuming animals have a low N content (i.e., 2.7 - 3.5 %). Consequently, increasing N price by 70% led to a lower price increase for concentrates (a 2% price increase per kg) than for N fertilizer (a 70% price increase per kg). Secondly, the reduction of concentrate input in milk production is mainly driven by payments for grassland-based milk and meat production in the reference and the N input levy scenarios. Therefore, a further N input levy did not reduce concentrate input in milk production significantly. Thirdly, the gross margin for the main animal production activities is much higher than the gross margin for crop production activities. The income loss when reducing animal stocking is therefore much higher in comparison with decreasing N input in crop production. Animal stocking even increased under the levy scenario of 1 or 5 CHF, as a result of the income loss compensation.
| Unit | Reference | Basis 1 [%] | Basis 5 [%] | Basis 12 [%] | |
|---|---|---|---|---|---|
| N surplus | kg N/ha | 93 | -1.4 | -4.4 | -9.8 |
| Farm income | CHF | 67565 | 1.1 | 4.9 | 11.2 |
| No Of farms | 40386 | 0.2 | -0.3 | -0.2 | |
| Fertilizer use | t | f 461974 | -2.3 | -9.1 | -19.9 |
| Concentrate use | t | 825317 | -0.3 | -2.5 | -5.3 |
| Open arable area | 1000 ha | 259 | -0.7 | -3.3 | -7.6 |
| -Cereals | 1000 ha | 84 | -2.6 | -11.3 | -26.6 |
| -Corn | 1000 ha | 16 | 2.5 | 12.6 | 29.4 |
| Area of permanent grassland | 1000 ha | 611 | 0.5 | 2.4 | 5.9 |
| Ecological compensatory area | 1000 ha | 136 | 0.9 | 1.7 | 6.6 |
| Animal numbers | 1000 LU | 1234 | 0.7 | 0.1 | -0.6 |
| -Dairy cows | 556 | 0.2 | -0.1 | 0.1 | |
| -Fattening pigs | 128 | 6.6 | 7.6 | -1.8 | |
| -Poultry | 22 | -2.2 | -22.7 | -24.1 |
The response to the N input levy differed between farm types (Table 3). For arable farms, the average N surplus was reduced by 50% with a levy of 12 CHF. For pig and poultry farms, the N surplus with an N input levy was higher than in the reference scenario. The increase in farm activities with higher gross margins and normally higher N surplus was also reported by (Jayet & Petsakos 2013). In Table 4, presents the estimated relative contribution margin of different farm activities. It shows that for some farms, a levy have to be quite high in order to induce a switch to another activity. Thus, a uniform N input levy can lead to unintended responses in some agents.
| Farm type | Reference [kg N/ha] | Basis 1 [%] | Basis 5 [%] | Basis 12 [%] |
|---|---|---|---|---|
| Arable farms | 57 | -6.1 | -24.7 | -45.1 |
| Dairy farms | 72 | -1.7 | -3.5 | 7.1 |
| Pigs and poultry farms | 124 | 8.2 | 16.1 | 10.9 |
| Mixed arable and dairy farms | 76 | -2.4 | -10.2 | -22.4 |
| Mixed pig and poultry farms | 107 | -1.0 | -5.3 | -10.4 |
| Production activity | lower 25 % of comparative contribution margin [CHF /kg N] | mean of comparative contribution margin [CHF /kg N] | higher 25 % of comparative contribution margin [CHF /kg N] |
|---|---|---|---|
| Dairy cows | 81.08 | 105.78 | 126.64 |
| Suckler cows | 169.06 | 245.17 | 250.52 |
| Fattening pigs | 13.44 | 15.74 | 32.29 |
| Breeding sows | 21.90 | 25.25 | 44.82 |
| Wheat | 10.72 | 20.51 | 25.17 |
| Fodder grains | 6.25 | 19.16 | 30.03 |
| Corn | 7.78 | 26.68 | 36.89 |
| Potato | 21.27 | 53.47 | 71.94 |
| Sugar beet | 0.24 | 0.43 | 0.19 |
| Rape seed | 7.82 | 17.12 | 26.86 |
| Sunflower seed | 18.43 | 30.55 | 39.95 |
Average farm income rose under all levy scenarios due to a higher number of exits of farm activities, especially for farms that already had low incomes. If they produced intensively, they were not profiting from the reimbursement of the levy, but faced higher costs. Under all levy scenarios, these farms had a higher risk of stopping their farming activities. The levy led to a decrease in open arable area and simultaneously in an increase in grassland and crops used for animal feeding. Under Basis scenario, the increasing grassland area was lower than the increase in animal numbers. Under all other levy scenarios, the decrease in animal numbers was lower than grassland extensions.
The price elasticity for fertilizer use estimated by the model was - 0.03. Price elasticity has been reported as crucial for the efficiency of a tax (Finger 2012). In the present study, the estimated price elasticity was very low in comparison with previously published results. For example, (Rougoor et al. 2001) in an econometric study reported price elasticities ranging from - 0.2 to - 0.5. Similarly, in other modelling studies authors reported price elasticity ranging from - 0.2 to -0.5 (Finger 2012; Merel et al. 2013; Jayet & Petsakos 2013; Berntsen et al. 2003). The difference to other models could be a result of PMP modeling. Buysse et al. (2007) recommended a normative mathematical programming that is more prone to abrupt changes, rather than PMP for the simulation of new policies. However, this could not explain the difference between our results and other studies such as Merel et al. (2013), who also used a PMP model and achieved an elasticity of -0.2. One possible explanation can be that our model is mainly represented by dairy farms (60%) with low fertilizer inputs that did not show a strong response to the levy on N inputs, whereas the model of Merel et al. (2013) is a regional model representing an intensive cropping system in California. Arable farms tend to respond more effectively to a levy, as shown in our results (see Table 3).
Swiss farmers are less responsive to a N input levy, due to a higher level of regulation and direct payments in Swiss agriculture and as a result an increase in costs is of less importance. This is also evident from the results of the reference scenario (see Figure 4). The modelled N surplus declined by 10% during the period from 2013 to 2024 without application of the levy on N in fertilizers and imported concentrates. This is likely a result of a new direct payment scheme introduced in Switzerland in 2014 that was already included in the reference scenario. The scheme abolished payments for animal production while increasing the payments for ecological performance (Mann & Lanz 2013). Also, the sensitivity analysis showed a higher influence of the direct payments than the price of N.
Other factors that affect the price elasticity of an environmental tax are psychological factors such as growing awareness of costs and environmental impacts of N fertilizer application as a consequence of a fertilizer tax implementation or mental accounting (Rougoor et al. 2001). Mental accounting could lead to adverse effects, leading to more environmental impact since the agent has already applied some good environmental behaviour induced by the levy (Gruener & Hirschauer 2016).
As model limitations, it has to be mentioned that the agents were not able to increase their N use efficiency by N reduced feeding strategies or increasing N efficiency of slurry application due to a lack of data on the implementation of such strategies in the base year. The low reduction of modelled N surplus for the pig and poultry farm types may be caused by limited options to reduce the N inputs such as the use of NPr feed in the model. In reality, N reduced feed for pigs (i.e., NPr feed) has been already used in areas with high pork production. It has been reported that NPr feed can potentially reduce total N surplus of Swiss agriculture by 1.6% (Bracher & Spring 2011; Swiss Farmers Union 2013). Improving farmyard manure management requires investment in farmyard manure spreading equipment and farmyard manure storage facilities. This investment pays o at a levy of 12 CHF for a reduction of 10% of ammonia emission (Peter et al. 2010). However, it could not be assumed that the investment in technologies that reduce ammonia emissions necessarily leads to a reduction in N surplus. It might happen that pollution swapping occurs and nitrous oxide emissions replace ammonia emissions (Loyon et al. 2016). The shipment of farmyard manure was difficult to model due to a lack of data and a low economic value of farmyard manure.
Conclusion
The sensitivity analysis identified the possibility to switch to organic farming as a key parameter with the largest influence on the N surplus in the SWISSland model. The systematic variation in a limited fraction of parameters in the model did not lead to large responses in N surplus of the simulated agents. This could also be a consequence of the PMP cost function that favours retention of the status quo. Due to an extremely low demand elasticity of -0.03, the SWISSland model revealed only a small response to a levy on N in fertilizers and imported concentrates. The changes in the direct payment scheme led to a response in N surplus reduction comparable with a tax of 12 CHF. The low response to the levy might be caused by a) the high specialisation of Swiss agriculture in dairy farming and animal production, where the losses in contribution margin in comparison with the N inputs are high and therefore agents display limited reaction to higher N prices. Some farm types even increased their N surplus as they intensify farm activities with a higher gross margin to compensate for their income loss; b) the high regulation and high direct payments which buffer Swiss agriculture. The introduction of an N input levy seems not to be effective in achieving the Swiss agri-environmental goals. There is therefore a need to consider indirect incentives, changes in consumer behaviour by taxing food based on its environmental impact, or subsidies for low N input technologies.
Appendix A: Sensitivity analysis
Figures 5-8 show the sensitivity of response output variables such as farm income, numbers of farms, mineral fertilizer and concentrates use, the area of open arable land and grassland, the number of animals, particularly the number of cattle, pigs and poultry, and the number of organic farms, standardized by their means in the individual sensitivity phases. As the number of organic farms was low, changes in this parameter led to a higher variability in the responses of this output variables. In addition to these results, the sensitivity results provided insights into some model inconsistencies and allowed us to identify some errors in the model.
Figure 5 presents that the changes in the open arable area were the highest, and mostly resulted from the variation in the land elasticity. Figure 6 shows that the animal elasticity mostly influenced the number of poultry. Figures 7 and 8 present that the farm income was highly influenced by the milk and wheat prices and the direct payments, respectively.
References
AGRIDEA (2013). Deckungsbeitragskatalog . Landwirtscha liche Beratungszentrale Lindau, Eschikon
AMAUDRUZ, M., Morier, R., Zimmermann, A., Hauser, S., Schüpbach, H., Übersax, A., Kessler, V. & Nyfenegger, L. (2003). Wegleitung Suisse-Bilanz. Landwirtscha liche Beratungszentrale Lindau LBL, Eschikon (Switzerland).
BAFU & BLW (2008). Umweltziele Landwirtscha - Hergeleitet aus bestehenden rechtlichen Grundlagen. Umwelt-Wissen Nr.0820. Bundesamt für Umwelt (BAFU)
BERNTSEN, J., Petersen, B. M., Jacobsen, B. H., Olesen, J. E. & Hutchings, N. J. (2003). Evaluating Nitrogen Taxation Scenarios Using the Dynamic Whole Farm Simulation Model Fasset. Agricultural Systems, 76(3), 817–839. [doi:10.1016/S0308-521X(02)00111-7]
BOLLER, B., Lüscher, A. & Zanetti, S. (2003). Schätzung der biologischen Sticksto -Fixierung in Klee-Gras-Beständen. In B. Boller, D. Dubois & P. M. Fried (Eds.), Schri enreihe FAL, vol. 45. Zürich: Eidgenössische Forschungsanstalt für Agrarökologie und Landbau
BOURGEOIS, C., Ben Fradj, N. & Jayet, P. A. (2014). How Cost-Effective is a Mixed Policy Targeting the Management of Three Agricultural N-pollutants? Environmental Modeling Assessment, 19(5), 389–405. [doi:10.1007/s10666-014-9401-y]
BRACHER, A. & Spring, P. (2011). Rohproteingehalte in Schweinefutter: Bestandesaufnahme. Agrarforschung Schweiz, 2(6), 244–251.
BUYSSE, J., Van Huylenbroeck, G. & Lauwers, L. (2007). Normative, Positive and Econometric Mathematical Programming as Tools for Incorporation of Multifunctionality in Agricultural Policy Modelling. Agriculture, Ecosystems Environment, 120(1), 70–81. [doi:10.1016/j.agee.2006.03.035]
FEINERMAN, E. & Komen, M. H. C. (2005). The Use of Organic vs. Chemical Fertilizer with a Mineral Losses Tax: The Case of Dutch Arable Farmers. Environmental Resource Economics, 32(3), 367–388. [doi:10.1007/s10640-005-6647-5]
FINGER, R. (2012). Nitrogen Use and the Effects of Nitrogen Taxation Under Consideration of Production and Price Risks. Agricultural Systems, 107, 13–20. [doi:10.1016/j.agsy.2011.12.001]
FLISCH, R., Sinaj, S., Charles, R. & Richner, W. (2009). GRUDAF 2009. Principles for Fertilisation in Arable and Fodder Production. Agrarforschung, 16(2), 1–100.
GRUENER, S. & Hirschauer, N. (2016). An Experimental Investigation of Mental Cccounting in Environmental Economics. International Journal of Agricultural Resources Governance and Ecology, 12(1), 18–26. [doi:10.1504/IJARGE.2016.074674]
HAPPE, K., Hutchings, N. J., Dalgaard, T. & Kellerman, K. (2011). Modelling the Interactions Between Regional Farming Structure, Nitrogen Losses and Environmental Regulation. Agricultural Systems, 104(3), 281–291. [doi:10.1016/j.agsy.2010.09.008]
HOOP, D. & Schmid, D. (2014). Grundlagenbericht 2013: Zentrale Auswertung von Buchhaltungsdaten. Etten-hausen: Agroscope INH, 1 edn.
JAN, P., Calabrese, C. & Lips, M. (2013). Bestimmungsfaktoren des Sticksto -Überschusses auf Betriebsebene. Teil 1: Analyse auf gesamtbetrieblicher Ebene. Tech. rep., Forschungsanstalt Agroscope Reckenholz- Tänikon ART.
JAYET, P.A. & Petsakos, A. (2013). Evaluating the Efficiency of A Uniform N-Input Tax Under Different Policy Scenarios at Different Scales. Environmental Modeling Assessment, 18(1), 57–72. [doi:10.1007/s10666-012-9331-5]
LOYON, L., Burton, C. H., Misselbrook, T., Webb, J., Philippe, F. X., Aguilar, M., Doreau, M., Hassouna, M., Veld-kamp, T., Dourmad, J. Y., Bonmati, A., Grimm, E. & Sommer, S. G. (2016). Best Available Technology for European Livestock Farms: Availability, Effectiveness and Uptake. Journal of Environmental Management, 166, 1–11. [doi:10.1016/j.jenvman.2015.09.046]
MAMARDASHVILI, P., Jan, P. et al. (2014). Environmentally Harmful By-Products in Efficiency Analysis: An Example of Nitrogen Surplus on Swiss Dairy Farms. In 2014 International Congress, August 26-29, 2014, Ljubljana, Slovenia. European Association of Agricultural Economists
MANN, S. & Lanz, S. (2013). Happy Tinbergen: Switzerland’s New Direct Payment System Heureux Tinbergen: Le Nouveau Systéme de Paiements Directs de la Suisse Tinbergen Wäre Zufrieden: Das neue Direktzahlungsprogramm in der Schweiz. EuroChoices, 12(3), 24–28. [doi:10.1111/1746-692X.12036]
MEREL, P., Yi, F. J., Lee, J. & Six, J. (2013). A regional Bio-Economic Model of Nitrogen Use in Cropping. American Journal of Agricultural Economics, 96(1), 67–91. [doi:10.1093/ajae/aat053]
MÖHRING, A., Mack, G., Zimmermann, A., Ferjani, A., Schmidt, A. & Mann, S. (2016). Agent-Based Modeling on a National Scale- Experience from SWISSland. Ettenhausen: Agroscope: https://www.agroscope.admin.ch/agroscope/en/home/topics/economics-technology/socioeconomics/swissland/dokumentation.html.
OENEMA, O., Kros, H. & de Vries, W. (2003). Approaches and Uncertainties in Nutrient Budgets: Implications for Nutrient Management and Environmental Policies. European Journal of Agronomy, 20(1-2), 3–16.
PETER, S., Lehmann, B. & Valsangiacomo, A. (2010). "Stickstoff 2020"- Möglichkeiten und Einschränkungen zur Vermeidung landwirtscha licher Sticksto emissionen in der Schweiz. Bundesamt für Landwirtscha (BLW)
R CORE TEAM (2015). R: A Language and Environment for Statistical Computing. R Foundation for Statistical Computing, Vienna, Austria: http://www.R-project.org/.
RAMILAN, T., Scrimgeour, F. G., Levy, G. & Romera, A. J. (2007). Modelling Economic Impact of Agri-Environmental Policy on Dairy Farms - A Catchment Perspective. Modsim 2007: International Congress on Modelling and Simulation: Land, Water and Environmental Management: Integrated Systems for Sustainability
RICKLIN, K. (2013). Sticksto überschuss in der Landwirtschaft. Massnahmen jenseits der Agrarpolitik 2014-2017. Tech. rep., Nationalrat.
ROUGOOR, C., Van Zeijts, H., Hofreither, M. F. & Bäckmann, S. (2001). Experience with Fertilizer Taxes in Europe. Journal of Environmental Planning and Management, 44(6), 10. [doi:10.1080/09640560120087615]
SALTELLI, A. & Annoni, P. (2010). How to Avoid a Perfunctory Sensitivity Analysis. Environmental Modelling Software, 25, 1508–1517. [doi:10.1016/j.envsoft.2010.04.012]
SPIESS, E. (2011). Nitrogen, Phosphorus and Potassium Balances and Cycles of Swiss Agriculture from 1975 to 2008. Nutrient Cycling in Agroecosystems, 91(3), 351–365. [doi:10.1007/s10705-011-9466-9]
SUTTON, M., Howard, C., Erisman, J., Billen, G., Bleeker, A., Peringe, G., van Grinsven, H. & Grizzetti, B. (2011). The European Nitrogen Assessment - Sources, Effects and Policy Perspectives. Cambridge: Cambridge University Press, 1 edn. [doi:10.1017/CBO9780511976988]
SWISS Farmers Union, S. (2013). Statistische Erhebungen und Schätzungen über Landwirtscha und Ernährung. Brugg: SBV
TROOST, C. & Berger, T. (2015). Dealing with Uncertainty in Agent-Based Simulation: Farm-Level Modeling of Adaptation to Climate Change in Southwest Germany. American Journal of Agricultural Economics, 7(3), 833–854
VIBART, R., Vogeler, I., Dennis, S., Kaye-Blake, W., Monaghan, R., Burggraaf, V., Beautrais, J. & Mackay, A. (2015). A Regional Assessment of the Cost and Effectiveness of Mitigation Measures for Reducing Nutrient Losses to Water and Greenhouse Gas Emissions to Air from Pastoral Farms. Journal of Environmental Management, 156, 276–289. [doi:10.1016/j.jenvman.2015.03.041]
WALLACH, D., Makowski, D., Wigington, J. & Brun, F. (2014). Uncertainty and Sensitivity Analysis, chap. Chapter 5: Oxford, UK: Elsevier Science, 2nd edn.
ZIMMERMANN, A., Möhring, A., Mack, G., Ferjani, A. & Mann, S. (2015). Pathways to Truth: Comparing Different Upscaling Options for an Agent-Based Sector Model. Journal of Artificial Societies and Social Simulation, 18(4), 11: https://www.jasss.org/18/4/11.html. [doi:10.18564/jasss.2862]