
Introduction
This paper presents an agent-based simulation model (ABM) for assessing the effect of public Research & Development (R&D) policy on companies’ R&D activity. It is a pure computational model exploring the interaction between a public agency, entitled to manage a direct (or grant-based) R&D policy, and a given set of companies eligible for receiving a monetary support to increase their actual level of R&D activity.
By running this model under different parametrization, we depict various policy scenarios under alternative policies aimed at fostering the R&D activity of companies undergoing a given public R&D support. The model assumes that agents (the public agency and the companies) maximize an objective function under reasonable constraints, and that companies doing R&D operate within a network where possible externality effects can arise.
To our knowledge, no previous models of this type have been proposed in the literature so far. Therefore, it constitutes a first attempt to explore – by means of an agent-based simulation – R&D policy effects within specific network topologies.
According to a large body of theoretical literature, corporate R&D activities need to be subsidized. The main reason for this hinges on the many "imperfections" of the R&D market, which may lead to a poor R&D performance on the part of private companies. The main sources of this distortive phenomenon has been found in the "public good" nature of knowledge (i.e., low appropriability of R&D outcomes), as well as in the imperfections in the markets for financing of R&D, due to strong asymmetric information between borrowers and lenders for such a special good.
While there is common agreement on the fact that R&D should be publicly subsidized, no sufficient attention has been devoted so far to the mechanisms underlying the subsidization process, and to the effect of public intervention on the whole R&D outcome (either at national or regional level).
The total R&D effect of a public R&D subsidization policy depends on various elements. However, three seem particularly relevant to single out: (i) the interrelation between the behaviour of the funding public agency and behaviour of profit-seeking supported (and not supported) companies; (ii) the R&D externalities generated by the interaction among companies, which are embedded in an interconnected system, which can be described through a network structure; (iii) the market structure within which companies operate, as the degree of market power - either in the technology (i.e., patents) or in the product market – can influence companies strategies and incentives of doing R&D, thus ultimately affecting system R&D performance (for more detail, see the so-called patent-race literature; e.g., see Dasgupta and Stiglitz 1980, Dasgupta 1988, D'Aspremont and Jacquemin 1988).
The present paper abstracts from point (iii), while emphasizing the consequences of point (i) and (ii) on the dynamic of the total level of system R&D induced by public subsidization. It means that we consider only a market for R&D (i.e., partial-equilibrium), with companies operating in perfect competition and assuming as given both the patent and product market.
We set a welfare maximizing public agency choosing optimally the allocation of a given amount of subsidies, and a set of companies choosing their optimal level of R&D by maximizing a profit function over R&D.
At the heart of our model, there are the R&D spillover effects generated by the network structure within which companies are embedded and operate. This brings to distinguish between an "idiosyncratic company R&D" and a "total company R&D", where the latter is given by the sum of the former plus the spillover effect (i.e., the additional R&D coming from companies’ R&D links with other companies).
Our model is well suited for an in-depth understanding of how different companies’ network topologies can have a differential effect on total system R&D, measured as the sum of total companies’ R&D.
In this specific use of the model, we are interested in assessing the effect of an increasing network “hubness” on total system R&D performance. To this end, two versions of the model are simulated and compared: one showing the pattern of system R&D as function of an increasing hubness in the absence of spillovers; one showing the pattern of system R&D as function of an increasing hubness in the presence of spillovers. Solved computationally, the model explores such patterns by a Monte Carlo integration over all model’s parameters. This was to “neutralize” the effect of specific parameter choices.
Why should this experiment be interesting, and what policy implications might it have? Fundamentally, comparing the R&D behaviour of an R&D system with subsidization under an increasing network hubness (starting from a random network as reference point), sheds light on the relative advantages/disadvantages to subsidize a decentralized system compared to a more centralized one. This is a long-standing research question, which still continues to rise challenging disputes among scientists and policy-makers. This paper contributes to such debate, and offers its own perspective and understanding on the phenomenon.
The paper is organized as follows: we first briefly review the literature on the rationale for R&D subsidization and present some related works using, as in our case, a simulation approach; in a subsequent section we present the structure of our model in terms of agency and firms behavioural assumptions, as well as a description of how we model the R&D spillover effect in this context; a separate section is devoted to an explanation of the logical functioning of our model when embedded in a path-diagram perspective; then a specific section provides the main simulation results we obtain from running several times the model, while a final section closes the paper. Finally, the Appendices placed at the end provide a pseudo-code for the Matlab program used for performing our simulations (Appendix A), and a pseudo-code for generating networks with increasing hubness (Appendix B).
Related Literature
We organize the literature review in two subsections, one dealing with previous attempts to model business R&D subsidization within ABMs; the other focusing on network topology and its relation with knowledge diffusion performance. Both aspects are at the heart of the structure and functioning of our proposed model.
Modelling R&D subsidization
The economic rationale for subsidizing corporate R&D is based on the idea that R&D activity owns some intrinsic characteristics that substantially differentiate it from other usual business activities. Jou and Lee (2001), for example, suggest that R&D is different from other private activities for three major reasons: (i) future rewards to R&D are extremely risky and uncertain, (ii) R&D spending takes the form of an irreversible choice (i.e., it generates hard sunk costs), (iii) R&D activities produce positive externalities. Within the literature, R&D subsidization was invoked for this third reason, as accounted by the Arrow (1962) pioneering paper. The argument goes like this: since R&D activities have classical “public good” characteristics, the level of private R&D outlay would be systematically lower than the socially optimal level. This occurs since the benefits associated to R&D activities are easily and freely available to subjects that are not engaged in R&D efforts. As a consequence, the lack of full appropriability of R&D returns reduces the incentive to invest in knowledge on the part of private for-profit firms and thus government intervention is meant as an effective way to reduce the extent of this market failure.
Only recently characteristics (i) and (ii) have been more seriously taken into account for justifying public intervention. In her extensive survey on the subject, Hall (2002) recognizes that, unlike externalities, other market failures associated to R&D activities can be relevant. For instance, when capital markets are imperfect, high-risk investments can severely suffer from credit rationing as the immaterial nature of R&D assets is unable to provide suitable collaterals to financers. In this case the asymmetric information between lenders and borrowers of R&D assets could be extremely high, thus generating higher rationing of funds.
This problem is even more straighten in the presence of financially constrained firms and undersized venture capital markets. The presence of high barriers to enter and exit the market is another potential source of private R&D shortage: on the one hand, when a great amount of irreversible R&D investment have been done by an incumbent firm, exiting the market could be seriously costly; on the other hand, entering the market could be difficult too as the R&D performed by incumbent firms (as well as their related patenting activity) may generate market power, thus weakening free access and competition from external companies (Dasgupta and Stiglitz 1980; Dasgupta 1988; D'Aspremont and Jacquemin 1988). Other motives suggesting the need for R&D support are based on the potential lack of technological infrastructures and bridging institutions, on coordination failure of profitable R&D joint ventures and on an excessive competitive arena leading to duplications in R&D efforts and other wastes of R&D-related resources (Mowery 1995; Metcalfe 1995; Malerba 1993; Martin and Scott 2000).
As for previous literature on the subject, papers using a simulation approach for studying the effect of public subsidies on corporate R&D are few, and generally they do not model directly the public agency objective and behaviour. At micro-level papers of this kind are those by Jou and Lee (2001) and Laincz (2009). The latter embeds the R&D subsidization within a dynamic programming general equilibrium setting à la Ericson and Pakes (1995). The author builds a model with forward-looking dynamically optimizing firms where entry and exit decisions determine the dynamic of market structure. R&D subsidies are external interventions raising long-run growth rate and industry concentration as incumbent firms benefit more from them. Nevertheless, the funding-agency behaviour is not explicitly modelled and the R&D subsidy is just viewed as an external injection.
At macro-level, Bental and Peled (2002) provide a calibrated dynamic model of growth in the spirit of endogenous growth models. They estimate the separate effect of restricted and unrestricted R&D subsidies on output and total factor productivity (TFP) growth, showing that both types of subsidies have significant long-run impact on aggregate performance. Yet, as in the case of Laincz (2009), no funding-agency decision process is represented in the model.
The only two papers found in the literature explicitly modelling the firm-agency subsidization relationship is that by Materia and Esposti (2010) and the one by Cerulli (2012). The paper by Materia and Esposti (2010) is primarily interested in analysing the optimal agency co-financing rate. Two important elements characterize this work: (i) it is essentially static as agency and firms maximize instantaneous objective functions, and (ii) it is fully deterministic. Our model, on the contrary, assumes agency's optimizing behaviour by also following a specific representation of the corporate R&D determination, the one proposed by Howe and McFetridge (1976). Furthermore our model is stochastic, and pays specific attention to welfare consequences of R&D externalities generated by companies’ network topology.
Using a simulated funding-agency/supported-firm stochastic dynamic game, the paper by Cerulli (2012) shows that the level of the subsidy provided by a funding (public) agency, normally used to correct for firm R&D shortage, might be severely underprovided. This is due to the “externalities” generated by the agency-firm strategic relationship, as showed by comparing two versions of the model: one assuming “rival” behaviors between companies and agency (i.e., the current setting), and one associated to the “cooperative” strategy (i.e. the optimal Pareto-efficient benchmark). The paper looks also at what “welfare” implications are associated to different degrees of persistency in the funding effect on corporate R&D. Three main conclusions are thus drawn: (i) the relative quota of the subsidy to R&D is undersized in the rival compared to the cooperative model; (ii) the rivalry strategy generates distortions that favor the agency compared to firms; (iii) when passing from less persistent to more persistent R&D additionality/crowding-out effect, the lower the distortion the greater the variance is and vice versa. As for the management of R&D funding policies, the paper concludes that all the elements favouring greater collaboration between agency and firm objectives may help current R&D support to approach its social optimum.
Although previous works tried to model policy settings where the funding agency and supported firms are heterogeneous interplaying agents, they do not provide specific attention to the role played by R&D and innovation networks whose formation, development and topology can play a relevant role in driving policy effects. An exception is represented by the SKIN model proposed by Gilbert, Pyka and Ahrweiler (2001) to simulate knowledge dynamics in innovation networks. SKIN is a multi-agent model (where agents are firms, policy actors, research labs, etc.) describing how innovations arise from would-be “artefacts” proposed on the part of competing companies. Such artefacts can be improved on their own, or through the search of partners bringing additional knowledge. Each agent is characterized by a “kene” (Gilbert, Pyka and Ahrweiler 2014) which is the central concept of the SKIN model, defined as a triplet of values representing: firm capability (C) in a scientific, technological, or business domain; firm ability (A) to apply a certain capability to a particular field; and firm expertise (E) acquired with respect to that ability. Would-be innovation is derived from a subset of the firm’s kene triplets, and cooperative interaction with partners allows firms to adjust their kene by changing expertise levels, and by adding or dropping abilities or capabilities, thus reproducing various kinds of organisational learning processes. The authors show that – by adopting specific parametrizations – their model is able to replicate qualitatively features of some typical real innovation networks.
Recently, Ahrweiler et al. (2015) have proposed a development of the SKIN model (called INFSO-SKIN), which provides ex-ante evaluation of possible R&D funding programmes. Using data on the European Commission’s Framework 7 (FP7) programme, their model is calibrated to reproduce the funding strategies adopted by the Commission agencies, the behaviour of funded organisations and projects, and the consequential formation of network structures. Using as benchmark a baseline scenario, authors test a series of “what if” propositions, in order to compare alternative scenarios emerging when various policy changes are considered. The emerging properties of the networks and other results are then commented and evaluated in the light of the benchmark scenario.
The approach followed by SKIN and its policy-oriented developments is probably the closest to our approach. However, our modelling considers a more structural design than SKIN does, with agents’ objective functions having a well-defined mathematical form. Furthermore, the research question of our experiment is different, in that we are interested in assessing the response of the total system R&D when the same policy is implemented within different R&D network structures. Therefore, the network is – in our setting – exogenous and not endogenous (i.e., a product of agents’ behaviours) as in the SKIN’s case. This might appear a limitation of our approach, but it is suitable if we are interested in a different kind of scenario evaluation, one in which the ultimate effect is evaluated based on both company idiosyncratic R&D behaviour, and R&D spillovers due to an existing network topology. Thus, we are mainly interested in answering questions like: “What network topology maximizes the total R&D response of the system under analysis when of a given policy (with a given amount of allocated money) is implemented?”.
Network topology and knowledge diffusion performance
Small-world properties, namely short distances and high clustering (Watts and Strogatz 1998), are recognized to be crucial to enhance diffusion processes in networks. In the field of interorganizational and interfirm networks it is underlined as the small-world model represents an optimal infrastructure for the creation and the diffusion of knowledge and innovation (Cowan 2005; Cowan and Jonard 2004; Schilling and Phelps 2007; Choi et al. 2010). Generally speaking, knowledge is created collectively in local communities or clusters of organizations and easily spreads throughout the network thanks to the reduced distances.
Beside the importance of small-world properties for the performance of knowledge diffusion, the role played by scale-free architectures have been underlined as well. Hanaki et al. (2009) studied R&D collaborations in the IT industry between 1985 and 1995, finding that the network became more and more unbalanced during the years due to a preferential attachment mechanism which led to the emergence of hub nodes. Carayol and Roux (2005) developed a model of collective innovation ruled by a preferential attachment mechanism and demonstrated that it leads to stable networks with small-world properties.
On the other side, different evidence is presented by Fleming et al. (2007) who focused on patent coauthorship to investigate the innovative performance of regional collaboration networks. Their findings point out that small-world structure does not improve innovative productivity among regions.
However, the investigation of knowledge diffusion performance in networks characterized by scale-free properties or by a more generic “hubness” should be deepened for different reasons. At a theoretical level, it is plain that diffusion processes can be widely facilitated by the presence of few hubs which can quickly connect the other nodes of the network. Here, the emphasis is on the easy navigability and searchability of scale-free networks (Lewis 2007; Newman 2010): starting at a random node – which will likely be a node with few connections in a power-law degree distribution – it will be easy to find the shortest path to any other node by knowing where the hubs are. Translated into knowledge diffusion processes, it means that hubs are able to grant a quick access to the knowledge exchanged in the network also to peripheral nodes.
Shifting to the field of inter-firms networks, some studies point out that a scale-free network can provide an optimal infrastructure for the growth and diffusion of innovative knowledge. Gay and Dousset (2005) show that the R&D inter-organizational network in the antibody field of biotechnology industry is power-law shaped and evolves according to a fitter-get-richer mechanism, an adaptation of the rich-get-richer mechanism proposed by Barabasi and Albert (1999). According to the latter, while older nodes have a greater chance to obtain links from newcomers, the former states that firms with the best fit to a relevant attribute have also a greater chance of creating new links; in the case of Gay and Dousset’s study, firms with cutting-edge technology are the “fitter” ones. Coherently with the literature on innovation and R&D networks discussed above, the antibody R&D network also shows small-world properties, that is, short distances and high clusterization.
Lin and Li (2010) apply a simple model of knowledge innovation and diffusion process to different types of network models: regular, random, small-world and scale-free, and study the performance of knowledge transfer in three directions: (i) the growth and diffusion of knowledge, (ii) the adequacy of knowledge transfer, and (iii) the spatial distribution of knowledge. The results they found show that the scale-free network provides an optimal infrastructure for knowledge growth and diffusion compared to the other topologies investigated. Further, the knowledge variance – that is, the level of overall difference in knowledge stock – is larger in the case of the regular network and more balanced when the diffusion process is applied to the scale-free and the random topologies.
Finally, even the spatial dimension of knowledge diffusion is less discriminatory in the case of a scale-free network. Indeed, contrarily to the other models, a scale-free network allows for a higher dissemination of knowledge in space, – i.e. regular, random, and, to a lesser extent, small-world models – where it is more likely to observe knowledge segregation in clusters. The performance of scale-free networks in granting a large and even distribution of knowledge is attributed to the presence of the long-range connections held by the hub-nodes which, according to simulation results, provide the best infrastructure for the growth of innovative knowledge and for a non-discriminatory distribution among the nodes. Small-world topologies are characterized by some long-range links too, but to a lesser extent compared to the scale-free ones, leading to a more limited performance. Worst performances can be observed in random and regular networks, which are characterized by short-range connections and much more even degree distributions.
Lastly, it has been recognized as many real-world R&D networks, particularly in the case of publicly subsidized R&D, are characterized by power-law or other kinds of right-skewed distributions (Roediger-Schluga and Barber 2008; Protogerou et al. 2010, 2012; Barber et al. 2006, 2009; Breschi and Cusmano 2004; Almendral et al. 2007). Such studies are coherent with the contributions by Newman (2005) and Clauset et al. (2009), according to which purely scale-free shaped networks are hard to be found in the real world, despite networks with more or less unbalanced degree distributions – such as the power-law with exponential cut-off – are common in natural and social sciences.
The arguments discussed above lead to the need of a deeper investigation of knowledge diffusion performance in the presence of an external subsidization of R&D activity with firms embedded in networks with a more or less pronounced hubness. This is where the presence of highly connected nodes is a matter of degree instead of an on/off state. Therefore, emerging regularities from a simulation model linking agents’ behaviors, network topology (i.e., degree of hubness), and R&D performance seem interesting to analyze. This is the main objective of the model proposed in this paper, that we describe in the next sections.
Modelling approach and methodology
In this section, we present our agent-based simulation model. The agents constituting the model are: a public agency, which provides public funds to support private R&D companies, and a set of eligible-for-fund private companies. Companies are then assumed to be located within a network which can generate possible R&D externality effects.
Both types of agents take decisions by maximizing an objective function under reasonable constraints. The model runs under a series of assumptions which are illustrated below.
Companies’ behaviour: the optimal R&D expenditure
Companies choose the level of R&D expenditure (R) which maximizes their profits. Thus, the optimal R is the one equalizing the (expected) marginal rate of return and the (expected) marginal capital cost of doing R&D. The optimal level of R&D is in turn a function of the R&D support (S) that a firm may potentially receive from the public agency.
We assume that each company owns an optimal level of the subsidy, thus making the R&D optimal equation as a convex function of the public support (a parabola, for instance). This is the most relevant assumption of our model, as it identifies the agency’s optimization problem as embedded in a convex system, thus assuring existence and uniqueness of the solution. There is nonetheless sound empirical evidence suggesting that such assumption is reliable. Econometric studies on R&D support using “continuous treatment”, for instance, show that the effect of public R&D support on companies’ own R&D tends to decrease with higher level of support (Marino and Parrotta 2010; Cerulli and Potì 2016). This means that, beyond a certain threshold, receiving additional amount of subsidies seems to be detrimental instead of beneficial for company R&D activities. Two theories explain this evidence. One is based on the so-called “investment adjustment costs” due to the search of new skilled human resources, adaptation time, and organizational frictions which accompany new R&D investments, by temporarily reduce R&D productivity. The second is embedded in the principal-agent (or asymmetric information) theory, suggesting that larger amount of subsidies increase firms’ costs of opportunistic behaviours as soaring project’s state costs versification due to larger monitoring (performed by the funding agency) can take place. For both reasons, a company could be reluctant to demand additional monetary support, as new costs could arise, thus reducing its incentive to perform additional R&D projects. This justifies a convex relation between firm own R&D and amount of public support.
Finally, we also assume that R&D spillovers among firms may take place, due to companies’ relationships within their R&D network, where the R&D flows from one company to another according to the strength of the relationship between firms. Therefore, each company R&D includes both an idiosyncratic component (Ridio) and an additional component due to the presence of R&D externalities. The sum of the two components provides the total R&D outlay of a company (Rtotal).
Firms run in a competitive market where they sell a single research output at a parametric/normalized price prd =1. Each single company owns a profit function convex in Ridio, where the production function is linear and costs are increasing (Howe and McFetridge 1976; David, Hall and Toole 2000; David and Hall 2000). The total company R&D revenues are:
| $$\phi R_{idio}^2$$ |
| $$h(S)R_{idio}+c$$ |
| $$\Pi(S,R_{idio})=\phi R^2_{idio}-[h(S)R_{idio}+c]$$ |
In order to maximize this function over Ridio, we calculate the first order condition obtaining:
| $$\frac{\delta\Pi(S,R_{idio})}{\delta R_{idio}}=2\phi R_{idio}-h(S)=0$$ |
We hold that:
| $$h(S)=aS-bS^2-(Z-K)$$ |
| $$R_{idio}(S)=\frac{1}{2\phi}\Bigl\{aS-bS^2-(Z-K)\Bigr\}=p_{rd}S-kS^2-(F-D)$$ |
| $$R_{idio}(S_i)=S_i-k_iS_i^2-F_i+D_i$$ |
Figure 1 illustrates the shape of company optimal R&D as a function of the subsidy S received from the public agency. Although such a shape entails that companies own an optimal R&D subsidy, they however cannot choose this level, as it is decided by the public agency. As discussed above, it is worth to stress that such a shape suggests that subsidies produce not only benefits for the firm, but also costs that, beyond a certain threshold, can overcome benefits thus yielding a convex form of the R-S relationship.
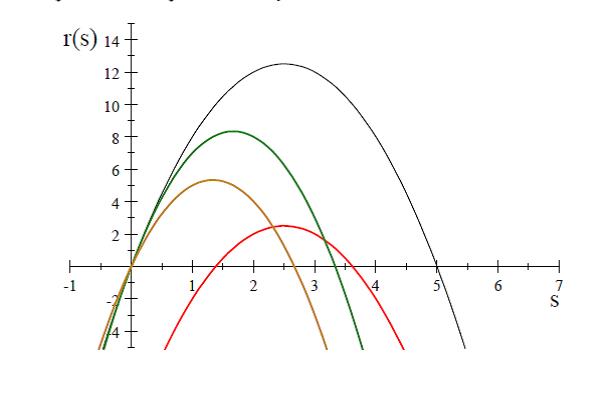
Finally, since the network degree-centrality of the company strictly depends on network topology, it is convenient to indicate D as a function of the network M in which the company operates; we can thus re-write the last formula as:
| $$R_{idio}(S_i)=S_i-k_i S_i^2-F_i+D_i(\mathbf{M})$$ |
Agency behaviour: optimal subsidy provision
Given a constant total amount of subsidy equal to \(\overline{S}\), the direct objective of the public agency is that of finding the optimal allocation of such amount by maximizing the total level of R&D (i.e., the sum of all companies’ idiosyncratic R&D spending) (Cerulli 2012; Laincz 2009; Jou and Lee 2001).
To this end, we first assume that the agency knows the company ability to perform R&D and its centrality within the network, but it has no knowledge of firms’ R&D network relationships. As objective, the agency wants to determine two things: (i) which companies are worth to support and which are not (i.e., selection-process); (ii) which share of \(\overline{S}\) has the agency to provide to each firm selected for support. Thus, the agency comes up with two optimal solutions: (i) the N1 (out of N) selected companies; (ii) the optimal allocation of the subsidy \(\overline{S}\) within the N1 selected companies.
The agency optimization problem is the following:
| $$\begin{cases} max_({S_1,S_2,\dots,S_N})W(S_1,S_2,\dots,S_N)=\sum_{i=1}^N R_{idio}(S_i)=\sum_{i=1}^N[S_i-k_iS_i^2-F_i+D_i(M)]\\ s.t.\\ \sum_{i=1}^N S_i\leq \bar{S}\\ R_{idio}(S_i)\geq R_{idio}(0)\,\,\,\forall i=1,\dots,N\text{;}\,\,\,S_i\geq 0 \end{cases}$$ |
Such a problem assumes that[1]:
- the total sum of subsidies is fixed and equal to \(\overline{S}\) (budget constraint);
- the expected firm R&D conditional on the subsidy is higher when a company is supported than when it is not supported (incentive compatibility constraint);
- subsidies are positive numbers.
Observe that, in doing its choice, the public agency does not take into account network externalities, but only the arguments of the idiosyncratic R&D.
Once the Agency has chosen the N1 units to support along with their level of support, all the N companies perform their actual R&D expenditure, given the support received, that is, Rtotal,i. The global (system) policy effect is finally given by:
| $$\hat{R}_{total}=\sum_{i=1}^N R_{total,i}$$ |
Total R&D outlay by introducing network externality
In order to calculate the total R&D expenditure, once the level of the idiosyncratic R&D is known, it is first necessary to introduce the network within which companies operate.
We assume the network to be represented by a weighting matrix M =[mij], where mij represents the generic element of this matrix. M can possibly contain either positive or negative values, thus accounting for positive or negative externalities respectively. However, at this step of analysis, we only consider positive externalities (i.e., mij ≥ 0).
We define the total R&D outcome of company i as:
| $$\hat{R}_{total,i}=R_{idio,i}+\sum_{j=1}^N m_{ij} R_{idio,j}\,\,\,\text{with}\,\,m_{ij}=0\,\,\,\text{if}\,i=j$$ |
Simulating the effect of the policy under different network parameters
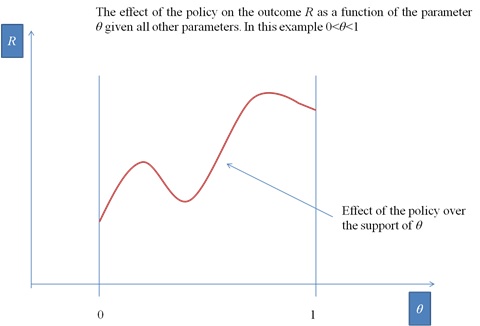
The model is characterized by the parametric space θ which defines the entire set of parameters’ values under which the model can be simulated. This set also contains the network parameters as distinct parameters governing simulation results.
If we indicate by θ one single parameter characterizing a specific network topology, we can write:
| $$\mathbf{M}=\mathbf{M}(\theta)$$ |
| $$\hat{R}_{total}=\hat{R}_{total}(\theta|\mathbf{\Theta}_{-\theta})$$ |
Companies are located within an R&D network, and different network topologies can produce different policy effects. The network impacts on Rtotal in two ways: (i) the more a company is central in the network, the more a lower barrier to do R&D is assumed (thus reducing the fixed costs of doing R&D); (ii) different network topologies could provide different R&D performance. Therefore, running simulations under different policy scenarios provides guidance to detect the emerging properties of the R&D pattern under specific model’s parameterizations.
Our model uses Monte Carlo integration to provide reliable conclusions about simulation results. In particular, we are interested in answering question of this type: “Are specific configurations of the network more likely to produce larger R&D effect than other types of settings?” In order to answer questions like this, we have run our model in a number of different simulation settings. In this specific paper we are interested in identifying whether, ceteris paribus, a quasi-random network is or is not more conducive to higher levels of R&D than networks characterized by the emergence of specific nodes playing as hubs. It may thus be interesting to assess whether the policy effect on Rtotal will show an increasing or decreasing pattern as a function of network’s “hubness”.
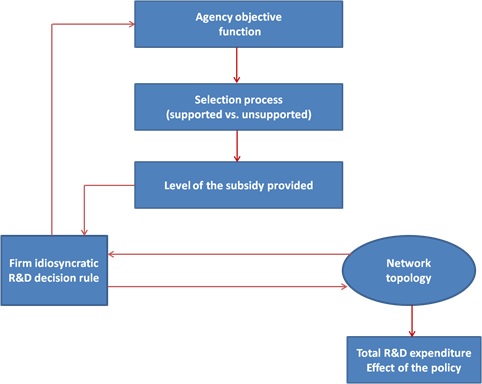
Figure 3 illustrates the path-diagram of our model simulation. The timing of the process occurs along the following steps:
- The point of departure is the generation of a weighted network of firms (i.e., the matrix M) which determines company degree-centrality in the network and thus the value of Di (M).
- Given the value taken by other firms idiosyncratic parameters, the agency can operate by selecting the companies to support, and then by optimally allocating the subsidy \(\overline{S}\) among them.
- Companies then provide their idiosyncratic R&D outlay, which depends on the subsidy received (Si), and other idiosyncratic parameters.
- Subsequently, companies perform their total R&D expenditure by transmitting and by receiving R&D spillovers according to the structure of the matrix M, which defines the network topology.
- Finally, we calculate the sum of total R&D expenditure over the entire population of companies, which is the main outcome of interest.
Figure 4 sets out the model programming flow, which explains the computational steps through which the model is simulated. This figure shows that we have three simulation layers, based on: (i) type of experiment, (ii) given level of the network parameter(s), and (iii) run of the single simulation. To understand how this works, consider the random network case: the type of experiment is “random network”, the parameter to fix is p (the “edge probability”), and a single run generates one single network based on the fixed p, as well as a draw from the distributions of all the idiosyncratic parameters needed to solve numerically the model. As for the distributions from which firm idiosyncratic parameters are drawn, Table 1 displays meaning and type of distribution (or just the value) of each parameter.
In order to generate a “hubbish” graph (i.e., a network with a skewed degree distribution with few highly connected nodes – i.e. the hubs – and several nodes with few ties), we developed a specific original algorithm (whose pseudo-code is reported in Appendix B).
The most common algorithm for creating networks shaped around hubs is provided in the Barabási and Albert (1999) model of preferential attachment, which allows for the generation of networks with a degree distribution decaying through a power law. This is shaped by the parameters m0 (the initial number of nodes) and m (the nodes which add to the graph at each step), and creates ties by preferentially choosing the most connected nodes.
By manipulating these parameters, it is however not possible to control for network hubness and network density independently, as density is defined by the ratio between 2 m0 and the number of nodes, thus implying that the degree of the most connected node scales as a logarithm of the former (Gilbert and Troitzsch 2005).
In this paper, we are interested in the spillover effects due to a variation in network hubness, assuming a constant density of the network (while the scale-free properties can be neglected); as a consequence, a specific algorithm for creating increasingly centralized networks has to be proposed. Such algorithm consists of the following three steps (see Appendix B):
- a G(N, p) Erdös–Rényi (1959) random network with N nodes and density p is first created;
- some ties are then randomly de-wired;
- de-wired ties are finally stochastically re-wired to higher degree nodes, so a graph topology centralized around few hubs does emerge.
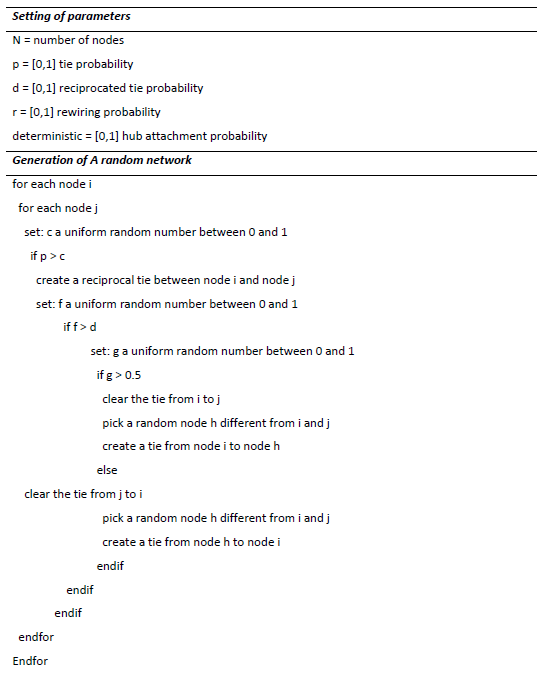
The random graph is created by establishing a reciprocated tie among each pair of nodes i and j with a probability defined by the parameter p; the higher its value the denser will be the graph; it is straightforward that, for p= 0, the graph will be empty, while for p= 1 a full graph is obtained.
Each of the reciprocated tie thus created can be split into a tie going from j to i (or from i to j) which is maintained, while the tie going from i to j (or from j to i) is cleared and a new tie between i (or j) and a randomly chosen node h is created. The split probability is modeled by a parameter d, where for d = 0 no reciprocated ties will remain in the graph, and for d = 1 all ties will be kept as reciprocated.

Once the random graph has been set, a detachment process randomly deletes the ties which will be preferentially attached to the most connected nodes. Network’s centralization around the hubs is modeled by the parameter r and the parameter deterministic (see the Matlab code in Appendix A). The number of ties to be detached and subsequently rewired is modeled by the parameter r, which defines the portion of N that will be involved in the process; parameter deterministic rules the probability of re-wiring to the most connected node, defined as the node with the highest total degree centrality[2]. The larger the value of this parameter, the higher is the probability to re-wire a tie with the most connected node.
| Parameters | Meaning | Distribution |
|---|---|---|
| prd | Unit price of R&D | Fixed to the value 1 |
| ki | Degree of the R&D concavity as function of S | Uniform[0; 1] |
| Fi | R&D fixed costs | Uniform[0; 1] |
| Di (M) | Firm degree-centrality in the network | Firm degree-centrality in the network |
| mij | Generic weight of the network matrix M | Uniform[0,1] and normalized to get \(\sum_j m_{ij}=1\) |
Assessing the effect of R&D public support on total R&D by increasing network “hubness”
In this application of the model, we are interested in identifying whether, ceteris paribus, a random network is or is not more conducive to higher levels of R&D than, for instance, networks characterized by the emergence of specific nodes playing as hubs. We will look at whether the policy effect on Rtotal shows an increasing or decreasing pattern as a function of an increasing “hubness” of the network.
We run a simulation by setting 100 companies, 5 runs, 334 distinct values of the hubness parameter, thus obtaining a simulated dataset of 167,000 observations. Before presenting the main results of this study, it is important to assess whether the algorithm proposed to generate networks with increasing hubness works properly.
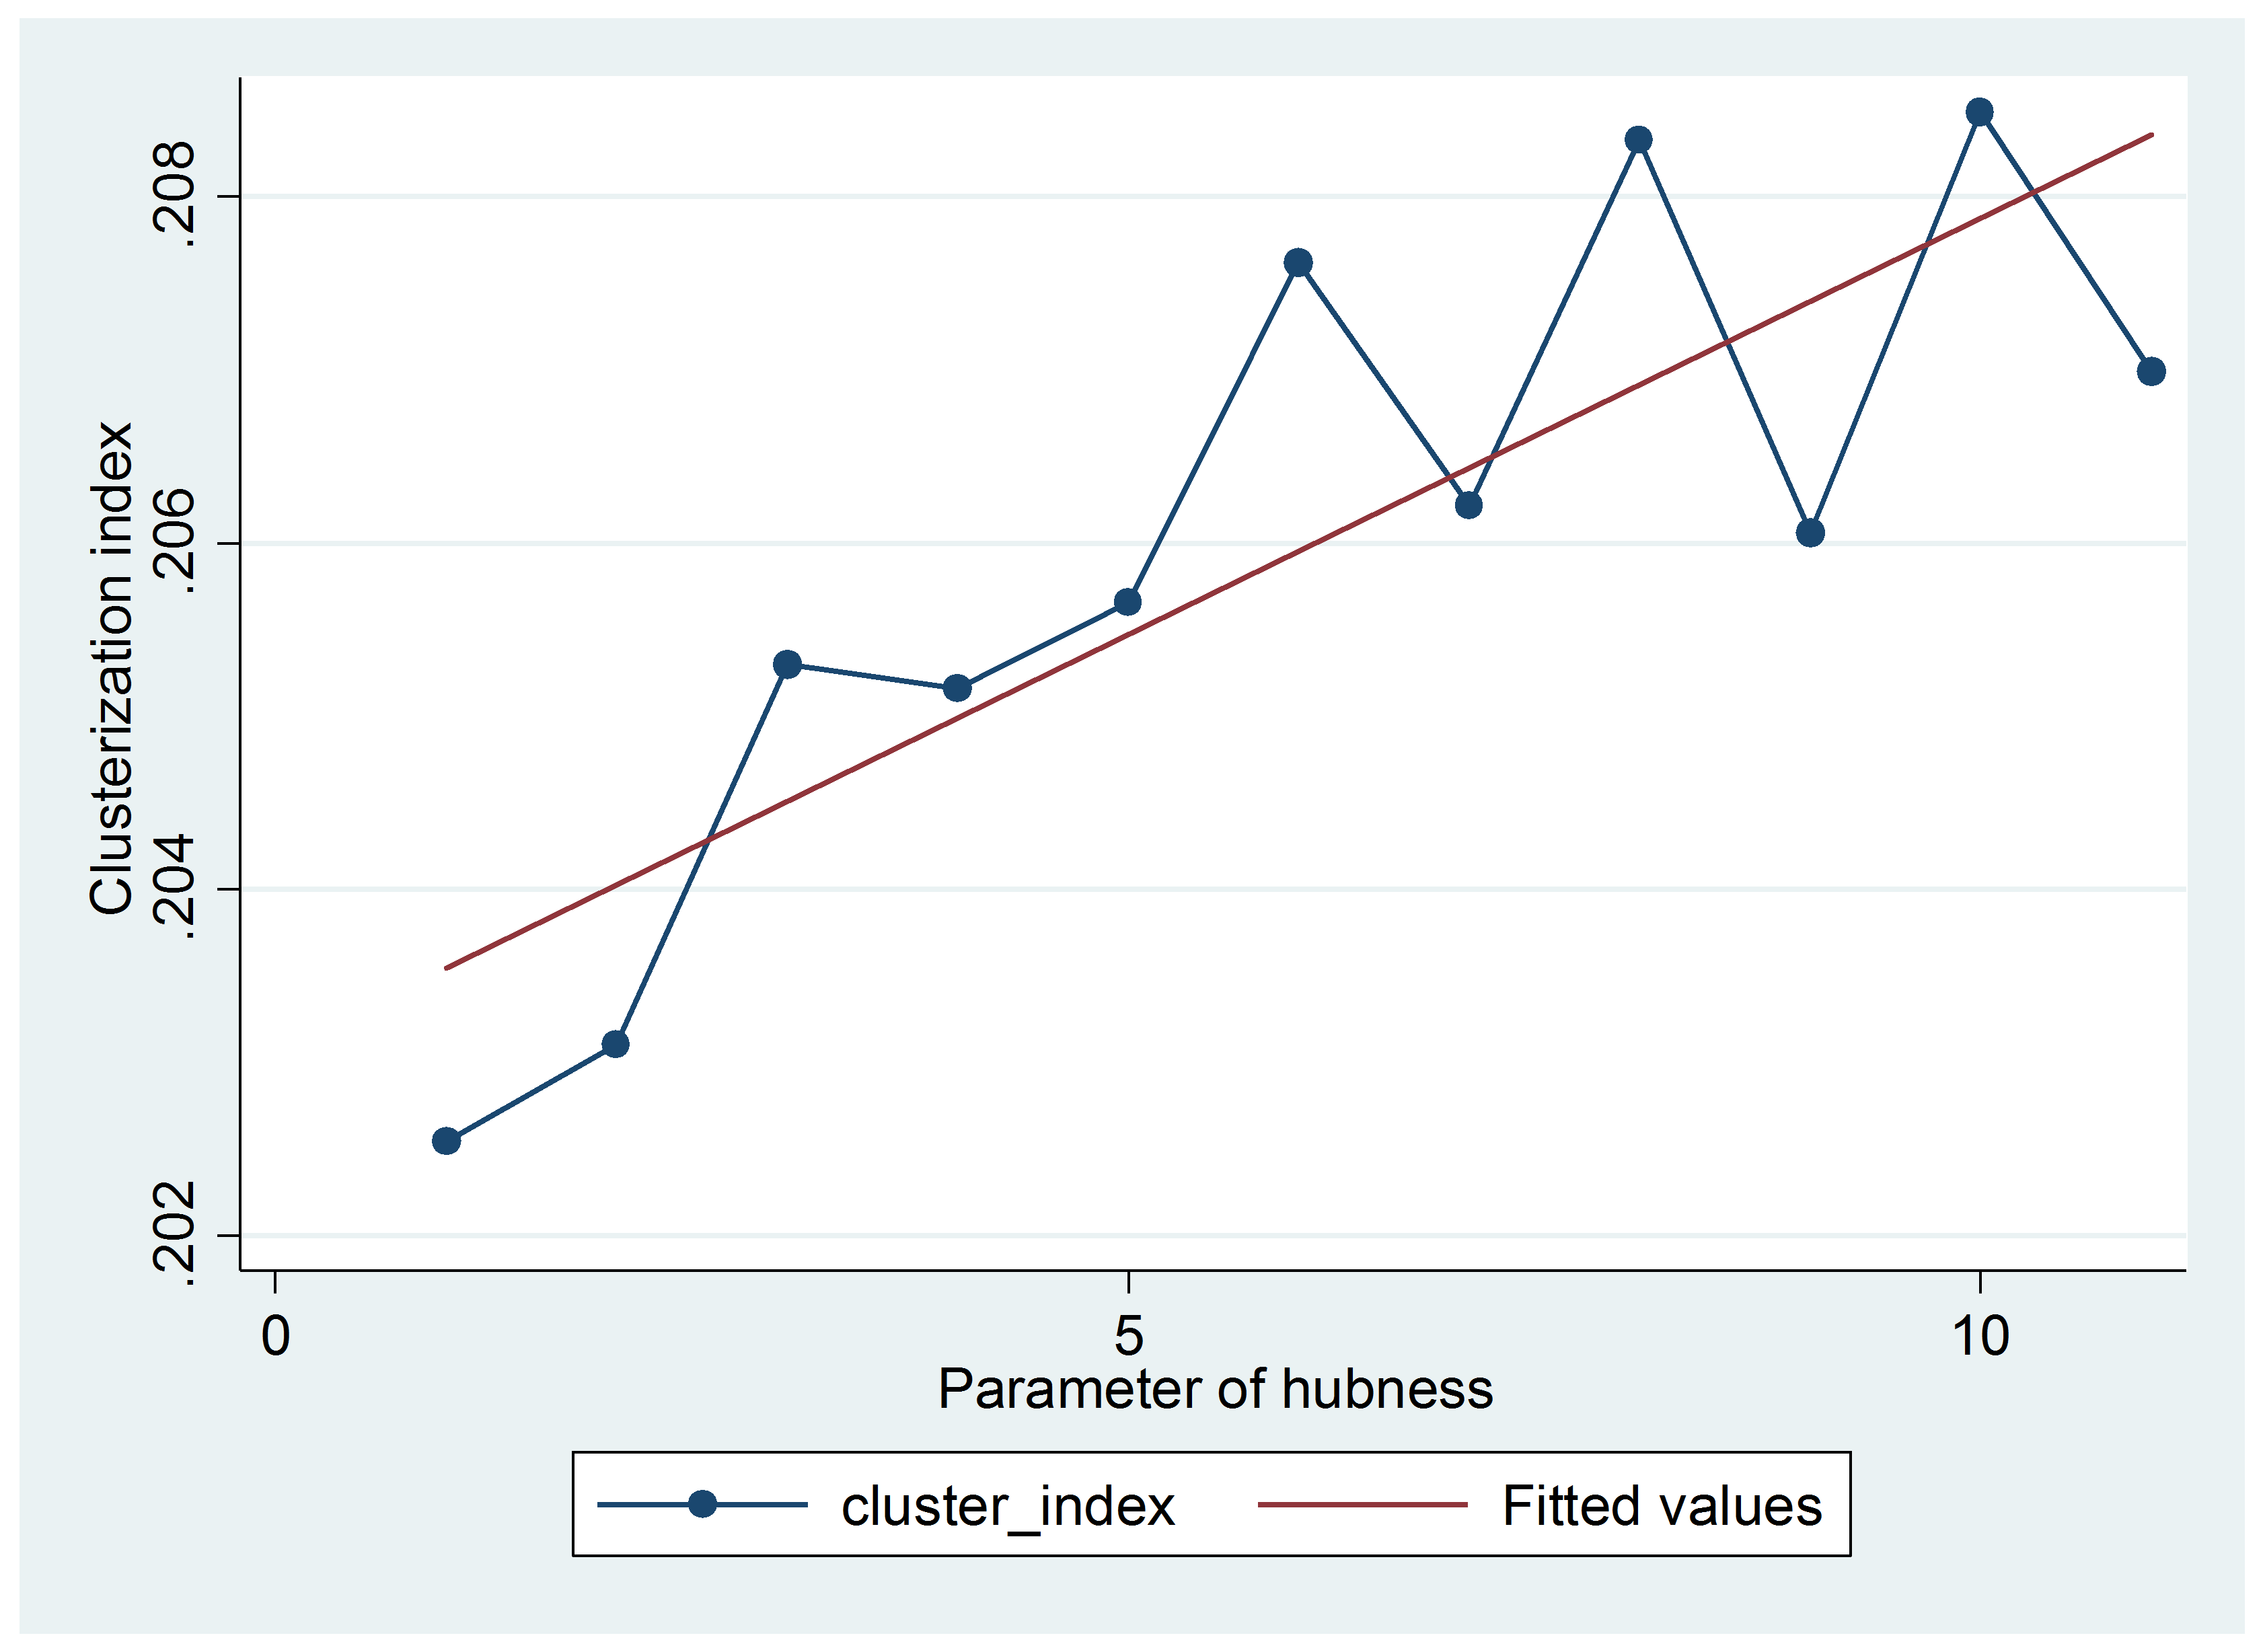
Figure 5 shows the pattern of the network clusterization index when the parameter of hubness increases. In this case, the clusterization index is measured as the probability that two neighbours of a node are also neighbours between them. As shown, there is a clear increasing relation between the hubness parameter (the increase in the preferential attachment towards nodes with high current degree) and the clusterization. This means that the algorithm we have proposed to generate hubished networks work as expected.
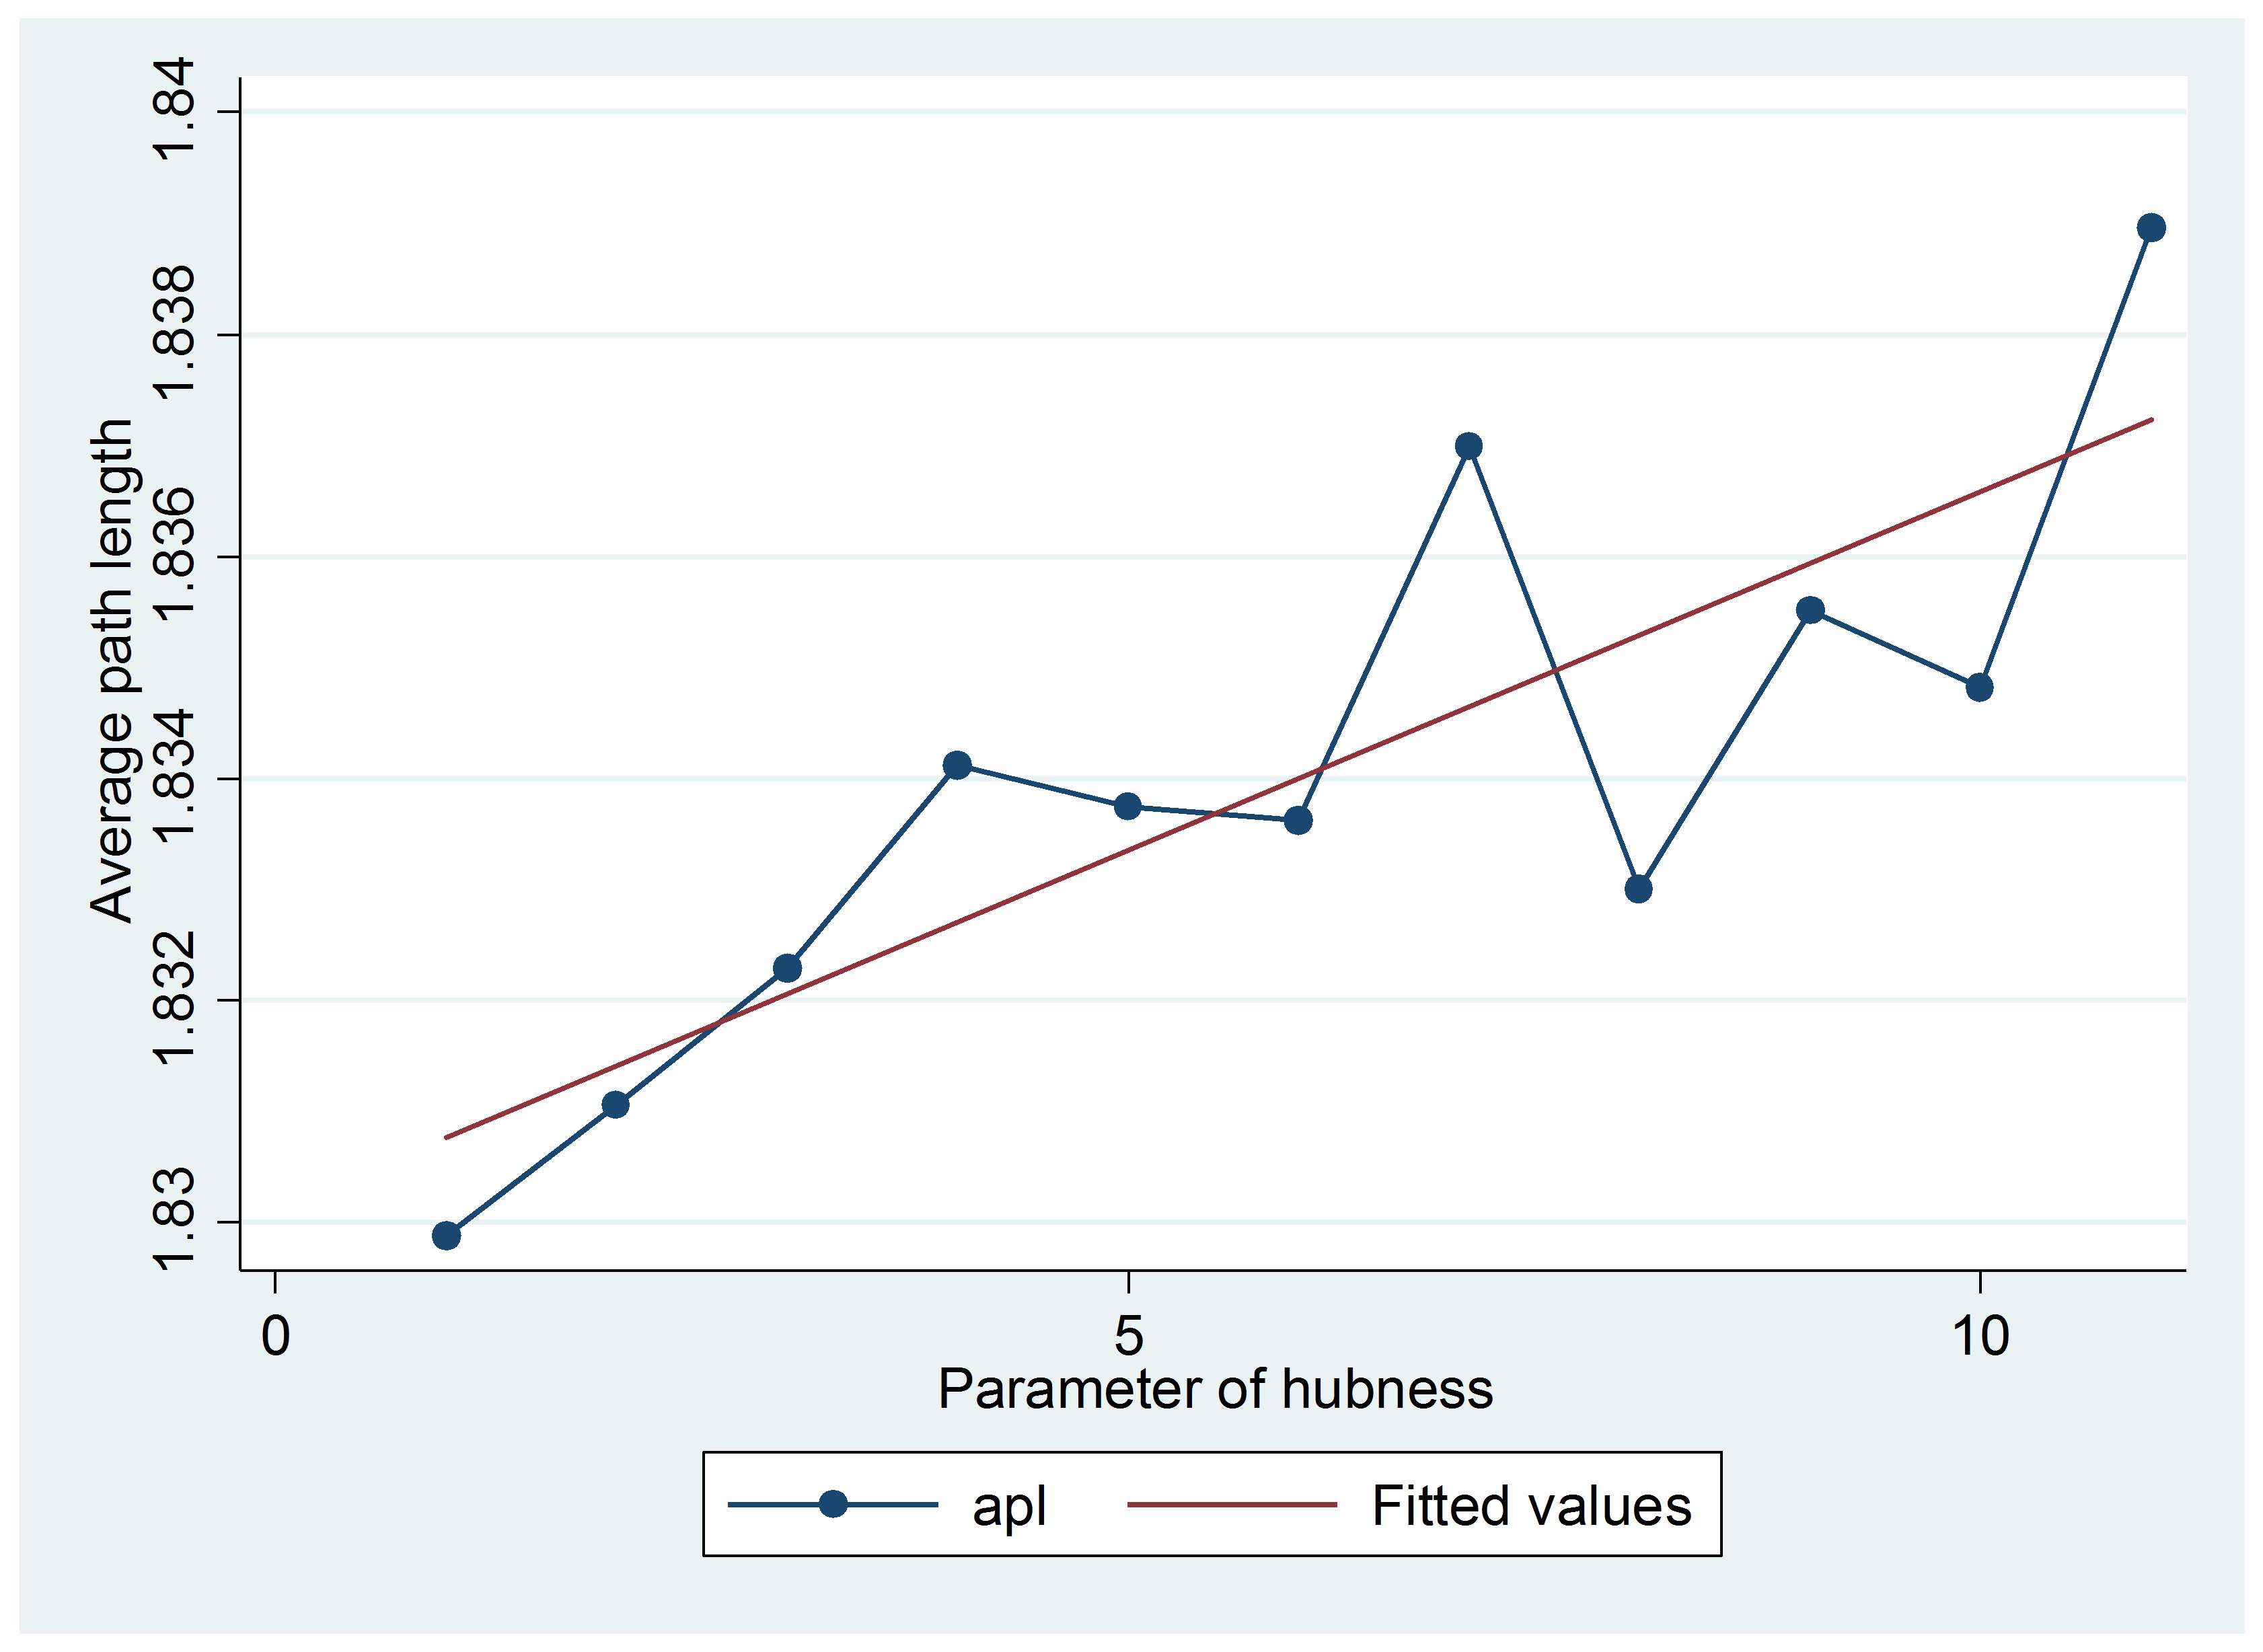
Similarly, Figure 6 displays the pattern of the network average path length (APL) when the parameter of hubness increases. In this case, the APL index is measured as the average shortest path between two nodes. Again, we see that the relation is an increasing one, thus confirming that our algorithm produces networks where it takes longer steps to pass from one node to another, an effect due to higher clusterization.
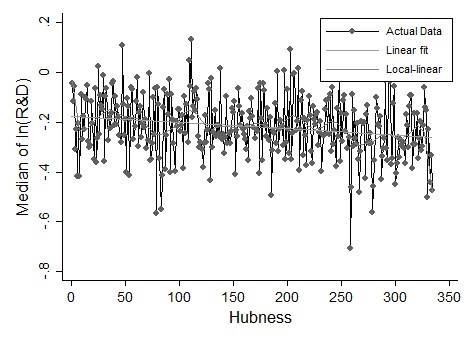
Established that our “network increasing hubness” algorithm does the right thing, we can go on by providing the main results of this study. To this end, we first calculate, for each value of the hubness parameter, the median of the log of Rtotal, and then a regression of this variable on the parameter of hubness. The result is reported in Table 2, while Figure 7 shows the fit graphically.
| Dependent variable: Median Rtotal | |
| Hubness | -.00026*** (3.08e-06) |
| Beta coefficient | -.199 |
| Number of observations | 166,999 |
| F(1,166997) | 6910.2 |
| P-value of the F-test | 0.0000 |
| R-squared | 0.0397 |
It is immediate to see that the larger the hubness of the network, the lower the optimal level of R&D activated by an amount of subsidy \(\overline{S}\) = 10. The beta coefficient is around -20 and it is highly significant. Figure 7 confirms this decreasing pattern, although it also emphasizes that the variability around the fit is rather huge, as confirmed by the low R-squared of this regression.
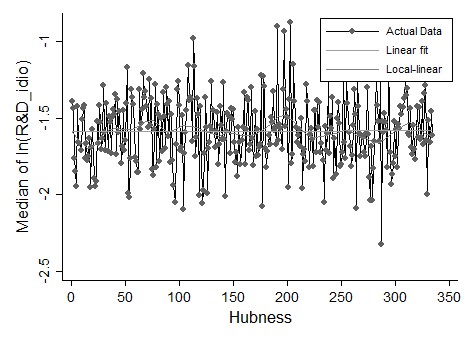
If we look at Ridio, the result is in the opposite sense, with a statistically significant (but moderate) increase of Ridio as soon as the hubness increases (see Table 3). Figure 8 confirms this finding.
These results suggest that, in the presence of positive R&D spillovers, and for a fixed amount of support, the median of the total population R&D tends to decrease as soon as few nodes become highly important in the network. This was not a trivial regularity to find out without such analysis. On average, and just by considering the median as representative moment of the entire distribution of the log of Rtotal, one can conclude that the policy R&D return to an investment equal to \(\overline{S}\) is higher in R&D networks characterized by lower hubness. Observe, also, that this result is independent of the specific idiosyncratic parameters chosen, as what we performed in this experiment is a Monte Carlo simulation which explores, by subsequent draws, the entire support of the distribution of these parameters.
The fact that the Ridio is moderately increasing with larger hubness may be explained by the fact that fixed costs of R&D decrease with a larger centrality-degree – i.e. D(M) – which is an argument of the Ridio function.
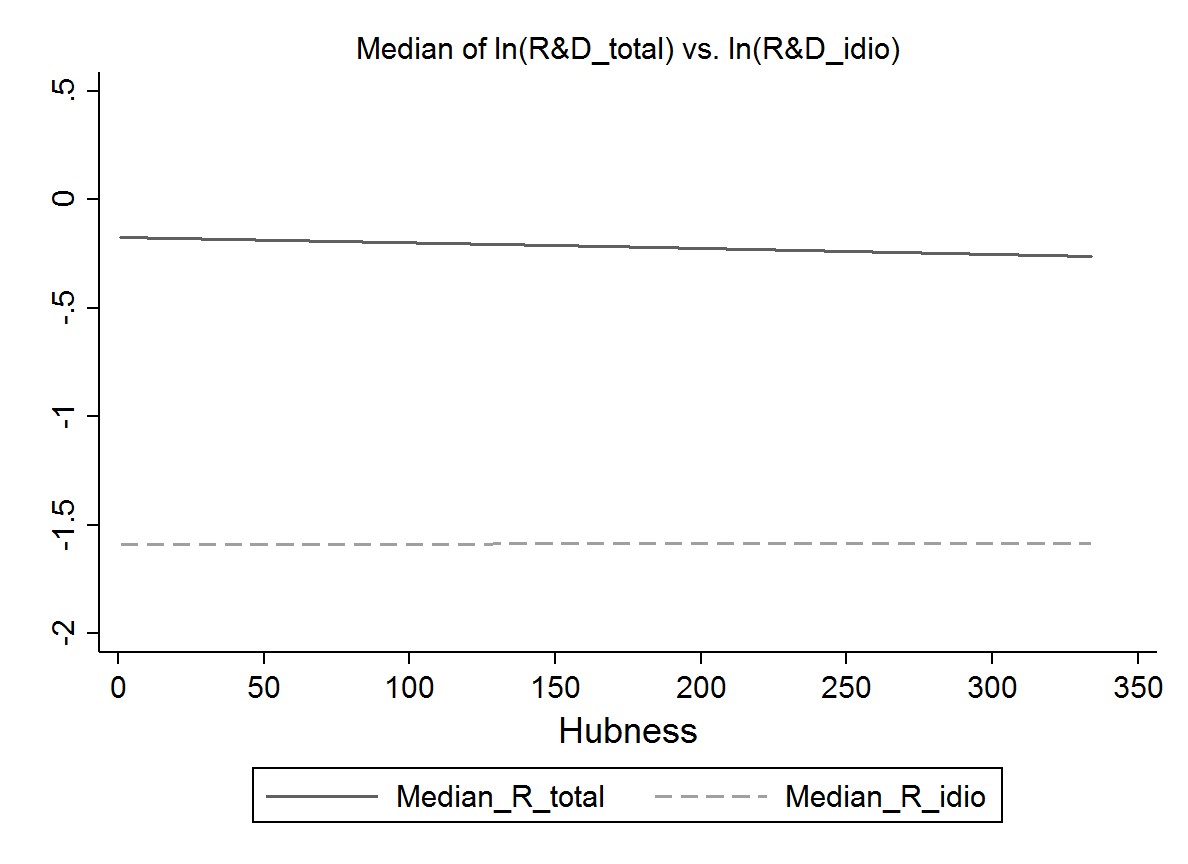
Finally, Figure 9 illustrates the trend of the median of log(Rtotal), and that of the median of log(Ridio) as function of the hubness within the same graph. As expected, in the presence of positive R&D spillovers, the overall level of the median of log(Rtotal) is higher than that of log(Ridio).
| Dependent variable: Median Ridio | |
| Hubness | .0000178*** |
| (5.54e-06) | |
| Beta coefficient | .0078449 |
| Number of observations | 166,999 |
| F(1,166997) | 10.28 |
| P-value of the F-test | 0.0013 |
| R-squared | 0.0001 |
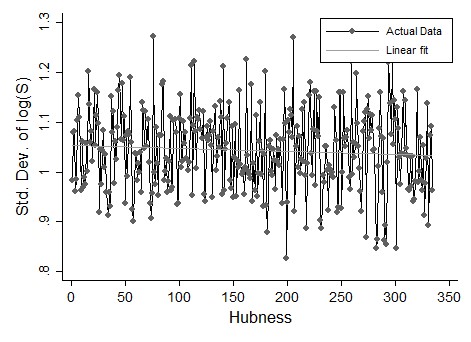
Another important finding concerns the pattern of the standard deviation of log( S) as function of the parameter of hubness. We expect a decreasing standard deviation of the distribution of the R&D support as long as the level of hubness increases. This should be so, as an increase in network hubness should reduce the number of supported units to fewer companies. Table 4 shows in fact that this is the case: the beta regression coefficient is negatively significant with a value equal to -0.073, which is however not very sizable. Figure 10 confirms this finding although it also sets out a large variability around the linear fit.
| Dependent variable: Standard deviation of the log of S | |
| Hubness | -.0000625*** |
| (2.08e-06) | |
| Beta coefficient | -.073 |
| Number of observations | 166,999 |
| F(1,166997) | 906.01 |
| P-value of the F-test | 0.0000 |
| R-squared | 0.0054 |
Also, the degree-centrality index increases – as expected – with the hubness, with a significant beta regression coefficient of 0.073.
Finally, Figure 10 provides a plot of the relation between the (median) of total R&D spending and the (median) centrality-degree by firm, when the parameter of hubness increases. We detect a decreasing pattern between the two variables, which is informative to interpret previous results. Indeed, what such relation entails is that – as soon as the network hubness increases – the overall network average degree reduces accordingly, thus meaning that the nodes tend to become progressively less connected (on average) as consequence of a larger concentration of ties in few nodes. This is detrimental for R&D flows circulation and total R&D turns out to drop down. This is the main mechanism behind the scope of our findings. Table 5, lastly, shows regression results that confirm the graphical ones.
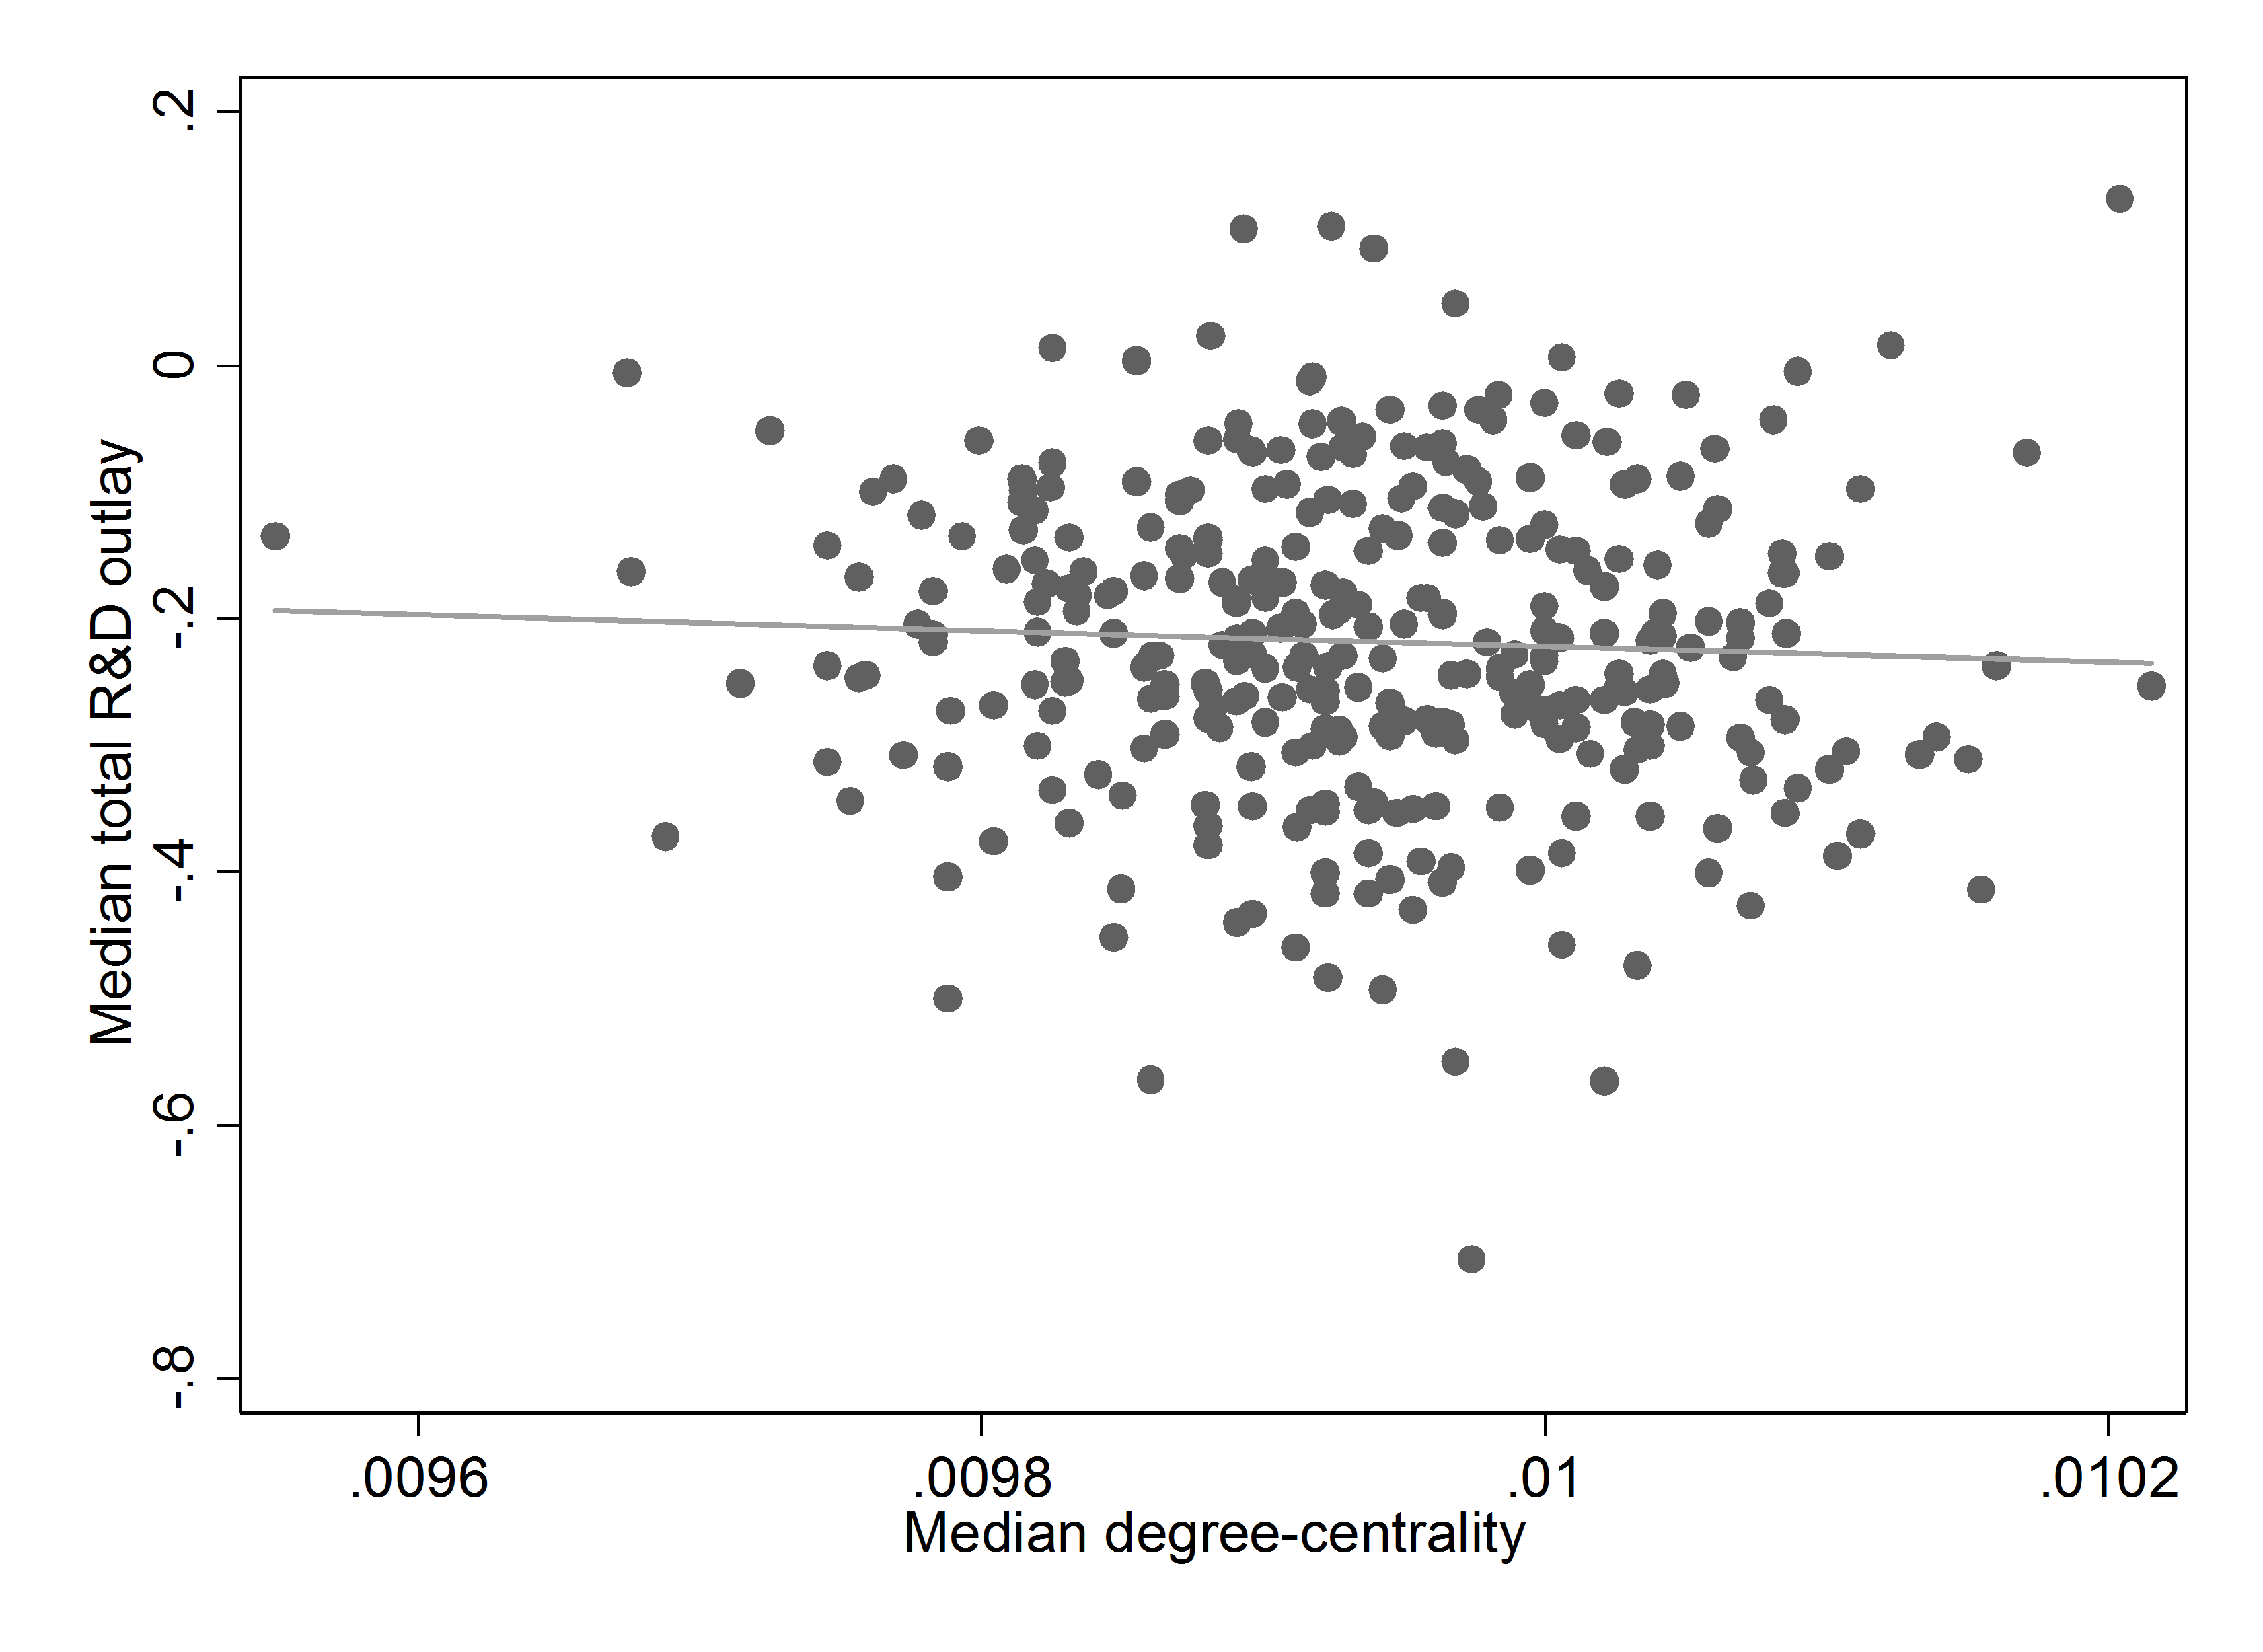
| Dependent variable: Median total R&D spending | |
| Median of degree-centrality | -62.32*** (3.06) |
| Beta coefficient | -.0496 |
| Number of observations | 166,999 |
| F(1,166997) | 413.43 |
| P-value of the F-test | 0.0000 |
| R-squared | 0.0025 |
Conclusions
This paper has presented an agent-based micro-policy simulation for an assessment of public R&D policy effect on companies’ R&D activity. We have shown the behavioural properties and the computational logic of this model, and then illustrated a simulative example where the total level of R&D activated by a fixed amount of public support becomes function of companies’ network topology. More specifically, the simulation experiment presented here shows that larger network “hubness” – on average – produces a decreasing median of the aggregated total company R&D. Since the aggregated firm idiosyncratic R&D (the part of total R&D independent of spillovers) is slightly increasing, we conclude that positive cross-firm spillover effects in the presence of a given amount of support, have a larger impact in less centralized network where fewer hubs emerge. This may question the common wisdom, which suggests that larger R&D externality effects are more likely to arise when few “central” champions receive a support.
Some literature on knowledge diffusion within networks seems however to support our findings. Many studies have shown that in formal and informal social networks, skewed degree distribution is often present, as few nodes in the networks have more connections than the average. The preferential attachment process explains the presence of hubby networks (Barabasi and Albert 1999), and are able to describe rather well the network structure of environments where reputation and/or power is relevant (Gould 2002).
An outstanding systematic review of the literature on knowledge networks (Phelps et al 2012), dealing with inter-organizational studies and the effect of the whole network structure on network knowledge outcome, reports that dense structures (like clusters) increase the rate and extent of information diffusion, although they reduce at the same time information diversity (Lazer and Friedman 2007). Excessive clusterization can reduce organizational innovation by creating dysfunctional levels of social cohesion, and reducing the availability of diverse information within clusters (Uzzi and Spiro 2005).
Schilling and Fang (2014) studied the role of hubness in organizational knowledge outcome of interpersonal networks, and find that moderately hubby networks outperform more “open” and “democratic” networks. When organizations or individuals interact, they exchange and recombine information, resulting in new or refined ideas (Argote 1999). In such view of the learning mechanism, a fast process of diffusion, facilitated within a clustered structure, can generate benefits to the innovation practice. At the same time, however, “when ideas diffuse too quickly through a population, the result can be a premature convergence around a popular though suboptimal set of ideas” (Schilling and Fang 2014, p. 7). Some authors (Fang et al. 2010) have also found that organizations split into isolated subgroups – as well as subgroups having many reciprocal links – generally foster the diversity of ideas, by enhancing the learning outcome. Other aspects supporting our result deal with the “inefficiency cost” of hubby networks due to the burdensome information they have to cope with, and the presence of agency-type problems producing lack of completeness and accurateness of information circulation. Moreover, a large body of research finds a U-shaped relationship between information quantity and managerial performance (Eppler and Mengis 2004).
To sum up, the result of our experiment can be understood as follows: the propagation of an exogenous shock, like a public financial support, to autonomous firms’ R&D expenditure decision provides a better welfare return when knowledge spillovers circulate within firms’ networks which are moderately clusterized and thus less close around powerful industrial groups.
This paper presents just one of many possible simulation experiments one could perform using this agent-based model. Further experiments may include, for instance, an assessment of an R&D policy effect when other significant network parameters are changed, or when one considers different network topologies, such as “scale-free” or “small-world” networks. We plan to go into these directions in other applications of this model.
Finally, a further type of analysis the model can allow for exploring concerns the possibility of its calibration using real data. Indeed, if an empirical measure of the actual network was available, so that an empirical calibration of the model’s parameters would become possible, one may also provide an assessment of the impact of the R&D support policy on a real-study context. This way, it would be possible to use our model as a toolbox for ex-ante evaluation of real R&D-promoting policies. This seems a challenging potential development of this model, although its feasibility requires specialized datasets not easily available in real contexts of analysis.
Notes
- This optimization problem is solved computationally using the gradient method, as a closed form of its solution is not available.
- Total degree centrality is obtained by summing in-degree and out-degree values.
Appendix
Appendix A
The (Matlab) code of our model entails, for each experiment, two distinct loops: (i) a first loop varies the network parameter of interest, which depends on the type of network chosen (for instance, in the case of a random network, we consider as network parameter the network “density”); (ii) a second loop repeats the simulation with a different set of companies and a different (generated) network.
Within each run, the code performs the following three sequential steps:
- It calculates the optimal subsidy for each company by eliminating those companies with a value of the optimal subsidy ending up out of the acceptable (to agency) range of values.
- If no additional companies need to be eliminated, it calculates the amount of R&D obtained with the previous optimal support, called in the code Ridio.
- Finally, it calculates the amount of total R&D thus obtained by adding to Ridio the part of R&D coming from the network effects (i.e., spillovers).
Figure 12 sets out the pseudo-code of our simulator.
Appendix B
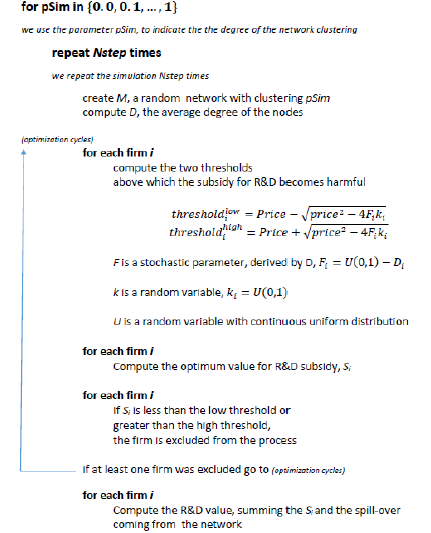
This appendix provides the pseudo-code for generating networks with increasing hubness. The algorithm – as described in the main text – starts with a random network and then generates a preferential attachment procedure to nodes with higher degree-centrality. Figure 13 sets out in details the pseudo-code.

References
AHRWEILER, P, Schilperoord, M, Pyka, A & Gilbert, N (2015). Modelling Research Policy: Ex-Ante Evaluation of Complex Policy Instruments. Journal of Artificial Societies and Social Simulation, 18(4), 5: https://www.jasss.org/18/4/5.html. [doi:10.18564/jasss.2927]
ALMENDRAL, A, Oliveira, JG, Lopez, L, Mendes, JFF, & Sanjuan, MAF (2007). The network of scientific collaborations within the European framework programme. Physica A, 384(2), 675–683. [doi:10.1016/j.physa.2007.05.049]
ARGOTE, L (1999). Organizational learning: Creating, Retaining and Transferring Knowledge. Boston: Kluwer Academic Publisher.
ARROW, K (1962). ‘Economic Welfare and the Allocation of Resources for Invention.’ In Nelson R (Ed.), The Rate and Direction of Economic Activity. New York: Princeton University Press, pp. 609-25. [doi:10.1515/9781400879762-024]
BARABASI, A and Albert, R (1999). Emergence of scaling in random networks. Science, 286(5439), 509-512. [doi:10.1126/science.286.5439.509]
BARBER, MJ, Krueger, A, Krueger, T, & Roediger-Schluga, T (2006). Network of European Union-funded collaborative research and development projects. Physical Review E, 73(3), 036132. [doi:10.1103/PhysRevE.73.036132]
BARBER, MJ, Paier, M, & Scherngell, T (2009). ‘Analyzing and Modeling European R&D Collaborations: Challenges and Opportunities from a Large Social Network.’ In Dehmer, M, Emmert-Streib, F (Eds.), Analysis of Complex Networks: From Biology to Linguistics.Weinheim: Wiley-VCH Verlag. [doi:10.1002/9783527627981.ch16]
BENTAL, B & Peled, B (2002). Quantitative Growth Effects of Subsidies in a Search Theoretic R&D Model. Journal of Evolutionary Economics, 12(4), 397-423.
BRESCHI, S & Cusmano, L (2004). Unveiling the texture of a European Research Area: emergence of oligarchic networks under EU Framework Programmes. International Journal of Technology Management , 27(8), 747–772. [doi:10.1504/IJTM.2004.004992]
CARAYOL, N & Roux, P (2005). ‘Collective Innovation’ in a Model of Network Formation with Preferential Meeting. In Nonlinear Dynamics and Heterogeneous Interacting Agents. Berling/Heidelberg: Springer, pp. 139-153. [doi:10.1007/3-540-27296-8_10]
CERULLI, G (2012). Are R&D Subsidies Provided Optimally? Evidence from a Simulated Agency-Firm Stochastic Dynamic Game. Journal of Artificial Societies and Social Simulation, 15(1), 7: https://www.jasss.org/15/1/7.html. [doi:10.18564/jasss.1886]
CERULLI, G & Potì, B (2016). Explaining firm sensitivity to R&D subsidies within a dose-response model: The role of financial constraints, real cost of investment, and strategic value of R&D. DEM Working Papers, Department of Economics and Management, University of Trento, Italy.
CHOI, H, Kim, SH, & Lee, J (2010). Role of Network Structure and Network Effects in Diffusion of Innovations. Industrial Marketing Management, 39(1), 170-177. [doi:10.1016/j.indmarman.2008.08.006]
CLAUSET, A, Shalizi, CR, & Newman, MEJ (2009). Power-law distributions in empirical data. SIAM Rev, 51(4), 661–703. [doi:10.1137/070710111]
COWAN, R (2005). ‘Networks models of innovation and Knowledge Diffusion.’ In Breschi S and Malerba F (Eds.) Clusters, Networks and Innovation. New York: Oxford UP.
COWAN, R & Jonard, N (2004). Network Structure and the Diffusion of knowledge. Journal of Economics Dynamics and Control, 28(8), 1557-1575. [doi:10.1016/j.jedc.2003.04.002]
DASGUPTA, P (1988). Patents, Priority and Imitation or, the Economics of Races and Waiting Games. The Economic Journal, 98(389), 66-80. [doi:10.2307/2233511]
DASGUPTA, P & Stiglitz, J (1980). Industrial Structure and the Nature of Innovative Activity. The Economic Journal, 90(358), 266-293. [doi:10.2307/2231788]
D'ASPREMONT, C & Jacquemin, A (1988). Cooperative and Noncooperative R&D in Duopoly with Spillovers. The American Economic Review, 78(5), 1133-1137.
DAVID, PA & Hall, BH (2000). Heart of Darkness: Modeling Public-Private Funding Interactions inside the R&D Black Box. Research Policy, 29(9), 1165-1183. [doi:10.1016/S0048-7333(00)00085-8]
DAVID, PA, Hall, BH & Toole, AA (2000). Is Public R&D a Complement or Substitute for Private R&D? A Review of the Econometric Evidence. Research Policy, 29(4), 497-529. [doi:10.1016/S0048-7333(99)00087-6]
EPPLER, MJ & Mengis, J (2004). The concept of information overload: a review of literature form organization science, accounting, marketing, MSI and related disciplines. The Information Society, 20(5), 325-344.
ERDOS, P. & Rényi, A. (1959). On random graphs, I. Publicationes Mathematicae (Debrecen), 6, 290–297.
ERICSON, R. & Pakes, A. (1995). Markov-perfect industry dynamics: A framework for empirical work. Review of Economic Studies, 62(1), 53–82. [doi:10.2307/2297841]
FANG, C, Lee, J & Schilling, M (2010). Exploration and exploitation: the influence of subgroup structure on organizational learning. Organization Science, 21(3), 625-642. [doi:10.1287/orsc.1090.0468]
FLEMING, L, King, C & Juda, AI (2007). Small Worlds and Regional Innovation. Organization Science, 18(6), 938-954. [doi:10.1287/orsc.1070.0289]
GAY, B & Dousset, B (2005). Innovation and network structural dynamics: Study of the alliance network of a major sector of the biotechnology industry. Research Policy, 34(10), 1457-1475. [doi:10.1016/j.respol.2005.07.001]
GILBERT, N, Pyka, A & Ahrweiler, P (2001). Innovation Networks - A Simulation Approach. Journal of Artificial Societies and Social Simulation, 4(3), 8: https://www.jasss.org/4/3/8.html.
GILBERT, N, Pyka, A & Ahrweiler, P (Eds.) (2014). Simulating Knowledge Dynamics in Innovation Networks. Berlin/Heidelberg: Springer. [doi:10.1007/978-3-662-43508-3]
GILBERT, N, & Troitzsch, KW (2005). Simulation for the Social Scientist. Second edition. Open University Press.
GOULD, R (2002). The origins of status hierarchies: a formal theory and empirical test. American Journal of Sociology, 107(5), 1143-1178. [doi:10.1086/341744]
HALL, BH (2002). The Financing of Research and Development. Oxford Review of Economic Policy, 18(1), 35-51. [doi:10.1093/oxrep/18.1.35]
HANAKI, M, Nakajima, R & Ogura, J (2009). The Dynamics of R&D Network in the IT Industry. Research Policy, 39(3), 386-399. [doi:10.1016/j.respol.2010.01.001]
HOWE, JD & McFetridge, DG (1976). The Determinants of R&D Expenditures. Canadian Journal of Economics, 9, 57-71. [doi:10.2307/134415]
JOU, J & Lee, T (2001). R&D investment decision and optimal subsidy. R&D Management, 31(2), 137-148. [doi:10.1111/1467-9310.00204]
LAINCZ, CA (2009). R&D subsidies in a model of growth with dynamic market structure. Journal of Evolutionary Economics, 19(5), 643-673. [doi:10.1007/s00191-008-0114-8]
LAZER, D & Friedman, A (2007). The network structure of exploration and exploitation. Administrative Science Quarterly, 52(4), 667–694. [doi:10.2189/asqu.52.4.667]
LEWIS, TG (2009). Network Science: Theory and Applications. Hoboken, NJ. [doi:10.1002/9780470400791]
LIN, M & Li, N (2010). Scale-free network provides an optimal pattern for knowledge transfer. Physica A, 389(3), 473-480. [doi:10.1016/j.physa.2009.10.004]
MALERBA, F (1993). 'The National System of Innovation: Italy.' In Nelson R (Ed.), National Innovation Systems. A comparative Analysis. Oxford: Oxford University Press, pp. 230-60.
MARINO, M & Parrotta, P (2010). Impacts of public funding to R&D: evidence from Denmark. Paper to be presented at the DRUID Summer Conference 2010 on Opening Up Innovation: Strategy, Organization and Technology, Imperial College London Business School, June 16-18.
MARTIN, S & Scott, JT (2000). The Nature of Innovation Market Failure and the Design of Public Support for Private Innovation. Research Policy, 29(4), 437-447. [doi:10.1016/S0048-7333(99)00084-0]
MATERIA, VC & Esposti, R (2010). Modelling Public R&D Cofinancing within a Principal-Agent Framework. The Case of an Italian Region. Working Papers 347, Universita' Politecnica delle Marche (I), Dipartimento di Scienze Economiche e Sociali.
METCALFE, S (1995). ‘The Economic Foundations of Technology Policy: Equilibrium and Evolutionary Perspectives.’ In Stoneman P (Ed.), Handbook of the Economics of Innovation and Technological Change. Oxford: Blackwell Publishers, pp. 409-512.
MOWERY, D (1995). ‘The Practice of Technological Policy.’ In Stoneman P (Ed.) Handbook of the Economics of Innovation and Technological Change. Oxford: Blackwell Publishers, pp. 213-557.
NEWMAN, MEJ (2005). Power laws, Pareto distributions and Zipf's law. Contemporary Physics, 46(5), 323–351 [doi:10.1080/00107510500052444]
NEWMAN, MEJ (2010). Networks. An Introduction. New York, NY: Oxford University Press. [doi:10.1093/acprof:oso/9780199206650.001.0001]
PHELPS, C, Heidl, R & Wadhwa A (2012). Knowledge, networks and knowledge networks: a review and research agenda. Journal of Management, 38(4), 1115-1166. [doi:10.1177/0149206311432640]
PROTOGEROU, A, Caloghirou Y, & Siokas E (2010). Policy-driven collaborative research networks in Europe. Economics of Innovation and New Technology, 19(4), 349–372. [doi:10.1080/10438590902833665]
PROTOGEROU, A, Caloghirou, Y & Siokas E (2012). Twenty-five years of science industry collaboration: the emergence and evolution of policy-driven research networks across Europe. Journal of Technology Transfer, 38(6), 873–895. [doi:10.1007/s10961-012-9278-3]
ROEDIGER-SCHLUGA, T & Barber M J (2007). R&D collaboration networks in the European Framework Programmes: data processing, network construction and selected results. International Journal of Foresight and Innovation Policy, 4(3-4), 321–347.
SCHILLING, MA & Fang C (2014). When hubs forget, lie, and play favorites: Interpersonal network structure, information distortion, and organizational learning. Strategic Management Journal, 35(7), 974-994. [doi:10.1002/smj.2142]
SCHILLING, MA & Phelps C C (2007). Interfirm Collaboration Networks: The Impact of Large-Scale Network Structure on Firm Innovation. Management Science, 53(7) 1113-1126. [doi:10.1287/mnsc.1060.0624]
UZZI, B & Spiro J (2005). Collaboration and creativity: the small world problem. American Journal of Sociology. 111(2), 447-504. [doi:10.1086/432782]
WATTS, DJ & Strogatz S H (1998). Collective Dynamics of ‘Small-World’ Networks.Nature, 393(6684) 440–442. [doi:10.1038/30918]