
Introduction
Littering is a problem in many public and private places. Besides the esthetical disturbance, littering also has a negative impact on the quality of the natural environment, e.g. by the diffusion of plastic waste. To identify possible strategies for mitigating this behaviour many scholars have studied why and when people litter. A key driver of littering is the presence of litter in the environment, but also anti-litter signs (prompts), punishing littering and rewarding non-littering play a role (see e.g. Geller, Winett & Everett 1982; Dwyer et al. 1993; Huffman et al. 1995). Sibley and Liu (2003) distinguish between active littering (throwing litter on the street when walking) and passive littering (leaving litter behind when moving away), the latter behaviour being more difficult to change. In this paper, we will focus on active littering behaviour, defined as the dropping of litter whilst the littering person continues walking along. This active type of littering has been studied in the seminal work of Cialdini, Reno and Kallgren (1990), who showed that people are very susceptible to the littering behaviour of other people (see also Reno, Cialdini & Kallgren 1993, and Kallgren, Reno & Cialdini 2000). In field experiments, they showed people are littering more when in a littered environment. Cialdini et al. (1990) explained that the observed degree of littering describes the norm of other people (descriptive norm). This descriptive norm is frequently being followed by other people. Many studies demonstrated that littered environments stimulate people to litter, e.g. in grocery stores (Geller, Witmer & Tuso 1977), picnic areas (Crump, Nunes & Crossman 1977), waiting rooms (Krauss, Freedman & Whitcup 1978), a parking garage (Reiter & Samuel 1980; Cialdini et al. 1990 ; Reno et al. 1993), the lobby of a dormitory (Ramos & Torgler 2010), an alley in a city centre (Keizer, Lindenberg & Steg 2011) and the area around a waste collection point in a neighbourhood (Dur & Vollaard 2012). Norms thus play an important role in the regulation of human behaviour, also in the case of littering. Whereas usually a small proportion of the population is violating norms to some extent, most people abide to norms such as not parking cars on sidewalks, not smoking in public buildings, queuing for e.g. a ticket sale and not littering on the street. Sometimes however, it looks like the norm is collapsing, and an increasing number of people appear to disrespect the norm, resulting in littered streets, smoking in bars and restaurants. In many situations, most people dislike this disrespect for the norms, but sometimes it is considered to be appropriate behaviour, such as littering plastic cups on festivals. In this context it is interesting that research by Keep America Beautiful (Wesley & Schultz 2009) found that most people expressed a strong personal obligation not to litter, but that 43% admitted to have littered in the past month. Recoveries from littered environments can also be observed, e.g. in clean-up actions where a street or neighbourhood is being cleaned by inhabitants.
However, questions that remained unanswered were how for example graffiti may have an effect on littering, because the presence of graffiti does not address a descriptive littering norm. Furthermore, the process explaining how for example signs addressing a particular norm can have effects on other behaviour was not clear. The Goal Framing Theory of Lindenberg and Steg (2007) explains such processes by postulating that goals “frame” the way people process information and act upon it. Three goal frames are distinguished by Lindenberg and Steg (2007): the hedonic goal “to feel better right now,” the gain goal “to guard and improve one’s resources,” and the normative goal “to act appropriately.” When such a goal is activated (i.e., when it is the “focal” goal, or, as it is called here, a “goal frame”), it will influence what persons think of at the moment, what information they are sensitive to, what action alternatives they perceive, and how they will act (see Lindenberg and Steg 2007 , p 119). In a littering context the hedonic motive would focus on getting rid of a piece of litter, e.g. by throwing it on the street or in a bin, whereas the normative motive would focus on keeping the environment clean, e.g. by throwing litter in a bin or to keep it with you. The gain goal, which is related to personal profit, is not relevant in the littering context, as keeping litter with you, throwing it in a bin or on the street will have no impact on your personal resources. Essential in the Goal Framing Theory is that the strength of the focal goal may be influenced by other goals that are in the background. This relates to the “broken windows theory” as coined by Wilson & Kelling (1982), which states that if a neighbourhood is not cleaned regularly, and broken thinks such as windows are not repaired fast enough, the neighbourhood will get trapped in a negative spiral of pollution, vandalism and criminal behaviour. Empirical validation for this process comes from a series of field experiments conducted by Keizer, Lindenberg & Steg (2008). They demonstrate that the violation of a norm not directly related to the target behaviour results in people less complying with the norm. Therefore, when a norm is being disrespected by many people, the normative motive is less focal, causing people to behave more according to their hedonic and gain motives. On the contrary, when a single person violates the norm, the norm will become more focal, and people will abide more to the norm. After conducting a series of six field experiments, Keizer et al. (2008) conclude that when people observe others violating a social norm or legitimate rule, they are more likely to violate other norms or rules themselves, which causes disorder to spread. Most interestingly, the Goal Frame Theory explains how a prompt “not to litter” may further deactivate the norm in littered conditions and cause more people to litter, an effect that has been found in the field experiments of Keizer, Lindenberg & Steg (2011). In a clean environment the “not to litter” prompt indeed reduces littering. Interestingly, a single piece of litter also functions as a prompt, reducing the littering. This can be explained by the single piece of litter making the norm – most people do not litter – even more focal.
If littering is substantially being influenced by the (de)activation of the normative motive, this implies that in field situations a strong social feedback mechanism is present. When litter starts to build up, this will deactivate the normative motive, which in turn will cause more people to start littering. Such a self-amplifying behavioural effect may cause a transition from a clean to a littered environment to develop in a non-linear way. When littering is increasing, at a certain moment a tipping point will be reached where the non-littering norm collapses (e.g. Nyborg et al. 2016). This means that more litter is present, the more people will litter, causing a stronger growth in littering behaviour. Relevant questions that arise are (1) how fast can norms concerning keeping an environment clean collapse? And (2) what strategies can be thought of to prevent such a collapse? In particular we want to explore if there exists a transition in social systems between a state where most people abide to the norm, and a state where most people disrespect the norm. If we are capable to identify the process behind such a transition, we may also be capable of identifying strategies to avoid the collapse of norms.
Conducting such experiments in field settings is quite tedious. First, this would require a series of field experiments in which the street is getting more littered over time. This is difficult to realise, as people in the experimental setting are likely to complain and possibly interfere with the experiment when the street gets really dirty. Moreover, if we systematically want to explore the effect of different cleaning regimes we need to conduct many experiments. It is very unlikely that people will not notice that experiments are being conducted in the street, which is very likely to affect their behaviour. To keep full experimental control in a very straight setting we therefore developed an agent-based simulation. Here, we program artificial people in a virtual street in a computer model, and experiment with the behaviour of this population using the so-called agent-based modelling (ABM) approach. This methodology has proven to be a suitable approach in exploring the dynamics of social complex systems, and is gaining momentum in many disciplines (e.g. Gilbert & Troitzsch 2005). In agent-based models, agents can influence each other and follow simple rules that are programmed at the individual level. The challenge here is to develop an agent-based model that formalises the Goal Framing Theory, and parameterise it against empirical data.
The model
The Goal Framing Theory distinguishes a hedonic, a gain and a normative motive. As indicated before, the gain motive is not relevant in this context and we will not further refer to this motive in this paper. In our model, each agent \(i\) is defined by the values of \(H_i\) and \(N_i\), where \(H_i\) stands for the hedonic goal weight and \(N_i\) stands for the normative goal weight. During every step of the simulation, agents holding one or more units of litter will act to maximize their payoff, which depends on both their goal weights. In the simplest version the model, agents can only choose between two possible actions: (i) keeping the litter or (ii) throwing the litter in the street. Hence, agents will choose the first action if \(N_i>H_i\).
| Payoff for keeping | Payoff for throwing in the street | |
| Hedonic Goal | 0 | \(H_i\) |
| Normative Goal | \(N_i\) | 0 |
Whereas the hedonic motive can be modelled really simple, as it refers to a fixed outcome schedule of possible behaviour, the normative motive is bringing in social complex dynamics as here we are dealing with the observation of other people’s behaviour, which feeds back on the importance of the own motives. The Goal Framing Theory does not explicitly describe the mechanism responsible for the activation of inhibition of the normative motive. After consulting Lindenberg, Steg and Keizer, we chose to model this activation-inhibition process following a reinforcement mechanism. In the case of littering, socially-mediated reinforcement implies here that a clean environment is expressing that other people respect this norm of not littering, which in response is further being activated. Therefore, the hedonic motive becomes a relative less important driver, and the non-littering behaviour is coupled with a reward. On the contrary, if an environment is littered, the socially-mediated reinforcement implies that other people disrespect the norm, and as a consequence the non-littering norm will be inhibited. The hedonic motive becomes relatively more important, and littering behaviour becomes more rewarding. The basic idea thus is that if the environment is in agreement with the own norm this is being experienced as a positive reinforcement of the own norm, causing an activation of the norm, whereas a disrespect of the norm will result in an inhibition of the norm. When the norm goal is activated, the hedonic goal is less likely to dominate behaviour than if the norm goal is inhibited.
If the behaviour being observed does not deviate too much from the norm, this is taken as confirmation of the appropriateness of ones’ own behaviour (respect), which can be conceived as a reward. The longer the reward is being experienced, the more positive reinforcement is experienced, resulting in an increasing activation of the norm. On the contrary, when others are disrespecting the norm, this results in an inhibition of the norm.
In the current model, the norm is clear and one-sided, such as not littering, not parking cars on the sidewalks and wait for ones turn. However, there are situations where the norm is not one-sided, and there may be heterogeneity in the ideal point. For example, people may have a different norm for an appropriate speed on the road. In the current formalization we define the norm activation process as follows:
- Agent \(i\) is initialised having a norm goal weight \(N_i\) (0, 100).
- Agent \(i\) looks at the tiles surrounding him. \(L_{it}\) (0, 100) is defined as the proportion of tiles holding one or more units of litter at time \(t\)
- A threshold \(TN_i\) (0, 100) is defined for agent \(i\), representing his tolerance to litter. Hence, agent \(i\) will regard the environment as clean if \(TN_i>L_{it}\).
- Agent \(i\) updates his current normative goal weight \(N_{it}\). For \(TN_i<L_{it}\) he will regard the norm as disrespected and his normative goal weight will be weakened. Hence, \(N_{it}=N_{it-1}-N_{it}\ast R\) where \(R\) is the reinforcement magnitude, being the same for all agents. On the other hand, for \(TN_i>L_{it}\) agent \(i\) will regard the norm as respected and his normative goal weight will be reinforced. Hence, \(N_{it}=N_{it-1}+N_{it}\ast R\). For example, if at time \(t\) two thirds of the tiles around agent \(i\) are littered, \(L_{it}\) will be set to 66\%. Suppose \(N_{it-1}=10\), \(TN_i=50\%\) and \(R=0.1\). As \(TN_i<L_{it}\), agent \(i\) will regard the environment as littered and update his normative goal weight to \(N_{it}=N_{it}-N_{it-1}\ast R=9\). Mind that \(TN_i\) may differ per agent, thus allowing for modelling a population that is heterogeneous concerning their tolerance for litter. In the field experiments in some conditions a sign is present reminding people of a norm. The Goal Framing Theory states that this sign does not need to address the specific behaviour in question. Hence as found in their experiments, a sign prohibiting graffiti has an effect on littering behaviour. In the model we capture this by changing the magnitude of reinforcement as a function of the presence and distance of a sign and cleaner:
- \(R_{it}=1\ast \text{sign-effect}\) -- if any sign is in range of agent \(i\) at time \(t\).
The formalizations as described here allow for an agent entering a littered environment coming from a clean environment to gradually inhibit its normative goal. It thus takes some time before the agent will litter. This contributes to the face-validity of the formalization, as it is unrealistic that a real person would immediately start to litter when entering a littered environment. In the presence of a sign, an agent will engage faster in littering behaviour. In contrast, a littering agent entering a clean area will more quickly become a non-litterer in the presence of a sign.
The model has been programmed in Netlogo (Wilenski 1999), and has been made available at the model archive of openabm.org.
Model parameterization by replication of an empirical study
In this section, we will discuss the replication of one of the field experiments presented in Keizer, Lindenberg and Steg (2011). The challenge here is finding parameter settings for the simulation model that are capable of replicating the empirical results of their field experiments. This validation of the model is an important step before using the model for additional simulation experiments for which no empirical data are available yet. The experiment of Keizer, Lindenberg and Steg (2011) aims at assessing the influence of signs of norm disrespect on individuals’ behaviour. According to goal-framing theory, we expect that (i) norm disrespect inhibits norm conforming of other individuals (ii) the presence of a sign makes the norm salient, enhancing respect or disrespect of the norm.
The experiment took place in an alley where people are used to park bicycles. During their absence, a flyer was attached to the handle of the bicycles. When subjects came to pick their bikes up, their behaviour was recorded. In the absence of trash bins in the alley, subjects had only two choices, throwing the flyer in the street or keeping it. The former behaviour counted as disrespect of the anti-littering norm.
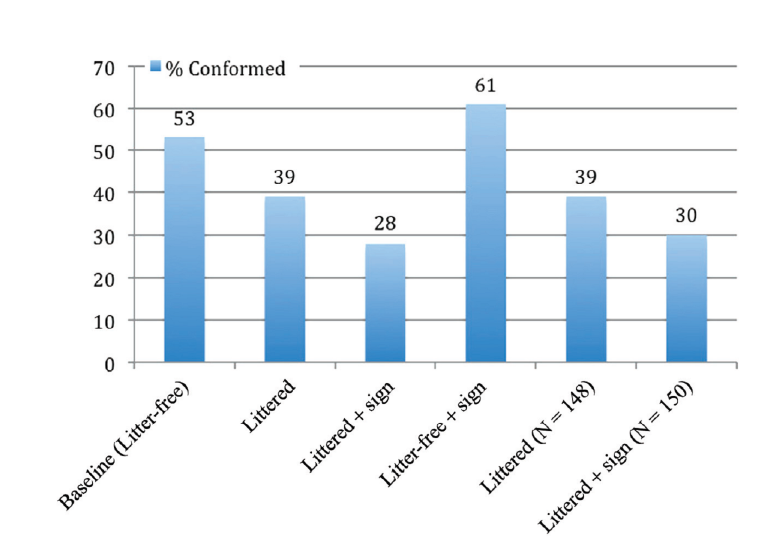
In the field experiment, two settings were varied, namely the amount of litter in the alley (clean versus dirty) and the presence/absence of a "no littering" sign, thus resulting in 4 experimental conditions (clean – sign, clean – no sign, dirty – sign, dirty - no sign). When the alley was clean, 53% of subjects conformed to the norm and did not throw the flyer in the street. As expected, less people conformed to the norm when the alley was filled with litter (39%), and even less when the alley was filled with litter and the norm was made salient by a sign (30%). On the other hand, more people respected the norm when the alley was free of litter and the norm was made salient by a sign (61%). Figure 1, taken from Keizer, Lindenberg and Steg (2011), summarises the results of the experiment.
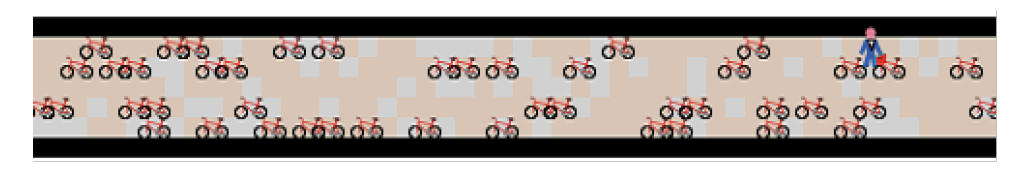
In our simulation, agents walk one at the time through a 5 step wide alley, which represents the width of the real alley. Once they have reached one of the bikes, they collect one unit of litter and head to one end of the street. During each step, they have to decide to keep the litter or throw it in the street. Flyers thrown in the street are invisible to other agents and do not influence their behaviour (during the field experiment flyers were picked up to preserve the chosen level of litter in the alley).
The clean alley has been modelled as an alley free of litter. For the second experimental setting, we have randomly scattered a definite amount of litter in the street, the exact quantity being a parameter of the simulation. Finally, in the third and fourth cases we have added a sign visible throughout the alley. Figure 2 shows the simulation during the replication of the littered experimental setting.
In order to replicate the field experiment results we had to parameterise different variables. The following are the variables involved in the replication of the field experiment and their intuitive effects on the outcome of the simulation.
- Average hedonic goal weight. The higher this value, the more agents would be likely to ignore the norm, i.e. to throw the flyer in the street.
- Average normative goal weight. The higher this value, the more agents would be likely to conform to the norm, i.e. to keep the flyer. For example, take the two extreme cases. If every agent weights the hedonic goal 100 and the normative goal 0, no one is going to conform to the norm. On the other hand, if every agent weights the normative goal 100 and the hedonic goal 0, no one is going to disrespect the norm. As in the baseline setting (i.e. when the alley is clean) roughly half of the agents conforms to the norm, we expect that the goal weights need to be similar.
- Standard deviation on the average goal weights. The higher the standard deviation, the more the population of agents will be heterogeneous. A population of homogeneous agents is going to be more sensitive to the environmental settings. For example, imagine a homogeneous population, in which every agent weights the normative goal slightly more than the hedonic one. When the alley is clean, no flyer would be thrown in the street. However, if the alley is littered enough to produce even a small decrease in the normative goal weight, all agents are going to weight the hedonic goal more. Hence, every agent is now going to behave according to its hedonic goal and start littering. On the other hand, a very heterogeneous population is going to be less sensitive to the environmental settings. For example, imagine a population in which half of the agents weight the hedonic goal much more than the normative one, while the other half weights the normative goal much more than the hedonic one. Only half of the agents are going to conform to the norm, unless the influence of the environment is strong enough to make the normative goal prominent even in the agents who initially weight it very little. As the field experiment data show only mild transitions from conformity to norm disrespect, we expect that the standard deviation needs to be reasonably high.
- Average reinforcement magnitude and standard deviation. Intuitively, if this parameter is high the environmental settings are going to have a large influence on agents’ behaviour, as their goal weights are going to change fast. On the other hand, if the reinforcement is null no change will occur in the goal weights, and agents will behave the same, regardless of the amount of litter present in the alley.
- Average tolerance threshold and standard deviation. The higher the threshold, the more litter in the street agents are going to tolerate and consider the street clean. On the other hand, if the threshold were close to zero, even a small amount of litter would be sufficient to reinforce negatively the normative goal weight.
- Walking mood. People may walk very straight towards a destination, but also may wander around in a street, e.g., to go window-shopping. This is captured by the variable walking mood, which expresses the degree of randomness in their walking. The more agents wander around the alley, the more they would be likely to drop the flyer in the street. For example, imagine that agents never get out of a dirty alley. The amount of litter would constantly reinforce negatively the normative goal weight and soon or later every agent is going to throw his flyer in the street.
- Proportion of litter in the dirty alley setting. The more litter in the street, the more the normative goal is going to be inhibited. This parameter clearly influences only the replication of the two littered experimental conditions. For example, if the proportion of litter is set to 100, the normative goal will lose weight at each agents step. On the other hand, if the proportion of litter is only slightly higher the tolerance threshold, agents normative goal would lose weight only slightly more often than it would gain. Notice that to approximate even qualitatively the field experiment results it is necessary that this parameter is set higher than the tolerance threshold.
- Sign effect. The more the sign is effective, the more is going to enhance the reinforcement process, making more agents conform to the norm when the street is clean and more agents disrespect the norm when the street is littered.
Almost every possible setting of such parameters would produce a qualitative replication of the field experiments, e.g. more people conforming to the norm when the alley is clean. However, we have been looking for settings which (i) produce quantitatively good replications of the field experiments (ii) are intuitively plausible. For example, imagine a setting in which the proportion of litter when the alley is dirty is close to zero. This setting would clearly fail to qualify as intuitively plausible and would be rejected, regardless of the fact that it might be capable of producing accurate replications.
Parameterizing of this model is indeed a difficult issue because the empirical distributions are not known. A full exploration of the parameter space seems impossible to do. Instead, we took 10 000 random parameter sets and for each of these sets the replication experiment was ran 10 times. Next, the 100 parameter sets that replicated the empirical data the best were selected and ran for 1000 times to get accurate averages. Results showed two parameter settings with a small difference with the empirical data, thus closely replicating the empirical study. However, this is no definitive proof that there are not even better parameter settings. The parametrisation exploration showed that a number of alternative settings could be found that, although being not as close as the best replications we present here, still were replicating well. Considering that a full parameter sweep would require billions of experiments, the expectation that a replication of the field experiment would result in (small) deviations of values against which to test, and the observation that the current parameter settings are capable of replicating the empirical results quite accurately, we decided to focus on the two best parameter settings. While these both replicate with sufficient accuracy the field experiment data, they are not equally convenient for the extension of the simulation and the further experiments. In fact, the second setting is preferable because the standard deviation over the average goal weights is reasonably high, allowing the simulation not to be too sensitive to small changes in the parameter values. Table 2 shows the details of the two settings. Figure 3 shows the average results of 1000 simulations.
| Parameter | First setting | Second setting |
| average hedonic goal weight | 51 | 50 |
| average normative goal weight | 49 | 50 |
| standard deviation (goal weights) | 10 | 25 |
| average reinforcement magnitude | 10 | 15 |
| standard deviation (reinforcement) | 5 | 5 |
| average tolerance threshold | 50 | 30 |
| standard deviation (threshold) | 10 | 5 |
| walking mood | 0 | 30 |
| proportion of litter (experiments 2 and 3) | 63 | 70 |
| sign effect | 2.2 | 2.5 |
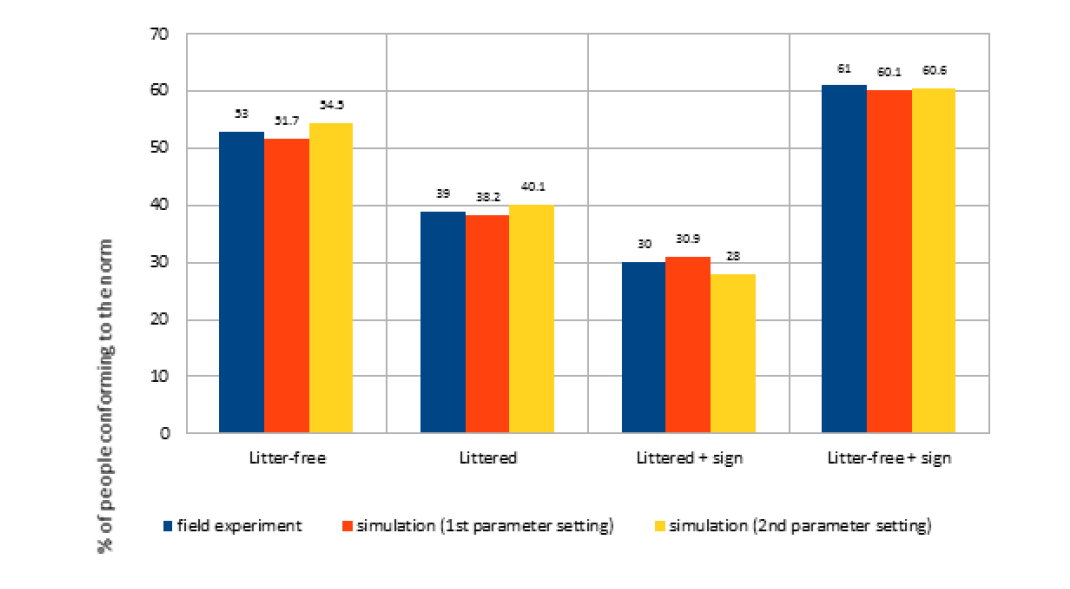
Hence, for further experimentation we will use the settings as used in the second parameter setting (Table 2).
Experimentation
The validated model allows for simulating how littering increases on a street as a function of norm inhibition, and exploring what cleaning strategies are effective and efficient. Because an increase in littering will cause the norm to collapse, we expect a non-linear growth function in the degree of littering. If such a transition in littering is happening, cleaning strategies are expected to be more effective if they succeed in keeping the levels of litter below this transition moment. To study this in our simulation model we use a stylised street, which is wider than the alley situation in the replication experiment. We can add trash bins and street cleaners in this street. Ideally we would have a more realistic map to study the dynamics of littering, because walking for a longer time in a clean or dirty street will have an impact on the (de)activation of motives. To capture this in our stylised street, we decided to let the agents stay on the street for the full length of the simulation. Instead of entering continuously new agents in the street with default settings, in the experiments when an agent leaves the street on the left side, it enters again on the right side (and the other way around). The street thus can be considered to be circular. This allows for studying the effects of the environmental conditions on the (de)activation of motives over a longer period.
Transition in the littering process
We widened the street to 19 steps and populated it with 100 pedestrians, who walk freely from one side of the street to the other. At each step of the simulation, every pedestrian has a chance of 2.5% of producing one unit of litter. As before, agents can decide to keep the litter or throw it in the street. The simulation starts with a clean street and litter slowly builds up. If the environment did not influence agents’ behaviour, litter would grow linearly. However, given the reinforcement mechanism, we expect the opposite to happen. At the beginning, the clean street reinforces the normative goal weight and the amount of litter thrown on the street grows slowly. This is because there always will be a few agents that litter because of their low normative goal weight. When the amount of litter reaches a critical value close to the mean tolerance threshold, a tipping point is reached causing a transition in littering as some agents' normative goal weight is suddenly weakened. More agents start to throw the litter in the street, weakening even further the normative goal weight of everybody else. The stronger the reinforcement, the more salient the transition will be. The following graph shows how the litter builds up when (i) the reinforcement is null (ii) the reinforcement is 15 - the magnitude found replicating the field experiment (iii) the reinforcement is 15 and a sign is added.
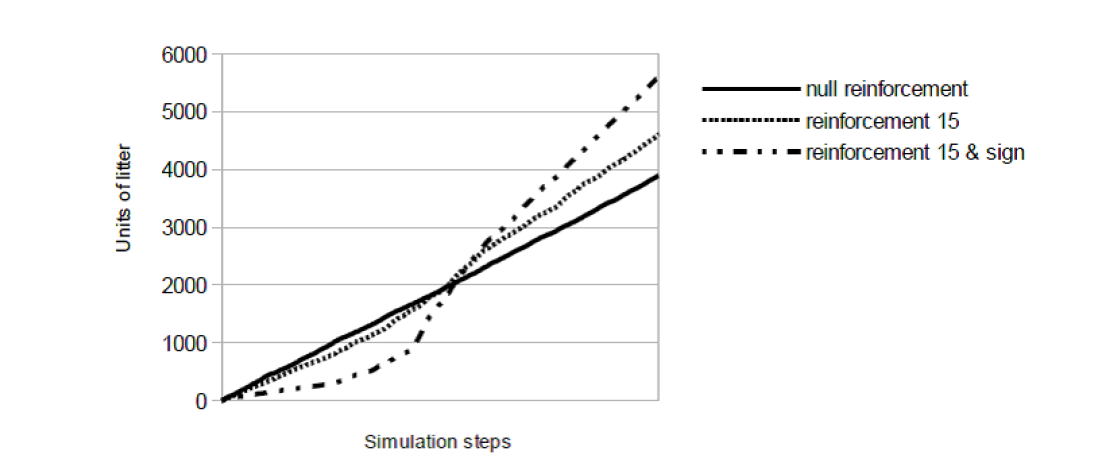
This experiment shows that the reinforcement of the norm indeed works two ways; keeping the street cleaner when the street is relatively clean, but making the street dirtier when a critical amount of dirt is present. Reaching this tipping point in the anti-littering norm leads to a transition from a clean to a dirty street, and is more prominent if the anti-littering sign amplifies the reinforcement of the norm.
The effect of trash bins
In the next experiment, we added trash bins. Trash bins are represented as green boxes. When an agent is holding a unit of litter and there is at least one trash bin in the street, it now has the choice to throw it in the bin. Throwing litter in a bin is compatible with both the normative goal - the litter is not thrown in the street – and with the hedonic goal – the agent gets rids of it. However, in order to use a bin, agents have to walk to it, deviating from their path and holding the litter for that time. Hence, a closer bin will be more attractive than a distant one. The following Table 3 represents an agent's payoff for each possible action. The agent will choose to perform the action that scores highest.
| Keep | Throw on the street | Throw in a bin | |
| Hedonic Goal | 0 | Hedonic goal weight* (1 - B) | Hedonic goal weight* B |
| Normative Goal | Normative goal weight* (1 - B) | 0 | Normative goal weight* B |
| Total payoff | Normative goal weight* (1 - B) | Hedonic goal weight* (1 - B) | (Hedonic + Normative goal weight)* B |
An important assumption here is the attractiveness of throwing in the bin in relation to the distance to the bin. Because no empirical data are available to parameterise this function, we decided to use the following simple function where:
| $$ B=max\Big(0,\, 0.5-\frac{\text{distance to the closest bin}}{100}\Big)$$ | (1) |
For example, suppose agent \(X\) holds one unit of litter, his hedonic and normative goal weights are respectively 50 and 25 and is 10 steps away from the closest bin, having then B = 0.5 – 10 / 100 = 0.4. Its payoff matrix would look as follows (Table 4):
| Keep | Throw in the street | Throw in a bin | |
| Hedonic Goal | 0 | 50* (1 – 0.4) = 30 | 50* 0.4 = 20 |
| Normative Goal | 25* (1 – 0.4) = 15 | 0 | 25* 0.4 = 10 |
| Total payoff | 15 | 30 | (50 + 25)* 0.4 = 30 |
Hence, agent \(X\) is indifferent between throwing the litter on the street and throwing it into a bin and will randomly choose one of the two actions.
Trash bins have a maximum capacity of 100 units of litter. When a bin is full, it turns red and does not accept any additional litter until it is empty again. Agents know if a bin is full only when they are next to it. If an agent walks to a bin to throw away litter and finds it full, it will reconsider what to do, ignoring the presence of the full bin.
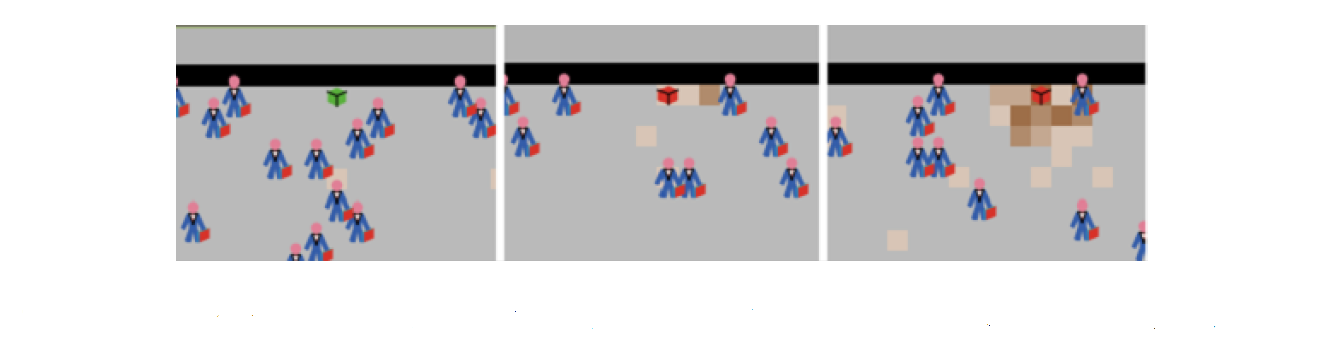
Assuming bins are placed regularly on the street, one emergent pattern from this simple mechanism is the piling of litter next to bins, once they turn full. In fact, when an agent heads to a bin and finds it full, he is going to be more likely to choose to trash the litter in the immediate surroundings, because the effort to reach the next closest bin is at the maximum level. As the litter around a full bin starts to grow, the normative goal weight of nearby agents will decrease, making them even more likely to litter on the street in the vicinity of the bin. Whereas the litter in the absence of bins tends to spread randomly, in the bin condition we see a clear clustering of litter. This difference can be quantified by the Gini coefficient, which is around .7 for the bin condition, and around .2 for the no bin conditions, thus clearly indicating the strong clustering of the littering in the bin condition.
The more litter is clustered, the less it will affect the normative goal weight of agents. Most agents will not (often) see the litter due to the clustering. However, if the same amount of litter would be spread randomly, all agents would observe it and be affected. This implies that with the same amount of units of litter, the street can be perceived as mess (if not clustered) or as almost clean (if well clustered).
Clustering of litter around a full trash bin is an emergent phenomenon that can often be seen in reality. Figure 6 for example shows litter around a waste-bin in a park on a sunny day when the cleaning regime had not been adjusted to the large number of visitors that day.

The experiments shows that the more clustered litter is, the less it will stimulate littering by norm inhibition in other people, and on top of that it will be easier to clean. Hence, even when bins are full and litter is piled around them it still contributes to keeping the environment relatively clean.
The effect of cleaners – exploring different cleaning regimes and strategies
In the next experiments, we added cleaners, having the ability to pick up litter from the street and to empty full bins. If a cleaner happens to be on a littered patch, it will pick up one unit of litter per step. Cleaners walk heading to the patch in sight range holding the maximum amount of litter. When a cleaner is next to a full bin, it will empty it. Given a clean street, we might ask how many cleaners are needed to prevent the transition and keep the level of litter under control. Given the parameter setting that replicates the field experiment, 4 cleaners that walk around randomly and continuously are sufficient to keep the street clean and prevent the transition to occur.
Obviously, cleaners can work in different ways, and to test their performance we decided to start with an initial condition of a dirty street. This gives a better insight in what strategy is the best in making and keeping the street clean. To find an optimal cleaning way we have modelled 3 different cleaning strategies – how cleaners coordinate with each other, and 3 different cleaning regimes – when and how many cleaners are put to work – which sums up to a total of 9 different cleaning conditions.
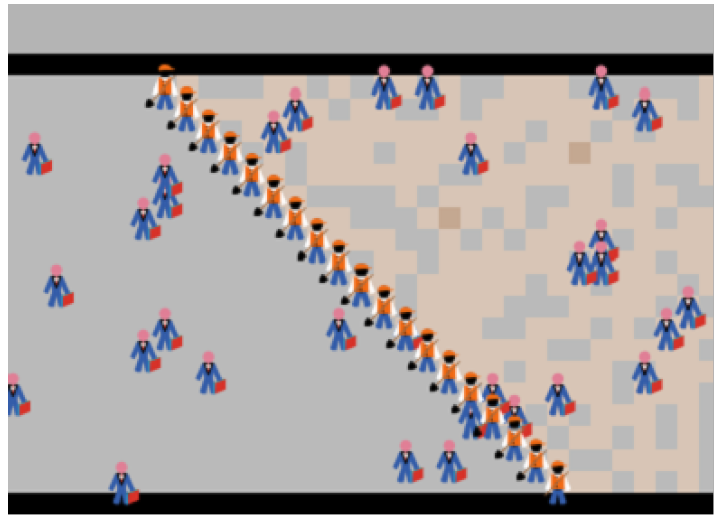
The three cleaning strategies are respectively: independent (cleaners do not coordinate), regional (each cleaner is responsible for a fraction of the street), sweep (cleaners move in a block, sweeping the street from left to right, see Figure 7). The independent cleaning strategy is a base-rate condition that will not be implemented in empirical situations. The regional strategy reflects the allocation of areas to certain cleaners (or teams of cleaners in most instances), and the sweep is a massive cleaning action that occasionally is organised in combination with inhabitants or volunteers to drastically clean a street, park or natural reserve.
The three cleaning regimes are respectively: constant (fixing the number of cleaners at 5, which is the minimum number required to get the street clean), alternate (half of the time there are 10 cleaners, half of the time there is none), and dynamic (the number of cleaners is adjusted according to the amount of litter in the street). The constant is basically a base-rate condition, as in no empirical situation cleaners are working 24/8. The alternate schedule is more realistically capturing the regular cleaning schedule that is performed on a routine basis. The dynamic regime is more adaptive in the sense that it responds to the amount of litter. In empirical situations, this regime reflects the adaptation to e.g. crowded days in parks.
Suppose that hiring a cleaner cost about $0.01 per second, and each time-step in the simulation is about a second. Further, suppose you have a budget of $500 to clean a street. What would be an efficient regime? For example, we could hire one cleaner for 13.89 hours, or 50.000 cleaners for one second. Whereas the latter option is clearly far from realistic, many different realistic combinations are possible.
Given the previous discussion, we expect the dynamic regime – in which more cleaners are hired when the street is dirtier - to be more efficient than the constant one. If the former regime is applied, many cleaners will be hired at the beginning. Once the street has been quickly cleaned, fewer cleaners will be needed to keep the level of litter under control, because pedestrians are less likely to throw the litter in the street. Because littering agents will always be present, a perfectly clean street is an unrealistic goal. Hence, we define a clean street as the situation where the mean-e-norm of the agents is < 30 (which is the mean threshold).
All experimental runs start with a dirty street. The number of initially littered patches (70%) is derived from the dirty condition of the replication experiment, and the clustering of the litter is also derived from this simulation. If the street were not dirty at the start, the experiment would be trivial for the dynamic regime (the number of cleaners would settle between 4 and 5).
As dependent variables we measure the time for which the cleaning budget of €500 lasts, the total litter at the street after the budget has been finished, the total litter being picked up by the cleaners, the time to clean indicating how fast a clean level has been reached, the dollars-to-clean expresses the number of cleaning hours required to reach a clean condition (mean-e-norm of the agents is < 30).
The effect of independent cleaners
In the following Figure 8, results are presented for the independent strategy (base-rate condition), comparing the performance of respectively the constant, alternating and dynamic regime.
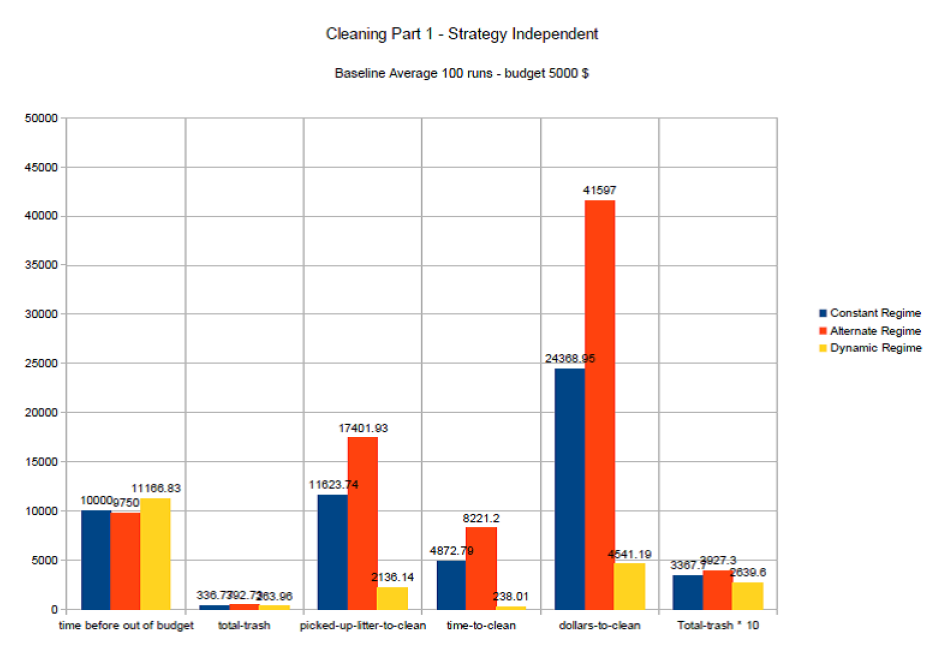
The experiment shows that the budget last the longest with a dynamic regime. Here, the litter is removed fast, and the resulting cleaner environment will stimulate the activation of the norm, which keeps littering at a lower level. Indeed, the total litter is lower in the dynamic regime. For the alternating regime, the opposite holds, as when the cleaners are on pause, the littering increases, causing the norm to collapse, causing a serious increase in littering. Therefore, when the cleaners start working again they are confronted with a lot of litter, which can be seen in the total-litter and the amount of picked-up-litter-to-clean.
Whereas it is possible to conduct statistical analysis on these, and later results of our simulation experiments, we decided not to run statistical tests (ANOVA) because of two reasons. First, testing for significant effects using simulation models is less meaningful because of the lack of unexplained variance (deterministic model) in the model. Therefore, significant effect can be obtained easily by running more experiments. A second reason to conduct statistical analysis is to get meaningful summaries of complicated datasets. Considering our relative simple experimental set-up our results are accessible for interpretation without additional statistics.
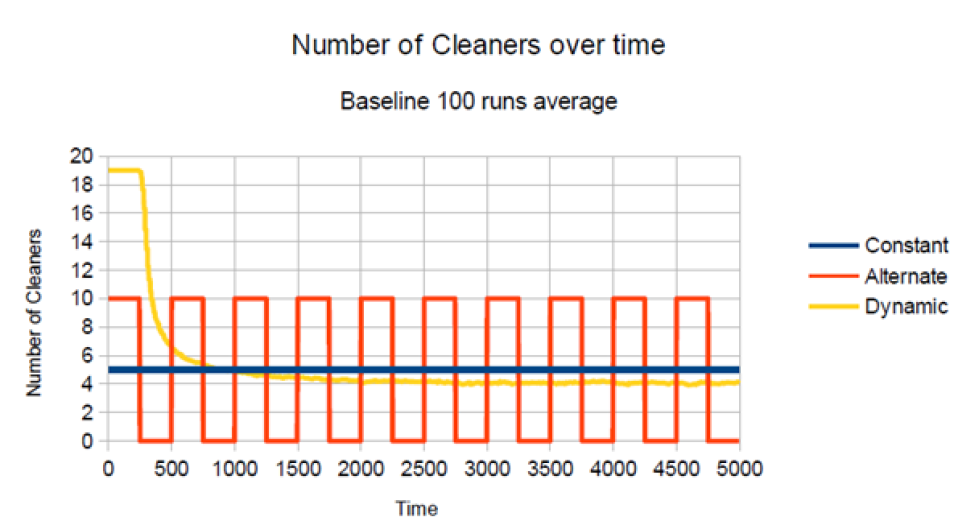
Looking at the number of cleaners (Figure 9), we see that the number of cleaners in the dynamic regime starts at 19, but at t = 750 it crosses the fixed line of 5 cleaners, and afterwards 4 cleaners are required to keep the street clean.
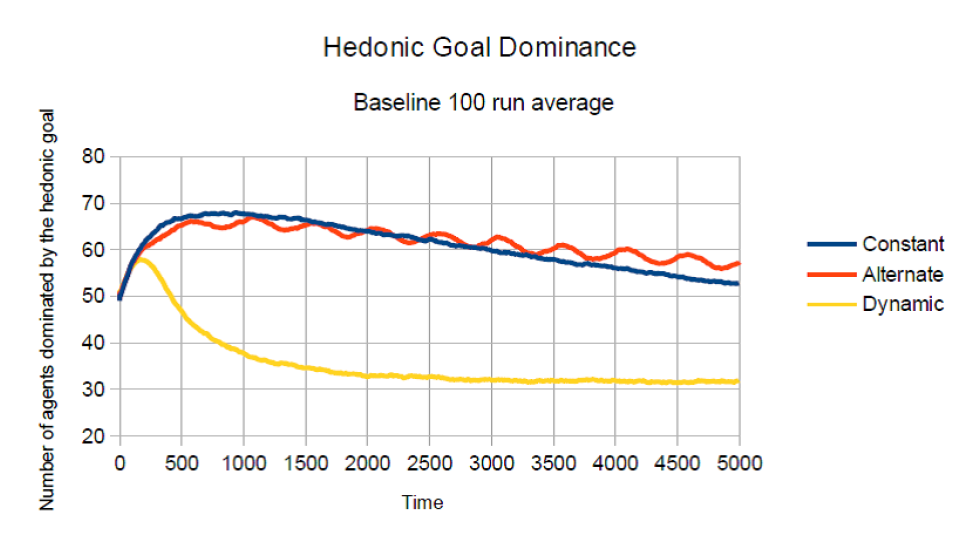
The following Figure 10 shows that the dynamic regime is the most effective in keeping the hedonic goal on a low level, thus reducing the agents’ motive to litter.
The effect of regional cleaners
In the following Figure 11, results are presented for the regional strategy, where the cleaners have their own region in the street, comparing the performance of respectively the constant, alternating and dynamic regime.
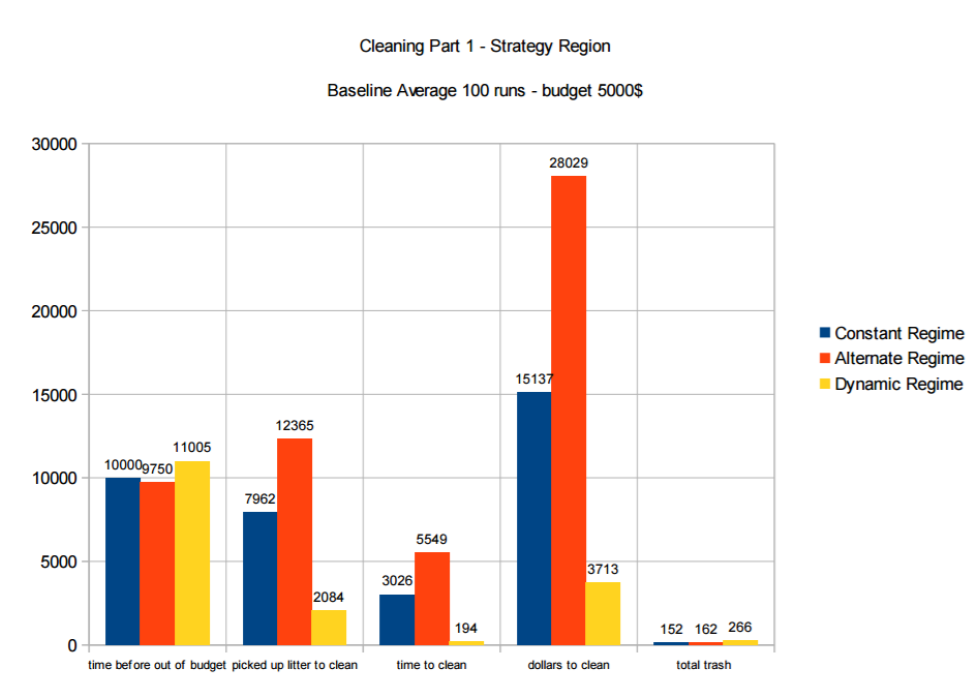
We observe that again the dynamic strategy is lasting the longest with the budget, however we also observe that the total-litter is the highest compared to the constant and alternating regimes.
The effect of a sweep strategy
In the following Figure 12, results are presented for the condition where the cleaners sweep the street, again comparing the performance of respectively the constant, alternating and dynamic regime.
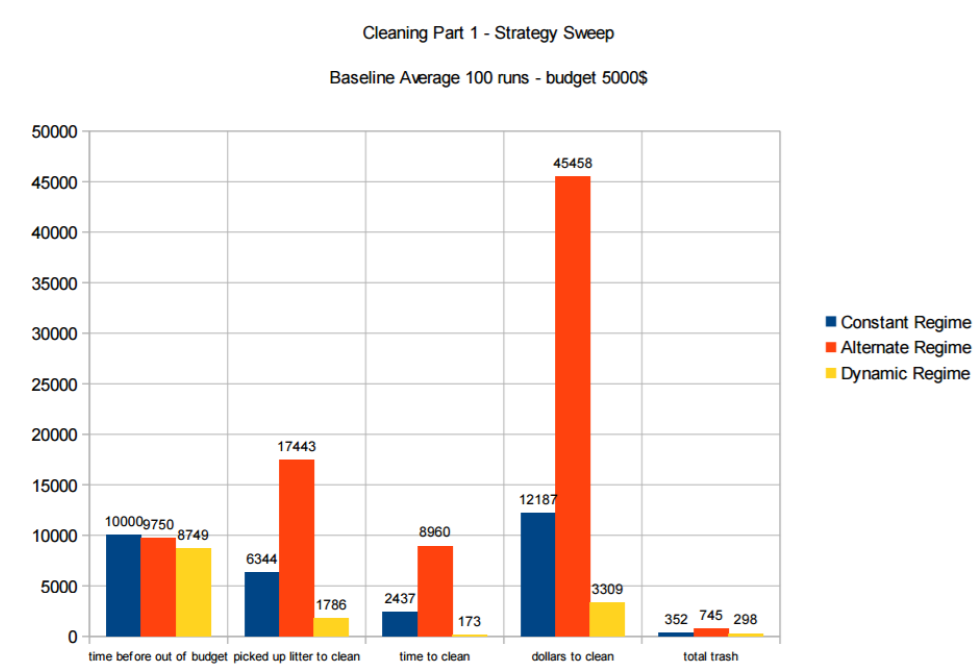
It can be observed that the dynamic strategy now is the first one running out of budget. Yet this strategy clearly remains superior when looking at the performance in keeping the street clean.
Comparing the strategies and regimes
The most striking difference in performance can be seen between the dynamic regime and the constant and alternating regimes. The dynamic regime outperforms the other regimes in all three strategies, and the dynamic regime with independent strategy is the most effective way to clean the street because the budget last longest and the street is cleaned the fastest. This indicates that being adaptive to the amount of litter is crucial in effective cleaning.
Next we see that the regional cleaning strategy, where cleaners are allocated to their own area of the street, performs in all three regimes better or almost equal as the independent and sweep strategies. Interesting is that in most cases the region strategy performs best, but that in the dynamic regime the independent cleaning strategy performs best.
Looking in more detail at the differences, it can be observed that the time before out of budget is stable for the constant and alternating regimes, which is logical due to the fixed number of cleaners. However, for the dynamic regime we observe that if the cleaners work independent, the budget lasts longer. If however the dynamic regime is implemented in a sweep strategy, a very large number of cleaners are initially used to sweep the street, which ultimately causes a somewhat faster depletion of the budget.
Looking at the time required to clean the street, this last strategy of dynamic sweeping is the fastest way of cleaning the street. We observe that the performance of regimes is coupled with the strategy that is implemented. In case of the constant regime, the independent strategy takes the most time, and the sweep is the fastest, whereas for the alternating regime the sweep takes the most time, and the regional strategy is the fastest.
If we look at the dollars needed to clean the street, we also observe here that the performance of regimes is coupled with the strategy that is implemented. For both the constant and dynamic regimes the independent strategy is the most expensive and the sweep the cheapest. For the alternating regime the sweep is the most expensive, and the regional strategy the cheapest.
Finally, for a constant regime we observe that sweeping is better than independent cleaning, whereas for the alternating regime the opposite holds.
Combining cleaners with bins
Because bins cause that more waste is being deposited in the bins, or when the bins are filled, cause that waste is concentrated around the bin rather than being scattered, it can be expected that more bins make cleaning easier. To test this we ran the model with a dynamic cleaning regime, which allowed us to keep track of how many agents were required to keep the street clean for a different number of cleaners (Figure 13).
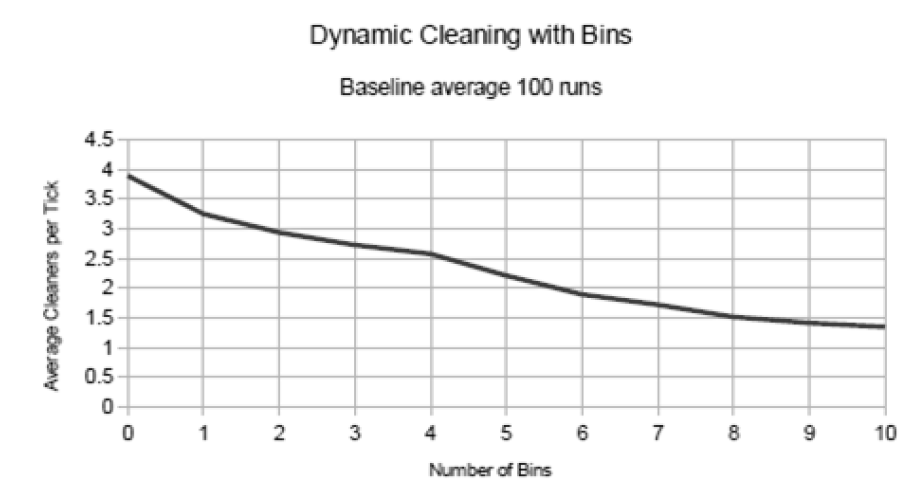
Results confirm our expectation, showing fewer cleaners are needed if more bins are installed. However, this effect logically decreased when more bins are added. Whereas this effect is relevant, in the current model it is very stylised and the results do not provide practical guidelines for the optimal number of bins to place.
Conclusions and discussion
This paper demonstrates how the Goal Framing Theory can be implemented in an agent based model, and how the parameterization can be done using empirical experimental data. The parameterization of the model proved to be a complicated matter. Whereas it was possible to find model parameters that were capable of replicating the empirical data very well, the parameterization also revealed that different parameter settings were also pretty close to the empirical data. Realizing that replications of the field experiment would probably have resulted in slightly different empirical values, the fundamental question arises how valid parameterisations are when limited datasets from in principle social complex phenomena are available. Assuming that our parameterisation exercise resulted in a valid model, we can run a large number of experiments exploring the impacts of different policies simultaneously in a stylised manner. This contributes to the identification of possible effective combinations of policies, which subsequently can be tested in field experiments. In particular, testing the effect of different cleaning regimes would require similar field settings, which is very difficult to control for. Moreover, changing a cleaning regime is quite costly, and not knowing beforehand what the most likely effects are makes experimentation a risky business. If in an experiment the cleaning fails, the non-littering norm will be weakened and it may take a lot of effort to reverse the situation.
The simulations thus offer a quick and safe tool to explore the efficacy of different cleaning strategies, and select settings to explore in more detail using field experiments. The simulation experiments however do not provide exact predictions of the effects of cleaning strategies in reality. One has to realise well that (1) in reality many small (and unknown) factors may have a significant impact on littering behaviour, and (2) that the effects as obtained with the simulation model, despite their empirical based parameterization, partly depend on crude assumptions on e.g. reinforcement and perception. Simulation experiments thus raise empirical questions concerning the causal mechanisms operating in a theory. The results are thus more indicative concerning the type of behavioural dynamics causing certain effects, and possible effective strategies to manage these dynamics. Hence, simulation experiments may reveal interesting strategies, and thus provide interesting venues for field experimentation. Specifically, the finding that in most cases the region strategy performs best, except for in the dynamic regime where the independent cleaning strategy performs best is interesting to explore further. This is relevant because choosing a particular cleaning strategy is important for the planning of cleaning operations. If large field experiments are difficult to study such questions, e.g. because it requires a very flexible effort of cleaning companies, it might be better to first improve the realism of the simulated cleaning environment. This would be possible by implementing the model on a virtual map of a city (augmented reality), including empirical data on litter production on different areas (e.g. related to litter generating sources such as fast-food restaurants, special events), and explore in collaboration with stakeholders the performance of different cleaning strategies. Such agent based gaming context may prove to be very useful in exploring possibilities for managing social-environmental dynamics (e.g., Jager & Van der Vegt 2015).
The current stylised experiments demonstrate that an adaptive/dynamical cleaning regime is often more effective than constant or alternating regimes. Preventing a tipping point (Nyborg et al. 2016) in the anti-littering norm requires a close monitoring and cleaning of the environment. On the other hand, in case an area is already littered, it is faster and cheaper to employ a large number of cleaners just for the time sufficient to bring the amount of litter under the critical value. The number of cleaners can then be adjusted to the minimum required to prevent the level of litter to reach again a tipping point in the norm. A practical question is how dynamic such a strategy should be. Obviously being too responsive will require a lot of monitoring and flexible cleaners, which will come at a cost. Practical experimentation will be required to find an optimal adaptation level for different situations.
The experiments also indicate that allocating cleaners to a certain region is more effective. Clearly, this avoids a clustering of cleaners at a certain place, which would allow for the littering to grow in other unattended areas. The question for practice is obviously how large these regions should be. A related question is if it is more effective to allocate (small) teams to larger regions, or individual cleaners to smaller regions. Before experimenting in the field, it is recommended to conduct simulation experiments in a more realistic spatial setting with a number of cleaners that is available for this particular area. Simulating for example a shopping area with cleaners would be a good start for this.
Another interesting effect demonstrated in the simulation experiments is the beneficial effects of bins, even when they are not emptied. Because bins contribute to the clustering of litter, e.g. think of filled bins surrounded by litter, the rest of the area remains cleaner, and so the norm is less inhibited resulting in less littering. Whereas one is likely to consider an overflowing bin as a negative event, the awareness of the positive effect of this only becomes clear after understanding the behavioural dynamics in this system.
Whereas the current model shows some stylised effects in a simple artificial environment, a challenge is to implement more realistic environments in the model, and implement existing cleaning regimes. This would require a more realistic environment, such as an area map or a virtual environment, and data on pedestrian flows related to time of the day, day of the week, different types of litter (e.g. cigarette butts, chewing gum, fast-food packaging) special events (festivals) and perhaps even weather conditions. Even punishing regimes for littering could be considered, as for example littering in some places is not being punished, whereas in Singapore the fines for littering range from $2.000 for a first conviction to $10,000 for third and subsequent convictions. If the model can be parameterised as to represent the littering and cleaning patterns in practice, the model is suitable to experiment with cleaning regimes in specific situations, e.g. a shopping area in a city.
Of particular interest is experimenting with the visibility of cleaners. Whereas cleaning regimes have often been developed to interfere as little as possible with pedestrians – e.g. clean during quiet hours, it might actually be more effective to clean during rush hours. Sentse al al. (2010) demonstrated that the presence of significant others who respect situational norms strengthen the normative goal even more than ‘ordinary’ people do. Unlike the sign, which in littered conditions may emphasise that most people do not comply with the norm, this behavioural example of a cleaner will serve as a cue strengthening the norm also in littered environments. Whereas technically it is easier to clean when it is quiet, cleaning in a rush hour will have a much stronger effect on the weighting of the norm, and thus result in a litter preventing effect. The question is if cleaning during rush hours results in such a decrease of the littering that it outweighs the technical objections against cleaning during rush hours. Exploring possible cleaning strategies using a theoretically sound and empirically parameterised model is expected to contribute to the identification of more efficient strategies to keep our cities cleaner at lower costs.
Acknowledgements
We like to thank Kees Keizer, Siegwart Lindenberg and Linda Steg for discussing the precise formalization of the Goal Frame Theory. We also thank the anonymous reviewers who provided useful comments.References
CIALDINI, R. B., Reno, R. R., & Kallgren, C. A. (1990). A focus theory of normative conduct: Recycling the concept of norms to reduce littering in public places. Journal of Personality and Social Psychology, 58(6), 1015-1026. [doi:10.1037/0022-3514.58.6.1015]
CRUMP, S.L., Nunes, D.L., & Crossman, E.K., (1977), The Effects of Litter on Littering Behavior in a forest Environment, Environment and Behavior, 9(1): 137-146.
DWYER, W. O., Leeming, F. C., Cobern, M. K., Porter, B. E., & Jackson, J. M. (1993). Critical review of behavioral interventions to preserve the environment: Research since 1980. Environment and Behavior, 25, 275-321. [doi:10.1177/0013916593255001]
DUR, R., & Vollaard, B. (2012). The Power of a Bad Example – A Field Experiment in Household Garbage Disposal. Tinbergen Institute Discussion Paper – TI 2012-061/1
GELLER, E. S., Winett, R., & Everett, P. B. (1982). Preserving the environment: New strategies for behavior change. Elmsford, NY: Pergamon.
GELLER, E.S., Witmer, J.F., & Tuso, M.A., (1977), Environmental Interventions for Litter Control, Journal of Applied Psychology, 62(3): 344-351.
GILBERT N, Troitzsch, K.G., (2005). Simulation for the Social Scientist. Buckingham: Open University Press.
HUFFMAN, K. T., Grossnickle, W. F., Cope, J. G., & Huffman, K. P. (1995). Litter reduction: A review and integration of the literature. Environment and Behavior, 27, 153-183.
JAGER, W., & Van der Vegt, G. (2015). Management of complex systems: towards agent based gaming for policy. In: M. Janssen, M.A. Wimmer and A. Deljoo. Policy practice and digital science: Integrating complex systems, social simulation and public administration in policy research. Springer Science in the Public Administration and Information Technology series edited Christopher G. Reddick. [doi:10.1007/978-3-319-12784-2_13]
KALLGREN, C. A., Reno, R. R., & Cialdini, R. B. (2000). A focus theory of normative conduct: When norms do and do not affect behavior. Personality and Social Psychology Bulletin, 26, 1002-1012.
KEIZER, , K., Lindenberg, S. & Steg, L. (2008). The Spreading of Disorder. Science, 322 (5908). 1681-1685 [doi:10.1126/science.1161405]
KEIZER,K., Lindenberg, S. & Steg, L. (2011). The Reversal Effect of Prohibition Signs. Group Processes and Intergroup Relations ,14 (15), 681-688.
KRAUSS, R.M., Freedman, J.L., Whitcup M., (1978), Field and Laboratory Studies of Littering, Journal of Experimental Social Psychology, 14(1): 109-122. [doi:10.1016/0022-1031(78)90064-1]
LINDENBERG, S., & Steg, L. (2007). Normative, Gain and Hedonic Goal Frames Guiding Environmental Behavior. Journal of Social Issues, 63, (1). 117-137(21).
NYBORG, K., Anderies, J.M., Dannenberg, A., Lindahl, T., Schill, C., Schlüter, M., Adger, W.N., Arrow, K.J., Barrett, S., Carpenter, S., Chapin III, S.F., Crépin, A.S., Daily, G., Ehrlich, P., Folke, C., Jager, W., Kautsky, N., Levin, S.A., Madsen, O.J., Polasky, S., Scheffer, M., Walker, B., Weber, E.U., Wilen, J., Xepapadeas, A., De Zeeuw, A., (2016). Social norms as solutions: Policies may influence large-scale behavioral tipping. Science, Oct 7. [doi:10.1126/science.aaf8317]
RAMOS, J., & Torgler, B., (2010), Are Academics Messy? Testing the Broken Windows Theory with a Field Experiment in the Work Environment, FEEM Working Paper No. 104.
REITER, S.M., & Samuel, W., (1980), Littering as a Function of Prior Litter and the Presence or Absence of Prohibitive Signs, Journal of Applied Social Psychology, 10(1): 45-55. [doi:10.1111/j.1559-1816.1980.tb00692.x]
RENO, R. R., Cialdini, R. B., & Kallgren, C. A. (1993). The transsituational influence of social norms. Journal of Personality and Social Psychology, 64, 104-112.
SENTSE, M., Dijkstra, J.K., Lindenberg, S., Ormel, J., & Veenstra, R. (2010). The Delicate Balance between Parental Protection, Unsupervised Wandering, and Adolescents’ Autonomy and Its Relation with Antisocial Behavior. The TRAILS Study. International Journal Behavioural Development, 34, 159-167. [doi:10.1177/0165025409350949]
SIBLEY, C.G., & Liu, J.H. (2003). Differentiating active and passive littering: A two-stage process model of littering behavior in public spaces. Environment and Behavior, 35, 415–433.
WESLEY SCHULTZ, P. (2009). Litter Behavior in America. Results of a National Study. Report to Keep America Beautiful. Action Research 910 W. San Marcos Blvd., Ste. 108 San Marcos, CA 92078
WILENSKY, U. (1999). NetLogo. http://ccl.northwestern.edu/netlogo/. Center for Connected Learning and Computer-Based Modeling, Northwestern University, Evanston, IL.
WILSON, J.Q. & Kelling, G.L. (1982). Broken windows: The police and neighborhood safety. Atlantic Monthly, March 1982.