
Introduction
The deployment of smart metering systems in Europe is driven by EU legislation that views smart metering infrastructure as a tool to both enhance competition in retail markets and foster energy efficiency. Moreover, smart metering infrastructure is considered as key enabler to realising the full potential of renewable energy integration and provision of a secure energy supply.
The EU Directive on internal energy market 2009/72/EC establishes common rules for internal market in electricity and urges an access of consumption data and associated prices to the electricity consumers. The information on electricity costs should be provided frequently enough in order to create incentives for energy savings and behavioural change. Such information provision could also create innovative services to effectively enable active participation of consumers in the electricity supply market. Implementation of smart metering infrastructure is expected to facilitate this process. Directive (EU) 2009/72/EC along with the Recommendation 2012/148/EU calls upon 80% EU electricity consumers to be equipped with smart metering systems by 2020, providing the economic assessment of nation-wide smart metering roll-out is positive. Therefore, smart metering systems, by providing feedback to the households on their electricity consumption, play an important role in the achievement of energy savings. The effect of feedback on consumer's behaviour has been reported in many pilot projects (Covrig et al. 2014), indicating that the potential for smart metering systems per se to trigger consumer engagement and behavioural changes is rather limited: "Information on consumption will not work without a motivation to conserve, which may be provided by other instruments like financial incentives, goal setting or personal commitment" (Fischer 2007). Thus, smart metering systems are enabling technologies, which need to be coupled with innovative end-user services to achieve better energy management through the means of rewards, automation and information[1]. Moreover, technological diffusion is accompanied by technology concerns, in particular data privacy and security. Such concerns played an important role in some EU national smart metering roll-outs, such as the Netherlands, where the consumers were granted the possibility to refuse the smart meter or accept it under "administrative-off" option[2]. To this end, distribution system operators (DSOs) and energy suppliers will need to take effective measures in motivating and engaging the consumers in managing their electricity consumption by offering innovative services, while effectively tackling concerns that may hinder the deployment of such services.
Agent-based modelling is a widely applicable tool for capturing the behaviour of socio-technical systems that generate emergent phenomena in a bottom-up manner (van Dam et al. 2012; Chappin 2011; Epstein 1996). It has also been widely used to study the diffusion of new and green technologies and more recently to study the diffusion of smart metering technologies (Kowalaska-Pyzalska et al. 2014; Zhang and Nuttall 2011; Rixen and Weigand 2014). In particular, Zhang and Nuttall (2011) have developed an agent-based model of a market game involving two parties: residential electricity consumers and electricity suppliers. The aim is to evaluate the effectiveness of UK policy on promoting smart metering in the UK retail electricity market. They choose the Theory of Planned Behaviour-TPB (Ajzen 1991) to formalize the behaviour of residential electricity consumer agents. This theoretical choice is driven by the consideration that TPB emphasizes the role of psychological (attitudes), sociological (subjective norms) and environmental factors (perceived behavioural control) in the consumers' decision making process. However, a limitation of the proposed model is consumer's personality characterization. They suggest that consumer's intention to perform certain behaviour is essentially driven by consumer's personality trait "price sensitivity". However, the range of "beliefs" that jointly determine a person's intention to perform a behaviour is certainly broader. Building on the work of Zhang and Nuttall (2011), and broadening consumer characterization, in the present paper we develop an agent-based model of electricity consumers, interacting with the energy supplier through a series of electricity contracts, each characterized by a different type of service offered to the consumer. We are interested in exploring possible diffusion rates of smart metering enabled services under different policy interventions. The model can be used as a tool to gain insight into diffusion patterns of energy services (represented by a contract) and associated switching rate among contracts. Furthermore, related influencing factors are also observed in the transition to sustainable and cost-efficient energy consumption. The remainder of the paper is structured as follows: Section 2 describes the model, including agents 'properties and actions and characterisation of electricity contracts. Section 3 illustrates the policy intervention whose impact is observed under different experimental set-up, defined in Section 4. We conclude discussing the policy implications of our findings and future considerations.
Model description
Model overview
An agent-based model is developed in this paper that includes a number of household agents (i.e,. electricity consumers) and a portfolio of electricity contracts offered by the electricity supplier. An overview of the model is presented in Figure 1. The agents and their interactions with the electricity systems (through the contracts) represent a socio-technical system, where the social subsystem consists of a network of consumers, each of them having a contract with the electricity supplier. Each contract is characterized with a type of end-user service (defined in the contract and enabled by the smart meter) and time duration. Agents gain experience with a certain type of contract and have a memory retaining knowledge on that experience. They also communicate this experience to other agentsm, which may influence their decision on the type of contract to be adopted (Figure 1).
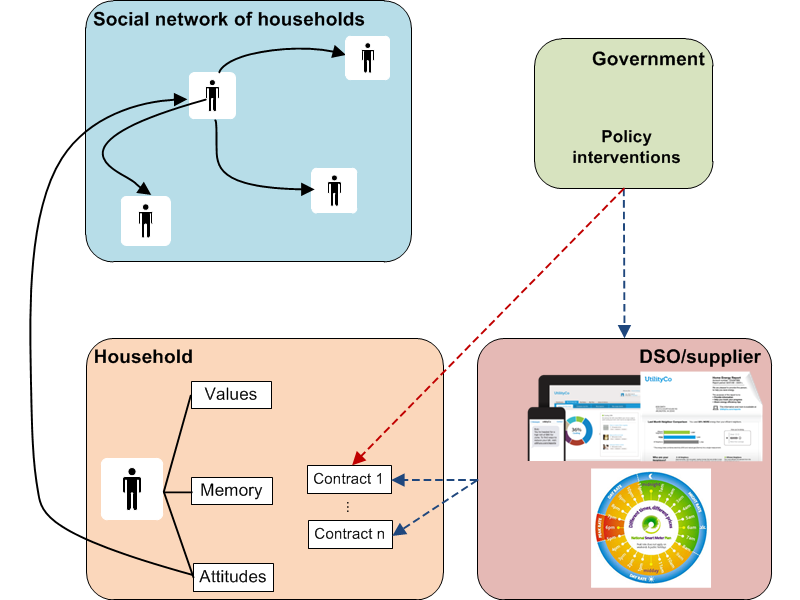
Agents' behaviour may be influenced by governmental policy (e.g., national roll-out of smart metering systems with opt-out option for the consumers), national/local authority initiatives (e.g., environmental campaign) or business case driven initiatives from the DSO/supplier. While policies and institutions are influenced and shaped by actors' behaviours (DSO, consumers, markets, etc.) and change over time, for the purpose of this model they are assumed to be exogenous and fixed.
The socio-technical system as a whole evolves based on the decisions of individual agents. These decisions influence the overall system level performance indicators defined as: - adoption of contract types, - energy savings, - CO2 emissions savings, - comfort change and - social welfare; which will be further detailed in section 2.2below. The model is simulated for a period of 10 years with time steps of one month and in each simulation run, the system behaviour is a combined result of the actions of all agents.
Characterization of agents
Agents have personal goals and preferences determined by their own personal values. According to the literature (Steg et al. 2014; Steg and Groot 2012), we can distinguish between self-transcendent values that refer primarily to collective consequences and self-enhancement values, which refer primarily to personal costs and benefits. Self-transcendent values include altruistic values that focus on societal well-being and biospheric values that focus on protecting the environment. Self-enhancement values include egoistic values, which focus on enhancing personal resources (e.g., wealth), and hedonic values, which focus on improving the way one feels (Steg et al. 2014; Steg and Groot 2012).
These self-enhancement and self-transcendent values characterise the agents' weight factors \(w_e\), \(w_h\), \(w_b\) and \(w_a\) and describe the agents' relevance (Menanteau and Lefebvre 2000) towards four criteria: financial savings, comfort change, CO2 savings and social welfare. The weights are randomly assigned to each agent, following a uniform distribution [0,1], as defined in Table 3 below. The highest weight factor determines the " archetype " each agent belongs to (e.g., agents belonging to egoistic archetype have highest weight factor for the egoistic criterion), which indicates that the agents are heterogeneous with respect to archetype. The weight factors are normalized such that the sum of the weights equals 1. At the same time, these four values represent the four criteria against which agents evaluate contracts. The four criteria are detailed in the Appendix.
Each time step, agents get experience with a certain contract and based on that experience they develop an attitude towards the contract they have. They also memorise the experience they have with all contracts that they have had earlier in time and communicate this memorised experience to other agents, thus influencing their decisions. When an agent is not satisfied with her current contract, she decides to opt for a new one. The satisfaction level is measured relative to the threshold-attitude, as an agent specific variable (for further details, see Appendix). In case the agent is satisfied with her contract, but the contract has ended, the agent considers the present contract in the portfolio of contracts to be evaluated in the next time step. The decision on what type of contract the agent opts for is based on the scores on individual criteria \(a_e,\) \(a_h,\) \(a_b\) and \(a_a\) weighed against weight factors \(w_e\) \(w_h\) \(w_b\) and \(w_a\) and modelled as multi-criteria problem, as consumers evaluate multiple electricity contracts against the given set of criteria.
Agents 'activities
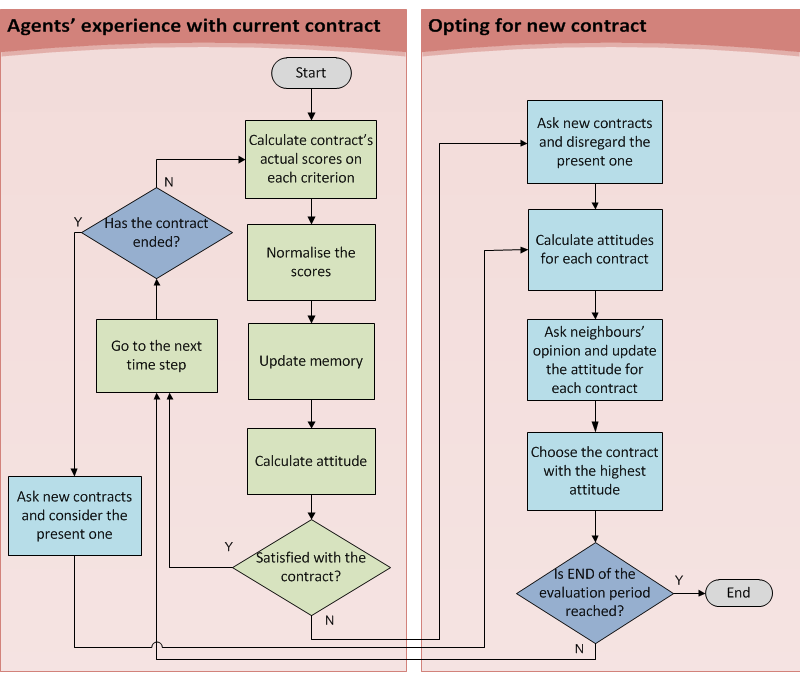
The main activity is that of the household agent, as summarized in Figure 2. Agents have a certain contract \(α_j\) with the electricity supplier. Each contract communicates range of values (\(a_cmin\), \(a_cmax\)) relative to the 4 criteria mentioned above, and expected to be achieved with that contract. The average of that range is the communicated score of contract \(α_j\) on criterion \(c\), i.e.:
| $$ a_{c,communicated}(\alpha_j)=\frac{a_{cmax}+a_{cmin}}{2}$$ | (1) |
We normalize the scores as in (2) to be able to combine them across criteria when evaluating single contract.
| $$a_{c,norm,communicated}(\alpha_j)=\frac{a_{c,maxmax}-a_{c,communicated}}{a_{c,maxmax}-a_{c,minmin}}$$ | (2) |
Updating memory
Positive consumers' experience would certainly pave the path towards diffusion of more advanced smart metering services, which addresses both the acceptance and effective use of the smart metering system. While EU currently progresses towards nation wide deployment of smart metering systems, the real impact of smart metering enabled services and consumers experience with smart metering systems is still uncertain and limited. However, some observations on potential impacts (energy/financial, CO2 savings, comfort change, etc.) of using smart metering systems (smart meter and feedback device) is already reported in the literature (see Appendix) and we therefore use a range of such impacts for deriving the experienced score. In this context, each time step agents gain experience with contract αj and the experienced score on each criterion \(c\) is derived as a random value from the communicated range, i.e.
| $$a_{c,experienced}=rand(a_{cmin},a_{cmax})$$ | (3) |
| $$a_{c,norm,experienced}(\alpha_j)=\frac{a_{cmaxmax}-a_{c,experienced}}{a_{c,maxmax}-a_{c,minmin}}$$ | (4) |
Consumers update existing values in their memory with the current experience they have by calculating the average of the past experienced and the new experienced score, as in Equation (5). At the initial time step and in case of no previous experience: \(a_c,memory (αj) = ac, norm,communicated (αj)\)
| $$a^{\star}_{c,memory}(\alpha_j)=\frac{1}{2}\ast a_{c,memory}(\alpha_j)+\frac{1}{2}\ast a_{c,norm,experienced}(\alpha_j)$$ | (5) |
Next, each agent calculates the attitudes towards contract \(α_j\) by multiplying the scores on criterion \(c\) with the criteria-specific weight factor \(w_c\) and summing the result, i.e.:
| $$A_{c,experienced(\alpha_j)}=w_c\ast a^{\star}_{c,memory}(\alpha_j)$$ | (6) |
The total attitude towards contract \(α_j\) is summation of all individual attitudes relative to each single criterion \(c\), where \(c\in {e,h,b,a}\):
| $$A(\alpha_j)=\sum_cA_{c,experienced}(\alpha_j)\text{.}$$ | (7) |
Choosing contract from portfolio of contracts offered by the supplier
Personal preferences
Agents may consider switching to different contract for one of the following reasons: 1) Being dissatisfied with the current one and 2) Expiration of current contract. In each of these cases, agents ask for new contracts from the supplier and perform evaluation of portfolio of contracts received. If the agent was satisfied with the current contract and the same has ended, she reconsiders it for evaluation, along with the new ones received.
The decision making process is modelled as multi-criteria problem and is presented in Figure 2. Technology concerns, in terms of data privacy and security, health, etc. were evident in many EU pilots and national roll-outs of smart metering systems. In the case of the Netherlands, for instance, the original legal obligation to accept the meter was revoked due to data privacy concerns. This resulted in granting the consumer with possibility to either refuse the meter or accept the meter but block the remote reading facility (so called "administrative off" option). To introduce such concerns in our model, we characterise each agent with "techno-tolerance threshold" and each contract with a level of perceived concerns ("techno-risks"). For each contract from the portfolio received, an agent considers only those that have a "techno-risks" value below her "techno-tolerance threshold".
The total attitude towards each contract under evaluation is summation of all individual attitudes relative to each single criterion \(c\), where \(c \beta {e, h, b, a}\):
| $$A(\alpha_j)=\sum_cA_{c,communicated}(\alpha_j)$$ | (8) |
| $$A_{c,communicated(\alpha_j)}=w_C\ast a_{c,norm,communicated}(\alpha_j)$$ | (9) |
Social influence
Household agents belong to a social network, used to simulate share of agents' perceptions. The network is generated such that each agent communicates with n other peers in a network of 200 agents. Half of those peers belong to the same archetype – people tend to associate with others who are similar with according to the principle of "homophily", (McPherson et al. 2001) and the rest are randomly chosen from different archetypes. This determines the level of heterogeneity in our model and it is defined as number of peers, each agent communicates with, belonging to different archetype than her own one.
Based on the experience each agent shares (through personal interactions, social media, etc.) with these n peers, agents update their attitude, as follows:
| $$A^{\star}_c(\alpha_j)=A_{c,communicated}(\alpha_j)+\Bigl(\frac{\sum_{i=1}^nA_{ic,experienced}(\alpha_j)}{n}-A_{c,communicated}(\alpha_j)\Bigr)\ast w_{SN}$$ | (10) |
The agent behaviour, in terms of electricity contract adoption, thus depends first on her personal attitude towards a certain contract and second on how much the attitude of her peers differs from her own personal attitude. In this regard, behaviour change according to the second factor is affected by the individual susceptibility.
Finally, the agent comes up with an overall attitude \(A^{\star}(\alpha_j)\) towards contract \(\alpha_j\), i.e.:
| $$A^{\star}(\alpha_j)=A^{\star}_e(\alpha_j)+A^{\star}_h(\alpha_j)+A^{\star}_b(\alpha_j)+A^{\star}_a(\alpha_j)$$ | (11) |
The contract for which the agent has the highest attitude is her preferred one; that is its final decision on which contract \(α_j\) to accept. The decision making can be formulated as follows:
| $$A^{\star}=max(A^{\star}(\alpha_1),A^{\star}(\alpha_2),\dots ,A^{\star}(\alpha_j),\dots ,A^{\star}(\alpha_k)$$ | (12) |
Characterization of contracts
Existing type of contracts along with potential future ones offered by major EU suppliers has been considered in our model and all the agents have the same contract options. Most of them can be grouped in seven types of contracts, according to the type of service provided, namely:
- Indirect feedback with own historical and peer comparison once a year: this type of feedback provision allows for historical analysis of consumer' electricity consumption and peer comparison at the end of each year and it does not require adoption of a smart meter;
- Indirect feedback with own historical and peer comparison once per two months: this type of feedback provision allows for historical analysis of consumer's electricity consumption and peer comparison every second month. Such feedback provision is in line with the requirement in some EU Member States (e.g. Sweden, Netherlands) for smart metering data reading and energy billing 6 times a year;
- Indirect feedback with own historical and peer comparison once per month: this type of feedback provision allows for historical analysis of consumer' electricity consumption and peer comparison every month;
- Direct feedback with In-House Display (IHD): this type of feedback provision allows for analysis of consumer' electricity consumption on a more granular base (near real-time). This feedback provision grants the consumer with the right of having data access to her metering data without sharing them with the DSO/supplier or any third party (e.g. "administrative-off" option in the Dutch national roll-out of smart metering systems);
- Direct feedback with Time of Use (ToU)/Real Time Pricing (RTP): this type of feedback provision allows for detailed analysis of consumer’s electricity consumption on a more granular base (near real time) and the possibility of having more advanced pricing mechanism (tailored to consumer's load profile);
- Direct feedback with Home Automation (HA): this type of feedback provision allows for detailed analysis of consumer' electricity consumption on a more granular base (near real-time) and the possibility to automate the usage of consumer's home appliances by responding to electricity prices;
- Direct feedback with Home Automation, including demand response and renewable energy self-consumption (EC COM, 2015): this type of feedback provision allows for demand response to electricity price using home automation (as in contract F), however, including self-consumption of electricity produced at consumer's premises.
Policy interventions
As mentioned before, the model in this paper explores the Directive (EU) 2009/72/EC on internal energy market for electricity and in particular, the recommendation (EU) 2012/148/EU on smart metering deployment. In this context, three possible policy interventions are presented.
- Mandatory smart metering policy: There is governmental policy in place, which mandates the DSO to install smart meters to all electricity consumers. This situation resembles the situation in most of the EU countries, where the consumer is required to accept the smart meter and can choose one of the contracts indicated in Table 1.
- Voluntary smart metering policy: This policy mandates the DSO to carry on nation-wide smart metering deployment, nevertheless, the consumer can choose to refuse the meter (contract A) or opt for "administrative off" (contract D). This represents the situation in some EU countries where data privacy concerns resulted in introduction of the "opt-out" and "administrative-off" option for the consumer. The types of contracts offered to the consumer in this policy are indicated in Table 1.
- Environmental smart metering policy: The conditions in this policy option are the same as in the voluntary policy and the agents are entitled to the same contracts (see Table 1). In addition, environmental campaign, launched by national/local authority is assumed to take place at a certain time step ( e.g., 40th month in our model). As a result, we assume that consumer will become more sensitive to environmental issue and therefore their biospheric weight will increase. We hypothesize an increase of biospheric weight by 100%, thus for some agents becoming the most salient weight. This would ultimately imply change of archetype for these agents and increase of biospheric agents.
| Contract | A | B | C | D | E | F | G |
| Mandatory policy | No | Yes | Yes | No | Yes | Yes | Yes |
| Voluntary policy | Yes | Yes | Yes | Yes | Yes | Yes | Yes |
| Environmental policy | Yes | Yes | Yes | Yes | Yes | Yes | Yes |
We are interested in monitoring possible diffusion rates of smart metering enabled services under the three different policy interventions presented above.
Simulation and data analysis
The model has been implemented in Netlogo (Wilensky 1999) and extensively verified using both single and multi- agent testing (Van Dam et al 2012), whereas the programming language R was used for the data analysis[3].
Experimental-set up
Data analysis was performed by building experimental set-up relative to the following variables: heterogeneity, policy, initial contract distribution and contract duration.
We have built four experiments, relative to the initial contract distribution and contract duration (see Table 2). The contract types considered in our study reflect possible smart metering enabled services to be deployed in EU and we are interested to observe the impact of initial contract distribution on the final system level contract adoption. Scenario 1 and 3 are conservative assumption in this regard and reflect the current EU situations, whereas Scenario 2 and 4 depicts future conditions, where variety of smart metering services will be available to the end-user. Similarly, the idea of having 12 months (as minimum contract duration observed in most of the EU member states) and indefinite contract duration is centred on our interest to analyse the effect of "lock-in" periods, during which the consumer would need to pay a penalty for leaving the contract or other switching barriers, in case of fixed contract duration. Each experiment is tested for each policy separately.
| Scenario | Initial contract distribution | Contract duration |
| 1 | All agents have the least technologically advanced contract (B in the mandatory policy and A in the voluntary and environmental policy) | 12 months |
| 2 | Equal contract distribution | 12 months |
| 3 | All agents have the least technologically advanced contract (B in the mandatory policy and A in the voluntary and environmental policy) | Indefinite |
| 4 | Equal contract distribution | Indefinite |
The model was run in an experimental setup of 20 runs for each parameter combination in order to be able to explore the spread in the outcomes, which is caused by randomly determined factors like the social network layout, weight factors of household agents, agents' experience with certain contract, agents' susceptibility and technology threshold. The parameterization for the simulation experiments is given in Table 3. Empirical values were not available for most of the parameters and as a result, synthetic data were used, based on expert judgment and the same were extensively varied. Nevertheless, wherever a source is given, the parameter value is empirically based. Each experiment starts with N agents with randomly generated weights. The highest weight of an agent determines the archetype she belongs to.
| Simulation parameters | |||
| Variable name | Brief description | Value | Source |
| n | Number of peers each agent communicates with | 7 (fixed) | - |
| policy | The policy determines what contracts are available, and whether an environmental campaign is introduced at t=40 months | mandatory, voluntary, environmental | - |
| heterogeneity | Level of peers belonging to different archetype then agent's own | 0; 0,5; 1 | - |
| Initial contract distribution | Contract distribution among agents at the beginning of the simulation | Equal distribution or all consumers have contract A or B (depending on the policy) | - |
| threshold-attitude | Measure of agent satisfaction with the certain contract. If the overall attitude is lower than the threshold-attitude, agent decides to change contract. | 0.5 (fixed) | - |
| contract-duration | Contract time duration | 12 months or indefinite | - |
| Simulation variables depending on the parameterization | |||
| Variable name | Brief description | Value | Source |
| N | Number of household agents, depends on the policy | 200 or 280 | - |
| Available contracts | The contracts that are available to the consumers, depends on the policy | {A,B,C,D,E,F,G} or {B,C,E,F,G} | - |
| Environmental campaign | Determines whether or not an environmental campaign is introduced in month 40, depends on the policy | Yes or no | - |
| Agent-specific variables | |||
| Variable name | Brief description | Value | Source |
| \(w_e\), \(w_h\), \(w_b\), \(w_a\) | Weight factors, as relative importance agent gives to certain criterion (egoistic, hedonic, biospheric, altruistic) | Chosen from uniform distribution [0,1] | - |
| \(w_{SN}\) | Susceptibility factor: measure of the importance agent gives to the opinion of her social network peers | 0.5 | - |
| techno-tolerance threshold | Acceptance level due to perceived risks associated with smart metering technology | [1,11] | |
| Contract-specific variables | |||
| \(a_{emin}\),\(a_{emax}\) | communicated range for financial savings | See Table 4 | Eurostat statistics explained |
| \(a_{hmin}\),\(a_{hmax}\) | communicated range for comfort change | See Table 4 | Boardman et al. (2005) |
| \(a_{bmin}\),\(a_{bmax}\) | communicated range for CO2 savings | See Table 4 | Covenant of mayors (2010) |
| \(a_{amin}\),\(a_{amax}\) | communicated range for social welfare | See Table 4 | S. Darby et al. (2012) |
| techno-risks | perceived technological risks | [1, 6] | - |
Data analysis
The numerous individual decisions of agents to switch to a certain type of contract influences system level outcomes: adoption of contract types, average financial savings and CO2 savings, comfort change and social welfare. Since we are interested in the system level performance that emerges from lower-level properties and processes, we focus our attention on these indicators and analyse the patterns due to change of policy and scenario. Parameter values vary between runs due to the stochastics used during agents' initialization and model execution (see table Table [2]). To be able to arrive at realistic assessment of patterns observed in the simulated system evolution, one needs to do a statistical analysis of the results of many runs.
Average contract distribution
Figure 3 depicts the average contract distribution among agents for each policy intervention and experiment performed, discussed in the following section. In the sections thereafter, the average and standard deviation of financial savings, comfort change, CO22 emissions savings and social welfare, is analysed, based on the 20 runs performed. They are visualized in Figure 4 to Figure 7.
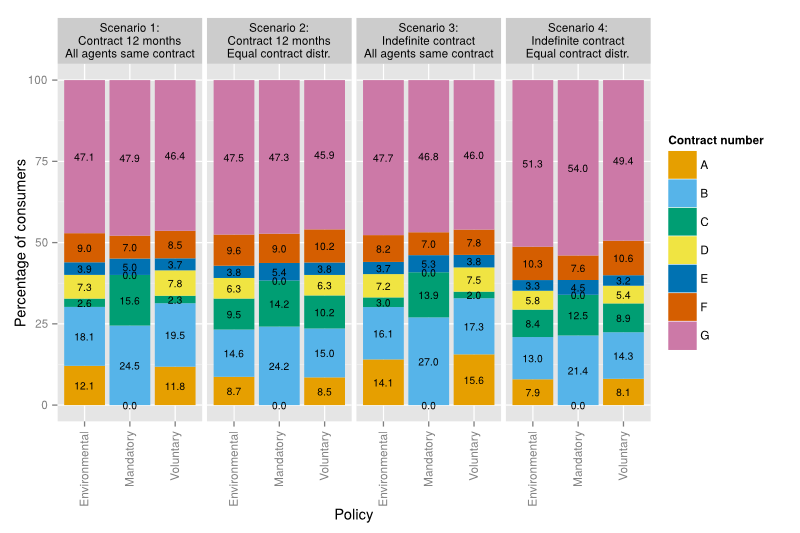
Regarding the contract distribution, we can observe and explain the following:
- In all experiments performed, there is a major difference in the adoption level of contract A ("opt-out" option and feedback once a year) and contract D ("administrative-off") when comparing the mandatory policy on the one hand, and the voluntary and environmental policy on the other hand. This difference is caused by the fact that contract A and D are not available in the mandatory policy.
- There are no significant differences in the adoption level of the contract types between the voluntary and environmental policy within a scenario even though one would expect that the environmental policy and the associated increase of biospheric consumers would yield a higher share of more advanced contracts. This can be explained by the fact that the techno-tolerance threshold, as currently modelled, does not vary with the archetype, i.e. it has the same value for each archetype. As a result, increase in the number of biospheric consumers does not necessarily lead to increased adoption of more technologically advanced contracts.
- More technologically advanced contracts, such as contract F and G are highly adopted in all policies. This is caused by the fact that these are the best-scoring contracts for 3 out of the 4 criteria that agents consider in their choice.
- For the voluntary and environmental policy, consumers have a much higher adoption level of contract C when contracts are initially equally distributed amongst agents (2nd and 4th scenario), than when all agents have initially contract A (1st and 3rd scenario). This is explained by the fact that some people tend not to switch away from their initial contracts since they remain satisfied over the course of the simulation.
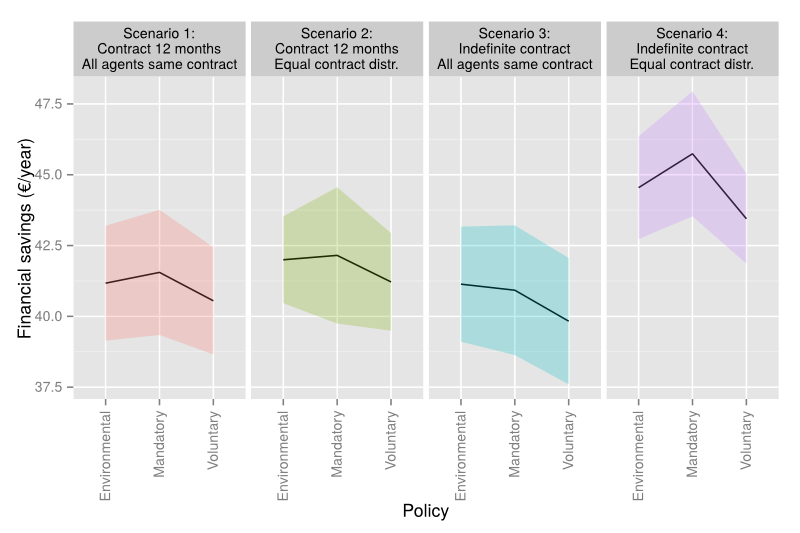
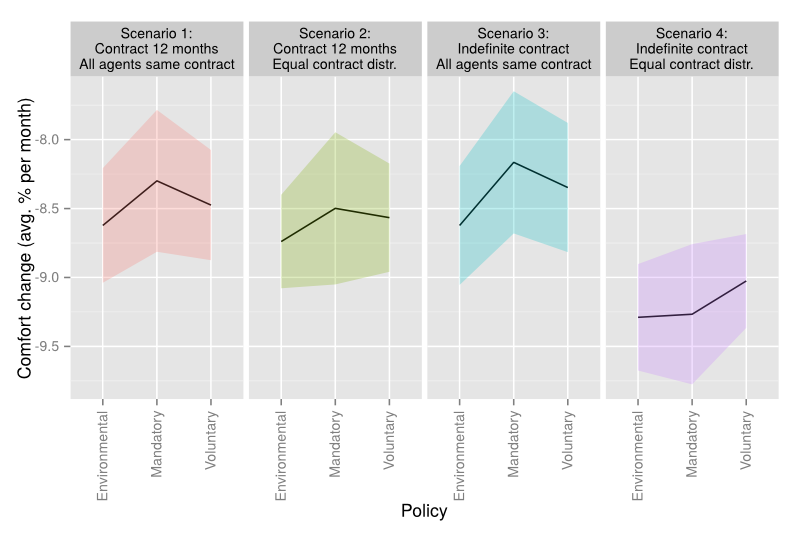
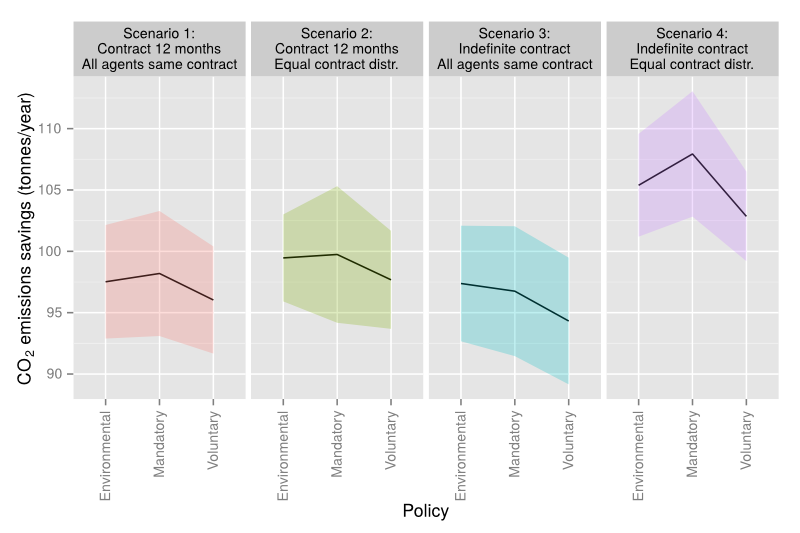
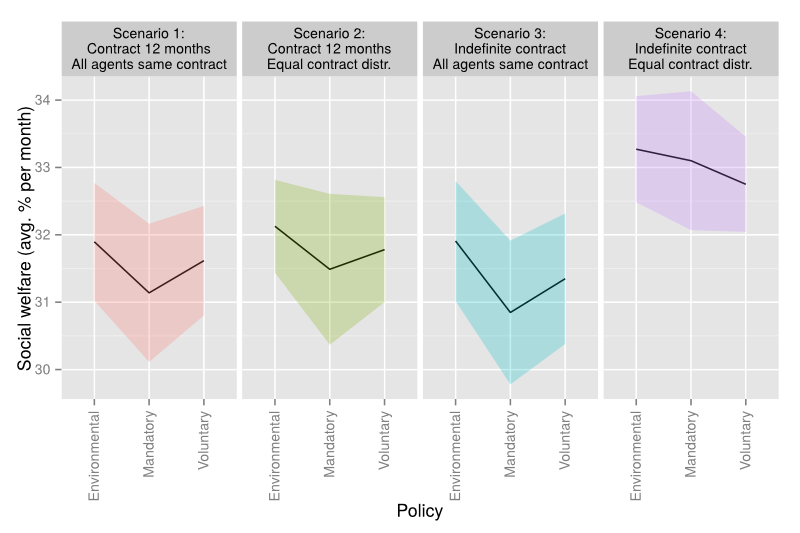
Figures 4-7 illustrates the impact of agents' behaviour on the four criteria mentioned above: financial savings, CO2 emissions savings, comfort change and social welfare, both the average value across the whole simulation period and all simulation runs (continuous line) and the spread around the average value (colour shaded area). These results are discussed in the following sections.
Heterogeneity, as modelled in this paper does not prove to have impact on the average contract distribution. This is due to the fact that egoistic, biospheric and altruistic agents have objectives which pull in the same direction, in terms of contract type preference, i.e. agents who belong to these three archetypes will behave similarly, whereas hedonic agents will act differently. As such, more technologically advanced contracts that would yield higher energy and financial savings, would also result in higher CO2 savings and increased social welfare.
Analysis of the system level performance indicators
In Figure 4 financial savings are lowest in the 3rd scenario, due to highest average adoption of contract B (feedback once per two months) in the mandatory policy and both contract A (feedback once a year with no smart meter) and B in the voluntary policy. Similarly, highest financial savings can be observed in the 4th scenario, as a result of highest adoption of contract G, as most technologically advanced contract and lowest adoption of both contracts A and B across all three policies (see Figure 3). There is no significant difference in the financial savings between the 1st and 2nd scenario. This means that when the contract duration is 12 months it does not make a difference what the initial contract distribution is. The contract duration does however have an impact if the contracts last indefinitely.
In scenario 3, highest financial savings are observed in the environmental policy and lowest in the voluntary one, owing to higher adoption rate of contract F and G in the environmental policy (in comparison with the first two policies) and lower adoption rate of contract A and B. In scenario 1, 2 and 4, the financial savings are highest in the mandatory policy due to high adoption of contract G and low adoption of contract A.
Contrarily to the financial savings, one can observe lowest comfort reduction in scenario 3 and highest in scenario 4. The same reasoning holds, as in the analysis of the financial savings, i.e. lower adoption level of contract A and B, combined with higher adoption of contract G in scenario 4 results in highest comfort change for that scenario.
Similarly to the financial and CO2 savings, highest increase in social welfare is observed in scenario 4 (for the same reasons mentioned above). Nevertheless, the difference between this indicator and the financial and CO2 savings is the increasing trend in the outcome of social welfare as moving from the mandatory policy to voluntary and environmental policy in scenario 1, 2 and 3 (Figure 7). This is due to the fact of contract A (feedback provision once a year with no smart meter) having the same communicated range for the social welfare as contract B and C (see Table 4 in the Appendix), i.e. increased adoption level of contract A in the mandatory and environmental policy does not lead to decreased social welfare, as it was the case of financial and CO2 savings. Additionally, increased adoption of contract D (and to some extent contract E) in the last two policies, comparing to the first one, yields increased social welfare. The adoption level of contract G does not seem to significantly vary among the 3 policies.
Scenario 3 shows worst performance of this indicator due to the fact of having highest average adoption level of contract A, B and C (see Figure 3), when comparing to the rest of the scenarios.
Techno tolerance and attitude satisfaction
Along with the system level performance, i.e. financial and CO2 savings, comfort change and social welfare, we also observed the agents' satisfaction, in terms of their perception towards potential risks associated with single contract type (data privacy and security, health, etc.), but also agents' overall satisfaction due to specific attitude threshold, set up in the initialization.
Figure 8 illustrates agents' satisfaction due to their perceived smart metering technology risks, as difference between agent specific tolerance threshold and technology risk associated with the adopted contract. On this note, one may observe that agents may be satisfied with their choice, in terms of overall contract performance, nonetheless at the expense of the technology risks perceived with the chosen contract. The tolerance threshold is initialized at the beginning as a random number drawn from a predefined set. In future model development, the tolerance threshold shall vary in accordance to the experience the agent has with the smart metering technology or the impact one may have from media or experiences in her social network.
Furthermore, one may observe from Figure 8 that average agents' tolerance satisfaction is worst in scenario 4, owing to higher adoption of contracts F and G (as most technologically advanced contracts and thus perceived technological risks) and lower adoption of contract A. Similarly, highest tolerance satisfaction is observed in scenario 3 due to lower adoption of contract F and G and higher acceptance of contract A, in comparison with other scenarios. Moreover, in all 4 scenarios, the average techno tolerance satisfaction is the least for the environmental policy.
Energy savings, CO2 emissions reduction and social welfare score highest for the environmental policy (Fig. 4, 6 and 7) in scenario 3, which results in lowest techno-tolerance satisfaction, due to higher adoption of contract F and G and lower adoption of contract A. Similarly, all performance indicators perform worst for the voluntary policy, in scenario 4 (Fig. 4-7), due to lower adoption level of contract G, in comparison with the mandatory and environmental policy and higher adoption level of contract A, in comparison with the first policy. This also leads to highest techno-tolerance satisfaction for the voluntary policy. Figure 9 depicts the average attitude satisfaction, as difference between the agent's general attitude regarding the certain contract and the agent specific attitude threshold.


One may observe from Figure 9 that the average attitude satisfaction is similar among scenarios, and with no significant difference among the three policies. What is evident however, is the negative average satisfaction level in all the scenarios and for all policies, which indicates high average switching rate.
Conclusions
The research question that the model aimed to answer is how smart metering technologies (and thereby enabled services) diffusion can be promoted under different policy settings and how this technological diffusion affect individual and societal performance indicators. The outcomes are not meant as predictions, but rather an exploration of mechanisms at play. The model cannot be classically validated as it discusses possible future mechanisms, and as such it has been subject to expert validation.
The most remarkable outcome is that granting the consumers with opt-out and "administrative-off" option for smart metering system resulted in increased number of consumers opting for a less technologically advanced contract (i.e., contract A or D). Given our initial assumptions on population preference distribution, one may conclude that addressing consumers concerns (such as data privacy and security) by granting them with more options, does not necessarily lead to higher energy and CO2 savings and ultimately higher consumers' satisfaction. During expert validation, this pattern has been recognized as realistic.
This effect remained strong even under the environmental policy, where despite significant number of agents becoming more environmentally concerned (i.e., having a higher weight for the biospheric criterion) system level indicators, such as energy and CO2 savings remained lower, in comparison with the mandatory policy. This result is due to significant adoption of contracts that do not require data sharing with DSOs (e.g. contract A and D in the environmental policy) and thus do not present additional benefits, such as energy/financial savings due to dynamic pricing. Furthermore, technologically advanced contracts that yield higher benefits may also be subject to technology concerns, as perceived by the consumers. As a result, average techno-tolerance satisfaction appears to be lowest for the environmental policy, which is associated with high level of perceived technological risk by the consumers for the adopted (more technologically advanced) contracts. Hence, it can be argued that giving consumer more choices do not necessarily produce better system level results, which is in line with psychological research. Schwartz (2004) claims that an abundance of choice is likely to produce worst decisions because people tend to simplify their choices to the point that the simplification hinders their capability to opt for a good choice. In this regard, policies may need to target the information to the right segment of population in order to avoid information overload.
Differently from the average techno-tolerance satisfaction, the average total-attitude satisfaction does not vary greatly among policies and scenarios. For instance, agents experience highest techno-satisfaction in Scenario 3 (due to highest adoption level of contract A); nevertheless, the total-attitude satisfaction remains similar as in the rest of the scenarios. This can be associated with the high diversity of the agents' population (in terms of agents' archetype).
Furthermore, there is no significant difference in the average total-attitude satisfaction among the policies; nevertheless, it appears to be slightly higher in the mandatory policy. This may be due to the increased adoption level of contract A in the voluntary and environmental policy, i.e., agents opt for less attractive contracts due to technological risks perceived for more attractive ones. Therefore, it can be argued that providing the consumer with more options (voluntary policy) does not necessarily lead to higher consumer's satisfaction. Indeed, giving consumers too many options (in our case contracts) to choose from leads the consumer feeling less satisfied even after taking the decision (Schwartz 2004).
Hence, risks perceived by the consumers shall be approached as an early attention point, and in particular, the ways in which their energy consumption data is used, by whom, and for which purposes. Information strategies (e.g., environmental campaigns in the environmental policy) for increasing consumers' awareness (e.g., towards environmental benefits) do not seem sufficient to effectively diffuse the full potential of smart metering services, even in the case of targeting specific segment of population (e.g., biospheric archetype). Associated risks perceived by the consumers (e.g. data privacy and security) still remain hurdle towards adoption of more advanced contracts. Therefore, policy interventions need to simultaneously address adoption barriers and openly communicate potential concerns and treat them effectively (e.g. reassuring the consumer that she cannot be disconnected without notice, ensuring that "administrative off" actually means no metering data is being exchanged, etc.).
To conclude, our results show some interesting policy implications. A good policy should be designed so as to adequately inform (right and complete information) the consumer on the advantages and disadvantages of the offered technological solution. The consumer can therefore feel more comfortable in accepting more advanced technologies and lower her technological concerns (e.g., lower techno concern for well-designed information campaign – not presently included in our current model). Consequently, this could lead to the consumer feeling more satisfied.
Future considerations
The famous quote by P.E. Box states that “All models are wrong, but some are useful” (Box and Draper 1987). While there are clear useful insights to be drawn from the current work, there are four important limitations that we wish to address in the future.
First of all, total-attitude satisfaction stays below 0 in all the scenarios, i.e. agents are constantly dissatisfied, which results in high switching rate. This can be explained by two facts: first, in our study, the experience the agents get with each contract is modelled as exogenous variable, each time step randomly drawn from a predefined set of values (defined in the contract) for each indicator, whereas the evaluation of the current contract shall reflect upon learning effects from past experiences and adapt the current experience accordingly (e.g. through adaptive set for each indicator). Second, the attitude threshold and techno-tolerance threshold are exogenous, fixed at the initialization of the model. Fixed techno-tolerance threshold means consumers disregard the contracts that are below their techno-tolerance threshold. Such an approach prevents the agent to consider more "technologically risky" contracts at the expense of better outcome (in terms of energy savings, environmental impact, etc.). The perception for more "technologically risky" contracts may change over time, owing to the experience an agent has with her contract, which will ultimately result in adaptive techno-tolerance threshold. Similarly, attitude threshold shall consider agents' learning and adaptation and therefore be reflexive and reactive to the environment. This certainly deserves attention in future developments of the model.
Third, future model development shall consider more reflexive and reactive institutions, as well as explore institutions emerging from agents' behaviour. Finally, improving the model with empirical data constitutes a major route for further development of the model.
Notes
- http://ses.jrc.ec.europa.eu/smartregions.
- Under this option in the Netherlands, the consumer does not remotely exchange consumption data information with the supplier or any third party and cannot be remotely disconnected.
- Access to the model granted on request.
- CO2 emissions reference factor indicates the emissions of the system marginal unit (i.e. the unit with highest marginal cost), expressed in tonnes of CO2 per kWh.
- Contracted amper capacity is an indication of the volume of electricity that household can use at any single time.
- Method which takes into consideration the overall life cycle of the energy carrier, i.e. not only the emissions of the final combustion, but also all emissions of the supply chain.
Appendix
In the following, the agent-based model developed in this paper is described using the ODD (Overview, Design concepts, Details) protocol (Grimm et al. 2010).
Purpose
The purpose of this paper is to explore the diffusion potential of smart metering enabled services among a population of interacting electricity consumer and to evaluate the impact of such diffusion on individual and societal performance indicators.
Entities, state variables and scales
Central entity of the model is electricity consumer, representing individual household. Consumer agents are characterised by: weight factors, memory retaining knowledge on the experience with the contract they currently own, aspiration threshold on the perceived technological risks and aspiration threshold on the overall attitude ("threshold-attitude") towards certain contract. The weight factors \(w_e\), \(w_h\), \(w_b\) and \(w_a\) describe the criteria's relevance (Menanteau & Lefebvre 2000) and the highest one determines the social aggregation i.e. "archetype" each agent belongs to. The weight factors are normalized such that the sum of the weights equals 1.
At the same time, the four values of the weight factors represent the four criteria against which agents evaluate and score contracts:
Financial savings, resulting from energy savings:
| $$a_e[€{}]=E_{averag,saved}[kWh]\ast price\Big[\frac{€{}}{kWh}\Big]$$ | (13) |
\(E_{average,saved}[kWh]\) is the average monthly energy saved and price [€/kWh] is the electricity price.
Thermal comfort change:
| $$a_h[\%]=\frac{T_{final}[°C]-T_{set}[°C]}{T_{set}[°C]}\ast 100\%$$ | (14) |
CO2 emissions reduction:
| $$a_b[t_{co2}]=E_{average,saved}[kWh]\ast e_{rf}\Bigl[\frac{t_{co2}}{kWh}\Bigr]$$ | (15) |
Social welfare – Demand factor is used as a proxy of how efficiently the customer is using electricity during defined time period (e.g. month), i.e.:
| $$a_a[\%]=\Bigl(1-\frac{P_{max}[kW]}{P_{peak}[kW]}\Bigr)\ast 100\%$$ | (16) |
Temporal resolution of the model is monthly time step, whereas the spatial resolution is abstract. Contracts have a fixed position in a rectangular plane and agents move within the space by changing contracts.
Process overview and scheduling
The model consists of the sub-models "experience with certain contract" and "opting for new contract", which are executed consecutively at each time step. Within the first sub-model, agents change their state variables due to: experience they have with certain contacts and agent specific aspiration threshold. Based on the experience, agent forms an attitude towards a certain contract and relative to her aspiration threshold-attitude; she decides to eventually switch to different contract. In the second sub-model, agent develops an overall attitude towards each contract under evaluation, built upon consumer's personal preferences and opinion of peer agents, and opts for the highest scoring contract. The process overview is defined in Figure 2 and all agents follow the same decision making structure.
Design concepts
In our model, we apply basic principles of three scientific theories: goal framing theory, social network theory and theory of planned behaviour. Goal framing theory (Lindenberg 2001; Fetchenhauer et al. 2006; Lindenberg 2008 and Lindenberg and Steg 2007) postulates that goals "frame" the way people process information and act upon it. Three goal frames are distinguished: a hedonic, gain, and normative goal frame. In this context, we characterise agents as egoistic (gain), hedonic, biospheric and altruistic (normative goals).
Social network theory focuses on interaction of people, organizations or groups inside their network. The social network defines social ties, as information-carrying connections between households. This informs agents about the experience and attitude of their peers regarding certain contracts. Consequently, social influence can affect households 'decisions in adopting certain contract.
Contract adoption is partly based on the Theory of Planned Behaviour (Ajzen 1991), which underlines agents 'decision to adopt certain contracts. According to this theory, an adoption decision depends on both adopter's preferences and her peers' decisions.
Temporal aspects in the decision process
Past experience is incorporated in the representation of the agents 'memory and used in the decision making process of contract change/adoption. Also, temporal aspects are introduced in the time step \(t=40\) months, as representation of policy change at certain time step (e.g. environmental policy, as explained in Section 3).
Sensing of household agents occurs through social ties of the social network graph. Agents perceive the attitude of their peers regarding a certain contract and consider this social influence in their decision (eq. 10). Also, agents sense the performance indicators, communicated by the contracts, in terms of financial savings, comfort change, CO2 savings and social welfare.
Interaction occurs through social influence between household agents interconnected in the social network. In such network, agents communicate directly with each other and the interactions depend on the heterogeneity level and susceptibility. Each agent communicates directly to a number of randomly chosen agents. The heterogeneity determines how many of these agents are of the same and different archetypes. Agent's behaviour (ultimate decision on contract type adoption) may be influenced based on the experience the other agents in the social network have with certain contract and the value she gives to the opinion of those other agents (i.e. susceptibility).
Stochasticity appears in four aspects. First, the social network is randomly created each time step when agents evaluate set of contracts, i.e. agents communicate with randomly selected peers from her and different archetype. Second, agents' archetype is determined by randomly assigned weight. Third, at each time step, agent considers to change contract, based on the experience with certain contract (which is a random value drawn from communicated range of that contract). Last, the techno-tolerance threshold is randomly generated inside a pre-defined range and initialised at the beginning of the simulation.
Observation
Overall financial savings, CO2 emissions reduction, social welfare and thermal comfort are collected at the end of the simulation to analyse the impact of contract distribution on the system level performance for each policy and scenario. On this note, average contract distribution is also observed at each time step to understand the reasoning behind the contract adoption patterns and influencing factors (incentives, social influence, etc.). Finally, average technology satisfaction and average attitude satisfaction have been analysed in each policy and among scenarios to understand the link between system level performance (in terms of financial savings, CO2 emissions reduction, etc.) and the agents' satisfaction level. A distinct pattern of distribution of contracts, system level outcomes and satisfaction level emerges.
Initialisation
Model initialisation follows three successive steps: creating household agents, generating the social network and setting the state variables of the model. Each agent is assigned random weight for each of the four criteria. This means that also the archetype she belongs to is randomly assigned. Next, the peers each agent communicates with are randomly chosen from her social network.
Finally, the state variables (mentioned in Table 3) are initialised for each agent and contract type. Weighting factors, threshold-attitude, susceptibility and heterogeneity are assumed not to change during the simulation period, whereas the memory varies according to the experience the agent has in each time step. The techno-tolerance threshold is initialised at the beginning of the simulation and randomly chosen from a predefined range. Contracts are assumed to be initially equally distributed among the agents and further experiments with different initial contract distribution are also tested in Section 4. Each contract is characterised with contract duration, communicated range for each criterion and perceived technological risk. The communicated ranges for financial savings assumed average energy savings between 0 and 10% from contract A to G, respectively (Darby 2006; Van Elburg 2014). The analysis of electricity prices for households is based on prices for the medium EU standard household consumption band, namely one with annual electricity consumption between 2 500 and 5 000 kWh (Eurostat). We have considered an average annual household consumption of 3600 kWh/year or 300 kWh/month in our analysis. The average price of electricity for household consumers in the EU-28 (the prices for each EU Member State are weighted according to their consumption by the household sector for 2013) was EUR 0.208 per kWh (Eurostat).
We express comfort change as a temperature deviation relative to the target thermostat settings. Comfort cannot be defined absolutely; however the World Health Organization's standard for warmth indicates 18°C as suitable temperature for healthy people who are appropriately dressed. For those with respiratory problems or allergies, they recommend a minimum of 16°C; and for the sick, disabled, very old or very young, a minimum of 20°C (WHO 1990). According to a study by housing expert Richard Moore (see Boardman et al. 2005), comfortable indoor temperature lies within a range of [18°C-21°C]. We have considered a temperature of 20°C as a target thermostat setting and gradually reduce it to a minimum of 17°C in the case of contract G. As for the CO2 emissions savings, the EU Covenant of Mayors reports a value of 0.460 (t CO2/MWhe) as standard emission factor and 0.578 (t CO2-eq/MWhe), as LCA emission factor[6], for EU 27 (Covenant of Mayors 2010). In our model, we have used a value of 0.5 t CO2/MWhe as standard reference factor.
Finally, demand factor was used as a proxy of social welfare. One shall note here, that the social welfare, in our model, is mainly linked to security of supply, since lower demand factor leads to more flatten household load profile and thus contribute towards enhanced energy usage and reduced outages in the neighbourhood. We have used peak load reduction between 10% due to demand response and maximum 50% due to both demand response and renewable energy self-consumption for contract G (Darby and McKenna 2012). Table 4 provides an overview of the communicated ranges for each contract type.
| Contract | Financial Saving [€] | Comfort change [%] | CO2 emissions savings [t] | Social welfare [%] |
| A | [0; 0.1] | [0; 0.1] | [0; 0.5] | [10; 20] |
| B | [0.54; 0.66] | [0; 0.1] | [1; 2] | [10; 20] |
| C | [0.54; 0.66] | [0; 0.1] | [1; 2] | [10; 20] |
| D | [1.08; 1.32] | [-6; -4] | [2; 4] | [10; 20] |
| E | [2.2; 2.6] | [-12; -8] | [5; 7] | [20; 30] |
| F | [3.2; 4] | [-12; -8] | [8; 10] | [30; 40] |
| G | [5; 7] | [-17; -13] | [12; 16] | [40; 50] |
Sub-model: Decision making on switching to different contract
The two main processes in our model are: 1) decision making on switching to different contract (decision criterion: agent's attitude is below the threshold-attitude) and 2) decision making on which contract to be adopted (decision criterion: agent's personal preferences and opinion of social network peers).
Each time step, agents have random probability to decide whether to consider contract change. This is due to the agent's experience with certain contract being modelled as a random value within a range, communicated in the contract. The randomization is associated with lack of empirical evidence on the actual experience electricity consumers have with certain type of contracts. Moreover, some of the contracts described in our paper are not yet available on the market.
Once the agent gets experience with certain contract, the same is memorised in the agent's memory and the memory is updated considering the new experience, as formulated in equation (5). Based on the updated score in the memory and agent's specific weighting factors, the household consumer comes out with an overall attitude towards certain contract, as stated in equation (7). This overall attitude and agent's satisfaction threshold accounts for the ultimate agent's decision to switch to a different contract or stay with the current one. Agents also consider switching to different contract, in case the current one has terminated, i.e. at the end of each 12th time step.
Sub-model: Choosing contract from portfolio of contracts communicated by the supplier
This sub-model represents the decision framework for adopting a new contract, based on: multiple choices agents get from the supplier, agent's specific preferences, experience of other agents belonging to her social network and the importance the agent gives to the experience of her peers' agents (level of susceptibility). The adoption decision is modelled as multi-criteria problem and follows the same structure for all agents. The agent receives a portfolio of contracts and based on her perception of technological risks associated with each contract ("techno-risks") and agent's specific aspiration threshold ("techno-tolerance threshold"), the agent evaluates only contracts with perceived technological risks above her aspiration threshold, whereas the rest are discarded. The evaluation process includes: agent's personal attitude, as sum of the weighted communicated scores on each criterion (equation 9) and attitudes of peers agents regarding each contract under evaluation, i.e. social influence (Equations 10 and 11).
Finally, the best scoring contract is the one to be adopted (Equation 12).
References
AJZEN, I. (1991). The theory of planned behaviour. Organizational Behavior and Human Decision Processes, 50 (2), 179-211. [doi:10.1016/0749-5978(91)90020-T ]
BOARDMAN, B., Darby, D., Killip, G., Hinnells, M., Jardine, C. N., Palmer, J. and Sinden, G. (2005). 40% house. Environmental Change Institute, University of Oxford. http://www.eci.ox.ac.uk/research/energy/downloads/40house/40house.pdf. Archived at: http://www.webcitation.org/6eXCcVcxy.
BOX, G. E. P., and Draper, N. R., (1987), Empirical Model Building and Response Surfaces, John Wiley & Sons, New York, NY.
CHAPPIN, E.J.L. (2011). ‘How to develop a Sustainable Energy Action Plan, Part 2.’ Simulating Energy Transitions. Next Generation Infrastructures Foundation.
COVENANT of Mayors (2010). Guidebook. http://www.eumayors.eu/IMG/pdf/technical_annex_en.pdf.
COVRIG, C., Ardelean, M., Vasiljevska, J., Mengolini, A., Fulli, G., Amoiralis, E., Sanchez Jimenez, M. and Filiou, C. (2014). Smart Grid Projects Outlook 2014, JRC Science and Policy Report.
DARBY, S. (2006). The effectiveness of feedback on energy consumption. A review for DEFRA of the literature on metering, billing and direct displays. Environmental Change Institute, University of Oxford.
DARBY, S.; McKenna, E. (2012). Social implications of residential demand response in cool temperate climates. Energy Policy 49, 759–769. [doi:10.1016/j.enpol.2012.07.026 ]
EPSTEIN, J.M. (1996). Growing Artificial Societies: Social Science from the Bottom-Up. Brookings Institution Press.
EUROPEAN COMMISSION COMMUNICATION (EC COM), Staff Working Document, 2015. Delivering a New Deal for Energy Consumers.
EUROSTAT STATISTICS EXPLAINED. http://ec.europa.eu/eurostat/statistics-explained/index.php/Energy_price_statistics. Archived at: http://www.webcitation.org/6eXDU4yiK [doi:10.1007/0-387-28032-4 ]
FETCHENHAUER, D., Flache, A., Buunk, B. and Lindenberg, S. (2006). Solidarity and prosocial behaviour. An integration of sociological and psychological perspectives. Springer Verlag (pp. 23–44).
FISCHER, C. (2007). Influencing electricity consumption via consumer feedback: a review of experience. ECEEE 2007 SUMMER STUDY Saving energy – just do it! [doi:10.1016/j.ecolmodel.2010.08.019 ]
GRIMM, V., Berger, U., DeAngelis, D.L., Polhill, J.G., Giske, J. and Railsback, S.F. (2010). The ODD protocol: a review and first update. Ecological Modelling, 221, 2760-2768. [doi:10.1016/j.enpol.2014.04.021 ]
KOWALSKA-PYZALSKA, A., Maciejowska, K., Suszczyński, K., Sznajd-Weron, K. and Weron, R. (2014). Turning green: Agent-based modelling of the adoption of dynamic electricity tariffs. Energy Policy 72, 164–174. [doi:10.1007/0-387-36274-6_29 ]
LINDENBERG, S. (2001). Social rationality versus rational egoism. Handbook of sociological theory, (pp. 635–668). [doi:10.1111/j.1540-4560.2007.00499.x ]
LINDENBERG, S. (2008). Social rationality, semi-modularity and goal-framing: What is it all about? Analyse & Kritik, 30, 669–687. [doi:10.1146/annurev.soc.27.1.415 ]
LINDENBERG, S., and Steg, L. (2007). Normative, gain and hedonic goal-frames guiding environmental behavior. Journal of Social Issues, 65 (1), 117–137. [doi:10.1016/S0048-7333(99)00038-4 ]
MCPHERSON, M., Smith-Lovin, L. and Cook, M. J. (2001). Birds of a Feather: Homophily in Social Networks. Annual Review of Sociology, 27, 415–444. [doi:10.1016/j.techfore.2013.08.011 ]
MENANTEAU, P., Lefebvre, H. (2000). Competing technologies and the diffusion of innovations: the emergence of energy-efficient lamps in the residential sector. Research Policy 29 (3), 375–389. [doi:10.1002/9780470939338.ch6 ]
RIXEN, M., & Weigand, J. (2014). Agent-based simulation of policy induced diffusion of smart meters. Technological Forecasting and Social Change, 85, 153-167.
SHWARTZ, B. (2004). Doing better but feeling worse: The paradox of choice. In P. A. Linley, & S. Joseph (Eds.), Positive Psychology in Practice. Hoboken, N.J.: John Wiley and Sons, (pp. 86-104).
STEG, L., Bolderijk, J. W., Keizer, K. and Perlaviciute, G. (2014). An integrated framework for encouraging pro-environmental behaviour: the role of values, situational factors and goals. Journal of Environmental Psychology, 38, 104–115.
STEG, L., De Groot, J. I. M. (2012). Environmental values. The Oxford Handbook of Environmental and Conservation Psychology. New York: Oxford University Press, (pp. 81–92).
VAN DAM, K.H., Nikolic, I., Lukszo, Z. (2012). Agent-Based Modelling of Socio-Technical Systems. Springer, Guildford and UK.
VAN ELBURG, H. (2014). Dutch Energy Savings Monitor for the Smart Meter. Rijksdienst voor Ondernemend Nederland.
WILENSKY, U. (1999). NetLogo. Center for Connected Learning and Computer-Based Modeling, Northwestern University, Evanston, IL. http://ccl.northwestern.edu/netlogo/. [doi:10.1111/j.1540-5885.2011.00790.x ]
WORLD HEALTH ORGANISATION (1990). Indoor environment: Health aspects of air quality, thermal environment, light and noise. http://apps.who.int/iris/handle/10665/62723. Archived at: http://www.webcitation.org/6ed4TWMEE.
ZHANG, T. and Nuttall W. J. (2011). Evaluating Government’s Policies on Promoting Smart Metering Diffusion in Retail Electricity Markets via Agent-Based Simulation. Journal of Product Innovation Management, 28, 2.