
Introduction
The use of overseas M&As is a feasible way of seeking external resources to upgrade a company’s global competitiveness and technology innovation ability. However, due to cultural differences, different management patterns and technology gaps, acquiring companies may face huge difficulties in transforming core technology, such as patents. Without a powerful post-merger strategy, acquiring companies are more likely to miss the opportunities to make technology innovation, leading to merger failures.
The post-merger process involves resource deployment of the two companies and characteristic identification of the resource backgrounds. By positioning of the competitive resources and analyzing the cooperation in post-merger process, the positioning school (Mintzberg et al. 2005) of strategic management suggested that we could evaluate the post-merger process or M&A performances based on firms’ resource backgrounds, which are resource similarity and resource complementarity (Cartwright 2006; Chatterjee 2009; Haspeslagh & Jemison 1991; Larsson & Finkelstein 1999). For resource similarity, Homburg and Bucerius (2005) suggested that resource similarity means that the two companies have a high degree of overlap in technology and the product market. In contrast, resource complementarity is a relationship in which upgrading a resource improves another resource’s performance (Milgrom 1995). It is worth noting that a very prominent research stream in strategic management literature presumes the strategic fit on the perspective of resource backgrounds as decisive for M&A success (Bauer & Matzler 2014). M&A benefits acquirers and targets through synergy from related resource backgrounds (Barney 1999; Singh & Montgomery 1987). Additionally, the resources of the two companies can have a synergistic effect only under the proper degree of integration (Zaheer et al. 2013). Studying post-merger strategy based on the perspective of resource similarity and complementarity plays a key role in identifying important resources, promoting post-merger synergistic performances and realizing the goal of improving technology innovation in overseas technology sourcing M&A.
Post-merger integration is the foundation of realizing synergy effect of the M&A (Seth 1990). In previous studies, existing literature focuses on two dimensions, the integration level and target autonomy in the post-merger process. Integration means degree of structural unity (Pablo 1994) while target autonomy is whether the target company can retain the ability to operate as before or not (Datta & Grant 1990). The relationship between integration degree and target autonomy are neither opposite nor isolate. One should consider integration and target autonomy together as suggested by Haspeslagh and Jemison (1991).
With respect to the degree of integration, technology resource similarity can reduce integration risk and increase predictability of potential technology performance (Lubatkin et al. 2001) which when combined with a high integration degree will improve the efficiency of resource deployment and gain synergy effect (Puranam et al. 2006). High integration degree of similar resource gain synergy effect in that the similar knowledge backgrounds, technology, language and cognitive structure will promote knowledge diffusion or sharing (Makri et al. 2010) and technological overlap contributes the most in gaining synergy effect (Bena & Li 2014). In contrast, resource complementarity has different effect on integration degree. Colombo (2014) showed that a low degree of integration stimulates innovation when the product market is complementary. On the one hand, complementary resources gain synergy effect in the integration process by boosting sales output, reducing average R&D costs and promoting technology innovation (Puranam et al. 2006). Makri et al. (2010) empirically showed that technology complementarity promotes innovation output through new product development in particular. On the other hand, the differences brought by resource complementarity, if not efficiently integrated, will prevent synergy in value creation (Kim & Finkelstein 2009).
As for target autonomy, existing literature suggests a low level of target autonomy when resource similarity is high (Datta & Grant 1990) because when two companies have a high level of resource similarity, a high level of target autonomy is not likely to result in good potential performance (Zaheer et al. 2013). Target autonomy is crucial to complementary resource because lacking a certain level of autonomy, technical personnel will not work as hard as before, which results in inefficient innovation performance (Paruchuri et al. 2006; Kapoor & Kim 2007).
Post-merger gains depend on whether the agents make post-merger efforts. If both sides make the post-merger effort, they both get synergy benefits; otherwise, they can only gain non-synergy benefits (Banal-Estañol & Seldeslachts 2011). Due to information asymmetry, either company can overvalue its private information of potential innovation output after M&A and wait for the other side to make the integration effort. The previous literature on resource backgrounds has two shortcomings. First, these studies mainly focused on either resource similarity or resource complementarity without considering their potential interaction. Second, financial-level theoretical and empirical studies cannot simulate agents’ complex interactions and dynamic resource deployments. Here, multi-agent simulation can somehow overcome the problem.
Multi-agent simulation is a loosely coupled network problem-solver. Interactions between solvers can resolve the problems that no single solver has the ability or knowledge to solve. It can simulate heterogeneous agents’ actions and predict the steady state of the equilibrium considering the interactions of the agents. Agent-based modeling has been a powerful simulation technique which has wide real-world applications such as flow simulation, organizational simulation, market simulation and diffusion simulation (Bonabeau 2002) and its repetitive competitive interactions between agents make us possible to explore dynamics out of the reach of pure mathematical methods and provide an emergent phenomenon of how the resources of the acquirer and the target company lead to different integration behaviors dynamically. Therefore, using multi-agent simulation to involve agent-level information exchange and interaction behaviors will provide a new perspective for us to figure out what matters in technology-sourcing overseas M&A integration and innovation output. With multi-agent simulation, we can study how companies make merger decisions and post-merger decisions when facing huge cultural difference and information asymmetry. Also, during the simulation we can provide a whole picture about what individual agents’ information acquisition process can bring to the new innovation endowment combinations and increase innovation profits dynamically.
Based on global game analysis (Carlsson & van Damme 1993), one company’s payoff is influenced by the other company’s signal regarding action and information uncertainty. A company gathers its private information signal and the public signal to forecast the other side’s actions. Furthermore, we try to link multi-agent simulation with global game under NetLogo 5.2.0 (Wilensky 1999). By building the merger strategy (whether to engage in a M&A or not) and post-merger strategy (whether to make post-merger integration effort or not) for the acquiring firm and the target firm, we introduce an innovation information signal based on resource background into the multi-agent simulation process for the first time according to our knowledge, which effectively improves the static perspective in post-merger studies.
The paper is as follows: Section 2 is the basic global game model. It models firms’ behaviors in merger decision period, post-merger period and technology innovation period. With equilibrium analysis we show how resource similarity and resource complementarity can influence the integration degree and target autonomy. Section 3 is the simulation test. We first give the numerical simulation to ascertain the real cutoff points in the switching strategies. Furthermore, we test the optimal integration degree and target autonomy under different resource backgrounds to maximize innovation profits. Section 4 is the robustness checks. We first show whether changes to the key parameters—resource similarity and resource complementarity—can influence the model outputs. Then we analyze sensitivity for the parameters, considering single-factor and global changes as part of Latin Hypercube Sampling uncertainty test. Section 5 presents the discussion and conclusion, including limitations of the study and future work.
Basic Model
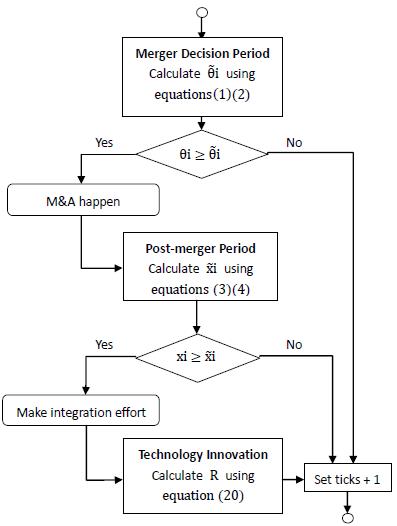
Merger activity contains three stages: the merger decision period, post-merger integration period and technology innovation after M&A. During a merger decision, there is public information about the potential innovation profit signal, and the two firms decide whether to merge. During post-merger integration period, the firms get their own private information about the innovation profit signal and choose whether to make the post-merger effort.
Merger decision period
In the M&A decision stage, there is a uncertain information, \(\theta\), indicating the post-merger innovation payoff in the market. In particular, \(\theta\) is based on the resource backgrounds (resource similarity and complementarity) of the two sides. Neither the acquirer nor the target knows the true value of \(\theta\), but a public information signal of the value is available. We set the public information using the uniform distribution: \(\theta \sim U(y+l,y-l)\), where \(y\) is the public signal and \(l\) stands for signal noise. Acquirer \(A\) makes a proposal to target company \(B\), and \(B\) chooses whether to take it or not.
We set the resource level of the firms, which is expressed as \(R^i\), \(i=A,B\). If the merger takes place, the merger gain is a combination of innovation gain, post-merger gain, and the merger cost, \(K_i\). If no merger takes place, the firms hold their own resource level without any change.
We set acquiring firm’s gain as \(\theta_A+(R^A+R^B)\lambda(\theta_A)-K_A\). Specifically, the merger payoff comes from merger innovation payoff \(\theta_A\) minus the fixed merger cost \(K_A\), which catches the conflicts in the integration process caused by giving the target firm some certain level of target autonomy. Post-merger payoff comes from the integration of the two firms’ resources in the form of \((R^A+R^B)\lambda(\theta_A)\), where \(\lambda(\theta)\) stands for the probability of integration, which depends on \(\theta_A\).
For the target firm, its merger payoff is given as \(\theta_B+R^Bw(\theta_B)-K_B\), where the first part stands for potential innovation payoff and the second stands for post-merger payoff, the probability of obtaining a certain level of target autonomy in dealing with its own resource \(R^B\). Here, the autonomy is given as \(w(\theta_B)\) and it is a function of \(\theta_B\), where acquirer A chooses to give the target company B some autonomy based on A’s expectation of the potential innovation profits that B can make. \(K_B\) is the fixed merger cost.
Post-merger integration period
If the two companies agree to make the deal, they come to the integration stage. In this stage, the acquirer knows the true value of the two companies’ resource backgrounds, and target company B knows its own true value. They get a private signal \(x_i=\theta + \epsilon_i\), where \(\epsilon_i \sim U(-l,l)\) and \(\epsilon_i\) is i.i.d.
Like Farrell and Shapiro (2001), we assumed that if the two sides both make an integration effort, their integration payoffs are \(V\). Otherwise, if either side or both does not make an effort, in these circumstances both sides can only gain non-synergy payoff which is \(\frac{V}{d}\). Here, \(d\) stands for resource complementarity and is based on Banal-Estañol and Seldeslachts (2011). We set \(d>2\).
The acquirer’s integration payoff is \(V+kr-dt\) if both make integration efforts. Here, \(k\) stands for resource similarity, and \(k>1\), \(r\) is a similar resource’s scale payoff. The target’s integration payoff is \(V-ke-dt2\). Similar resource integration transforms the resource from the target to the acquirer. Here, \(r\) and \(e\) stand for the acquirer’s gain and the target’s loss from the integration of a similar resource, respectively. And \(t1\) and \(t2\) stand for each company’s cost for integrating complementary resources. Since the target firm is more powerful and has a high level of technology, it integrates complementary resource more easily than the acquirer, and hence we set \(t1>t2\). Here we have \(V+kr-dt1<0\) and \(V+kr-dt1-dt2<0\), \(V-ke-dt1-dt2>0\). Thinking about helping the other side make integration effort with the complementary resource, the target has the ability to do so, but the acquirer does not have the incentive to do this because in technology sourcing overseas M&A the acquirer company has a comparative disadvantage over the target company in technology and production abilities.
Equilibrium analysis
We build a binary variable \(m\) and set \(m = 1\) if the merger happens and \(m = 0\) otherwise. The expected gain in the merger decision period \(\pi_i\) for a company is as follows:
| $$\pi A = m[\theta_A + (R^A+R^B) \lambda(\theta_A) - K_A] + (1-m)R^A$$ | (1) |
| $$\pi B = m[\theta_B + R^Bw(\theta_B) - K_B] + (1-m)R^B$$ | (2) |
The company chooses whether to engage in a merger according to \(m^{\star}=argmax \pi\). We then build a binary variable \(s\); if an agent makes an integration effort, \(s = 1\), and otherwise, \(s = 0\). The expected gain in the post - merger decision period for a company is as follows:
| $$s_A^{\star} = argmax\{s(V+kr-dt1-K_A) Pr(m=1|x_i,y)+(1-s)\Big[\frac{V}{d}-K_A Pr(m=1|x_i,y)\Big]\}$$ | (3) |
| $$s_B^{\star} = argmax\{s(V-ke-dt2-K_B) Pr(m=1|x_i,y)+(1-s)\Big[\frac{V}{d}-K_B Pr(m=1|x_i,y)\Big]\}$$ | (4) |
Company \(i\) has an integration strategy cutoff point \(\tilde{x_i}\): if \(x_i \geq \tilde{x_i}\), \(s^{\star}(x_i)=1\); \(x_i < \tilde{x_i}\), \(s^{\star}(x_i)=0\). In the post-merger integration process, company \(i\) makes integration effort only when \(x_i>\tilde{x_i}\). Its merger decision cutoff point is \(\tilde{\theta_i}\): if \(\theta_i \geq \tilde{\theta_i}\), \(m^{\star}(\theta_i)=1\); \(\theta_i < \tilde{\theta_i}\), \(m^{\star}(\theta_i)=0\). Similarly, company \(i\) decides to engage in a merger only when \(\theta_i \geq \tilde{\theta_i}\).
Given private signal \(x_i\) and public signal \(y\), for company \(\theta_i|x_i,y \sim U(x_i-l,x_i+l)\). Firm A will engage in the merger process only if its potential innovation payoff signal is higher than the merger switching strategy cutoff point (which is \(\theta_A \geq \tilde{\theta}_A\)). So the probability of firm A to engage in a merger is as follows:
| $$Pr(m=1│x_i,y)=Pr(\theta \geq \tilde{\theta}_A│x_i,y)=1- \frac{1}{2l}(\tilde{\theta}_A-x_i+l)$$ | (5) |
When the private signal satisfies \(x_i= \tilde{x}_A\) , the payoffs of whether an integration effort is made or not are of the same level[1]:
| $$(V+kr-dt1-K_A) Pr(m=1│x_i,y)=\frac{V}{d}-K_A Pr(m=1│x_i,y)$$ | (6) |
From equation (5) and (6), we get:
| $$\tilde{x}_A=\tilde{\theta}_A-l+2l \frac{V}{d(V+kr-dt1)}$$ | (7) |
When \(\theta_A= \tilde{\theta}_A\), the payoffs of whether engaging in a merger or not are of the same level:
| $$\tilde{\theta}_A+(R^A+R^B) \lambda(\theta_A)-K_A=R^A$$ | (8) |
Equation (8) is the same as:
| $$\tilde{\theta}_A=K_A+R^A-(R^A+R^B) \lambda(\theta_A)$$ | (9) |
In the integration stage, both sides know their true private signal \(\theta\) and they decide whether to make integration efforts or not in the post-merger integration period. If the acquirer company chooses to engage in a post-merger integration process which means \(x_A \geq \tilde{x}_A\), then the probability of making the integration effort by the acquirer company is as follows:
| $$\lambda(\theta_A)=Pr(X_A \geq \tilde{x}_A|\theta_A)=1-\frac{1}{2l}(\tilde{x}_A-\theta_A)$$ | (10) |
Equation (10) suggests that when \(\tilde{x}_A-\theta_A\) is larger, the post-merger integration probability is lower. In other words, compared to merger decision strategy \(\theta_A\), when post-merger integration cutoff point \(\tilde{x}_A\) is high, the acquirer company does not prefer to make a post-merger integration effort, which lowers the probability of integration. Equations (7), (9), (10) show that:
| $$\tilde{\theta}_A=K_A+R^A-(R^A+R^B)\Big[1.5-\frac{V}{d(V+kr-dt1)}\Big]$$ | (11) |
Firm B thinks the merger will happen according to a probability based on knowledge of the innovation signal.
| $$Pr(m=1│x_i,y)=Pr(\theta_B \geq \tilde{\theta}_B│x_i,y)=1-\frac{1}{2l}(\theta_B-x_i+l)$$ | (12) |
When private signal satisfies \(x_i=\tilde{x}_B\), the payoffs of whether an integration is made or not are of the same level, that is:
| $$(V-ke-dt2-K_B ) Pr(m=1│x_i,y)=\frac{V}{d}-K_B Pr(m=1│x_i,y)$$ | (13) |
Combine equations (12) and (13), we obtain equation (14):
| $$\tilde{x}_B=\tilde{\theta}_B-l+2l\Big[\frac{V}{d(V-ke-dt2)}\Big]$$ | (14) |
When \(\theta_B=\tilde{\theta}_B\), the payoffs of whether a company engages in a merger are of the same level:
| $$\tilde{\theta}_B+R^Bw(\tilde{\theta}_B)-K_B=R^B$$ | (15) |
Equation (15) is the same as:
| $$\tilde{\theta}_B=R^B[1-w(\tilde{\theta}_B)]+K_B $$ | (16) |
For company B, the concept of autonomy makes sense only when the M&A comes into the integration period. That gives the target a certain level of autonomy with a probability:
| $$w(\theta_B)=Pr(x_B \geq \tilde{x}_B)|\theta_B)=1-\frac{1}{2l}(\tilde{x}_B-\theta_B)$$ | (17) |
Equation (17) suggests that when \(\tilde{x}_B-\theta_B\) is larger, the target autonomy is lower. In other words, compared to merger decision strategy \(\theta_B\), when post-merger integration cutoff point \(\tilde{x}_B\) is high, the acquired company does not prefer to make post-merger integration effort. In this circumstance, the acquirer company would lower target autonomy by taking more controls over the production or sale process to compensate for the risks induced by target company’s effortless behaviors. With equations (14) (16) and (17) we get the following equation:
| $$\tilde{\theta}_B=K_B+R^B\Big[-0.5+\frac{V}{d(V-ke-dt2)}\Big]$$ | (18) |
Comparative statics
We conducted comparative statics analyses (Appendix A provides the maths and economic salience of the analysis) of Equations 10 and 17. Then, we determine some hypothesis about the integration and autonomy.
- H1. \(\frac{\delta\lambda(\theta_A)}{\delta k} > 0, \frac{\delta\lambda(\theta_A)}{\delta d} < 0\). As the resource similarity level between an overseas M&A target and acquirer increases, the probability that the acquirer makes an integration effort increases. When resource complementarity is high, the probability is lower.
- H2.\(\frac{\delta w(\theta_B)}{\delta k} < 0, \frac{\delta\lambda(\theta_A)}{\delta d} > 0\). In overseas M&As, when the resource similarity level increases, the probability that the target gets a certain level of autonomy decreases; With an increase in resource complementarity, the probability that a target receives autonomy increases.
- H3. \(\frac{\delta \lambda(\theta_A)}{\delta k \delta d} < 0\).The interaction between resource similarity and complementarity will decrease the degrees of integration.
- H4. \(\frac{\delta \tilde{x}_A}{\delta k} < 0, \frac{\delta \tilde{x}_A}{\delta d} > 0\). The post-merger integration cutoff point is lower when resource similarity increases and is higher when resource complementarity increases.
Technology innovation output after M&A
Let \(T\) represent the number of new innovation combination after the integration. The innovation output comes from the redeployment of the resources of the two firms. The integration process is built up on a search and matching[2] process according to the firms’ resource backgrounds. Given the theoretical and application literature[3] of the search and matching model setups, we choose the constant return Cobb-Douglas function:
| $$T=s(NbIb)^n(NsIs)^{1-n}$$ | (19) |
Here, \(n\) is the elasticity of search and matching behaviors to innovation combinations and \(n \in (0,1)\). Here, \(s\) stands for searching intensity, the degree of how intensive the searching behaviors are, and \(s>0\). \(Nb\), \(Ns\) is the proportion of total resource of the acquirer and the target. \(Nb = \frac{R^A}{R^A+R^B}\), \(Ns = \frac{R^B}{R^A+R^B}\).
Post-merger integration is a process of the redeployment of the resources of the two firms and can be described as the change rate of the resources in acquirer and target firms. \(Ib\), \(Is\) represents the change of the resources during the post-merger period, and they also stand for their abilities to integrate \(I = IbNb + IsNs\), \(I \in (0,1\). We set the integration degree of the M&A to be the weighted average of \(Is\) and \(Ib\) in the form of \(I = IbNb + IsNs\), \(I \in (0,1)\).We set the integration ability[4] of the M&A to be \(IA = Ib + Is\), which is the sum of the two firm’s integration abilities.
We set the integration costs during the technology innovation process to be a simple version of what was used by Kaul et al. (2016) in the form of \(C(IA)=\bar{t}d(IA)^2\) It satisfies \(C >0\) and \(C’’>0\). t ̅ is the average integration cost for complementary resources[5] . We set the technology innovation profit R as:
| $$R=T\theta_A-C(IA)$$ | (20) |
The first part is the multiplication of new innovation combination by the innovation output profit signal of the acquirer. As a whole, it stands for the innovation output revenue.
So far, we have provided an innovation-signal-based global game analysis of merger and post-merger switching strategy, considering both the acquirer’s and the target’s resource backgrounds, especially resource similarity and resource complementarity. A flow diagram is given in Appendix B to better understand the model. In the next section, we will use the global game model as the foundation of our multi-agent simulation and in return use the simulation result to validate our findings in this section.
Multi Agent Simulation
Simulation environment setups and agent behaviors
The paper is based on NetLogo 5.2.0, and Figure 1 provided a software graph. In the simulation environment, there is one target firm and one acquirer firm randomly distributed on 31 * 31 areas with their resource agents \(i = 1, 2, \dots H\), \(H > 15\). We use a purple circle to represent acquirer agents and a red square for target agents. According to NetLogo software, there are 100 color differences[6] between these two kinds of agents at the beginning.
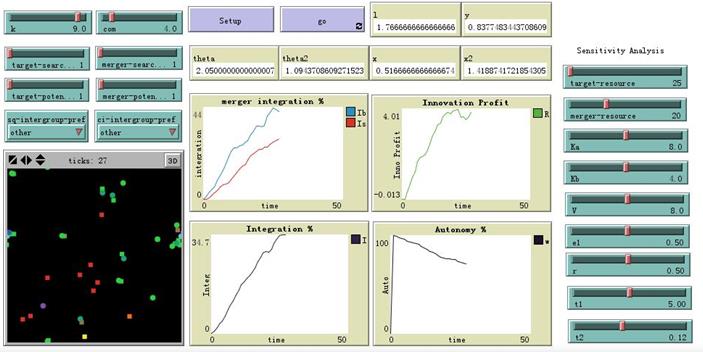
At the initialization, we give every agent a random number from uniform distribution \(U(0,10)\) to represent their signals about the innovation profit. We use the parameters about integration revenue, resource backgrounds and integration costs to obtain a set of numerical simulations of \(\theta_A\), \(\theta_B\), \(xa\) and \(xb\). Every time the agent randomly moved one step. Every simulation run lasts for 50 time ticks, which is able to lead the model outputs into a stable state. Each time, all agents searched for the other firm’s agents with one step distance and made merger or post-merger decisions with them. For all agents, if they were close within one step, we noted one encounter.
During an encounter, the agents compared their own signals with the numerical \(\theta\). If their signal was larger than the numerical one, they started to merge, and we counted one positive encounter; otherwise, we counted one negative encounter. For every agent, we totaled the positive encounters and the negative encounters. These encounters could provide private information about the signal for the agents when they made post-merger decisions. In the post-merger decisions, if the encounter number was larger than the numerical one, the agents started to make an integration effort and changed their color number by 10 units[7]; otherwise, they did not make the effort. After making one integration effort, they reset their encounter to 0.
Integration is measured by agents’ color-change proportion. After each simulation, we calculated the acquirer’s color-change proportion to be Ib and the target to be Is. Every time, we used and calculated equation (21) to get the integration degree I and equation (22) to get target autonomy level w as follows. Equation (23) gives the search intensity s:
| $$I=IbNb+IsNs$$ | (21) |
| $$w=1-Is$$ | (22) |
| $$s=\frac{xa^2+xb^2}{(xa+xb+1)^2}$$ | (23) |
Simulation parameters setup
As for the acquirer’s gain \(r\) and the target’s loss e from the integration of a similar resource, Banal-Estañol and Seldslachts (2011) set the cost to be uniformly distributed in [0.25, 0.75]. In post-merger integration period, the integration of similar resource can be seen as a transformation of the resource from the target to the acquirer. Thus, the acquirer’s gain r equals the target’s loss e from the integration of similar resource. We set \(e = r \in U(0.25, 0.75)\). For the post-merger cost of complementary resource \(t1\) and \(t2\), as target company has comparative advantages in technology sourcing overseas M&A, in the process of integration complementary resources, the target company faced a small cost compared with the acquirer company and it was lower than its loss of integration of the similar resources. We set \(t2 < e\) by \(t2 \in U (0.01, 0.25)\).
As for the integration cost of resource complementarity for the acquirer company \(t1\) and the integration payoff \(V\), we consider the setups of the theoretical models: \(V+kr-dt1<0\),\(V+kr-dt1-dt2<0\), \(V-ke-dt1-dt2<0\) and \(t1 > t2\) with all the resource similarity [1,10] and resource complementarity [2,10] satisfied. In the equilibrium, the payoff of integrating similar resources should be equal to integrating complementary resource. Taking \({k, d} = {10,2}\) for example, we have \(t1 > (V + 7.5)/4\) and \(10 * (0.5 + 0.5) = 2 * (t1 + 0.12)\). We get \(t1 \approx 5\). We make post-merger integration costs have the same range. We set \(t1 \in U (4.75, 5.25)\). Furthermore with a report of BCG[8], the success ratio of overseas M&A in China is only 67% and post-merger integration is the main problems resulting in merger failures. The profits of those successful integrations should be higher or equal to the costs of the failed integration, which is \(V = 100/23 Costs > 4*Costs = 4(0.5 + 0.5 + 5 + 0.12)/4\). That is \(V > 6\). In short we set \(V \in U (7.5, 8.5)\). In the basic model of simulation, we set the calibration parameters to be the mean of the distribution: \(r = 0.5\), \(e = 0.5\), \(t1 = 5\) \(t2 = 0.12\) and \(V = 8\). For the signal noise, we let \(l = 1\).
As for the initial resource of the two companies, recalling that in technology sourcing overseas M&A, target company has comparative advantages over acquirer company. We let \(H_A \in U (18, 22)\) and \(H_B \in U (23, 27)\). As for the merger costs, the acquirer company has a higher cost than the target company, so we let \(K_A \in U (7, 9)\) and \(K_B \in U (3, 5)\) .
In the basic model of simulation, we set the calibration parameters to be the mean of the distribution and we test the sensitivity of the parameters in the robustness check section, as part of Latin hypercube sampling analysis. In Appendix C we provide a complete list of the value, distribution, and calibration in the basic simulation model of all parameters.
We set the elasticity of innovation search and matching to be a function of the length of steps, \(fi\), from one move in the simulation as \(\frac{fa^2+fb^2}{(fa+fb+1)^2}\). In the simulation process we set the length of one move in one time tick to be 1; hence, the elasticity parameter is equal to \(n = \frac{2}{9}\). We let the parameter of searching intensity be a function of the post-merger integration cutoff points as \(s=\frac{xa^2+xb^2}{(xa+xb+1)^2}\). The more contacts and encounters the agents make, the larger the searching intensity would be.
Numerical simulation results
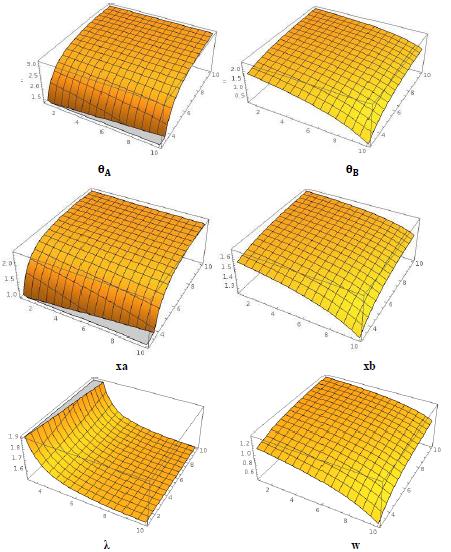
Figure 2 provides the numerical simulation results of \(\theta_A\), \(\theta_B\), \(xa\), \(xb\), \(\lambda\), and \(w\)in 3D form[9]. As for \(\lambda\), it moves in the same direction as resource similarity and is opposite of resource complementarity. From the graph, we can say the probability to integrate is the highest when resource similarity is high and resource complementarity is low. What is more, around those areas the curvature of the surface is the largest, and the surface is downward concave. The contour line of \(\lambda\) is upward sloping and divergent when resource similarity is high and resource complementarity is low, which means by increasing resource similarity and resource complementarity for one same unit the changes of \(\lambda\) becomes smaller. This suggests that resource similarity and resource complementarity have negative interaction effects on integration probability. Similarly to w, it moves in the opposite direction of resource similarity and in the same direction as resource complementarity. The post-merger integration cutoff point is lower when resource similarity increases and is higher when resource complementarity increases. So far, the simulation results match the comparative static in the theoretical model.
Multi-agent simulation results
Once the parameters are set, we focus on analyzing how resource similarity and resource complementarity influence post-merger integration, target autonomy, and innovation profit. We run the model 100 times using each set of parameters discussed below to account for stochastic variation and the output characteristics (such as mean and standard error). For each simulation, the run lasts for 50 ticks.
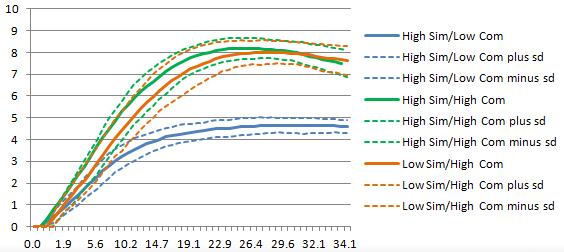
We give three different resource combinations to analyze agents’ behaviors, as seen in Table 1. Figures 3–7 report the simulation results, the full line is mean of the 100 runs and the dotted line is the range of one standard error.
| M&A combination | k | d | Observables | ||
|---|---|---|---|---|---|
| Series1 | High sim | Low com | 9 | 4 | |
| Series2 | High sim | High com | 9 | 9 | Ib, Is, R, I, w |
| Series3 | Low com | High com | 4 | 9 |
Figure 3 reports innovation profit of the 3 series. We can see the high-resource-similarity /low-resource-complementarity group has the lowest innovation profit level. The other two groups have rather high levels of innovation profit.
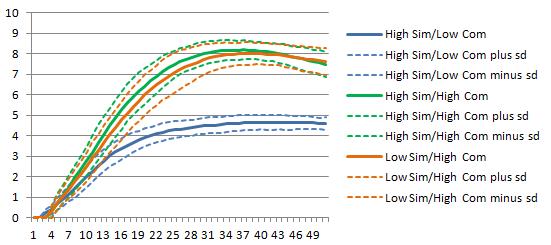
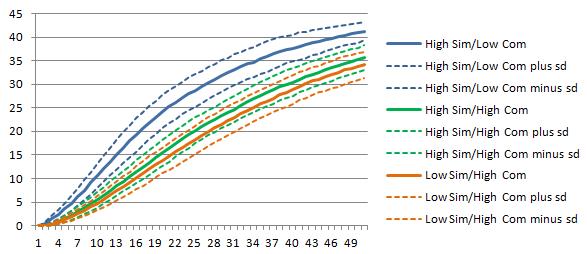
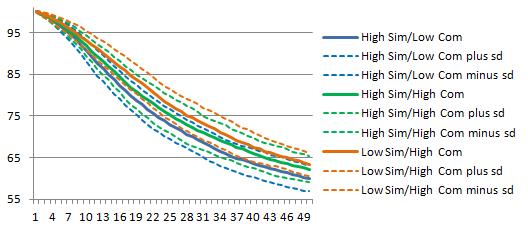
Figures 4 and 5 report integration degree and target autonomy results. For integration degree, high-resource-similarity/low-resource-complementarity has a higher integration degree than the other two groups. Considering target autonomy, there is no apparent difference in the whole simulation period of the three groups since the ranges of plus/minus one standard error of the three groups have some degrees of overlaps. But considering the mean of the 100 simulations, the low-resource-similarity high-resource-complementarity group has the highest target autonomy and the high-resource-similarity low-resource-complementarity group has the lowest target autonomy while high-resource-similarity high-resource-complementarity group has the medium autonomy level.
We move on to find the optimal post-merger strategy under different resource backgrounds that maximize the innovation profit. Figures 6 and 7 report how innovation profit changes with integration degree and target autonomy.
Now, we study the integration degree with the highest innovation profit in Figure 6. The high-resource-similarity low-resource-complementarity group reaches the highest innovation profit the fastest. Its optimal integration degree is around 21% with a highest innovation profit around 4.5. The integration degree for high-resource-similarity / high-resource-complementarity is around 25% and low-resource-similarity / high-resource-complementarity is around 28% which matches the comparative static results and shows resource similarity and complementarity has negative interaction effect on integration degree.
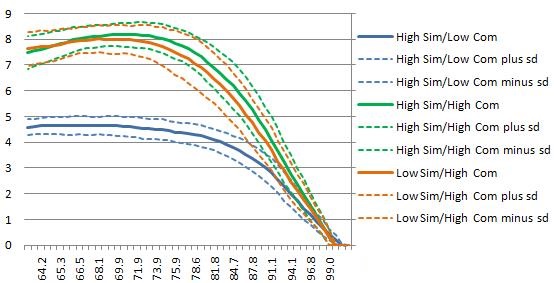
As in Figure 7, for high-resource-similarity/low-resource-complementarity, as target autonomy increases the innovation profit decreases. But for the other two groups, as target autonomy increases, innovation profit first increases and later decreases. So the optimal target autonomy of the two groups are higher than high-resource-similarity/ low-resource-complementarity group.
In sum, the simulation sections validate the comparative static results: In high-resource-similarity and low-resource-complementarity M&As, a high integration degree and low target autonomy will maximize innovation profit, while for the high-resource-similarity and high-resource-complementarity M&As, a medium-integration degree is best for innovation profit which shows the negative interaction effect on integration degree. For low-resource-similarity and high-resource-complementarity M&As, a low integration degree and high target autonomy will be the best post-merger strategy. In addition, the high-resource-similarity / low-resource-complementarity group has the lowest innovation profit level. The other two groups have a rather high level of innovation profit.
Robustness Checks
We consider the robustness of the model. We check in the following ways: First for the key parameters resource similarity and resource complementarity, we test whether the relationships of model outputs integration degree, target autonomy, innovation profit and resource backgrounds still remains when we change the resource background in their ranges with single factor variation. Second, as part of the parameters setups tests, we give the single parameter sensitivity test and global parameter sensitivity test as part of the Latin Hypercube Sampling uncertainty analysis. All the robustness checks are done with Behavior Space in NetLogo.
Robustness for key parameters: resource similarity
We set resource complementarity \(d = 4\) and change resource similarity from \(k = 1\) to \(k = 10\). Figures 8– 10 report the integration degree, target autonomy, and innovation profits of the simulations. For every set of parameters, the model runs for 100 times and we report the mean of the results. For each simulation, the run lasts for 50 ticks.
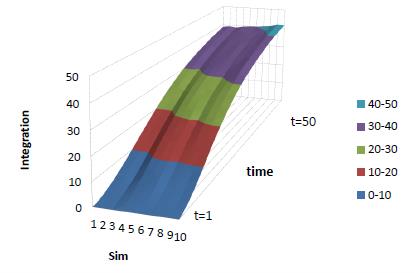
Figure 8 shows that the contour line of integration degree leans toward high-resource-similarity side which means that the higher the resource similarity, the higher the integration degree. Figure 9 shows that as resource similarity increases the contour line of target autonomy leans toward low resource similarity, which means when resource similarity increases, the target autonomy decreases. Figure 10 shows that when resource similarity increases, innovation profits decrease.
Robustness for key parameters: resource complementarity
We set resource similarity \(k = 1\) and changed resource complementarity from \(d = 3\) to \(d = 10\). Figures 11– 13 report the integration degree, target autonomy, and innovation profits of the simulations. For every set of parameters, the model runs for 100 times and we report the mean of the results. For each simulation, the run lasts for 50 ticks.
Figure 11 shows that the contour line of integration degree leans toward low resource complementarity, which means that the lower the resource complementarity, the higher the integration degree. Figure 12 shows that as resource complementarity increases the contour line of target autonomy leans toward high resource complementarity which means when resource complementarity increases, the target autonomy increases.
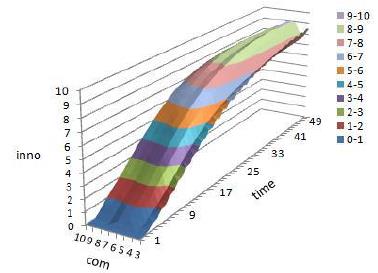
Figure 13 shows when resource complementarity is low, such as \(d = 3\) to \(d = 6\), the contour line of innovation profit leans toward low resource complementarity, which means when resource complementarity is low, innovation profit is low. The low resource complementarity of the two companies is disadvantageous to innovation output after M&A.
Sensitivity analysis
To analyze how single variation of the parameters changes the three outputs of the model, we show the sensitivity test results in Figure 14. The horizontal axis reports parameters series, with series 0 be the baseline model with all the calibration value and \(k = 5\), \(d = 5\). The matches of series numbers and the parameter are given in Table 2. To simulate the changes of the parameters, we give every parameter an upper and lower bound. For every given set of parameters, we run the model 100 times.
| Series horizontal axis | Parameter | Lower bound | Upper bound |
|---|---|---|---|
| 0 | Baseline model | None | None |
| 1 | Ha | 18 | 22 |
| 2 | Hb | 23 | 27 |
| 3 | Ka | 7 | 9 |
| 4 | Kb | 3 | 5 |
| 5 | e | 0.25 | 0.75 |
| 6 | r | 0.25 | 0.75 |
| 7 | V | 7.5 | 8.5 |
| 8 | t1 | 4.75 | 5.25 |
| 9 | t2 | 0.02 | 0.24 |
| 10 | k | 1 | 10 |
| 11 | d | 2 | 10 |
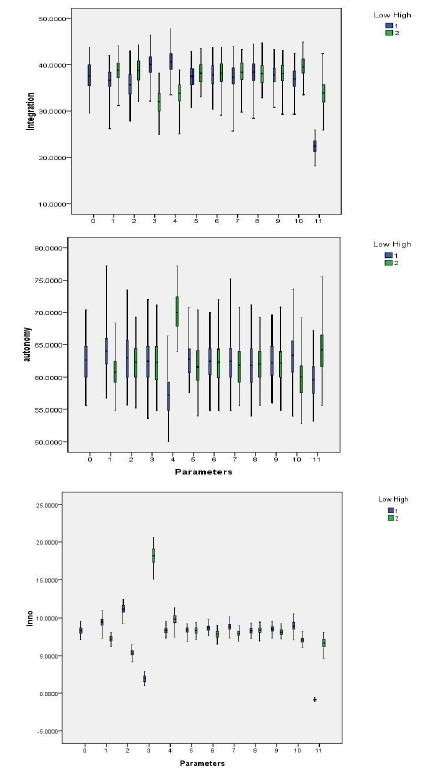
Compared with the baseline model series 0 in Figure 14, model output are sensitive to the changes of key parameters resource similarity (series 10) and resource complementarity (series 11).Variations in integration degree, target autonomy and innovation profit are small with the greatest variations in response to the following:
- Series 2 to innovation profit: a higher initial resource of the target company increases innovation profit and a lower initial resource of the target decreases innovation profit.
- Series 3 to innovation profit: a higher merger cost of the acquirer company decreases innovation profit and a lower merging cost increases it.
- Series 4 to target autonomy: a higher merger cost of the target company will increase the target autonomy level.
Latin hypercube sampling uncertainty test
In this section we test how global changes of the parameters affect model output. Latin hypercube sampling (Iman 2008) is suitable for testing the effects of jointly variations of the parameters. Continuous parameters are supposed to be uniformly distributed and divided into 10 same intervals to get 11 sample points. For each hyper sample points we run the model for 10 times and report the mean of the results. Considering there are 10 parameters in our model and this will lead to 11^10 hypercube sample points which is too large for simulation runs so we divide the parameters into five groups:
- Group 1 Initial resources: acquirer’s resource HA, target’s resource HB. Model runs 1.210 times.
- Group 2 Merger costs: acquirer’s merger costs KA and target’s merger costs KB. Model runs 1.210 times.
- Group 3 Post-merger costs: cost of integration complementary resource of acquirer \(t1\) and complementary resource of target \(t2\), loss of integration similar resource of target e. Model runs 13.310 times.
- Group 4, post-merger benefits: payoffs \(V\), unit benefits of integration similar resource of the acquirer \(r\). Model runs 1.210 times.
- Group 5 key parameters: resource similarity \(k\) and complementarity \(d\). Model runs 1.210 times.
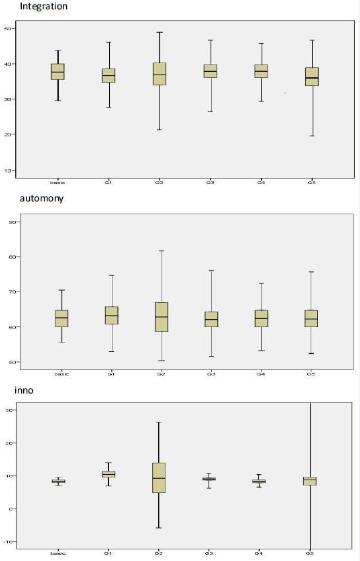
Figure 15 reports the results of Latin hypercube sampling tests. Group 2 and Group 5 have a large influence on integration degree. Merger costs and resource backgrounds also strongly influence output variations. Group 2 merger cost has a large influence on target autonomy. Group 1 initial resource, group 2 merger cost, and group 5 resource backgrounds have large influence on innovation profit. This indicates that merging cost, resource similarity, resource complementarity and initial resources should be well treated when making M&A and post-merger integration decisions.
Discussion and Conclusions
Post-merger plays a key role in technology-sourcing overseas M&As. We tried a multi-agent simulation based on an innovation signal global game model. Through analyzing different resource groups, we obtain the optimal integration strategy that maximizes the innovation profits.
We improve Banal-Estañol and Seldeslachts (2011) global model of M&A by introducing firm heterogeneity. We consider different payoffs of the acquirer and the target companies. Compared with existing studies of M&A simulation with perspectives of cultural integration (Zhu et al. 2013) and organizational complexity (Frantz & Carley 2009), we combine global game model with multi-agent simulation to show repetitive emergent dynamics of merger and post-merger integration processes on the perspective of resource similarity and resource complementarity and furthermore study post-merger integration’s effect on innovation performance.
Limitations
Due to lack of data of overseas post-merger integration, the model has the following limitations: First, most of the parameters are set according to existing literature and model setups together with sensitivity analysis. To overcome the complexity of the model and the limitation of data on real M&A cases, future analysis would benefit from more micro-data of the M&A surveys. Second, since the overseas M&As are heterogeneous, the merger costs or post-merger integration costs of different M&A cases would be very different, which makes the setting of parameter distribution a problem. Third, in our model, we set the parameter to be independently distributed, but in real cases some parameters may have correlations with each other and studying those parameters’ joint distribution would further improve the study.
Future works
In dealing with the theoretical model and multi-agent simulation, the paper may have some extensions as follows: First, we set the potential innovation signal to be exogenously decided between public information and private information. In fact, there are multiple chances that agents can obtain acquisition of information, and how they admire or evaluate that information is actually an endogenous process. Myatt and Wallace (2012) provided an innovative way to make the private or public level of the information endogenously decided by the agents instead of mechanically set via a binary choice. In future studies, we could take further steps to subdivide the resource in a similar or complementary way, which can provide different information channels that let the agents endogenously decide what kinds of resource similarity or resource complementarity he or she values the most. Moreover, we can relax the parameter constraints to allow more variable parameters in the simulation process instead of fixed ones.
Second, more data based on actual M&A cases would improve the simulation model in this study. Our model only focuses on one kind of agent’s behavior preference, contact with different resource agents. Other contacting or communication mechanisms could be added in future simulation frameworks, to make the effect of resource similarity and resource complementarity on post-merger integration endogenously set in agents’ behavior preference.
Third, other research methods of M&A simulation such as a social network could be used in future analysis of post-merger integration study. Frantz (2012) suggest that post-merger integration rebuilds the social networks of the companies. A combination of social network analysis and agent-based modeling in future simulation study would provide a new insight for M&A studies.
Conclusions
The paper draws the following conclusions: In technology sourcing overseas M&As, resource similarity has a positive relation with integration and a negative relation with target autonomy; however, resource complementarity and resource similarity have opposite effects. The negative interaction between resource similarity and complementarity will decrease integration degree. In high-resource-similarity and low-resource-complementarity M&As, strong integration and low target autonomy will maximize innovation profit; meanwhile, for high-resource-similarity, high-resource-complementarity M&A, a medium integration degree and target autonomy is best for innovation profit. For low-resource-similarity, high-resource-complementarity M&As, a low integration degree and high target autonomy will be the best post-merger strategy.
Acknowledgements
The authors are grateful for the support of key project of the National Social Science Fund (Z14AJY007), Key Projects of Zhejiang Province Natural Science (LZ14G020002).Notes
- We do not know if the merger decision cutoff point is larger or smaller than post-merger decision cutoff point. In the real world the post-merger period is always after the merger decision. So in the left part of equation (6), we let Pr(m=1) and multiply the whole bracket of the payoffs. In contrast with the right part of equation (6), we are not sure whether the merger takes place, and also we do not know whether the merger decision cutoff point is larger or smaller than the post-merger decision cutoff point. Therefore, we use the form non-synergy gains V/d minus the merger cost when the merger happens.
- Pissarides (1985) built the search and matching model to analyze workers and job offers. The search and matching model can modify the interaction of economic agents with friction in the market.
- For models of search and matching, see Romer (2000). For applications of using search and matching in agent-based simulations, see Zhang and Li (2014).
- Integration ability is based on Kaul and Wu (2016). In their paper, they analyze the abilities of the acquirer and target companies with a theoretical model in which two companies’ abilities can be added directly.
- Considering the integration revenue and cost for the acquirer and target, if r=e, the integration of a similar resource is a zero-gain action for the M&A unity. So here, when we consider integration costs in the innovation process, we do not cover integration cost for similar resources.
- NetLogo software provides color board with number from [0,140). It launches a number for each kind of color. Here, color (red) = 15, color (purple) = 115.
- The initial color of the acquirer is 115 with a positive encounter ≥ xa, we minus color by 10 and for negative encounter ≥ xa, we add color by 10; as for target, the initial color is 15 with a positive encounter ≥xb, we add color by 10 and for negative encounter ≥ xb, we minus color by 10.
- The Boston Consulting Group (BCG): Gearing up new era China outbound M&A Sep 2015 CHN.
- Notice that coordinate axis with 1-10 stands for resource similarity and that coordinate axis with 2-10 stands for resource complementarity. Axis of ordinates in the first 4 graphs stands for innovation signal value, and axis of ordinates in the last two stands for probability.
- We use equation (7), (11), (14), (18) in numerical simulation. Resource Ri’s unit is 10 agents which means Ri = Hi / 10. The NetLogo code of our simulation can be found at http://mqs1991.lofter.com/.
Appendix
Appendix A
Proof of Comparative Statics
Consider the model conditions: \(V+kr-dt1-dt2 < 0\), \(V-ke-dt1-dt2 > 0\), \(t1 > t2\), we get \(V+kr-2dt1 < 0\) and \(V-ke-2dt2 > 0\).
H 1: From equation (7) and (10): \(\lambda(\theta_A)=1.5-\frac{V}{d}(V+kr-dt1)\), let \(M1=d(V+kr-dt1)\), differentiate with respect to \(k\) and \(d\):
| $$\frac{\delta \lambda_A}{\delta k}=\frac{Vdr}{(M1)^2} > 0$$ |
| $$\frac{\delta \lambda_A}{\delta d}=\frac{V(V+kr-2dt1)}{(M1)^2} < 0$$ |
H 2: From equation (14) and (17): \(w(\theta_B)=1.5-\frac{V}{d}(V-ke-dt2)\), let \(M2= d(V-ke-dt-_2)\) differentiate with respect to \(k\) and \(d\):
| $$\frac{\delta w_B}{\delta k}=\frac{-Vde}{(M2)^2} < 0$$ |
| $$\frac{\delta w_B}{\delta d}=\frac{V(V-ke-2dt2)}{(M2)^2} > 0$$ |
H 3: \(\frac{(\delta \lambda)}{\delta k}=\frac{Vdr}{(M1)^2}=\frac{Vr}{d(V+kr-dt1)}^2\) differentiate with respect to \(d\), let \(M3=d(V+kr-dt1)^2\):
| $$\frac{\delta \lambda_A}{\delta k \delta d}=\frac{-(Vr(V+kr-dt1)(V+kr-3dt1)}{(M3)^2} < 0$$ |
H 4: From equation (11) differentiate \(\theta_A\) with respect to \(k\) and \(d\), we have \(\frac{\delta \theta_A}{\delta k} < 0\) and \(\frac{\delta \theta_A}{\delta d} > 0\). Differentiate equation (7) with respective to \(k\) and \(d\):
| $$\frac{\delta x_A}{\delta k}=\frac{\delta \theta_A}{\delta k}-2l \frac{Vdr}{(M1)^2} < 0$$ |
| $$\frac{\delta \lambda_A}{\delta d}=\frac{\delta \theta_A}{\delta d}-2l \frac{V(V+kr-2dt1)}{(M1)^2} > 0 $$ |
This view of information uncertainty provides new insight to analyze post-merger integration. Given the expected innovation outcomes and post-merger payoffs, resource similarity and complementarity will influence the switching strategy, or, in other words, the cutoff points of the strategies: As we increase the resource similarity of the two sides, post-merger effort switching points start to decrease. The acquirer will have a higher probability of making an integration effort. Resource complementarity has the opposite mechanism: increasing the resource complementarity of the two sides starts to increase the post-merger switching points. Such an increase means the firm will need a high expected innovation payoff to make an integration effort and will lower the probability of post-merger integration effort.
Appendix B
Appendix C
| Name | Calibration | Distribution | Source |
|---|---|---|---|
| H_B | 25 | U[23,27] | Sensitivity analysis |
| H_A | 20 | U[18,22] | Sensitivity analysis |
| n | 2/9 | Constant | \(\frac{fa^2+fb^2}{(fa+fb+1)^2}\) |
| s | \(\frac{xa^2+xb^2}{(xa+xb+1)^2}\) | / | Endogenously determined |
| V | 8 | U[7.5,8.5] | Sensitivity analysis, BCG report |
| r | 0.5 | U[0.25,0.75] | Banal-Estañol & Seldslachts (2011), Sensitivity analysis |
| e | 0.5 | U[0.25,0.75] | Banal-Estañol & Seldslachts (2011), Sensitivity analysis |
| t1 | 5 | U[4.75,5.25] | Model setups, Sensitivity analysis |
| t2 | 0.12 | U(0.01,0.25) | Model setups, Sensitivity analysis |
| K_A | 8 | U[7,9] | Sensitivity analysis |
| K_B | 4 | U[3,5] | Sensitivity analysis |
| k | (1,10 | [1,10] | Model setups ,Sensitivity analysis |
| d | (2,10) | (2,10] | Model setups, Sensitivity analysis |
| l | 1 | Constant | Model setups |
Appendix D
[10]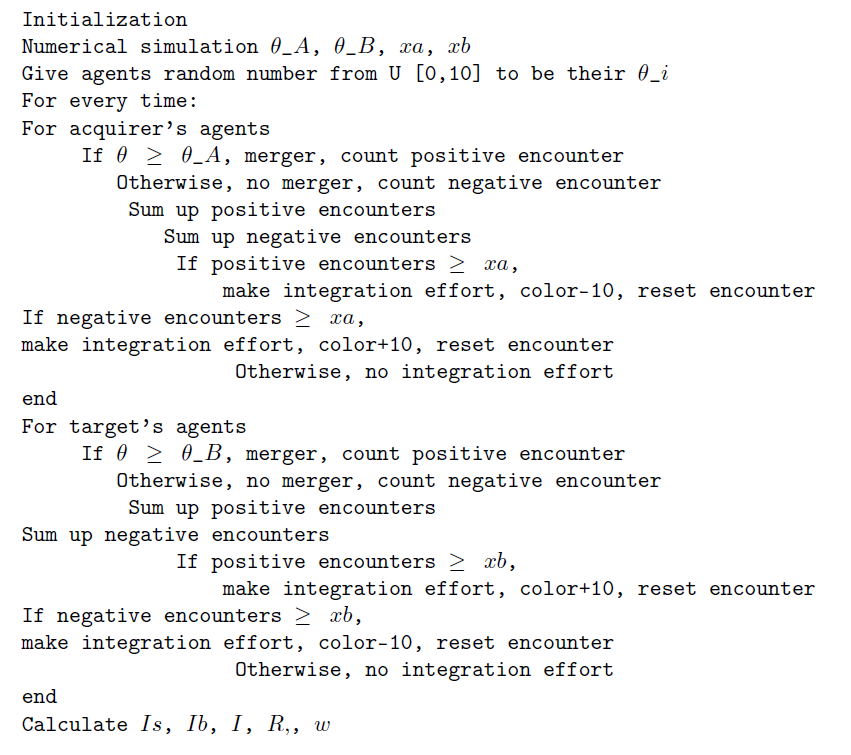
References
BANAL-ESTANOL, A., & Seldeslachts, J. (2011). Merger Failures. Journal of Economics & Management Strategy, 20(2), 589-624. [doi:10.1111/j.1530-9134.2011.00298.x]
BARNEY, J. B. (1991). Firm Resources and Sustained Competitive Advantage. Journal of Management, 17(1), 99-120. [doi:10.1177/014920639101700108]
BAUER, F., & Matzler K. (2014). Antecedents of M&A Success: the Role of Strategic Complementarity, Cultural Fit, and Degree and Speed of Integration. Strategic Management Journal, 35, 269-291. [doi:10.1002/smj.2091]
BENA, J., & Li, K. (2014). Corporate Innovations and Mergers and Acquisitions. Journal of Finance, 69(12), 1923-1960. [doi:10.1111/jofi.12059]
BONABEAU, E. (2002). Agent-based Modeling: Methods and Techniques for Simulating Human Systems. Proceedings of the National Academy of Simulation, 99(3), 7280-7287. [doi:10.1073/pnas.082080899]
CARLSSON, H., & van Damme, E. (1993). Global Games and Equilibrium Selection. Econometrica, 61(5), 989-1018. [doi:10.2307/2951491]
CARTWRIGHT, S. (2006). Mergers and Acquisitions: An Update and Appraisal. International Review of Industrial and Organizational Psychology, 20, 1–38.
CHATTERJEE, S. (2009). The Keys to Successful Acquisition Programmes. Long Range Planning, 42(2), 137–163. [doi:10.1016/j.lrp.2008.12.001]
COLOMBO, M. G., & Rabbiosi, L. (2014). Technological Similarity, Post-acquisition R&D Reorganization, and Innovation Performance in Horizontal Acquisitions. Research Policy, 43(6), 1039-1054. [doi:10.1016/j.respol.2014.01.013]
DATTA, D. K., & Grant, J. H. (1990). Relationships Between Type of Acquisition, the Autonomy Given to the Acquired Firm, and Acquisition Success: An Empirical Analysis. Journal of Management, 16(1), 29-44. [doi:10.1177/014920639001600103]
FARRELL, J. & Shapiro, C. (2001). Scale Economies and Synergies in Horizontal Merger Analysis. Antitrust Law Journal, 68, 685–710.
FRANTZ, T. L. (2012). A Social Network View of Post-Merger Integration. Advances in Mergers and Acquisitions, 10, 161-176. [doi:10.1108/S1479-361X(2012)0000010012]
FRANTZ, T. L., & Carley, K. M. (2009). Computational Modeling the Effect of Organizational Complexity on Post-merger Integration. In Cooper C. L., & Finkelstein, S. (Eds.) Advances in Mergers and Acquisitions, Volume 8, Emerald Group Publishing Limited, 79-101.
HASPESLAGH, P. C., & Jemison, D. B. (1991). Managing Acquisitions: Creating Value Through Corporate Renewal. New York: Free Press.
HOMBURG, C., & Bucerius, M. (2005). A Marketing Perspective on Mergers and Acquisitions: How Marketing Integration Affects Post-merger Performance. Journal of Marketing, 69, 95-113.
IMAN, R. L. (2008). Latin Hypercube Sampling Encyclopedia of Quantitative Risk Analysis and Assessment. John Wiley & Sons, Ltd.
KAPOOR, R., & Lim, K. (2007). The Impact of Acquisitions on the Productivity of Inventors at Semiconductor Firms: A Synthesis of Knowledge-based and Incentive-based Perspectives. Academy of Management Journal, 50, 1133-1155. [doi:10.5465/AMJ.2007.27169706]
KAUL, A., & Xun, W. (2016). A Capabilities-Based Perspective on Target Selection in Acquisitions. Strategic Management Journal, 37, 7, 1220–1239. [doi:10.1002/smj.2389]
KIM, J.Y., & Finkelstein, S. (2009). The Effects of Strategic and Market Complementarity on Acquisition Performance: Evidence from the US Commercial Banking Industry, 1989-2001. Strategic Management Journal, 30, 617-646. [doi:10.1002/smj.754]
LARSSON, R., & Finkelstein, S. (1999). Integrating Strategic, Organizational, and Human Resource Perspectives on Mergers and Acquisitions: a Case Survey of Synergy Realization. Organization Science, 10(1), 1–26. [doi:10.1287/orsc.10.1.1]
LUBATKIN, M., Florin, J. & Lane, P. (2001). Learning Together and Apart: A model of Reciprocal Interfirm Learning. Human Relations, 54(10), 1353-1382.
MAKRI, M., Hitt, M. A. & Lane, P. J. (2010). Complementary Technologies, Knowledge Relatedness, and Invention Outcomes in High Technology Mergers and Acquisitions. Strategic Management Journal, 31(6), 602-628.
MILGROM, P., & Roberts, J. (1995). Complementarities and Fit strategy, Structure, and Organizational Change in Manufacturing. Journal of Accounting & Economics, 19(2-3), 179-208. [doi:10.1016/0165-4101(94)00382-F]
MINTZBERG, H., Ahlstrand, B., & Lampel, J. (2008) Strategy Safari: Your Complete Guide Through the Wilds of Strategic Management. Prentice Hall Press.
MYATT, D.P., & Wallace, C., (2012). Endogenous Information Acquisition in Coordination Games. Review of Economic Studies, 79, 340-374. [doi:10.1093/restud/rdr018]
PABLO, A. L. (1994). Determinants of Acquisition Integration Level: A Decision-Making Perspective. Academy Management Journal, 37(4), 803-836. [doi:10.2307/256601]
PARUCHURI, S., Nerkar, A., & Hambrick, D. C. (2006). Acquisition Integration and Productivity Losses in the Technical Core: Disruption of Inventors in Acquired Companies. Organization Science, 17(5), 545-562. [doi:10.1287/orsc.1060.0207]
PISSARIDES, C. A. (1985). Short-Run Dynamics of Unemployment, Vacancies, and Real Wage. American Economic Review, 75(9), 676-690.
PURANAM, P., SINGH, H., & Zollo. (2006). Organizing for Innovation: Managing the Coordination-autonomy Dilemma in Technology Acquisitions. Academy of Management Journal, 49(2), 263-280. [doi:10.5465/AMJ.2006.20786062]
ROMER, D. (2000). Advanced Macroeconomics. McGraw-Hill.
SETH, A. (1990). Sources of Value Creation in Acquisitions: An Empirical Investigation. Strategic Management Journal, 11, 431-446. [doi:10.1002/smj.4250110603]
SINGH, H., & Montgomery, C. A. (1987). Corporate Acquisition Strategies and Economic Performance. Strategic Management Journal, 8, 377-386. [doi:10.1002/smj.4250080407]
WILENSKY, U. (1999). Netlogo.Center for Connected Learning and Computer-based Modeling, Northwestern University, Evanston,IL. http://ccl.northwestern.edu/netlogo/.
ZAHEER, A., Castaner, X., & Souder, D. (2013). Synergy Sources, Target Autonomy, and Integration in Acquisitions. Journal of Management, 39(3), 604-632. [doi:10.1177/0149206311403152]
ZHANG H., & Li, Y. (2014). Agent-Based Simulation of the Search Behavior in China’s Resale Housing Market: Evidence from Beijing. Journal of Artificial Societies and Social Simulation, 17(1) 18: https://www.jasss.org/17/1/18.html. [doi:10.18564/jasss.2360]
ZHU, H., Hu B., Wu J., & Hu X. L. (2013). Adaptation of Cultural Norms After Merger and Acquisition Based on the Heterogeneous Agent-based Relative-agreement Model. Simulations, 89 (12), 1523-1537.