
 Abstract
- The growing importance of links between the social and technical dimensions of the electricity infrastructure mean that many research problems cannot be effectively addressed without joint consideration of social and technical dynamics. This paper motivates the need for and introduces a tool to facilitate the development of linked social and technical models of electric power systems. The tool, called MatpowerConnect, enables the runtime linkage of Netlogo - an oft-used modelling platform in the social simulation domain - with Matpower - a common power flow simulation package in the power systems domain. MatpowerConnect opens up new modelling possibilities for social simulation researchers active in the study of electricity systems. It offers ease of use coupled with a high degree of realism with which electricity infrastructure functionality is captured. We describe the development and use of two demonstration models using MatpowerConnect. These models illustrate two types of problems and system scales that can be addressed. In the first model we explore the consequences of actors' adaptive strategies on the performance of a small-scale power system. In the second model we simulate the effects of different regulatory regimes on network investment in a supra-national electricity transmission system to explore the long-term consequences for network development and social welfare. In both cases, the extension enables capturing a critical functionality of electric power systems, while allowing model development efforts to focus on social simulation aspects. Resources for using the extension are provided in conjunction with this paper.
- Keywords:
- Socio-Technical Systems, Electricity Systems, Modelling Tools, Social Simulation, Netlogo, Matpower
Introduction
- 1.1
- Fuelled by concerns about climate change, the global electricity sector has embarked on a massive socio-technical transition – a shift to renewable energy sources and less carbon-intensive generation technologies (Chappin 2011; Perelman 1980; Verbong & Geels 2007). Efforts to realize this transition have sparked a number of pertinent questions spanning the social and technical domains: How can we encourage adoption of low-carbon technologies? How can we deal with strategic behaviour in liberalized electricity markets? How can we manage public concerns about new electricity generation and grid technologies?
- 1.2
- To address questions such as these, considerable effort has been expended in the development of advanced simulation tools to facilitate electric power system modelling efforts spanning the social and technical domains. These platforms and models have been used to assess the effectiveness of policies for stimulating transitions in energy generation (Batten & Grozev 2006; Chappin 2011; Weidlich & Veit 2008), to explore the diffusion of low-carbon technologies (Kieckhaefer et al. 2009; Schwoon 2006; Stephan & Sullivan 2004), and to test different power market designs (Bhagwat & de Vries 2013; Sun & Tesfatsion 2007). Simulation tools such as these have enabled significant progress with respect to the questions noted above. However, further progress hinges partially on our ability to more tightly couple knowledge in the social and technical domains – to gain a deeper understanding of the relationships between social and technical dynamics and their consequences. This coupling can be facilitated by linking the tools and resources of these domains.
- 1.3
- Efforts to couple detailed representations of the social and physical world are not uncommon in the social simulation field. One of the most active such areas has involved the development of hybrid socio-economic/biophysical models, incorporating agent-based models linked with biophysical models such as hydrology models, nutrient dynamics models, soil fertility models and crop growth models (Bakam & Matthews 2009; Bithell & Brasington 2009; Giacomoni & Zechman 2010; Janssen & de Vries 1998; Matthews & Bakam 2007; Mauser & Ludwig 2003; Schreinemachers & Berger 2011). One specific example is the Artificial Anasazi model of Axtell et al. (2002), which incorporates interactions between households and a physical landscape with specific soil compositions and hydrological characteristics (Dean et al. 2000).
- 1.4
- The coupling of social and physical models is essential to the future sustainability, reliability and resilience of electric power systems. The liberalization of electricity markets and the drive towards renewables-based generation are inciting a shift towards a more bottom up structure of electricity systems. This means that electricity supply is increasingly determined by the distributed decisions of numerous actors to invest in and deploy (distributed) generation technologies. The interactions of these actors with one another – in social networks, markets and organisations – will influence and be influenced by the physical infrastructure. Insofar as electricity networks act as essential mediators of and constraints on electricity supply and demand, their technical functionality is essential to understanding possibilities for realizing more sustainable, reliable and resilient electric power systems.
- 1.5
- In this paper we introduce a tool for developing coupled social and technical representations of electric power systems. The tool, called MatpowerConnect, enables the runtime linkage of Netlogo – an oft-used modelling platform in the social simulation domain[1] – with Matpower – a common simulation package in the power systems domain[2]. Both Netlogo and Matpower are actively used and well-documented, and are freely and readily available to researchers. In enabling runtime linkage of these pieces of software, we endeavour to enhance the ability of social scientists working on electricity sector topics to more easily and effectively incorporate pertinent technical considerations of power systems.
- 1.6
- In the remainder of this paper, we introduce the MatpowerConnect tool in more detail and describe two models employing this tool. Our aim is two-fold. First, we seek to provide social simulation researchers with sufficient knowledge to effectively employ MatpowerConnect in their own research. Second, we seek to illustrate the potential of this tool to contribute in meaningful ways to the study of socio-technical electricity systems. We continue in the following section with a brief introduction to key power systems concepts underlying the developed tool.
Overview
of relevant power systems concepts
- 2.1
- Electric power systems are the infrastructures responsible
for allocating, producing, transporting, and using electric power. In
this section, we provide a brief introduction to key electric power
systems concepts necessary for understanding and using the developed
tool. These concepts also form the basis for the demonstration models
described later in this paper. Electric power systems may be
conceptualized as socio-technical systems, consisting of interacting
technical and social subsystems (Bijker
et al. 1987; Geels 2005;
Sovacool 2009).
Figure 1 illustrates the types
of social and technical components of a typical electric power system
and the links between them. In the paragraphs that follow, we describe
the composition of the power system’s social and technical
subsystems.
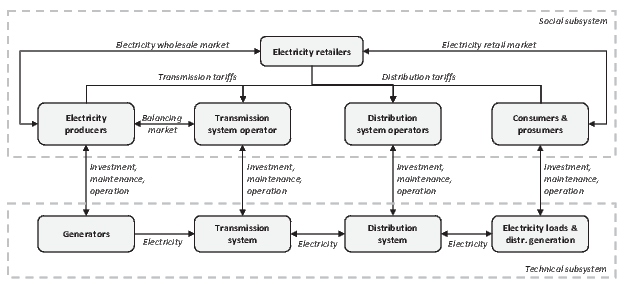
Figure 1. Socio-technical structure of a typical electricity infrastructure. The technical subsystem
- 2.2
- Power systems consist of numerous technical components
which may be linked with one another in different ways. The technical
components of a typical power system include:
- Power plants of different types (e.g. coal plants, gas turbines, wind turbines, solar arrays), each consisting of one or more electricity generation units
- Power lines and cables with different transport capacities and operating at different voltage levels
- Loads (power consuming devices or facilities) with different time-dependent demand profiles
- Transformers, which step up or down the voltage of the power flowing through them
- Busbars (buses), which split power flows in multiple directions
- Supplementary equipment, including e.g. circuit breakers and reactive power compensation devices
- 2.3
- The technical components of power systems are normally divided into two distinct subsystems – the transmission system and the distribution system. When power systems emerged in the former half of the 20th century, they were separated into islands consolidated around demand centres, each managed independently and providing for its own demand. These grids form the basis for today’s distribution systems. Transmission systems slowly emerged to link these disparate networks into unified regional, national and even supra-national power systems. In today’s electricity systems, the transmission system is largely responsible for the bulk transfer of electricity from large generators to electrical substations in the vicinity of demand centres, and the distribution system for the transfer of electricity from the transmission system directly to consumers.
- 2.4
- The different roles of these two systems have consequences for the manner in which they are operated and structured. Transmission systems are normally operated at higher voltage levels (more than 100kV) and incorporate high levels of structural redundancy, e.g., by using ring structures. Distribution systems are normally operated at lower voltage levels (less than 100 kV) and are often structured radially. With the advent of small-scale distributed generation, the purely hierarchical/vertical relationship between transmission and distribution systems is becoming less applicable, with a greater proportion of electricity being produced within distribution systems themselves and the transmission system taking on more of a horizontal balancing role (Schavemaker & van der Sluis 2008).
- 2.5
- Unlike other energy carriers such as oil and natural gas, electricity cannot be stored[3]. This means that the magnitude of production and consumption in a power system must essentially match at all points in time. Technically, this is accomplished by the ramping up and down of variable output generation units, a task complicated by the growing penetration of renewables-based technologies such as solar panels and wind turbines with inherently intermittent and unpredictable output.
- 2.6
- Electricity flows through the lines and cables of the
transmission and distribution system at any point in time are the
emergent product of the real-time magnitude and geographical
distribution of electricity consumption and generation. For the most
part, the pattern of flows is determined by the physical
characteristics of the power system’s components and structure, and
cannot be actively directed by the system’s operators. Importantly,
this means that the capacity of power lines (a function of their
thermal properties and the conductor thickness) must be sufficient to
deal with the full range of possible power flow patterns that may be
produced by different production and consumption regimes, also under
extreme conditions.
The social subsystem
- 2.7
- The technical subsystem of the power system is designed,
operated, maintained and used by a variety of actors, each of whom
interacts with certain components of the technical subsystem and with
other actors
within the social subsystem. Prior to electricity market liberalization
processes, which began in Europe roughly in the 1980s (Glachant & Ruester 2013),
many of the responsibilities involved in supplying electricity to
consumers were bundled within a single actor, the electric utility. As
a consequence of liberalization, these responsibilities have become
increasingly fragmented amongst a range of (interacting) actors.
Important social components (actors) in a liberalized power system
include:
- Consumers, including household, commercial and industrial consumers
- Power producers, who are the owners and operators of power plants and generators
- A transmission system operator (TSO), who is the owner and operator of the transmission system
- Distribution system operators (DSOs), who are the owners and operators of distribution systems
- Electricity retailers, who sell electricity to consumers
- Governments, who define the rules of the game
- Regulatory agencies, who oversee the implementation of power system regulations
- 2.8
- Each of these actors interacts with different portions of the technical subsystem – consumers deal primarily with loads, producers with generators/power plants, and DSOs and TSOs with the components of the distribution and transmission systems, respectively. These actors interact with one another largely in the context of electricity markets, including: (1) spot markets, in which producers offer their output to retailers on different timeframes; (2) retail markets, in which consumers sign supply contracts with retailers; and (3) balancing and ancillary services markets, in which TSOs buy and sell electricity in order to maintain real-time balance between supply and demand.
- 2.9
- The dominant structures of the social subsystem are currently being challenged by the growing role of “prosumers” – consumers with distributed generation capabilities. While prosumers (currently) normally do not directly participate in traditional electricity markets, the electricity they produce can significantly influence the physical system. The institutions and processes governing the participation of prosumers in future energy systems and markets are still in flux, but have the potential to disrupt the dominant structures. This is an active area of current research and debate (Bompard et al. 2015; Rickerson et al. 2014).
- 2.10
- Importantly, the actions of prosumers and other actors within the social subsystem are not independent of one another, but may be heavily influenced by social factors. The interactions of consumers within the context of their social networks may, for instance, facilitate or hinder the diffusion of electricity consuming or producing technologies (e.g. electronic devices, electric vehicles, solar panels) (Jager et al. 2014; Noll et al. 2014). And they may determine when, where and how certain electricity loads (e.g. electric vehicles) are deployed. Next to this, the institutional forms in which prosumers choose to organize themselves – e.g. community energy systems, virtual power plants, cooperatives – may significantly influence their interactions with other actors and with the technical subsystem.
The need
for linked social and technical models of electric power systems
- 3.1
- Links between the social and technical dimensions of the electricity infrastructure mean that many research problems cannot be effectively addressed without joint consideration of social and technical dynamics. The overall structure of the socio-technical infrastructure is an emergent outcome of underlying social processes and technical design parameters, interacting through a coupled fitness landscape (Kauffman & Johnsen 1991). Changes in the social realm – e.g. institutional changes, new forms of organization – may affect the relative fitness of different technical (network) configurations. Likewise, changes in the technical configuration of the network may affect the fitness of the properties and dynamics of the social system – e.g. the partnerships, strategies and financial performance of actors.
- 3.2
- Electricity transmission and distribution systems are key elements of the electric power system. As mediators between electricity supply and demand, the properties of these systems influence and may be influenced by developments within the social subsystem. An example of this is the recent grid congestion issues created by rapid increases in rooftop solar installations in Hawaii. In recent years, federal and state market subsidies made rooftop solar installations very attractive for consumers, leading to high penetration rates in a relatively short period of time (Mulkern & ClimateWire 2013). However, the technical properties of the distribution system in Hawaii meant that, at some point, this system struggled to accommodate the growing influxes of solar power. This constraint provoked the sudden implementation in 2013 of institutional changes limiting the grid connection of new solar installations in Hawaii. The controversy around this decision, in turn, has driven the drafting of legislative action to deal with the issue from a longer-term perspective, and will likely lead to future institutional and technical changes influencing the further development of the Hawaiian power system, and perhaps elsewhere (Mulkern & ClimateWire 2013).
- 3.3
- Another example is the recent growth of (onshore and offshore) wind power combined with a nuclear phase-out in Germany. Large amounts of wind capacity have been installed in, predominantly, northern Germany, while a large portion of the country’s nuclear generation capacity, which is located predominantly in the south as is a large part of the load, has been decommissioned or will be by 2022 (Ederer 2015; Lechtenböhmer & Samadi 2013). These events increase the need for electricity transports from the north to the south, but expanding the transmission grid to accommodate this need has proven difficult due to public opposition against new transmission infrastructure.
- 3.4
- Sequences of events such as these cannot be understood without adequate comprehension of both the social and technical dynamics underlying the development of electric power systems. Effective modelling of technology diffusion coupled with accurate modeling of the technical functionality of the grid could have foreseen the situation in Hawaii and prevented the necessity for emergency measures. Both of these are active areas of modelling and research in the social simulation and power systems domains, respectively (Fang et al. 2015; Jager et al. 2014). It is a lack of coupling of research in these domains that hinders progress in this direction.
- 3.5
- The events currently playing out in Hawaii and Germany are just two of many possible scenarios in which coupled representations of social and technical power system dynamics could be advantageous. Bottom up developments in the electricity sector mean that the technical operation of the power system will, more than ever, be determined by the aggregate actions of numerous actors (e.g. prosumers) influenced by various forms of social interaction. In order to understand likely influences on the technical system, it is essential to understand how various patterns of social interaction may lead to certain patterns in the installation and deployment of power system technologies. How may learning effects influence the societal diffusion of renewable generation technologies, and what problems may this pose for the functionality of the infrastructure? What are the likely temporal and spatial patterns of electric vehicle charging, given likely social correlations between the movements and activities of drivers, and how can these patterns be efficiently managed and effectively influenced by grid operators? Likewise, constraints on the technical operation of the power system will inevitably influence the nature of social interaction and the emergent social phenomena observed. Under what conditions might restrictions on the grid connection of residential solar arrays encourage large-scale “grid defection” on the part of consumers? Progress on these topics is fundamental to the development of sustainable energy systems, and cannot be addressed without the coupling of detailed social and electric power system models.
MatpowerConnect
- description of the tool
- 4.1
- Power flow analysis is a tool commonly employed by power system engineers in planning expansions and optimizing the use of existing infrastructure. It is a numerical technique which takes the properties and configuration of a power system as input and uses Kirchhoff’s laws to calculate power flows and voltages in the technical components of the specified system. Numerous software tools are available for performing power flow analyses and variations of them. One such tool is Matpower – a MATLAB-based simulation tool (a package of MATLAB M-files) for solving power flow and optimal power flow problems, originally developed at Cornell University in the context of the PowerWeb project (Zimmerman et al. 2011).
- 4.2
- Accompanying this paper, we offer a Netlogo extension – called MatpowerConnect – for performing power flow analyses. Documentation and executables for the MatpowerConnect extension are provided in conjunction with this paper. Readers interested in making use of the developed tools are referred to Appendix B – Getting started with the MatpowerConnect extension. The extension takes as input the properties and configuration of a power system instantiated in Netlogo and provides as output data about real and reactive power power flows, and voltage magnitudes and angles, under the specified conditions. The extension uses Matpower’s M-files for solving the power flow equations, but runs these files in the freely available, open source MATLAB clone GNU Octave. This set up obviates the need for proprietary software in utilizing the extension. To demonstrate the validity of the extension, a comparison of results from the MatpowerConnect extension and directly from Matpower are offered in Appendix C.
- 4.3
- The runtime workflow of the MatpowerConnect extension is
illustrated in Figure 2. The
extension consists of
two key components. The first of these is a set of Java classes, which
(1) open a GNU Octave session, (2) translate the Netlogo inputs into a
form understandable to GNU Octave, (3) pass these inputs to GNU Octave,
(4) accept outputs from GNU Octave, (5) pass these back to Netlogo and
(6) close the GNU Octave session. The second key component is a MATLAB
M-file which accepts inputs from the Java classes and and
calls on Matpower to solve the power flow equations. This M-file –
PowerFlowWrapper.m – also adds an important layer of functionality to
the MatpowerConnect extension by enabling the simultaneous processing
of multiple networks. Upon receiving an input from Netlogo,
PowerFlowWrapper.m first identifies
and separates the constituent networks and processes these sequentially
using Matpower. This means that multiple networks (or isolated
components within a single network) can be effectively handled by the
extension. While the above-noted Java classes are compressed into a JAR
file, PowerFlowWrapper.m is uncompressed and can easily be edited by
any user familiar with the MATLAB language. This allows users to modify
and extend this code, and to take advantage of Matpower’s advanced
features, including AC power flow calculations and optimal power flow
analysis.
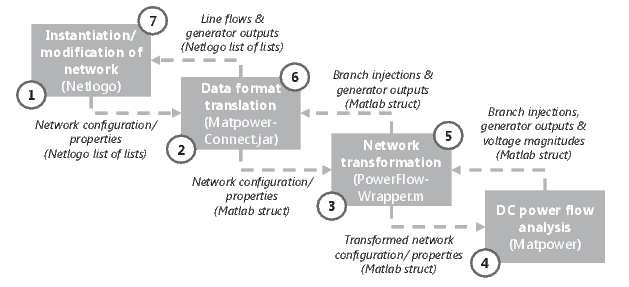
Figure 2. Runtime workflow of the MatpowerConnect extension. Each timestep of a Netlogo simulation (or at an alternately specified interval), the extension (1) takes an electricity network instantiated in Netlogo, (2) translates the network description to a Matlab readable format, (3) transforms the network description into a format readable by Matpower, (4) initializes a power flow simulation, (5) parses the results from the power flow simulation, (6) translates the parsed results to a Netlogo-readable format, and (7) passes the results back to Netlogo. - 4.4
- In its current form, the MatpowerConnect extension imposes some limitations on the flexibility of users in performing power flow analyses. While Matpower is capable of performing both AC and DC power flow analyses[4], as well as optimal power flow calculations, the extension limits users to DC power flow analyses. Due to their non-linear nature, AC power flow analyses are slower and the calculations are prone to non-convergence compared with DC analyses. The DC power flow problem is a simplified version of the AC problem which ignores the reactive power component of a power flow and assumes negligible line resistance. While under certain conditions DC power flow analyses are less accurate than AC analyses, power flows in an AC network can often be approximated adequately with a DC power flow calculation. In limiting the user to a DC power flow approximation, we have chosen the faster and more robust, but less accurate option for calculating the electric power flows through an AC network.
- 4.5
- By linking a leading social simulation software with a robust and commonly used power system engineering tool, the MatpowerConnect extension provides a bridge between the worlds of social scientists and power system engineers. While suitable for researchers unfamiliar with power systems concepts, the tool may also facilitate joint model development efforts by social simulation and power systems researchers. In the sections that follow, we illustrate the use of this extension via two demonstration models.
Demonstration
model 1 – adaptive strategies in power system performance
- 5.1
- This section introduces a simple demonstration model that
makes use of MatpowerConnect.
The model is implemented in Netlogo 5.0 and can be downloaded from
GitHub at
https://github.com/ABollinger/MatpowerConnectDemonstrationModel.
As described in Appendix
B, this model may serve as a template for social simulation researchers
seeking to make use of MatpowerConnect. The purpose of this model is to
explore the consequences of actors’ adaptive strategies on the
performance of a simple power system.
Model design
- 5.2
- The elements of the model are divided into a social subsystem and a technical subsystem. The social subsystem is composed of three types of actors (represented as agents) – electricity consumers, electricity producers and a grid operator. The technical subsystem is composed of four different types of technical infrastructure components – loads (electricity consuming devices/installations), generators, power lines and buses (nodes in the power grid). The configuration of these components and their initial properties are set using the IEEE 14 bus test case, which represents a portion of the Midwestern US electricity transmission grid[5]. Only the capacities of power lines are not set in accordance with the test case, as they are not specified in the test case data. By way of IEEE test cases, MatpowerConnect offers a linkage to (standard) datasets that detail electricity transmission networks (see Appendix A for an explanation of IEEE Power System Test Cases).
- 5.3
- Each time step during the course of a simulation, electricity consumers demand electricity and electricity producers use their generators to supply this electricity. The amount of electricity demanded by each consumer increases by a user-determined percentage each time step, and has a small random component. The electricity is transported from producers to consumers by way of a network of power lines and buses – an abstracted power grid. The flows through the lines in this network are calculated each time step using the MatpowerConnect extension.
- 5.4
- Producers’ ability to provide for the demand of consumers is limited by the generation capacity available to them – they are only able to increase their power output to the maximum output capacity of their generators. Similarly, the ability of the grid operator to transport power from producers to consumers – from generators to loads – is limited by the capacity of his power lines. The lines of the power grid are not able to transport more power than their capacities allow. If the power flowing through a line exceeds its capacity, the line fails and is considered to be out of service for a given number of timesteps.
- 5.5
- These restrictions within the technical subsystem limit the performance of the system as consumer demand increases. Performance of the system is expressed in terms of mean consumer satisfaction – the ratio of the power received by a consumer within a given time step to the power he demanded that time step. Consumer satisfaction thus drops when generator and grid constraints limit the capacity of the technical infrastructure to provide for demand.
- 5.6
- The agents of the social subsystem have been endowed with
several adaptive responses that allow them to improve the system’s
performance. Producers can increase the output capacity of their
generators if aggregate demand begins to exceed aggregate supply;
consumers can decrease their demand in response to impending
electricity shortfalls; and the grid operator
can increase the capacity of specific power lines as their power flow
approaches their maximum capacity[6].
When performance of the system begins to deteriorate, these adaptive
responses allow the agents of the social
subsystem to use their individual points of leverage over the technical
subsystem to bring performance back to acceptable levels.
Model results
- 5.7
- Figures 3, 4, 5
and 6 illustrate the results of
several runs of the model under different conditions. In each case, the
simulation has been run for 100 time steps, consumer demand increases
by 3% each year, and four metrics are tracked – total consumer demand,
aggregate generation capacity, power flows and consumer satisfaction.
Figure 3 illustrates the
results of the model under conditions in which the adaptive responses
of all agents of the social subsystem have been de-activated. In this
case, consumer demand increases exponentially, and power flows follow
suit as an increasing amount of electricity is transported from
generators to loads. At the point at which total consumer demand
exceeds generation capacity, the amount of
power received by consumers begins to fall short of their demand and
consumer satisfaction begins to drop. The technical subsystem has
reached saturation, and no additional power can be produced.
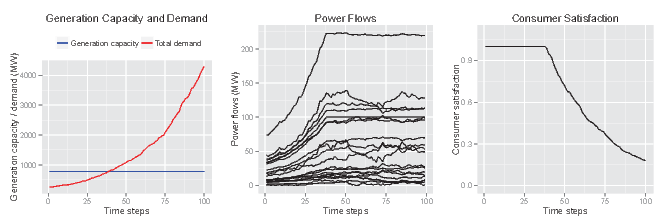
Figure 3. Results of the demonstration model for a case with no adaptive responses on the part of the agents. - 5.8
- Figure 4
illustrates the results of the model under conditions in which the
adaptive response of producers has
been enabled. When consumer demand begins to exceed generation
capacity, producers respond by increasing the capacity of their
respective generators. As a result, generation capacity is able to keep
pace with consumer demand, and no longer drives down system
performance. But the system soon reaches another limitation – the
restricted capacity of power lines. As soon as flows through one of the
power lines exceeds its capacity, the line fails and is decommissioned
for several time steps. As a result of this line being decommissioned,
flows through the other lines increase as power seeks an alternative
route. These increases cause more lines to fail, which, in turn,
increases flows through other lines, causing some of them to fail, and
so on. This is the classic dynamic of a cascading failure – a single
fault in one corner of a system spreads until the entire system is
incapacitated. This pattern of cascading failure repeats itself for the
duration of the simulation – lines come back online, but are soon
brought down again as flows exceed their capacity. The performance of
the system (expressed as consumer satisfaction) suffers accordingly.
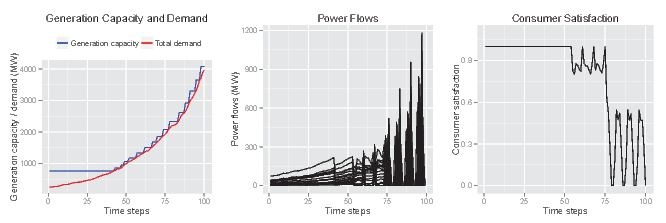
Figure 4. Results of the demonstration model for a case including an adaptive response on the part of producers. - 5.9
- Figure 5
illustrates the results under conditions in which the adaptive
responses of both producers and the
grid operator have been enabled. In this case, not only does generation
capacity keep pace with demand, but line capacities also keep pace with
power flows. Each time the flow through a line begins to approach its
capacity, the grid operator increases the capacity of the line. As a
result, the performance of the system remains high through the duration
of the simulation, despite exponentially increasing demand. The
managers of the infrastructure – power producers and the grid operator
– are successfully adapting the technical subsystem to meet the demands
of consumers.
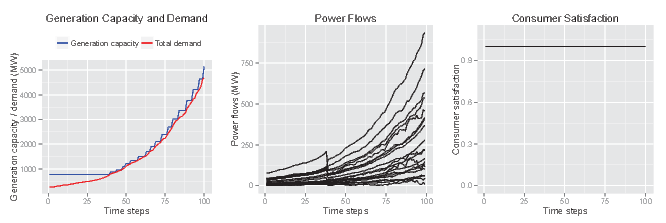
Figure 5. Results of the demonstration model for a case including adaptive responses on the part of both the grid operator and producers. - 5.10
- Figure 6 shows the
results of a case in which the adaptive responses of producers and the
grid operator have been disabled, but consumers are given the capacity
to modulate their demand in response to impending shortfalls in
generation or grid capacity. When producers or the grid operator notice
an impending deficit of generation or grid capacity, they send a
message to consumers, who respond by reducing their demand. This is
roughly analogous to a situation of demand response, in which consumers
displace electricity demand in response to price signals indicating
power shortages. As a result of this adaptive response on the part of
consumers, a high level of system performance is maintained throughout
the duration of the simulation.
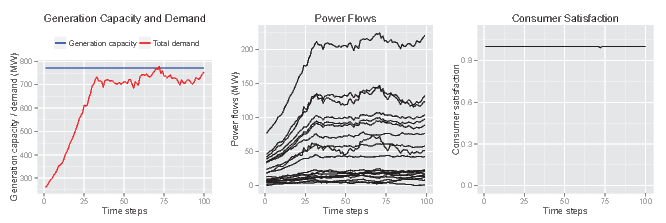
Figure 6. Results of the demonstration model for a case including an adaptive response on the part of consumers. - 5.11
- This model illustrates a relatively simple application of the MatpowerConnect extension, and illuminates possibilities for using the extension to study the operation of power systems under different conditions. In particular, the author has used this extension to explore the resilience of an electricity infrastructure under extreme weather conditions, considering the possible adaptive responses of various actors (Bollinger 2014). In this case, the extension allows for a realistic representation of the response of the technical system to changes in electricity demand, and to the adaptive responses on the part of actors. While this level of realism is not always essential, many problems (see examples above) may benefit from a realistic representation of power system dynamics. We continue in the following section by describing a model that uses the extension in a different way – to study the long-term development of a supra-national power system.
Demonstration
model 2 – development of the North West European transmission system
with endogenous investment
- 6.1
- This section describes a model for simulating different regulatory regimes for transmission network investment. The model uses MatpowerConnect to calculate electric power flows through a network representing the interconnected transmission networks of a number of countries in North West Europe.
- 6.2
- The European power system is currently undergoing a transition towards renewable energy sources. One important consequence of this transition is that it is likely that the power flows that we observe in the transmission network will change. Rather than power flowing from power plants and consumers that are located within the same country, an increasing share of electricity consumption is expected to be served by (renewable and non-renewable) power plants located abroad. Producing renewable energy at locations with abundant supply (as opposed to producing them as close to loads as possible) has the potential to lower the cost of electricity, even when including the cost of transporting power across large distances, with energy flowing from the place where it can best be produced (e.g., wind in the North Sea, hydro in Scandinavia, and solar in the Mediterranean) (Battaglini et al. 2009). To fully utilize the existing renewable potential, it is therefore necessary to transport power from geographic locations where it is abundantly available to locations where it is needed (Battaglini et al. 2009).
- 6.3
- This will mean that not just one, but multiple transmission
system operators (TSOs) will be responsible for the network that
connects generators and consumers. However, these TSOs may have
different objectives or reasons for network expansion (to increase the
power transfer capacity between areas), which are often influenced or
driven by national interests as formulated by (national) regulators and
governments. The model described below enables one to simulate the
development of transmission capacity in North West Europe as the result
of investment decisions by individual TSOs. Its purpose is to explore
how different regulatory regimes affect the long-term development of
the transmission network under a variety of scenarios, and what this
means for the social welfare of different countries and different types
of stakeholders (producers, consumers). The paragraphs below provide an
abridged description of the developed model. For a complete
description, please see van Blijswijk and de Vries (2013).
Model design
- 6.4
- The model considers a high-level representation of the
electricity systems of Germany, Netherlands, Belgium, France, and
Austria. It represents the system as 13 areas, each of which has a
generation portfolio (represented at the level of fuel types) and a
level of (perfectly inelastic) demand, which develop over time as
specified by the model user through exogenous input scenarios. These
areas are connected by a total of 20 transmission links, each of which
represents one or more power lines that exist in reality. It is assumed
that network constraints do not play a role within the areas (nodes)[7], but only
on the links between nodes. There are 8 agents that perform the
function of TSOs, which consists of expanding the network capacities
between nodes according to their own criteria for investment (social
welfare optimization within their region). Five regulatory agencies
(one per country) are responsible for approving or rejecting the
expansion plans made by these TSOs on the basis of criteria specified
for each simulation run (see below).
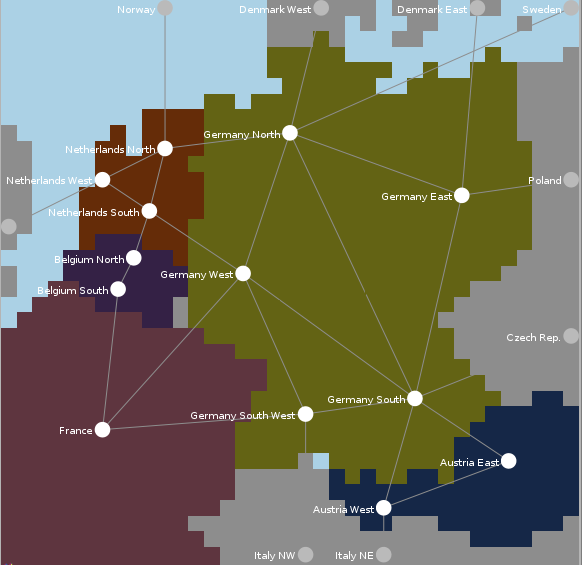
Figure 7. Demonstration model 2 (from van Blijswijk & de Vries 2013). - 6.5
- The model simulates the functioning of electricity spot markets, which results in market prices and the resulting usage of power plants (‘generator output’) on the basis of electricity demand (‘consumer load’) in each of the nodes. The levels of generator output and consumer load determine how power flows through the transmission network according to Kirchhoff’s laws, which the model calculates using the MatpowerConnect extension. Generator output, load, and network flows are calculated for every hour of the year, although instead of simulating all 8760 hours in a year the model uses 26 planning cases, each of which is representative for a number of hours (adding up to 8760 per year) in order to limit the model’s run time.
- 6.6
- At the end of each simulated year, the TSO agents make (individual) investment decisions to determine which links to add capacity to and how much capacity to add. Links between nodes that are operated by different TSOs require an investment approval from both agents, with costs shared on a 50/50 basis. These investment decisions are based on a cost-benefit assessment in which the costs of a link expansion are compared to the (monetary) benefit it delivers. If an net present value (NPV) assessment of the effects of an expansion over time yield net benefits, a TSO proposes its construction. There is a delay of several time steps before the capacity added by the investment actually becomes available to the network.
- 6.7
- While the costs of a link expansion only depend on its
length and capacity, the assessment of benefits can yield different
outcomes depending on the scope of the agent that performs the
assessment. (For instance, an agent could only consider the benefits of
a link expansion for producers and consumers within its own country,
but ignore the welfare effects for producers and consumers in other
countries which are also affected by the expansion.) The scope of
effects that are considered by the agents can be varied between model
runs, in order to find out to which extent this affects network
investment in the system. In
the demonstration model we present in this paper, we compare a case
where the agents only consider the economic effects of link expansions
for producers and consumers within their own country, versus a case
where they take into account the economic effects for the system as a
whole.
Model results
- 6.8
- For the case presented in this paper, we used the model to determine whether the North West European transmission network would develop differently when the investment decisions of individual TSOs (the agents) were taken on the basis of a system wide cost-benefit analysis, compared to investment evaluation on the basis of national merits. The model was run under both regimes, under an adapted[8] version of the two-degree temperature rise scenario, as formulated by the International Energy Agency.
- 6.9
- The primary performance indicator we use for this is the
total system costs, which are defined as the sum of the variable cost
of generation, cost of network expansion, and economic damage due to
lost load (energy not supplied). As a society, we seek to keep these
total costs to a minimum: if
the cost of a network expansion weighs up against savings in generation
costs (being able to use cheaper power plants to meet demand) or the
avoided economic cost of lost load (reducing blackouts), it reduces the
total system cost (over time), and it is thus in the societal interest
if it were realized.
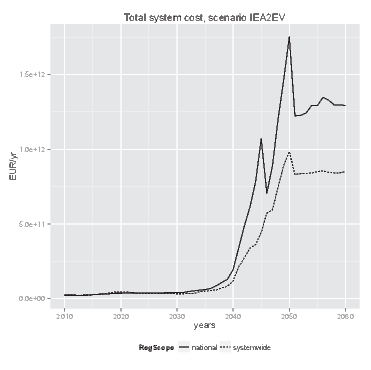
(a) Annual system costs 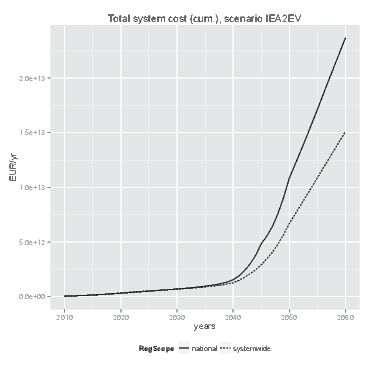
(b) Cumulative annual system costs Figure 8. System costs (development over time) - 6.10
- Figure 8 (cumulative figures are shown on the right) indicates that a system wide evaluation of network investment benefits by the agents in the simulation leads to a reduction in overall system costs compared to an approach limited to national benefits. As is shown by Figure 9(a), network investment costs fall behind if national investment considerations lie at the basis of cost-benefit evaluations. In the longer run this leads to higher overall dispatch costs, because network constraints cause a less efficient dispatch of power plants to be used for meeting demand (see Figure 9(b)). These results are in line with observations from literature that more interconnection capacity is needed in Europe (Buijs et al. 2011; Schaber et al. 2012; Steinke et al. 2013; Teusch et al. 2012).
- 6.11
- Note that dispatch costs increase over time in absolute
terms under both regimes, because the demand for electricity rises
significantly under the scenario that was applied in this run.
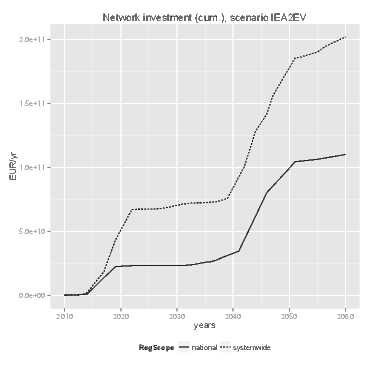
(a) Cumulative annual investment costs 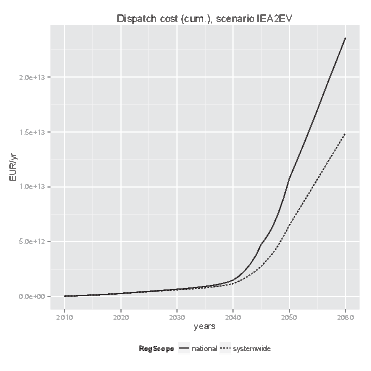
(b) Cumulative annual dispatch costs Figure 9. Network investment and dispatch costs - 6.12
- This model illustrates a further application of the MatpowerConnect extension. The model is used to understand the long-term development of an electricity infrastructure, and how different procedures for investment may affect the development of the infrastructure, and, in turn, the costs borne by society. This model is being further used to aid in the design of effective mechanisms to ensure the realization of adequate transmission capacity by the responsible TSOs in Europe, particularly when the interests of national regulators or governments are misaligned. In this case, the MatpowerConnect extension enabled a realistic representation of decision strategies on the part of the TSO, essential to the results of this study.
Discussion
- 7.1
- The role of networks in affecting the emergent properties of social systems is a key element of social simulation research. However, it is important to keep in mind that these networks are not just social in nature – they are also technical. Moreover, the properties of these technical networks – their capacity, structure, performance, etcetera – may both influence and be influenced by the social systems surrounding them. Linking models of social and technical systems is essential to understanding the nature and consequences of these influences.
- 7.2
- The demonstration models described above highlight this. In the first model, the technical properties and dynamics of the network are key to determining the satisfaction of consumers, and to triggering the various adaptive responses. Without adequate representation of these properties and dynamics, the need for adaptive responses on the part of different actors cannot be determined, and the effectiveness of these responses cannot be evaluated. In the second model, the technical properties and dynamics of the network are essential to the decision making processes of the grid operators, and to the comparative evaluation of different decision strategies. In both of these cases, the properties and dynamics of the technical network are fundamental to determining the responses of the represented actors and developments within the social subsystem.
- 7.3
- Given the imperative nature of the ongoing energy transition, the energy domain is ripe for explorations spanning the social and technical domains. This includes research in areas such as consumer interaction with smart grids, the emergence and evolution of community energy systems, the influences of social networks on the diffusion of renewable energy generation technologies, the effects and coordination of storage placement and others. The skills and expertise of social simulation researchers are indispensable to such explorations, but they must be accompanied by adequate awareness of the influences of the technical system. Not always does this require a detailed representation of the technical details of the electric power system, but sometimes it does. Where this is the case, the MatpowerConnect extension can be a useful tool for social simulation researchers.
- 7.4
- The MatpowerConnect extension is not the only way to integrate power systems functionality into social system models, but it offers important advantages. Netlogo’s Matlab and Network extensions (GitHub 2014; Wilensky 2014) may also facilitate this, or power flow calculations may be carried out natively within Netlogo or another social simulation software. Initially, the second demonstration model employed a natively programmed load flow calculation model that used Power Transfer Distribution Factor (PTDF) tables to calculate the network flows. PTDF tables contain information about the physical load flows that would be the result of injecting power into the grid in one region (generation) and extracting it in another region (load). Given a network topology and the locations of generation dispatch and load, the model used the PTDF table to determine the link loads in the system. The main advantage of this approach is that it eliminates the need to run separate load flow calculation models for every set of dispatch and load configurations (e.g., when doing year-round market simulation).
- 7.5
- However, in order to obtain the PTDF table for the given network topology, the user is still required to perform a separate load flow simulation, and the PTDF table must be re-calculated if the network is reconfigured (e.g., line capacities are expanded). In the second demonstration model we were concerned with network expansion over time, which not only implies that the network topology changes throughout the model runs, but also involves assessment of the effects of a large number of potential network expansions (i.e. topology changes) by the agents in each time step. Each of these reconfigurations requires the re-calculation of the PTDF table based on the new network topology. Even with the high level of abstraction used in the second demonstration model (a handful of nodes and links to represent the entire North West European electricity system), the number of different network configurations that could exist requires a prohibitively large number of different PTDF tables to reflect the network flows that would arise in network topologies that could exist. A shift to the MatpowerConnect extension in this case enabled much greater scalability and extended the capabilities of the model by allowing on-the-fly load flow calculations for networks on any level of detail. Moreover, it allowed for work on the model to focus on the core elements for which it was designed – investment in a (technically) common network by (institutionally) individual agents – while a basic, yet vital and complex functionality is provided by the extension to virtually any initial network configuration specified by the user.
- 7.6
- Key advantages of the MatpowerConnect extension relative to
alternative techniques include:
- Scalability and flexibility, including the possibility to simultaneously analyse multiple, distinct networks
- Realistic representation of power systems functionality
- Ease of use, also by those lacking a power systems background
- Speed: A single run of the first demonstration model of 100 time steps takes about 23 seconds[9]
- 7.7
- In using the extension for real cases, accurate data describing the relevant portion(s) of the real-world electric power grid is essential. In some cases, coarse datasets aggregating regional grids into single nodes may be sufficient – this is the approach adopted in the second demonstration model. However, the suitability of coarse approximations is highly dependent on the problem being addressed. In many cases, detailed grid data may be necessary or preferable. For transmission level studies, accurate national level datasets are increasingly available[10]. For distribution level studies, accurate data is more difficult to come by, and in the experience of the authors is often proprietary. However, it is known that common sets of rules often guide the development of transmission and distribution systems in different geographical areas, resulting in the emergence of network structures with similar properties (Rosas-Casals 2009). These patterns can be leveraged to generate realistic synthetic networks in cases where insufficient data is available. While it has been shown that simple networks based on random, preferential attachment and small-world structures “do not provide substantial utility for modeling power grids” (Hines et al. 2010), alternative methods have been shown to generate sufficiently realistic synthetic electric power networks (Soltan & Zussman 2015).
- 7.8
- Though the MatpowerConnect extension may be a useful tool for social simulation researchers, it has certain limitations which should be kept in mind. First, the extension currently only handles DC power flow analyses. As previously stated, the accuracy of DC analyses lag relative to AC analyses, but in many cases it is a sufficiently accurate approximation. Second, the extension requires an extensive description of the technical characteristics of the power system being modelled, which may be challenging for some researchers in the social simulation domain. By referencing the code of the demonstration models described in this paper, however, we expect that researchers should be able to overcome this challenge with little difficulty. By making the MatpowerConnect extension available and providing extensive documentation in the form of this paper and the referenced model code, we hope to inspire and enable new strands of research in underexplored areas spanning the social and technical domains.
Conclusion
- 8.1
- This paper has introduced and motivated the need for MatpowerConnect, a tool for social simulation researchers active in the energy domain. The tool enables study of electric power systems as evolving socio-technical systems at a variety of system scales, to explore a plethora of problems. As researchers spanning social and the technical domains ourselves, we have put this tool to use in multiple models and to address multiple research questions, several of which have been noted above. The rapidly changing structure of global energy systems demands research efforts jointly considering the technical and social dimensions of electric power systems. Via this paper, and the documentation and model code made available, we aim to make MatpowerConnect available and accessible to the social simulation community. In doing so, we seek to expand the scope of topics that can be addressed by this community, and to enable and inspire new research paths.
- 8.2
- Many of today’s key societal challenges demand research efforts spanning multiple domains. In fostering a large-scale shift to renewable and low-carbon energy sources, this is particularly imperative. The daily operation and long-term development of energy systems are emergent products of the behaviour and interactions of numerous actors. In turn, the performance and physical development of energy systems may influence and constrain the behaviour of these and other actors. Understanding and exploring these relationships and their consequences is essential to the realization of sustainable and resilient energy systems. Via this paper, we seek to contribute in a small and practical way to this ongoing process.
Notes
-
1
Netlogo has been referenced in more than 70 academic articles in the
social science domain since 2003 (based on a search of the titles,
abstracts and keywords of articles appearing in publications of the
social sciences and humanities domain using the Scopus database).
2Matpower has been noted in the titles, abstracts and/or keywords of 85 academic articles in the physical sciences domain since 2005
3 Electricity can, however, be converted into other forms of energy for storage (e.g. chemical, kinetic, potential).
4AC (alternating current) and DC (direct current) power flow analyses are calculated with different methods.
5For purposes of simplicity, the model does not include representation of a distribution grid.
6An important assumption of the model is the immediate effect of these adaptive responses. In real power systems, the infrastructure investments involved in increasing the capacity of generators or power lines may take several years, leading to a delay between the identification of a potential issue and the completion of improvements to alleviate it.
7In the field of power systems research this is referred to as the copper plate assumption.
8We assume solar PV to play a major role in the North West European electricity supply and furthermore assume that demand increases two-fold (in 2050) as a result of a shift from (direct) fossil fuel consumption to electricity.
9Calculated on an Intel i5 machine with 8 GB of RAM. If we switch out the IEEE 14 bus test case for the 118 bus test case (a significantly larger system), a singe run of the same model takes approximately 120 seconds.
10The website of the Open Energy Modelling Initiative (Openmod) offers links to a number of electricity transmission network datasets: http://wiki.openmod-_initiative.org/wiki/Transmission_network_datasets
11The IEEE 14-bus test case has been modified such that the production of each generator amounts to a fixed portion of the generator’s capacity.
Appendix
A - IEEE Power System Test Cases
-
The technical components of power systems are organized into networks
whose structures have evolved over time to accommodate emerging
societal demands and changing technological capabilities. While the
precise configuration of power systems varies significantly around the
globe, the structural characteristics of these systems exhibit
remarkable similarity from a network perspective (Rosas-Casals 2009). Given
these similarities together with the need for standardized
configurations for testing power systems algorithms, power systems
researchers often make use of IEEE power system test cases –
standardized abstractions of certain real world power systems. These
test cases have been used, amongst others, to test methods and
algorithms for calculating optimal generator dispatch (Xie & Ilic 2008), planning
reactive power compensation (Fernandes
et al. 1983) and identifying critical nodes in a power system
(Nasiruzzaman et al. 2012).
IEEE power system test cases include a detailed representation of the technical subsystem – including descriptions of the properties and configuration of generators, power lines, transformers and buses – but exclude the social subsystem. These test cases are readily available in standardized formats useful for power system engineers. Accompanying this paper (see https://github.com/ABollinger/MatpowerConnectDemonstrationModel/tree/master/casedata), we offer these datasets in a modified format, together with code for loading them into Netlogo and instantiating the relevant technical components.
Appendix
B - Getting started with the MatpowerConnect extension
-
Downloading the software: In getting started with the MatpowerConnect
extension, readers should start by downloading and installing the
following software:
- MatpowerConnect demonstration model: downloadable from https://github.com/ABollinger/MatpowerConnectDemonstrationModel
- Netlogo 5.x: downloadable from https://ccl.northwestern.edu/netlogo/
- Matpower: downloadable from http://www.pserc.cornell.edu//matpower/ (the extension has been tested with Matpower version 4.0b4).
- GNU Octave v3.6.1: downloadable from http://wiki.octave.org/Main_Page
- Oracle Java: In case this is not already installed on your system, it can be downloaded from https://www.java.com/en/
Configuring your installation: Two steps must be taken to allow the downloaded pieces of software to communicate with one another:
- Place the downloaded matpower(version-number) directory inside the mfiles directory of the demonstration model. The mfiles folder contains the Octave/Matlab code for running the power flow analysis.
- If using Windows, add GNU Octave to your system path (Start - Control panel - System - Advanced system settings - Environment variables - Path)
Understanding the demonstration model: The MatpowerConnect demonstration model can be launched by double-clicking the runMatpowerConnect-DemoModel1.bat (Windows) or runMatpowerConnect-DemoModel1.sh (Linux) file. This is a small script that starts the extension and opens Demonstration model 1 in Netlogo. The code of the demonstration model uses sensible variable names and is heavily commented in order to facilitate understanding on the part of the user. The interactions of the demonstration model with the MatpowerConnect extension are primarily defined in two places in the code of the demonstration model. The first is via the extensions[matpowerconnect] tag at the top of the model code. The second is via the matpowerconnect:octaverun command, which is the key point of interaction between the Netlogo Model and Matpower. This command is preceded by an input variable and followed by an output variables, as can be seen in the run-matpower procedure of the demonstration model, specifically the line set matpower-output-list matpowerconnect:octaverun matpower-input-list. This line of code passes the technical configuration of the power system (represented here by the variable matpower-input-list) to the extension and accepts back the calculated power flow values (represented by the variable matpower-output-list).
The input variable to the extension takes the form of a Netlogo list containing three sublists. These lists utilize the standard PTI Load Flow Data Format, described at http://www.ee.washington.edu/research/pstca/formats/pti.txt, for representing the technical composition of an electric power system. The first of these sublists defines the properties of the buses in the electricity network, the second describes the properties of generators in the network, and the third describes the properties of power lines and transformers in the network.
The output variable to the extension also takes the form of a Netlogo list containing two sublists. The first sublist contains information about the calculated power flows across each of the lines in the defined network. The second sublist contains information about the output of generators in the system. The ordering of power flow and generator output data in the sublists of the output variable is identical to the ordering of these elements in the input variable.
Creating your own model: The MatpowerConnect extension is most easily used by copying the power flow procedures portion of the code – containing the set-generator-outputs, set-power-demand-of-buses, create-matpower-lists, create-final-matpower-list and run-matpower procedures – together with the appropriate variable declarations (e.g. buses-own, generators-own) to a new Netlogo model file. This portion of the code manages the creation of the lists to pass to the extension and the extraction of results data.
In developing an initial model, users may find it easiest to start by instantiating and testing a network based on the IEEE Power System Test Cases (described above), the definitions for several of which can be found in the case data folder of the downloaded directory containing the demonstration model. This data gives social simulation researchers a way to incorporate realistic power system structures into their models with limited prior knowledge of the technical aspects of power systems. Code for loading the power system test cases into a model can be copied and pasted from the setup-network procedure of the demonstration model. A description of these and other IEEE Power System Test Cases can be found at https://www.ee.washington.edu/research/pstca/.
The source files for the MatpowerConnect extension may be downloaded from https://github.com/ABollinger/MatpowerConnect.
Appendix
C - Comparison of results from Matpower and the
MatpowerConnect extension
-
Using a modified version of the IEEE 14-bus test case as a basis[11], Table 1 compares the power flow results of the MatpowerConnect extension with those of Matpower itself, on the basis of power flows through the lines of the network. The results from the extension were obtained from Netlogo after having been passed from the extension. The results from Matpower were obtained from an separate simulation in Matlab using Matpower. As demonstrated below, the results from the MatpowerConnect extension and Matpower are identical, supporting the validity of the extension.
Table 1: Comparison of results from Matpower and the MatpowerConnect extension. From bus To bus Extension results (MW) Matpower results (MW) 1 2 73.85173986 73.85173986 1 5 37.6081255 37.6081255 2 3 43.59649753 43.59649753 2 4 32.39016383 32.39016383 2 5 23.1096668 23.1096668 3 4 17.07165369 17.07165369 4 5 40.19769229 40.19769229 4 7 0.550365546 0.550365546 4 9 7.165836883 7.165836883 5 6 12.92010001 12.92010001 6 11 8.935279685 8.935279685 6 12 7.931497857 7.931497857 6 13 18.38517125 18.38517125 7 8 33.53184878 33.53184878 7 9 34.08221433 34.08221433 9 10 3.564720315 3.564720315 9 14 8.183330897 8.183330897 10 11 5.435279685 5.435279685 12 13 1.831497857 1.831497857 13 14 6.716669103 6.716669103
References
- AXTELL, R. L., Epstein, J. M.,
Dean, J. S., Gumerman, G. J., Swedlund, A. C., Harburger, J.,
Chakravarty, S., Hammond, R., Parker, J. & Parker, M. (2002).
Population growth and collapse in a multiagent model of the kayenta
anasazi in long house valley. Proceedings of the National
Academy of Sciences of the United States of America 99,
7275–7279. [doi:10.1073/pnas.092080799]
BAKAM, I. & Matthews, R. (2009). Emission trading in agriculture: a study of design options using an agent-based approach. Mitigation and Adaptation Strategies for Global Change 14, 755–776. [doi:10.1007/s11027-009-9197-2]
BATTAGLINI, A., Lilliestam, J., Haas, A. & Patt, A. (2009). Development of supersmart grids for a more efficient utilisation of electricity from renewable sources. Journal of Cleaner Production 17, 911–918. [doi:10.1016/j.jclepro.2009.02.006]
BATTEN, D. & Grozev, G. (2006). NEMSIM: Finding ways to reduce greenhouse gas emissions using multi-agent electricity modelling. Complex Science for a Complex World (pp. 227–252). ANU E Press.
BHAGWAT, P. & de Vries, L. (2013). The effect of german strategic reserves on the central European electricity market. In: Proceedings of the 10th European Energy Market Conference. [doi:10.1109/eem.2013.6607362]
BIJKER, W., Hughes, T. & Pinch, T. (1987). The Social Construction of Technological Systems: New Directions in the Sociology and History of Technology. Cambridge: MIT Press.
BITHELL, M. & Brasington, J. (2009). Coupling agent-based models of subsistence farming with individual-based forest models and dynamic models of water distribution. Environmental Modelling and Software 24, 173–190. [doi:10.1016/j.envsoft.2008.06.016]
BOLLINGER, L. A. (2014). Fostering Climate Resilient Electricity Infrastructures. Ph.D. thesis, TU Delft.
BOMPARD, E., Masera, M. & Nuttall, W. J. (2015). High tension electricity: New multi-scale complexities in the electricity system. Technological Forecasting and Social Change 96, 327–333. [doi:10.1016/j.techfore.2014.07.006]
BUIJS, P., Bekaert, D., Cole, S., Van Hertem, D. & Belmans, R. (2011). Transmission investment problems in Europe: Going beyond standard solutions. Energy Policy 39, 1794–1801. [doi:10.1016/j.enpol.2011.01.012]
CHAPPIN, E. (2011). Stimulating Energy Transitions. Ph.D. thesis, Delft University of Technology.
DEAN, J. S., Gumerman, G. J., Epstein, J. M., Axtell, R. L., Swedlund, A. C., Parker, M. T. & McCarroll, S. (2000). Understanding Anasazi culture change through agent-based modeling. Dynamics in Human and Primate Societies: Agent-Based Modeling of Social and Spatial Processes (pp. 179–205). Oxford University Press.
EDERER, N. (2015). The market value and impact of offshore wind on the electricity spot market: Evidence from Germany. Applied Energy 154, 805–814. [doi:10.1016/j.apenergy.2015.05.033]
FANG, Y., Pedroni, N. & Zio, E. (2015). Optimization of cascade-resilient electrical infrastructures and its validation by power flow modeling. Risk Analysis 35(4), 594–607. [doi:10.1111/risa.12396]
FERNANDES, R., Lange, F., Burchett, R., Happ, H. & Wirgau, K. (1983). Large scale reactive power planning. IEEE Transactions on Power Apparatus and Systems 102(5), 1083–1088. [doi:10.1109/TPAS.1983.318048]
GEELS, F. W. (2005). Technological Transitions and System Innovations: A Co-evolutionary and Socio-technical Analysis. Edward Elgar Publishing. [doi:10.4337/9781845424596]
GIACOMONI, M. & Zechman, E. (2010). A complex adaptive systems approach to simulate urban water resources sustainability. In: Proceedings of the World Environmental and Water Resources Congress. [doi:10.1061/41114(371)262]
GITHUB (2014). MatNet: The Matlab extension for NetLogo. Web site. https://github.com/mbi2gs/netlogo-_matlab-_extension/wiki. Accessed October 2014.
GLACHANT, J.-M. & Ruester, S. (2013). The EU internal electricity market: Done forever? Environmental Science & Policy 31, 221–228.
HINES, P., Blumsack, S., Sanchez, E. C. & Barrows, C. (2010). The topological and electrical structure of power grids. In: Proceedings of the 43rd Hawaii International Conference on System Sciences. [doi:10.1109/hicss.2010.398]
JAGER, W., Janssen, M. & Bockarjova, M. (2014). Diffusion dynamics of electric cars and adaptive policy: Towards an empirical based simulation. Advances in Social Simulation: Proceedings of the 9th Conference of the European Social Simulation Association (vol. 229 of Advances in Intelligent Systems and Computing, pp. 259–270). Springer.
JANSSEN, M. & de Vries, B. (1998). The battle of perspectives: A multi-agent model with adaptive responses to climate change. Ecological Economics 26, 43–65. [doi:10.1016/S0921-8009(97)00062-1]
KAUFFMAN, S. & Johnsen, S. (1991). Coevolution to the edge of chaos: coupled fitness landscapes, poised states, and coevolutionary avalanches. Journal of Theoretical Biology 149(4), 467–505. [doi:10.1016/S0022-5193(05)80094-3]
KIECKHAEFER, K., Axmann, J. & Spengler, T. (2009). Integrating agent-based simulation and system dynamics to support product strategy decisions in the automotive industry. In: Proceedings of the 2009 Winter Simulation Conference. [doi:10.1109/WSC.2009.5429295]
LECHTENBÖHMER, S. & Samadi, S. (2013). Blown by the wind. Replacing nuclear power in german electricity generation. Environmental Science & Policy 25, 234–241. [doi:10.1016/j.envsci.2012.09.003]
MATTHEWS, R. & Bakam, I. (2007). A combined agent-based and biophysical modelling approach to address ghg mitigation policy issues. In: Proceedings of MODSIM 2007 International Congress on Modelling and Simulation.
MAUSER, W. & Ludwig, R. (2003). GLOWA Danube: A research concept to develop integrative techniques, scenarios and strategies regarding global changes of the water cycle. Climatic Change: Implications for the Hydrological Cycle and for Water Management (pp. 171–188). Kluwer Academic Publishers.
MULKERN, A. C. & ClimateWire (2013). A solar boom so sucsuccess, it's been halted. Scientific American.
NASIRUZZAMAN, A., Pota, H. & Islam, F. (2012). Method, impact and rank similarity of modified centrality measures of power grid to identify critical components. In: Proceedings of the 11th International Conference on Environment in Electrical Engineering.
NOLL, D., Dawes, C. & Rai, V. (2014). Solar community organizations and active peer effects in the adoption of residential pv. Energy Policy 67, 330–343. [doi:10.1016/j.enpol.2013.12.050]
PERELMAN, L. (1980). Speculations on the transition to sustainable energy. Ethics 90, 392–416. [doi:10.1086/292170]
RICKERSON, W., Couture, T., Barbose, G., Jacobs, D., Parkinson, G., Chessin, E., Belden, A., Wilson, H. & Barrett, H. (2014). Residential prosumers – drivers and policy options. Tech. rep., IEA-RETD.
ROSAS-CASALS, M. (2009). Topological complexity of the electricity transmission network. Implications in the sustainability paradigm. Ph.D. thesis, Universitat Politecnica de Catalunya.
SCHABER, K., Steinke, F. & Hamacher, T. (2012). Transmission grid extensions for the integration of variable renewable energies in Europe: Who benefits where? Energy Policy 43, 123–135. [doi:10.1016/j.enpol.2011.12.040]
SCHAVEMAKER, P. & van der Sluis, L. (2008). Electrical Power System Essentials. John Wiley and Sons.
SCHREINEMACHERS, P. & Berger, T. (2011). An agent-based simulation model of human-environment interactions in agricultural systems. Environmental Modelling and Software 26, 845–859. [doi:10.1016/j.envsoft.2011.02.004]
SCHWOON, M. (2006). Learning-by-doing, learning spillovers and the diffusion of fuel cell vehicles. In: Working Papers. Research unit Sustainability and Global Change, Hamburg University.
SOLTAN, S. & Zussman, G. (2015). A statistical method for synthetic power grid generation based on the U.S. Western Interconnection. In: SIAM Workshop on Network Science.
SOVACOOL, B. K. (2009). Rejecting renewables: The socio-technical impediments to renewable electricity in the united states. Energy Policy 37, 4500–4513. [doi:10.1016/j.enpol.2009.05.073]
STEINKE, F., Wolfrum, P. & Hoffmann, C. (2013). Grid vs. storage in a 100% renewable Europe. Renewable Energy 50, 826–832. [doi:10.1016/j.renene.2012.07.044]
STEPHAN, C. & Sullivan, J. (2004). An agent-based hydrogen vehicle/infrastructure model. In: Congress on Evolutionary Computation.
SUN, J. & Tesfatsion, L. (2007). Dynamic testing of wholesale power market designs: An open-source agent-based framework. Computational Economics 30, 291–327. [doi:10.1007/s10614-007-9095-1]
TEUSCH, J., Behrens, A. & Egenhofer, C. (2012). The Benefits of Investing in Electricity Transmission. Tech. rep., CEPS.
VAN BLIJSWIJK, M. J. & de Vries, L. J. (2013). Modeling transmission investment decisions. In: 13th IAEE European Conference, Düsseldorf.
VERBONG, G. & Geels, F. (2007). The ongoing energy transition: Lessons from a socio-technical, multi-level analysis of the Dutch electricity system. Energy Policy 35, 1025–1037. [doi:10.1016/j.enpol.2006.02.010]
WEIDLICH, A. & Veit, D. (2008). Powerace: Ein agentenbasiertes tool zur simulation von strom- und emissionsmaerkten. In: Tagungsband der Multikonferenz Wirtschaftsinformatik.
WILENSKY, U. (2014). The NetLogo NW Extension for network analysis. Web site. http://ccl.northwestern.edu/netlogo/docs/nw.html. Accessed October 2014.
XIE, L. & Ilic, M. (2008). Model predictive dispatch in electric energy systems with intermittent resources. In: Proceedings of the IEEE International Conference on Systems, Man and Cybernetics. [doi:10.1109/icsmc.2008.4811248]
ZIMMERMAN, R., Murillo-Sanchez, C. & Gan, D. (2011). Matpower: A MATLAB power system simulation package. Web site. http://www.pserc.cornell.edu/matpower/. Accessed February 2013.