
 Abstract
- How do individuals resolve conflicts over resources? One way is to share resources, which is possible between known individuals, with the use of sanctions on free riders or by partner selection. Another way is for anonymous individuals to respect the finders' ownership of resources based on asymmetry and avoid conflicts over resources. This study elucidates the conditions under which anonymous individuals share resources with each other irrespective of their asymmetry with regard to resources. High resource values inhibit anonymous individuals from sharing resources; however, small cumulative values and local distributions let anonymous individuals share the resources. Punishment of the richest individuals also supports resource sharing. These conditions may represent resource sharing among anonymous individuals in periods of great disasters and may be the origin of the practice of exchange in prehistoric times.
- Keywords:
- Agent Based Model, Resources, Norms, Hawk-Dove-Bourgeois Game
Introduction
- 1.1
- The classical study of the social order is founded on the question of how individuals were able to avoid the struggle for resources and instead share them with each other. Theoretically, individuals would rarely share resources as those who expel opponents and monopolize all resources should gain more. All individual relations would then escalate into a battle for resources, represented as "the war of all against all." Previous studies have tried to elucidate the conditions under which individuals would nevertheless share resources and avoid battles.
- 1.2
- Studies of the social-dilemma (SD) game have attempted to find conditions under which individuals select cooperation rather than conflict. We can infer the necessary conditions for resource sharing from these studies because, mathematically, to cooperate is the same as to share resources, in the sense that givers decrease their profits and increase those of their opponents. Classical studies of the SD game suggest that individuals must know each other to maintain the norm of resource sharing; individuals administer sanctions to exclude free riders who do not follow the resource-sharing rule. The monitoring of free riders is possible through repeated interactions among opponents (Axelrod 1984), a fixed network among individuals (Nowak & May 1992; Killingback & Doebeli 1996; Axelrod et al. 2002; Santos & Pacheco 2005), and the existence of reputation among individuals (Raub & Weesie 1990; Nowak & Sigmund 1998; Janssen 2006; Ohtsuki et al. 2009). Individuals may select reliable opponents for committed partnership and produce spontaneous social networks, which also promote the norm of resource sharing (Eguiluz et al. 2005; Back & Flache 2006; Nakai & Muto 2008; Bravo et al. 2012).
- 1.3
- Anonymous individuals may indirectly share resources with each other using the convention of ownership or the norm of property rights, in which intruders always allow owners to prevail in resource contests. Studies of the game "Hawk–Dove–Bourgeois" (HDB) have analyzed the conditions under which individuals build the convention of ownership or the Evolutionary Stable Strategy (ESS) of the Bourgeois strategy. In the HDB game, Hawks and Bourgeois dominate the population when resource values are higher or lower than the cost of a fatal battle, respectively. The necessary conditions for the ESS of the Bourgeois strategy are asymmetric access to resources between individuals and a higher-cost struggle than the corresponding benefit of gaining resources (Maynard-Smith & Parker 1976). Succeeding studies have shown that the conventions of ownership are more likely to be stable if we assume the following: differences in resource-holding potential (Kokko et al. 2006), the endowment effect (Gintis 2007), high population density (Horiuchi 2008), and the coevolution of property rights and farming during the Holocene (Bowles & Choi 2013). Individuals have 50:50 chances of becoming an owner or an invader and thereby gaining the resources. Therefore, the convention of ownership indirectly allows anonymous individuals to share resources in turn, as long as an asymmetric access to resources is implied.
- 1.4
- Accordingly, previous studies indicate that individuals can share resources in two ways: (1) If individuals know each other, they share resources directly using the mechanisms of sanctions on free riders or partner selection; and (2) if individuals are anonymous to each other, they share resources indirectly using the convention of ownership with the aid of asymmetric access. However, the problem is whether anonymous individuals can directly share resources with each other. Some studies suggest the possibility of resource sharing among anonymous individuals, but this is only possible owing to their ability to trust others, having grown up among known individuals (Macy & Skvoretz 1998; Macy & Sato 2002), or information denoting trustworthiness transmitted between their groups (Masuda 2005). Some studies show the ESS of the Dove strategy among anonymous individuals, assuming diminishing returns of resources (Foster 2004; Nettle et al. 2011), but they do not include the Bourgeois strategy in this model. Horiuchi (2012) shows the possibility of Dove domination in the population, adding a fourth strategy—Association—which punishes opponents who do not share resources in the classical HDB game. Doves may dominate the population only by coexisting with Associations who punish Hawks or Bourgeois. A population dominated by Dove and Association strategies is not stable; it is occasionally invaded by Hawk or Bourgeois strategies. Accordingly, previous studies have not found the conditions under which anonymous individuals can directly share resources with each other, or the ESS of the Dove strategy in the HDB game.
- 1.5
- However, we should note that anonymous individuals often share resources with each other, particularly, in extreme conditions such as during and after great disasters (Solnit 2010). They often share resources directly and help one another. Recovery after disasters, or resilience, may actually depend on embedded social capital or an existing dense network among individuals (Aldrich 2012). However, we should also note earlier resource sharing among anonymous individuals before the start of the recovery, which may not depend on a dense network. The question to be considered is why anonymous individuals are sometimes able to share resources directly irrespective of asymmetric resource access. We may say that sites of great disasters are exceptional cases—or can we hope for the possibility of resource sharing among anonymous individuals under some other conditions? During great disasters, accompanying environmental conditions may allow anonymous individuals to directly share resources with each other. To test this hypothesis, we need a mathematical study to test the effects of multiple parameters in computational space.
The
simulation model
- 2.1
- To elucidate the environmental conditions that promote Dove domination among anonymous agents (individuals), this study builds an agent-based model (ABM). In a computational space, the ABM assumes \(N\) agents, each of whom adopts one of three strategies, namely Hawk (H), Dove (D), or Bourgeois (B). At the initial condition, agents are assumed to have taken one of the three strategies randomly; on average, \(N/3\) agents take each strategy. Agents struggle for resources in a one-dimensional space. The range of the space within which agents are randomly distributed is \((-L, L)\).
- 2.2
- Resource Appearance is structured as follows. Resources
appear in one-dimensional space. The coordinate point \(x\) of each
resource is given at each time by the equation \(x = Ae^{-qB}\). The
probability functions \(A\) and \(B\) are independent from each other
and have the range of values \(-L < A < L\) and \(0
< B <1\), respectively, and the range of the parameter
\(q\) is \(q ≥ 0\). The range of \(x\) is thus \( -L < x
< L \). The index \(q\) represents the likelihood of the
resources to appear at the center of the space. For smaller values of
\(q\), resources are more likely to appear randomly within the space.
For larger values of \(q\), resources are more likely to appear at the
center of the space. In extraordinary conditions, such as at great
disasters, resources should appear in limited areas, thus, high values
of \(q\) should be expected.
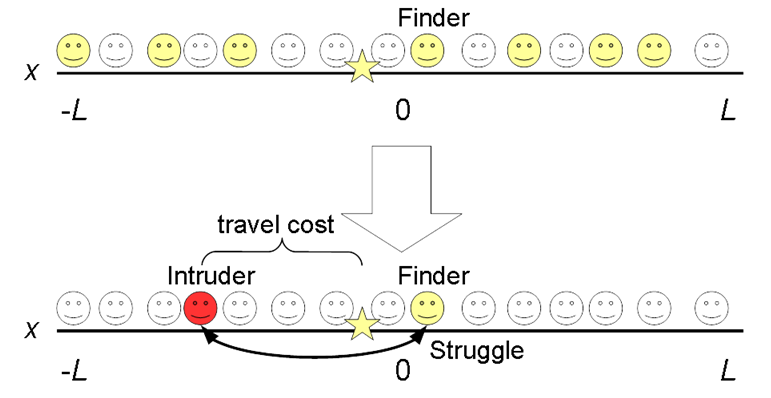
Figure 1. Algorithm of Resource Struggle. Randomly, \(m_f\) individuals are selected. Among them, the individual nearest to the resource becomes the Finder. Another individual is selected as the Intruder. She approaches the resource, suffering travel cost. The struggle of these two is represented in Table 1. - 2.3
- Figure 1 illustrates the resource-struggle step. After the appearance of a resource on the line, \(m_f\) agents are randomly selected (\(0 < m_f < N\)); the agent nearest to the resource becomes the finder. For larger values of \(m_f\), a larger number of agents have likely access to the resource, but only the agent who is most proximate to the resource becomes the finder. Another agent is randomly selected as an intruder among \(N\) agents independent from the resource finder. After the finder and intruder are decided, the two struggle for the resource. The intruder is assumed to suffer travel cost \(c_t\), times the distance between herself and the resource \(d\), or \(c_t\cdot d\), if she gains the resources and brings it back to her residential area \((c_t < 0, 0 < d < 2L)\). In extraordinary conditions, such as great disasters, many agents should seek for resources among a limited supply, thus, high values of \(m_f\) and low values of \(c_t\) are expected. The two steps of resource appearance and resource struggle are sequentially repeated \(N\) times; thus, on average, each agent is involved twice in resource struggles.
- 2.4
- The struggle follows one of 18 patterns based on the
agents' strategies and asymmetries of resource finder/intruder (Table 1). The payoff of agents depends on
the resources gained (\(\sum\nu\)), the fatal conflicts they are
involved in (\(\sum c_f\)), and the travel costs in returning their
resources to their residential area (\(\sum c_td\)), summed over \(N\)
iterations. The payoff for the agent is \(P=(\sum\nu)^w-\sum c_f-\sum
c_td\). The values of \(\nu\), \(c_f\), and \(w\) represent the
resource value, struggle cost, and diminishing effect of cumulative
resource value, respectively. In extraordinary conditions, such as
great disasters, necessary resources such as food or water will be
limited and cannot be accumulated. Accordingly, high values of \(\nu\)
and low values of \(w\) are expected if we assume the value \(c_f\) to
be fixed.
Table 1: Payoff of row strategy against column strategy. The first element represents the payoff when the individual is the finder and the second, the intruder. H D B H \((\nu-c_f)/2\)
\((\nu-c_f)/2-c_td\)\(\nu\)
\(\nu-c_td\)\(\nu\)
\((\nu-c_f)/2-c_td\)D 0
0\(\nu/2\)
\(\nu/2-c_td\)\(\nu/2\)
0B \((\nu-c_f)/2\)
0\(\nu\)
\(\nu/2-c_td\)\(\nu\)
0 - 2.5
- The step of the strategy update goes as follows. Select an agent \(j\) randomly. Furthermore, check \(m_s\) agents (\(0 < m_s < N\)) for their profits and strategy, independently from the selected agent \(j\). Agent \(j\) changes her strategy to that of the agent who acquires the highest profit among \(m_s\) agents if his profit is higher than hers.
- 2.6
- After the step of social learning, mutation may occur. The probability of mutation is 0.01. If mutation occurs with that probability, one agent is selected at random among all agents. For each agent, the probability of being selected is therefore \(0.01/N\) per turn. The strategy of the selected agent randomly changes to another of the three strategies. Otherwise, or with a probability of 0.99, mutation does not occur and no agents change their strategies.
- 2.7
- One turn comprises \(N\) iterations of the steps of sequential resource appearance and resource struggle, followed by the steps of strategy update and mutation. The present ABM iterates the turns \(T\) times and tests to see which strategy dominates the population for the given values of the independent parameters. The pseudocode appears in the Appendix.
- 2.8
- The ABM changes several independent parameters to check the results. As higher values of \(m_f\) or \(m_s\) mean that individuals interact more frequently with each other, the model sets the value \(m\), which is equal to \(m_f\) and \(m_s\) for simplicity, as an index of interaction among agents. In the model, values are set as \(L = 10\), \(N = 100\), and \(c_f = 1\). The ABM changes the values of the other independent parameters \(\nu\), \(c_t\), \(q\), \(w\), and \(m\) to test how resource values, travel cost, resource distribution, diminishing returns of resources, and interaction among agents, respectively affect results.
Results
- 3.1
- Figure 2 shows the results of one-shot simulations in 100,000 iterations of turns for several values of the independent parameter sets. In the simulations, \(c_t=0\) and \(m = 20\). When the value of \(q\) is 0 and that of \(w\) is 1, the simulation is almost identical to the classical HDB game. Hawks and Bourgeois dominate the population when \(\nu < 1\) (\(\nu > c_f\)) and \(\nu < 1\) (\(\nu < c_f\)), respectively (Figs. 2a–b), which follows the prediction of classical studies.
- 3.2
- When the value of \(q\) is high and that of \(w\) is low,
however, the simulation becomes entirely different from the classical
HDB game (Figs. 2c–d). Doves
dominate the population at earlier times, which would not be expected
according to classical studies. However, Bourgeois dominate the
population at later times. Although the two figures assume different
values of \(\nu\) (\(\nu > 1\) and \(\nu < 1\) in Figs. 2c and d, respectively), they suggest
little effect of variation in \(\nu\) on the results.
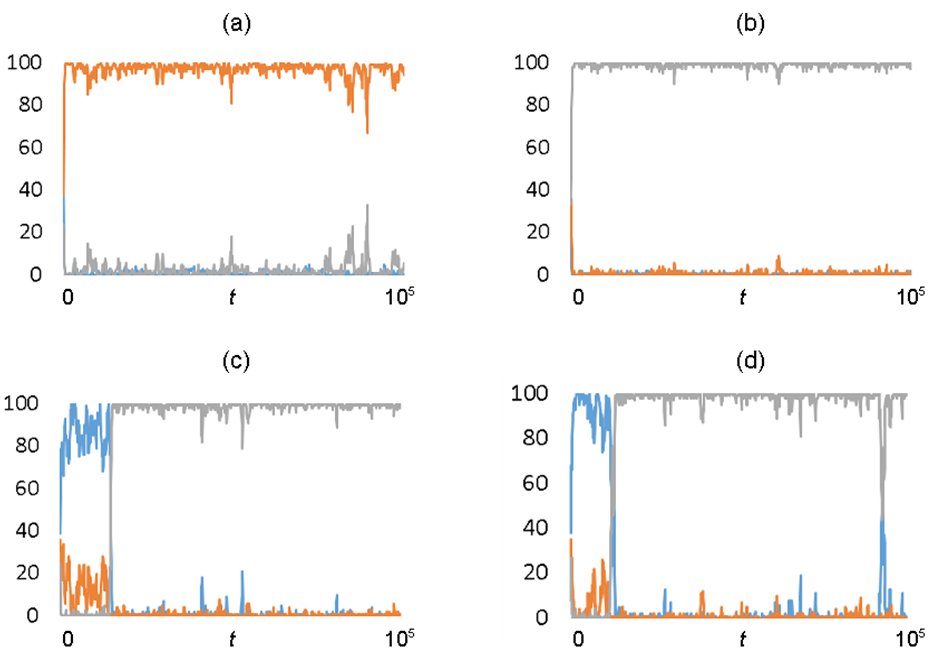
Figure 2. The number of individuals following each strategy. The red, blue, and gray curves, respectively, represent the number of individuals following the Hawk, Dove, and Bourgeois strategies (\(0 < t < 100,000\)). (a) \((\nu, c_t, w, q, m) = (2, 0, 1, 0, 20)\), (b) \((\nu, c_t, w, q, m) = (0.5, 0, 1, 0, 20)\), (c) \((\nu, c_t, w, q, m) = (2, 0, 0.1, 100, 20)\), and (d) \((\nu, c_t, w, q, m) = (0.5, 0, 0.1, 100, 20)\). - 3.3
- As independent parameters do not change during the simulations, we can compare the Gini coefficient between two periods, namely when Doves dominate the population and when Bourgeois dominate the population, during the simulation represented by Figs. 2c and d. In the simulation represented by Fig. 2c, the Gini coefficient is 0.11 when Doves dominate the population (\(3,000 < t < 14,000\)) and 0.79 when Bourgeois dominate the population (\(15,000 < t < 100,000\)). In the simulation represented by Fig. 2d, the Gini coefficient is 0.11 when Doves dominate the population (\(1,000 < t < 11,000\)) and 0.77 when Bourgeois dominate the population (\(14,000 < t < 100,000\)).
- 3.4
- Furthermore, we compare the frequency of struggles involving fatal costs between the two periods. In the simulation represented by Fig. 2c, the frequency is 1.19 when Doves dominate the population (\(3,000 < t < 14,000\)) and 0.56 when Bourgeois dominate the population (\(15,000 < t < 100,000\)). In the simulation represented by Fig. 2d, the frequency is 0.54 when Doves dominate the population (\(1,000 < t < 11,000\)) and 0.60 when Bourgeois dominate the population \((14,000 < t < 100,000)\).
- 3.5
- To grasp the conditions that promote Dove domination in the
population, we ran a multiple regression model using data from 1,000
simulations. The independent parameters (\(\nu\), \(c_t\), \(w\),
\(m\), and \(\log_{10}q\)) were prepared randomly with a uniform
distribution; the ranges are \(0 < \nu < 4\), \(0
< c_t < 0.5\), \(0 < w < 1\), \(0 <
m < 50\), and \(-1 < \log_{10}q < 3\),
respectively. The dependent parameter is the number of Dove and
Bourgeois at times (a) \(t = 10^2\), (b) \(t = 10^3\), (c) \(t =
10^4\), and (d) \(t = 10^5\). The table indicates that values of \(q\)
(\(\log_{10}q\)) and \(m\) have positive effects, whereas the value of
\(w\) has negative effects on the domination of Doves throughout the
four time steps. The value of \(\nu\) has negative effects earlier, but
no effects later, on the domination of Doves. The value of \(c_t\) has
no effects on the domination of Doves throughout the four time steps.
Doves are less likely to dominate the population at later times. The
table also indicates that the value of \(q\) (\(\log_{10}q\)) has a
negative effect on the domination of Bourgeois throughout the four time
steps. The value of \(w\) has positive effects earlier, but no effects
later, on the domination of Bourgeois. The values of \(\nu\) and \(m\)
have no effects earlier, but negative effects later, on the domination
of Bourgeois. The value of \(c_t\) has no effects on the domination of
Bourgeois throughout the four time steps. Bourgeois are more likely to
dominate the population at later times.
Table 2: The results of a multiple regression analysis of data from 1,000 simulations. The dependent parameter is # Doves and # Bourgeois. The table shows the average number of Doves and Bourgeois and beta coefficients of each independent parameter on the dependent parameter and their standard deviation. Moreover, the table shows R\({}^2\) values of multiple regression analysis. (a) \(t = 10^2\). (b) \(t = 10^3\). (c) \(t = 10^4\). (d) \(t = 10^5\). *\(\mathrm{P}<0.05\). **\(\mathrm{P}<0.01\). ***\(\mathrm{P}<0.001\). (a) (b) (c) (d) # Doves 36.9
39.2
17.8 4.8 \(\nu\) −0.078*** −0.153*** −0.047 −0.018 \(c_t\) 0.010 0.015 −0.036 0.011 \(w\) −0.155*** −0.315*** −0.187*** −0.080*** \(m\) 0.024* 0.142*** 0.155*** 0.120*** \(\log_{10}q\) 0.359*** 0.806*** 0.433*** 0.110*** SD 0.012 0.029 0.029 0.017 R\({}^2\) 0.544*** 0.486*** 0.227*** 0.100*** # Bourgeois 35.4 54.0 78.6 92.3 \(\nu\) 0.014 0.017 −0.034 −0.076*** \(c_t\) 0.004 0.003 0.040 0.003 \(w\) 0.055*** 0.152*** 0.080** −0.013 \(m\) −0.013 −0.058* −0.106*** −0.105*** \(\log_{10}q\) −0.263*** −0.731*** −0.391*** −0.103*** SD
0.011 0.152
0.028
0.018
R\({}^2\) 0.390*** 0.417*** 0.178*** 0.072*** 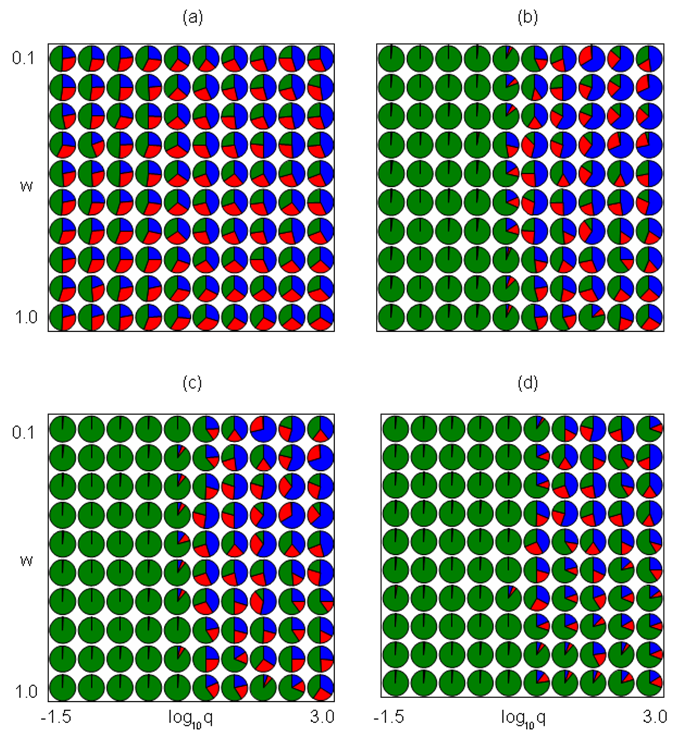
Figure 3. The ratio of Doves (Blue), Hawks (Red), and Bourgeois (Green) at each \((w, \log_{10}q)\) by 10 simulations. The figure sets \((\nu, m) = (0.5, 10)\). (a) \(t = 10^2\). (b) \(t= 10^3\). (c) \(t = 10^4\). (d) \(t = 10^5\). 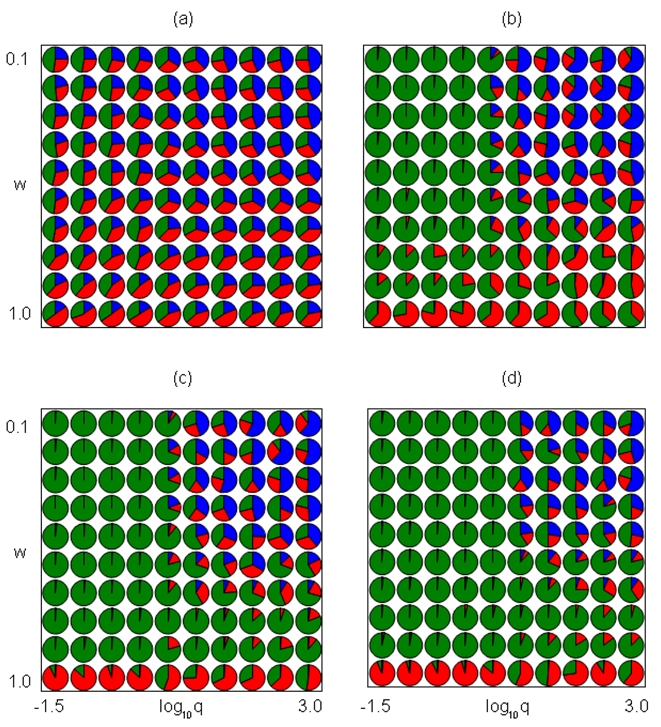
Figure 4. The ratio of Doves (Blue), Hawks (Red), and Bourgeois (Green) at each \((w, \log_{10}q)\) by 10 simulations. The figure sets \((\nu, m) = (2, 10)\). (a) \(t = 10^2\). (b) \(t = 10^3\). (c) \(t = 10^4\). (d) \(t = 10^5\). 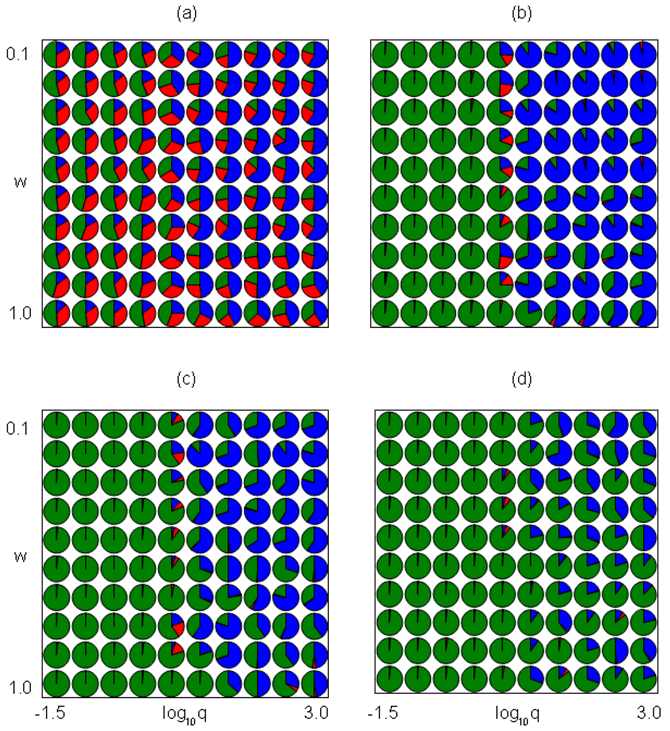
Figure 5. The ratio of Doves (Blue), Hawks (Red), and Bourgeois (Green) at each \((w, \log_{10}q)\) by 10 simulations. The figure sets \((\nu, m) = (0.5, 50)\). (a) \(t = 10^2\). (b) \(t = 10^3\). (c) \(t = 10^4\). (d) \(t = 10^5\). 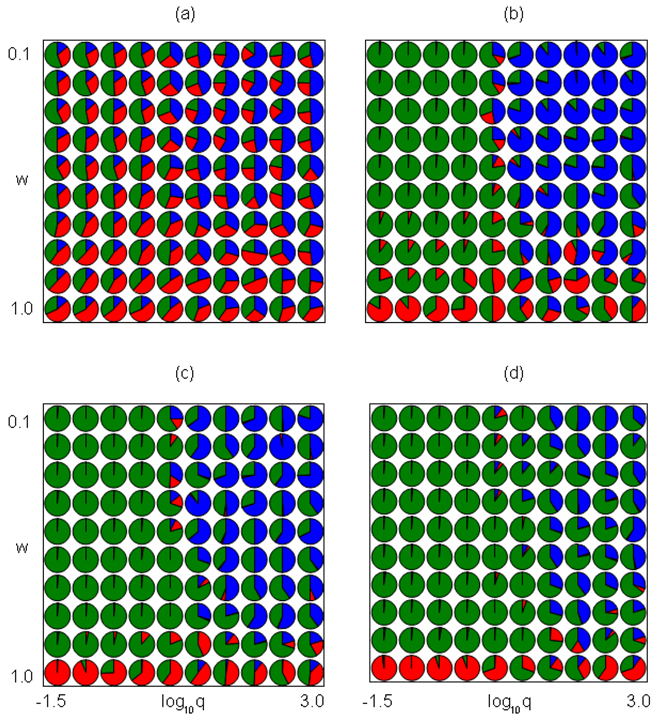
Figure 6. The ratio of Doves (Blue), Hawks (Red), and Bourgeois (Green) at each \((w, \log_{10}q)\) by 10 simulations. The figure sets \((\nu, m) = (2, 50)\). (a) \(t = 10^2\). (b) \(t = 10^3\). (c) \(t = 10^4\). (d) \(t = 10^5\). - 3.6
- Figures 3–6 indicate the effects of \(w\) and \(\log_{10}q\) on Dove or Bourgeois domination for each set of \((\nu, m)\). The set of \(w\) and \(\log_{10}q\) in each figure is \((0.1, 0.2, \ldots, 1.0)\) and \((-1.5,-1.0, \ldots, 3.0)\), respectively. At each parameter set, we ran 10 simulations indicating the ratio of Dove, Hawk, and Bourgeois at each time step: (a) \(t = 10^2\), (b) \(t = 10^3\), (c) \(t = 10^4\), (d) \(t = 10^5\). These figures set the value \((\nu, m)\) to be (0.5, 10), (2, 10), (0.5, 50), and (2, 50), respectively. Doves are likely to dominate the population when the value of \(w\) is small and the value of \(q\) is large. Bourgeois are likely to dominate the population when the value of \(w\) is large or the value of \(q\) is large. At later times, Bourgeois are more likely to dominate the population, expelling Doves at any parameter sets. Hawks may dominate the population when the values of \(\nu\) and \(w\) are large and the value of \(q\) is small.
- 3.7
- Thus, the present ABM shows the possibility of Doves
domination in the population. Table 3
summarizes conditions in which Doves, Hawks, or Bourgeois dominate the
population.
Table 3: The conditions in which Doves, Hawks, or Bourgeois dominate the population. Domination Parameters Conditions Doves small \(w\) and large \(q\)/small \(\nu\)/large \(m\) Many individuals struggle for invaluable and noncumulative resources that appear at restricted areas. Hawks large \(\nu\)/large \(w\)/small \(q\) Individuals struggle for valuable and cumulative resources that appear anyplace. Bourgeois small \(q\) or large \(w\)/small \(\nu\)/small \(m\) Few individuals struggle for cumulative but invaluable resources that appear anyplace.
Discussion
- 4.1
- In the present ABM, Doves may dominate the population when the value of \(\nu\) is small, which is contrasted with the domination of Bourgeois in the classical HDB model. More significantly, when the value of \(w\) is small, the value of \(m\) is large, and the value of \(q\) is large, Doves are more likely to dominate the population. Thus, the norm of resource sharing appeared among anonymous individuals, superseding the norm of property rights, and we must consider the question why Doves dominate the population in these conditions?
- 4.2
- The reasons are as follows. The agent who is located closest to the center always becomes the finder when the value of \(q\) is large. She engages in struggles for resources against many intruders. If values of \(\nu\) and \(w\) are large, she still benefits by excluding intruders, even at the cost of an injury. If values of \(\nu\) and \(w\) are small, by contrast, she would benefit from sharing resources with intruders and avoiding fatal battles. However, the finder gains the highest profits, because she still gains nearly half of the resources. Thus, the results predict that if resources appear in a locally restricted area and the cumulative value of resources is small, then anonymous individuals are likely to share resources irrespective of the provision of asymmetric access. When Doves dominate the population, individuals can more equally gain resources and the value of the Gini coefficient is low, although these individuals may be more frequently involved in fatal battles compared with times when Bourgeois dominate the population. Increase in interaction among individuals, represented by large values of \(m\), also promote Dove domination as many attacks by Hawks may hinder the evolution of the Bourgeois.
- 4.3
- The ABM also predicts that as time passes, Bourgeois are more likely to dominate the population for small values of \(\nu\) and \(w\), as with the domination of the Dove strategy. Although most individuals cannot gain resources as long as they adopt the Bourgeois strategy, represented by a high Gini coefficient value, Bourgeois still dominate the population. That is because most individuals will follow the strategy of the richest Bourgeois, who are nearest to the center of the world and most likely to be resource finders.
- 4.4
- The reason why Bourgeois dominate the population later in the simulation is as follows. In earlier times, the population included many Hawks, who often attacked the richest individual around the center of the world. At that time, Bourgeois were not able to dominate the population as the richest individual following the Bourgeois strategy would suffer many attacks from Hawks. After Doves dominate the population and few Hawks exist, Bourgeois are able to dominate the population as the richest individual following the Bourgeois strategy will rarely suffer attacks from Hawks. In other words, we may expect some Hawks to be punishers (Farjam et al. 2015); Hawks, playing the role of the punishers, may collapse the domination of the Bourgeois and generate equality among individuals.
- 4.5
- In extraordinary conditions, such as great disasters, individuals should move away from destroyed areas for safety. They face conditions of large values of \(v\), small values of \(w\), large values of \(q\), and large values of \(m\). The model certainly shows that small values of \(w\), large values of \(q\), and large values of \(m\) promote the domination of Dove individuals in the population. Large values of \(\nu\), however, inhibit Dove domination in the present model. However, we should also note that \(\nu\) has weaker effects on Dove inhibition as long as the value of \(w\) is small and the value of \(m\) is large. Thus, the present model illustrates why many individuals share resources with each other in extraordinary conditions. Furthermore, it indicates that as time passes, individuals rarely share resources with each other, becoming more dominated by Bourgeois strategies. Thus, the usual social order, represented by the convention of ownership or the norm of property rights, returns.
- 4.6
- The results suggest that anonymous individuals may share resources with each other in the general case and not only in exceptional cases such as great disasters. During prehistoric times, some individuals visited places that had locally abundant resources, and these places were probably inhabited by other groups (Specht et al. 1988; Glascock et al. 2011). Residents may not have been motivated to exclude visitors and monopolize resources as resources exceeded residents' needs. Present hunter–gatherers have also been found to minimize the value of their resources when welcoming strangers (Woodburn 1982). Therefore, small values of \(w\) together with large values of \(q\), negating the effects of the large values of \(\nu\), may fit experimental data gained from archeology and anthropology. One may say that hunter–gatherers might have been acquainted with each other, engaging only in reciprocal exchange. When they encountered each other, however, they would have begun sharing resources with each other; otherwise, they would not have become acquainted.
- 4.7
- The ABM has limitations due to the simplicity of its assumptions. For instance, if the Hawk–Dove game assumes an asymmetric resource-holding potential among individuals or increasing returns with respect to the size and value of a resource, individuals may not readily share resources (Mesterton-Gibbons & Sherratt 2012). More seriously, the present ABM assumes that the strategy update follows the rule of social learning. These assumptions follow the classical assumptions of ABM studies. However, updating the rules of specific strategies may affect ABM results (Roca et al. 2012). Further research is needed to clarify this point.
- 4.8
- ABM studies are able to clearly reproduce the process from extraordinary conditions to recovery or from disturbance at the initial condition to equilibrium. The present model shows that Bourgeois dominate the population at later times or at equilibrium, expelling Doves and Hawks, even if values of \(q\) and \(w\) are small and the value of \(m\) is large. In that sense, the present model is not new as long as we focus on the results at equilibrium. However, we should also note the possibility that Doves may dominate the population when the system is still far from equilibrium, which fits well with extraordinary conditions such as times of great disasters. Furthermore, the present ABM creates a continuous space wherein multiple agents interact. This continuous space can simulate local distribution of resources well, a situation only poorly treated by analytical studies. Thus, ABM studies can be expected to be developed by including the idea of continuous space in the disciplines of social sciences. In that sense, ABM studies should be further developed as they may be able to predict surprising effects that are only poorly reproduced by analytical studies or intuition.
Acknowledgements
- This research was supported by the MEXT GRANT 23101505 and 25101707. Among all, especially I thank to T. Akazawa for guiding me to the "Replacement of Neanderthals by Modern Humans" project. I also thank K. Aoki, R. Ishii, N. Kohno, W. Nakahashi, Y. Nakai, H. Ohura, Y. Sato, J. Y. Wakano and three anonymous referees for valuable comments and discussions. The author would like to thank Enago (www.enago.jp) for the English language review.
Appendix:
Pseudocode of the core program
-
begin simulation
for each simulation
initialize parameters and agents
for each turn
for each struggle (N/2 times)
generate a resource R by the function Ae-qB
select the Finder among m agents
select the Intruder among all agents
Finder and Intruder do struggles
end for
calculate payoffs of all agents
an random agent updates its strategy
an random agent mutates its strategy if p_mutation < 0.01
end for
end for
show results
end simulation
References
- ALDRICH, R. P. (2012). Building
Resilience: Social Capital in Post-Disaster Recovery.
Chicago: The
University of Chicago Press. [doi:10.7208/chicago/9780226012896.001.0001]
AXELROD, R. (1984). Evolution of Cooperation. New York: Basic Books.
AXELROD, R., Lioro, R. L., & Cohen, M. D. (2002). Beyond geography: Cooperation with persistent links in the absence of clustered neighborhoods. Personality and Social Psychology Review, 6, 341–346. [doi:10.1207/S15327957PSPR0604_08]
BACK, I., & Flache, A. (2006). The viability of cooperation based on interpersonal commitment. Journal of Artificial Societies and Social Simulation, 9 (1), 2. https://www.jasss.org/9/1/12.html
BOWLES, S., & Choi, J.K. (2013). Coevolution of farming and private property during the early Holocene. Proceedings of the National Academy of Sciences of the United States of America, 110, 8830–8835. [doi:10.1073/pnas.1212149110]
BRAVO, G., Squazzoni, F., & Boero, R. (2012). Trust and partner selection in social networks: An experimentally grounded model. Social Networks, 34 (4), 481–492. [doi:10.1016/j.socnet.2012.03.001]
EGUILUZ, V. M., Zimmermann, M. G., Cela-Conde, C. J., & Miguel, M. S. (2005). Cooperation and the emergence of role differentiation in the dynamics of social networks. American Journal of Sociology, 110, 977–1008. [doi:10.1086/428716]
FARJAM, M., Faillo, M., Sprinkhuizen-Kuyper, I., & Haselager, P. (2015). Punishment mechanisms and their effect on cooperation: a simulation study. Journal of Artificial Societies and Social Simulation, 18 (1), 5 https://www.jasss.org/18/1/5.html.
FOSTER, K. R. (2004). Diminishing returns in social evolution: the not-so-tragic commons. Journal of Evolutionary Biology, 17, 1058–1072. [doi:10.1111/j.1420-9101.2004.00747.x]
GLASCOCK, M. D., Kuzmin, Y. V., Grebennikov, A. V., Popov, V. K., Medvedev, V. E., Shewkomude, I. Y., & Zaitsev, N. N. (2011). Obsidian provenance for prehistoric complexes in the Amur River basin (Russian Far East). Journal of Archaeological Science, 38, 1832–1841 [doi:10.1016/j.jas.2011.03.022]
GINTIS, H. (2007). The evolution of private property. Journal of Economic Behavior & Organization, 64, 1–16. [doi:10.1016/j.jebo.2006.02.002]
HORIUCHI, S. (2008). High population density promotes the evolution of ownership. Ecological Research, 23, 551–556. [doi:10.1007/s11284-007-0408-6]
HORIUCHI, S. (2012). Emergence and persistence of communities: Analysis by means of a revised hawk-dove game. Sociological Theory and Methods, 27, 299–306.
JANSSEN, M., (2006). Evolution of cooperation when feedback to reputation scores is voluntary. Journal of Artificial Societies and Social Simulation, 9 (1), 17 https://www.jasss.org/9/1/17.html.
KILLINGBACK, T., & Doebeli, M. (1996). Spatial evolutionary game theory: Hawks and Doves revisited. Proceedings of the Royal Society of London, series B, 263, 1135–1144. [doi:10.1098/rspb.1996.0166]
KOKKO, H., Lopez-Sepulcre, A., & Morrell, L. J. (2006). From hawks to doves to self-consistent games of territorial behavior. The American Naturalist, 167, 901–912. [doi:10.1086/504604]
MACY, M. W., & Skvoretz, J. (1998). The evolution of trust and cooperation between strangers: a computational model. American Sociological Review, 63, 638–660. [doi:10.2307/2657332]
MACY, M. W., & Sato, Y. (2002). Trust, cooperation, and market formation in the U. S. and Japan. Proceedings of the National Academy of Sciences of the United States of America, 99, 7214–7220. [doi:10.1073/pnas.082097399]
MASUDA, N. (2005). Ingroup favoritism and intergroup cooperation under indirect reciprocity based on group reputation. Journal of Theoretical Biology, 311, 8–18. [doi:10.1016/j.jtbi.2012.07.002]
MAYNARD-SMITH, J., & Parker, G. A. (1976). The logic of asymmetric contests. Animal Behaviour, 24, 159–175. [doi:10.1016/S0003-3472(76)80110-8]
MESTERTON-GIBBONS, M., & Sherratt, T. N. (2012). Divide and conquer: when and how should competitors share? Evolutionary Ecology, 26, 943–954. [doi:10.1007/s10682-011-9550-2]
NAKAI, Y., & Muto, M. (2008). Emergence and collapse of peace with friend selection strategies. Journal of Artificial Societies and Social Simulation, 11 (3), 6 https://www.jasss.org/11/3/6.html.
NETTLE, D., Panchanathan, K., Rai,T. S., & Fiske, A. P. (2011). The Evolution of Giving, Sharing, and Lotteries. Current Anthropology, 52, 747–756. [doi:10.1086/661521]
NOWAK, M.A., & May, R. (1992). Evolutionary games and spatial chaos. Nature, 359, 826–829. [doi:10.1038/359826a0]
NOWAK, M.A., & Sigmund, K. (1998). Evolution of indirect reciprocity by image scoring. Nature, 393, 573–577. [doi:10.1038/31225]
OHTSUKI, H., Iwasa, Y., & Nowak, M. A. (2009). Indirect reciprocity provides only a narrow margin of efficiency for costly punishment. Nature, 457, 79–82. [doi:10.1038/nature07601]
RAUB, W., & Weesie, J. (1990). Reputation and efficiency in social interactions: an example of network effects. American Journal of Sociology, 110, 626–654. [doi:10.1086/229574]
ROCA, C. P., Sanchez, A., & Cuesta, J. A. (2012). Individual strategy update and emergence of cooperation in social networks. Journal of Mathematical Sociology, 36, 1–21. [doi:10.1080/0022250X.2010.520830]
SANTOS, F. C., & Pacheco, J. M. (2005). Scale-free networks provide a unifying framework for the emergence of cooperation. Physical Review Letters, 95, 098104. [doi:10.1103/PhysRevLett.95.098104]
SOLNIT, R. (2010). A Paradise Built in Hell: The Extraordinary Communities That Arise in Disaster. New York: Penguin Books.
SPECHT, J., Fullagar, R., Torrence, R., & Baker, N. (1988). Prehistoric obsidian exchange on Melanesia: A perspective from the Talasea Sources. Australian Archaeology, 27, 3–16.
WOODBURN, J. (1982). Egalitarian societies. Man, 17, 431–451.