
 Abstract
- By hybridizing two kinds of games frequently used in experimental economics, namely, trust games and network games, this paper develops a model of the network-based trust game. Through agent-based simulation of the model, we can demonstrate the positive effects of trust on growth. Even though the underlying technology still provides the fundamental channel for growth, there is an indirect effect on growth through network formation. It is in this network formation process that trust plays a role. The trust considered in this paper is a kind of myopic trust which, through the stochastic choice model, can affect agents' decisions regarding networking, portfolios, and kickbacks, which in turn affects network formation, wealth creation, and distribution.
- Keywords:
- Trust Game, Network Game, Multiplier, Clique, Stochastic Choice, Myopic Trust, Relative Reciprocity
Motivation and
Literature Review
-
We trust the man who seems willing to trust us.
(Adam Smith, Theory of Moral Sentiments, 1759, Part VII, Section IV.) - 1.1
- In his two magnum opuses Theory of Moral Sentiments and Wealth of Nations, Adam Smith, the father of economics, has already placed the relation between trust and the functioning of a market economy as a centerpiece. Recent empirical studies have also shown that social trust is an important determinant of social prosperity or economic growth (see Section 1.1). Nonetheless, trust is not a simple static concept. Neither is it an isolated component, which can be studied by disentangling it from other social entities as an independent control variable. On the contrary, it is constantly evolving with social embeddedness and complexities, acting and reacting upon it, as both the causes and consequences of economic growth. Therefore, a formal model to harness the essence of trust dynamics can be useful; unfortunately, a simple analytical model may not be expressive enough to accommodate the rich surroundings of the issue, such as social networks, social norms, mechanism designs and cultures. In this paper, we build an agent-based model of trust and growth dynamics upon the existing literature on the laboratory experiments of trust games.
- 1.2
- The paper is organized as follows. This section reviews
four related strands of the literature: the empirical studies of trust
and growth (Section 1.1),
the trust game experiments (Section 1.2),
the network game experiments (Section 1.3),
and related work on agent-based models (Section 1.4). Section 2 provides the main body of
the paper, i.e., the agent-based modeling of the trust game. We will
first extend the original two-person one-role-playing model to a
multi-person two-role-playing model (Section 2.2)
and then introduce the essence of the model, i.e., the network
cohesiveness hypothesis (Section 2.3). By that, we modify
the original constant multiplier to become a state-dependent
multiplier. The second part of the model deals with agents' behaviors
(Section 2.4). In this
model, agents' decisions involve networking, portfolios, and kickbacks.
Using a simple version of the stochastic choice model (Luce 1959; McFadden 1974, 1990), agents base all these
three decisions on trust. Section 3
shows the simulation design, followed by the simulation results in
Section 4 and the
concluding section (Section 5).
Trust and Growth
- 1.3
- The seminal paper in this research strand is the one by Knack and Keefer (1997) who, using a cross-sectional OLS regression for 29 market economies, found that interpersonal trust has a positive influence on economic growth (in the period 1980-1992) and investment. By building on that work, Zak and Knack (2001), using an OLS regression for 41 market economies, found a positive coefficient of the effect of trust on economic growth in the period 1970–1992. Beugelsdijk et al. (2004) analyzed the robustness of the results of Knack and Keefer (1997) and Zak and Knack (2001) along four dimensions of robustness: the statistical significance, the influence of changing sets of conditioning variables on the estimated effect of trust, the sensitivity of the results of using different proxies or specifications for basic variables like human capital, and the effects on the significance and effect size when the 29-country sample by Knack and Keefer (1997) is extended by 12 in Zak and Knack (2001). Altogether, they estimated 1,540 equations and obtained highly robust results for the positive correlation between economic growth and generalized trust.
- 1.4
- La Porta et al. (1999),
using an OLS regression for 39 countries and a cross-section design and
taking the growth of GDP per capita (from 1970–1993) as a dependent
variable, found a positive relationship between trust and economic
growth. Whiteley (2000),
using a cross-section design in a 34-country sample and taking the
growth rate of GDP per capita (from 1970-1992) as the dependent
variable, concluded that an index of three trust indicators from the
World Value Survey 1990-93 has a positive effect on economic
growth, with an impact as great as the human capital variable. Berggren
et al. (2008)
investigated whether previous results on the trust-growth relationship
for the period 1970-1992,
studied by Zak and Knack (2001)
and Beugelsdijk et al. (2004),
also hold for the
1990s. They found that when outliers are removed the trust-growth
relationship is only statistically significant (with significance at
the 95-percent level) in ten percent of their 1,140 regressions and
that it is half as large compared to the results that had been
previously reported. They, however, conclude that
[e]ven though trust may not be robustly related to growth, it could still be important to some degree - and at least as important as many other 'classic' variables. (Berggren et al. 2008, p. 267)
- 1.5
- Dearmon and Grier (2009) found support for the trust-growth relationship using a panel of 51 countries, applying three kinds of robustness checks: performing a country-by-country jackknife exercise, testing whether the richer and poorer countries in the sample can be legitimately pooled together in a single regression equation and, finally, investigating the temporal stability of their results. Algan and Cahuc (2010), in order to control for omitted time invariant factors and other observed time-varying factors such as changes in the economic, political, cultural and social environments, adopted a new methodology focusing on the inherited component of trust and on its time variation over long periods. They found that changes in inherited trust explain a substantial part of the changes in economic development over the period 1910–2000, even when country fixed effects, past economic development, the evolution of other institutions, cultural values, religion or education are accounted for.
- 1.6
- In sum, we can say that the research conducted so far
largely supports the hypothesis that trust has a positive
effect on economic growth, even if its relative importance
compared to other factors is an issue still unsettled. Given this
impressive amount of empirical work, the progress in the theoretical
work is rather limited. Apart from the above empirical neoclassical
growth models, the only theoretic work known to us is Zak and Knack (2001), which is based on an
infinite-horizon utility-maximization model. In this theoretic work,
the income distribution is given, and the causality is in the direction
from distribution to trust and then to growth. The explicit role of
networking in growth is absent. In this paper, we shall take a
different approach from the aforementioned model, which allows for the
explicit role of networking and is able to demonstrate the co-evolution
of wealth distribution, trust, social capital, and economic growth.
Trust Games
-
The Origin
- 1.7
- Trust and reciprocity have been studied by experimental
economists since 1995, when Berg et al. (1995)
published a paper where they reported the results of an investment game
that became the prototypical trust game in the subsequent works. In
this two-stage game, the two players are endowed with $10 each. In
stage 1 the first mover decides how much money to pass to an anonymous
second mover. All money passed is tripled. In stage 2 the second mover
decides how much to return to the first mover. In this original
experiment, out of 32 first movers, 30 sent positive amounts and only 2
sent 0, whereas, out of 28 players who received amounts greater than
$1, 12 returned $0 or $1, and 12 returned more than their paired player
sent them. So, the results clearly departed from the Nash equilibrium
outcome that would be reached by perfectly rational and selfish
players. This experiment has been replicated many times since then,
showing that these results are, from a qualitative point of view, quite
robust. It is now widely accepted that trust and reciprocity are
fundamental aspects of human social behavior.
Repeated Trust Games
- 1.8
- However, most studies on trust games are one-shot only, which shed little light on the relationship between trust and economic prosperity, since feedback and learning as the necessary process for social capital accumulation are not allowed in the one-shot game. Studies on repeated trust games, while relatively few, also exist.[1] Repeated trust games enable us to have additional treatments to study the effect of subjects' learning or experiences, their interaction patterns and employed strategies, and the significance of reputation, information provision, and other related institutional designs. Repeated games are further divided into finite games and indefinite games. They differ in the determination of the duration of the game; for the former, it is fixed at the outset, whereas, for the latter, it is stochastically determined. This difference further allows us to study the endgame effect (see below). The repeated game can be also be distinguished by whom the subject is matched to. In the fixedly-pairing game, he is matched to the same opponent through the entire duration of the game, whereas in the randomly-pairing game, his opponent is randomly determined in different rounds. The latter distinction allows us to study the significance of reputation.
- 1.9
- The basic questions to address with the repeated design are then two-fold. First, will trust and reciprocity observed in the repeated game differ from the one-shot game? Second, will the observed level of trust and reciprocity in the repeated game change over time? For the former, it was found that the repeated game can enhance both the level of trust and reciprocity, measured by the investment rate and the return rate (Cochard et al. 2004); for the latter, the sudden drop in or collapse of the investment rate and return rate, known as the endgame effect, was frequently observed in the finite repeated game (Anderhub et al. 2002; Cochard et al. 2004; Engle-Warnick & Slonim 2004), while less in the indefinite game (Engle-Warnick & Slonim 2006a). For the randomly-pairing games, by introducing reputation mechanisms, the level of trust and reciprocity can both increase to a substantial degree (Keser 2003; Boero et al. 2009; Charness et al. 2011; Duffy et al. 2013).
- 1.10
- To some extent, the behavior observed in the repeated trust games can be useful for our design of artificial agents. For example, the well-known reciprocity hypothesis (Fehr & Gächter 1998) shall predict that the amount sent by the trustor in the current period is positively related to the proportion returned by the trustee in the previous period, and the proportion returned by the trustee is positively related to the amount sent by the trustor. This hypothesis, which has been examined and well accepted by Cochard et al. (2004), will be taken as the basis upon which the behavioral model of our artificial agents is built (see Section 2.4).
- 1.11
- Furthermore, from a statistical viewpoint, repeated trust
games also allow us to have a proper size of observations to infer the
strategies employed by the agents from their repeated interactions (Rieskamp & Gigerenzer 2002;
Engle-Warnick &
Slonim 2004, Engle-Warnick
and Slonim 2006b). A number of heuristics mentioned in these
studies have a flavor of reciprocity. They articulate some variants
consistent with the reciprocity hypothesis. In these articulations, for
the trustor, thresholds (reference points, expectations) are employed
to decide whether his investment should increase, stop, or decrease in
this or the following periods based on the returns received from the
trustee in the previous period(s), and, for the trustee, there are
similar forms to decide his returns in this or the following periods.
These reference points or expectations may have neuropsychological
foundations and are related to recent studies on repeated neurotrust
games (King-Casas et al. 2005;
Delgado et al. 2005; Krueger et al. 2008). Various
heuristics proposed therein might be useful for the construction of
artificial agents in the future.
Network Games
-
Trust Coming to the Network Games
- 1.12
- The repeated two-person trust game may be a good starting point for the study of the trust and trustworthiness at a societal level, but it alone is not sufficient to give the grand picture. After all, in dealing with the relationship between trust and growth at the macroeconomic level one is required to address the N-person trust game or a trust game carried out in a network. In this regard, the literature on the network games is also involved.
- 1.13
- The seminal work by Jackson and Wolinsky (1996) and Bala and Goyal (2000), who pioneered a game-theoretic approach to study the formation of social and economic networks, led to a surge in interest in network game experiments (Deck & Johnson 2004; Callander & Plott 2005; Goeree et al. 2009; Di Cagno & Sciubba 2010; Falk & Kosfeld 2012). Through these experiments, we can examine whether some specific kinds of networks will be formed, as network game theory suggests, such as the star network, the ring network, and the fully connected work. These networked "societies", through their formation and growth, can have implications for wealth distribution, measured by the total payoffs of the society; nevertheless, the allocation rules in these games are exogenously given. Hence, these setups leave no role for social trust to play in the wealth distribution process. As a result, most of these network game experiments have nothing to do with trust or wealth creation.
- 1.14
- Di Cagno and Sciubba (2010)
is the only study which integrates trust into network experiments. They
ran a laboratory experiment with two phases in sequence: a network
formation game, where experimental subjects make choices on potentially
beneficial network connections, and a trust game. The trust game is
played only once, while the network formation game is a repeated game
with a random stopping rule. As a control, experimental subjects play
the trust game on its own (baseline). The main innovation in this
setup, compared to the original setup of Berg et al. (1995), is that the trust game is
no longer anonymous since participants know each other from the network
formation game that is played first. The result shows that the
information that players gather in the network formation game allows
trustors to direct their trust towards more trustworthy recipients,
thereby reducing their offers to the rest. Thus, trust becomes more
selective.
Three-Person Trust Games
Figure 1. Three-Person Trust Games in Network Settings - 1.15
- In addition to bringing in trust as an essential ingredient of network games, it is also interesting to look at the other direction, i.e., to extend the standard two-person trust games into a network setting. Some three-person trust games, as a minimum departure from two person trust games, have been proposed to explore this direction. Buskens (2003), to the best of our knowledge, is the first one to address the dyadic relation of the two-person trust game in a social-network setting, which he termed as network embeddedness. To be minimal, only triads are considered. Two such triads are proposed: in one case, there is one trustor facing two trustees, and, in the other case, there are two trustors facing one trustee. These architectures are shown in Figure 1 (left panel), which has also been used in Cassar and Rigdon (2011) and Bauernschuster et al. (2013) for different treatments. Sheremeta and Zhang (2014) first extended the single trust game to a chain of trust games; they formulated it in a hierarchical manner to mimic the hierarchical organization. As shown in Figure 1 (right panel), there is a two-person trust game from A (the trustor) to B (the trustee) and then again from B (the trustor) to C (the trustee). It is then up to C to decide the returns to both A and B.
- 1.16
- One common feature of these architectures is that the
dyadic relation is not isolated, but is actually embedded within a
network (a triad). The embedded network can then provide some
additional operators that the single dyadic relation does not have,
such as competition (Bauernschuster
et al. 2013), information sharing (Buskens
2003; Buskens et al. 2010;
Cassar & Rigdon 2011)
and insider communication (Sheremeta
& Zhang 2014). As a result, it would be interesting
to see how this embedded network can affect the level of trust and
reciprocity (trustworthiness) for all these dyadic relations under
these different institutional and behavioral settings. As we shall see
in Section 2, our
proposed network-based trust game model is a generalization of this
idea of network embeddedness.
Agent-Based Modeling of Trust and Economic Networks
- 1.17
- Through the behavioral model of trust, one can extend what we learn from the trust game experiments to more general economic situations. In fact, the recent progress in the agent-based modeling of trust provides a number of possible ways for this extension (Macy & Skvoretz 1998; Gorobets & Nooteboom 2005; Tykhonov et al. 2008; Kim 2009; Will 2010; Sutcliffe & Wang 2012). In these studies, trust is treated as a state variable in the model, which is evolving over time. In particular, it behaves like a kind of capital, which, depending on the conditions given, can both accumulate and depreciate over time. Being part of a decision rule, trust informs agents on various business decisions, from the selection of trading partners to various fine details of the subsequent transaction process. The results of the trust-based decision rules can go far beyond just individuals and have far reaching economic and social consequences, such as the realization of specialization and economies of scale. While some models focus on a two-level (buyer-and-seller) bilateral trade economy (Macy & Skvoretz 1998; Gorobets & Nooteboom 2005), some others have extended themselves into multi-level supply chain economic networks (Tykhonov et al. 2008; Kim 2009).
- 1.18
- Our study on the role of trust in an economy is related to, but different from, the aforementioned models. These earlier studies have markets or networks of markets as the focus, whereas our study attempts to focus on the whole economy. In other words, earlier studies were a kind of microeconomics of trust, while ours are somewhat focused on the macroeconomics of trust. Despite these differences, there is a thread traversing through the two. In fact, the earlier studies may already suggest a link, although not explicitly, from trust, to networking, then to growth (the scale effects, the realized profit increments). The essence of our modeling is to place the networking-growth mechanism directly in the model and in a more abstract economy so that the networking behavior through market institutions or through non-market institutions can all be taken into account. In our model, instead of tracing the details of various possible networking-growth routes, we simply use the more abstract network-based trust games to directly deal with business opportunities derived from these "multiplexes".
- 1.19
- In addition, it deserves to be mentioned that there are some works which explicitly share the same essences of our models, namely, Bosse et al. (2008) on the reciprocity hypothesis, Forkmann et al. (2012) on network embeddedness, and Bravo et al. (2012) on the endogenous formation of networks through partner selection. Bosse et al. (2008) consider the relation between cognitive system (capacity) and trust formation. Agents in their model are heterogeneous, characterized by different cognitive systems, and it is assumed that reciprocity in the form of investment ("I help you") and return ("you will help me") requires a cognitive capability to handle an inter temporal calculation. Those endowed with the cognitive capability to do so end up with a larger number of intensified connections, whereas those without this endowment end up with a peripheral position. Forkmann et al. (2012) propose an agent-based model of business networks. They address a dyadic relation also using the idea of network embeddedness. In this model, the firm is assumed to have a perception of its position of its embedded network, and based on that perception (the power, the influence), it adopts some specific network strategy to interact in business relationships. The agent-based model is used to simulate the network strategy dynamics and business relationships.
- 1.20
- Among these agent-based models, the only one which is closely tied up with human subject experiments is Bravo et al. (2012). In their so-called experiment-like model, agents' investment and reciprocity decision rules are experimentally parameterized, i.e., the values of these parameters are calibrated using the estimates from two person randomly-pairing trust game experiments. Bravo et al. (2012) use these artificial agents (more than 100) to embed the trust game in eight different network structures, including some endogenously evolving (dynamic) structure with different partner selection algorithms. Our paper bears some resemblance to this work. First, we both have a partner selection mechanism that plays a pivotal role in the model. However, our proposed selection algorithm allows agents to not only just delete links but also to be able to add links, and hence allows network size to change both upward and downward. It also allows agents to distinguish relative trustfulness and reciprocity by giving weights to different partners. Second, we both consider the extension of the conventional trust game into a multi-person dual-role version; nonetheless, due to our concern with economic growth, the multiplier in our model is not fixed but is state-dependent, which hinges upon the social network characterization.
Network-Based Trust Game
- 2.1
- The original version of the trust game (Berg et al. 1995) has three
essences: two persons, each person taking one role (either trustor or
trustee), and a fixed multiplier. In our extended version, we consider N
persons, each taking a dual role, and a state-dependent multiplier.
Before we formally introduce the model, it is useful to highlight some
of its distinguishing features as compared to the experimental trust
games, which we have reviewed in Section 1.2.
A Dual-Role, Infinitely-Repeated, and Free-to-Choose Design
- 2.2
- First, each agent can have a dual role in our model, i.e., being both a trustor and a trustee. The idea of the dual role is not entirely new. Burks et al. (2003) has initiated such a design. In their setting, the dual role is carried out through a two-stage game; hence, in one stage, the agent plays the role of a trustor, and in the next stage the agent plays the role of a trustee. Our agent-based model differs from this design in that agents can simultaneously play the role of a trustor and a trustee. Despite this difference, the experimental findings using the dual-role design may be more pertinent to us, since this design is closer to us than the single-role design.[2]
- 2.3
- Second, the game simulated by the agent-based model is obviously dynamic and infinitely repeated, even though it has to stop after a finite number of times or after some criteria being met. Hence, in this regard, it is different from both the finite game and the indefinitely finite game run in the human-subject experiments. As a result, the endgame effect is not a primary concern for us.
- 2.4
- Third, agents in our model can choose partners, mainly
trustees. Despite its prevalence in real life, this free-to-choose
behavior has rarely been examined in laboratory trust games. Most of
the repeated games either apply the fixedly-pairing design or
randomly-pairing design. Bornhorst et al. (2010),
Slonim and Garbarino (2008),
and Bauernschuster et al. (2013)
are the only few exceptions known to us that use the free-to-choose
design. This free-to-choose mechanism not only enables our agents to
initiate a business relationship with a stranger, but they can
consolidate this relationship into a faithful partnership. As we shall
see below, the free-to-choose mechanism is concretized by a stochastic
choice model, which embodies the idea of the reciprocity hypothesis,
and, to some extent, can be considered as an alternative to the
reputation mechanism or other related information-provision mechanisms
used in the laboratory literature (see Section 2.5 for more discussion on).
The Model Sketch
- 2.5
- The network-based trust game is a hybridization of both the
repeated trust games and the network games.
It is outlined as follows. N agents engage in a
repeated trust game with T repetitions (T
rounds). In each round, each agent has to make a
two-stage decision: networking and investment.
- (Partner Selection) In the first
stage, which is called the network formation stage
or the partner selection stage, the subject i
(i = 1, 2,..., N),
acting as a trustor, has to decide whom he would
like to choose to be his trustees, say j (j ≠
i). Denote this
decision by δij.
(1) A link between i and j is said to be formed only if either δij = 1or δji = 1. That is all links are undirected.[3]
- Based on the first-stage decisions of all agents, a
network topology is determined by a set of links, g,
(2) The neighbors of agent i, denoted by Ni, are defined as follows.
Ni = {j: δij = 1 or δji = 1, j = 1, 2, … , N and j ≠ i} (3) - In the second stage, a standard trust game is
implemented on each pair connected by a link
 . This will separate agent i's
neighbors into two sets: the trustees of i (to
whom agent i will send money, δij
= 1) and the trustors of i (from
whom agent i will receive money, δji
= 1), denoted as Ni,S
and Ni,R, respectively.
Obviously, Ni = Ni,S∪Ni,R,
but Ni,S ∩ Ni,R
may be nonempty.
. This will separate agent i's
neighbors into two sets: the trustees of i (to
whom agent i will send money, δij
= 1) and the trustors of i (from
whom agent i will receive money, δji
= 1), denoted as Ni,S
and Ni,R, respectively.
Obviously, Ni = Ni,S∪Ni,R,
but Ni,S ∩ Ni,R
may be nonempty.
- (Investment) Then, for
all those
links in which the agent i plays the role of a
trustor (δij = 1), he/she
has to make a decision on the investment in each link, ki,j
(j ∈Ni,S)
constrained by his/her endowment or wealth.
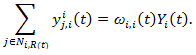
(4) and send the money. In the meantime, agent i's trustors js (j ∈Ni,R) also make decisions on their investment in i and send the money to him. As to the investment decision per se or the determination of ki,j, this will be discussed in Section Section 2.4.
- (Social Cohesiveness Hypothesis)
All
the investment ki,j will
then be associated with a multiplier τi,j,
which depends on the network topology. This leads to a major novelty
and a key contribution of the paper. The multiplier,
intuitively, is related to productivity. The idea is to fully
acknowledge the significance of the network size or the scale effect on
productivity. A similar idea has been found in many places in the
economic literature, such as the knowledge externality or spillover in
endogenous growth theory (Varga
& Schalk 2004), the agglomeration effect in economic
geography (Fujita & Krugman
2004), and so on.
In the investment game, all business relation are simply dyadic, but the dyadic relation is not isolatedly placed. Instead, it is embedded within a large network where many other dyadic relations co-exist. We first assume that the cohesiveness of this social embeddedness functions as an infrastructure which can be productivity-enhancing, and then use the size of the clique containing the specific dyadic relation as a measure of the size. A clique is a completely (fully) connected subnetwork of a given network. Let
 be the clique (the largest
fully connected subnetwork) that or, equivalently,
be the clique (the largest
fully connected subnetwork) that or, equivalently,  belongs to.

(5) The network cohesiveness is then defined as the degree of
and is denoted by  .
.
By Equation (5), we are searching for the maximally fully connected subnetworks within which the business relationship between i and j is embedded (An example is shown in Figure 2). Intuitively, if the business between i and j is run within a well-connected society instead of a fragmentally isolated small group, then we expect a larger scale effect.
Figure 2. An Illustration of Cliques: The above figure gives an illustration of cliques. In this example, the network has four nodes, {1, 2, 3, 4}, and four dyadic links:  and
and  and
and
 . It is clear that the set of nodes {1, 2, 3} is
of itself a fully connected component, but {1, 2, 3, 4} is not fully
connected. Hence, the maximal fully connected network in which the
dyadic relations and
are embedded is {1, 2, 3}, i.e.,
. It is clear that the set of nodes {1, 2, 3} is
of itself a fully connected component, but {1, 2, 3, 4} is not fully
connected. Hence, the maximal fully connected network in which the
dyadic relations and
are embedded is {1, 2, 3}, i.e.,  = {1, 2, 3}, and
  . The dyadic relation
does not have a larger embedded fully connected network except {3, 4}
itself; therefore,
. The dyadic relation
does not have a larger embedded fully connected network except {3, 4}
itself; therefore,  = {3, 4}, and
  =
2.
=
2.
- (State-Dependent Multiplier)
Consequently, we assume that the multiplier τi,j
is monotonically increasing in (the size of ). We
now set the investment multiplier as a linear function of the
cohesiveness of the social embeddedness of the partner relation (i,
j), i.e.,
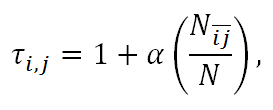
(6) where α is a constant. Notice that when the cohesiveness comes to its maximum, i.e.,
= N,
τi,j = 1 + α.
By setting α = 2, we then have the usual setting
of having a multiplier of three, frequently used in experimental
economics. The production function and the total return received by the
trustee is
yi,j = τi,j ki,j. (7) By Equation (6), τi,j = τj,i; hence, yj,i = τj,i kj,i.
- Kickbacks) Then, as the
usual
second stage of the investment game, agent i has to
make his decision on the share of the yield yj,i
(j ∈ Ni,R)
that he would like to return to his trustors j. We
denote his own reserve by yij,i
and hence his trustworthiness by yjj,i.
yij,i + yjj,i = yj,i. (8) In the meantime, he also receives money from his own trustees, yii,j (j ∈ Ni,S). The details of the decision on kickbacks will be fully developed in Section Section 2.4.
- This finishes one round of the network-based
investment
game. An end-result is the net income earned by agent i:
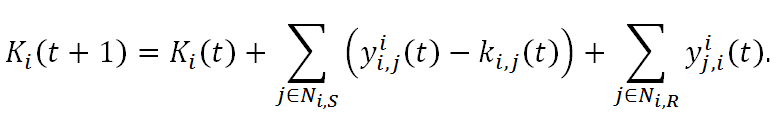
(9) - We then go back to step (1). Each subject renews the network formation decisions, and they together form a (possibly) new network topology. The trust game, steps (3) to (8) is then played with this renewed social network with additional links being added or deleted.
- The cycle from steps (1) to (8), as described in (9), will continue until the maximum number of rounds, T, is achieved.
Figure 3. An Overview of the Two-Stage Decision Games: The above figure gives a summary of the two-stage decision. In each run of the trust game, in stage one the agent has to make a decision on his set of trustees and the investment portfolio, and in stage two the agent has to decide the kickbacks to his/her trustors. A State-Dependent Investment Multiplier
- (Partner Selection) In the first
stage, which is called the network formation stage
or the partner selection stage, the subject i
(i = 1, 2,..., N),
acting as a trustor, has to decide whom he would
like to choose to be his trustees, say j (j ≠
i). Denote this
decision by δij.
- 2.6
- This function (6) can be made more flexible to
accommodate
different hypotheses of network productivity. Let us elaborate on a few
possibilities. For example, in Equation (6), the measure of
cohesiveness is based on the size of the clique
to which both i and j belong.
Other measures which capture similar ideas may be expressed in the
following general form:
τi,j = 1 + αf(τi, τj), (10) whereτi and τj are the importance measures of Nodes i and j, respectively. The literature on social networks has several measures for τi, such as degree, cluster coefficients, centrality, etc.
- 2.7
- Furthermore, the linear productivity function
can be
generalized to a non-linear function, and then the effect of network
cohesiveness on productivity may not always be positive or may not
always change at the same rate. This direction certainly enables us to
have a more in-depth exploration of the idea of the network
cohesiveness on productivity, since the network cohesiveness hypothesis
is a major assumption underlying the overall analysis.
Trust-Based Heuristics
- 2.8
- Section 2.2
provides a general description of the network-based trust game model.
However, unlike most studies on the trust game, which use human-subject
experiments, this study is based on agent-based simulation. Hence, we
need a separate section to address the behavioral aspects of the model.
That is, we need to formulate the possible interesting behaviors of
artificial agents in this model, which, of course, can be further
verified using the lab experiments. Based on the description in Section
2.2, there are three
major behavioral aspects that need to be addressed, namely, the
decisions on trustee selection (Step 1), investment
and portfolios (Step 4), and kickbacks
(Step 7).
Trustee Selection
- 2.9
- First, we begin with the trustee
selection. The
starting
question is how to characterize an appropriate set of alternatives for
agents. We can make no restriction on the set of candidates, i.e., the
agent can always consider every one in the society except himself {1,
2, ..., N}\{i}; nonetheless, how
many trustees can he choose at each run of the game? One obvious
setting is as many as he wants. However, in considering all costs
associated with communication, search, computation, or, simply,
transaction costs, it seems to be reasonable to assume an incremental
process for the upper limit of the number of trustees that an agent can
choose. This upper limit is primarily restricted by the cost
affordability of the agent. Here, without making these costs explicit,
we indirectly assume that the affordability depends on the wealth of
the agent, i.e., Ki. Hence,
in a technical way, we assume that the additional number of trustees
(links) can be available if the growth of the wealth increases up to a
certain threshold. For example, an additional link becomes possible if
he has positive growth in wealth, and vice versa.
(11) where
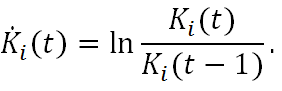
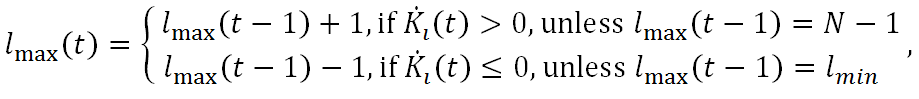
(12) - 2.10
- Note that Equation (11) serves only
as a
beginning for many
possible variants, but the idea is essentially the same: each agent
starts with a minimum number of links, say lmin
= 1, and gradually increases the number of links
associated with his good investment performance, and vice versa. One
can certainly consider different measures of investment performance,
but we shall leave this issue for the further study. The rule (11)
leaves two possibilities for the agent to change at each point in time:
either adding one link (if he has not come to the maximum) or deleting
one link (if he has not come to the minimum). For the former case, he
will choose one from those who were not his trustees in the last
period, i.e., the set S\Ni,S(t
−1); for the latter case, he will choose one from his
last-period trustees, i.e., the set, Ni,S(t
−1). Let us assume that, for both cases, his main concern
for this one-step change is performance-based
or trust-based. Call this the trust-based
selection mechanism, which basically says that the agent
tends to add the most trustworthy agent and delete the least
trustworthy agent. To do so, let us define the effective rate
of return on the investment from agent i to
j, measured in terms of its kickbacks, as
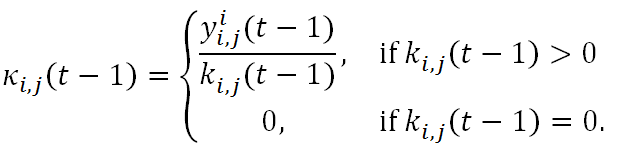
(13) - 2.11
- Then the frequently used logistic
distribution can
be used to substantiate the trust-based selection mechanism as follows.
Figure 4. An Illustration of the Trustee Selection and Portfolio Decision: The above figure shows that the agent i has selected agent 2, i + 1, and N as his/her trustees at time t, i.e., Ni,S (t) = {2, i + 1, N}. He then decides the portfolio of the investment to each of the three trustees based on Equations (16) and (17). The size of the investment is denoted by the thickness of the link. 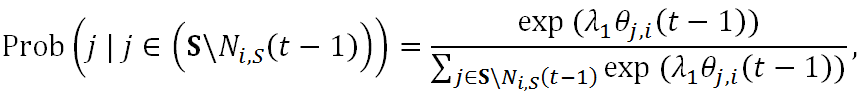
(14) where
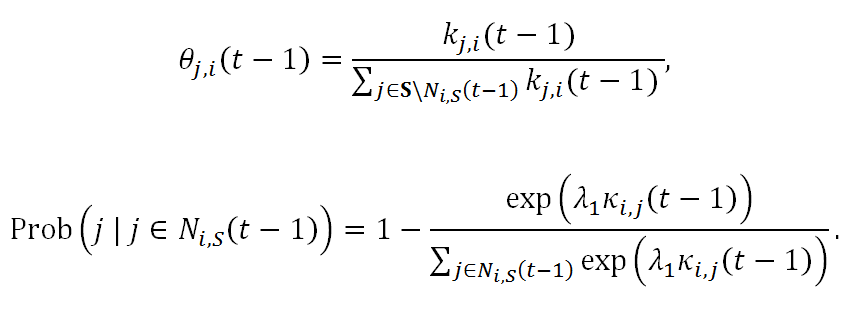
(15) - 2.12
- Equations (14) and (15) are
familiarly known as
the
stochastic choice model, and the parameter λ1
is known as the intensity of choice. In this paper,
we shall call it the degree of relative reciprocity.
Equation (14) above applies to the situation where agent i can
add a link, whereas Equation (15) applies to the situation where agent i
needs to delete a link. By Equation (14), agent i
tends to favor more those agents who have good trust in
him and invest in him generously, i.e., j ∈ Ni,R
(t −1) and kj,i
(t −1) (θj,i(t
−1)) ≫ 0, than those who did not, i.e., j ∉Ni,R(t
−1)(kj,i(t
−1) = 0). By Equation (15), agent i will
most likely cut off the investment to the agent who offers him the
least favorable rate of return, i.e., the lowest κ.
Investment and Portfolios
- 2.13
- Once the new set of trustees (Ni,S
(t)) is formed, the
trustor then has to decide the investment portfolio applied to them,
i.e., how to distribute the total wealth, Ki(t)
over Ni,S
(t) ∪{i}.
We assume again that this decision will also be trust-based.
The idea is that agent i tends to invest a higher
proportion of his wealth in those who look more promising or
trustworthy, and less to the contrary. Technically, very similar to the
decision on the trustee deletion (Equation 15), let us assume that
agent i will base his portfolio decision on the
effective rate of return κi,j(t
−1). Those who have reciprocated agent i handsomely
in the previous period will be assigned a larger fund and vice versa.
Then a trust-based portfolio manifested by the logistic distribution is
as follows:
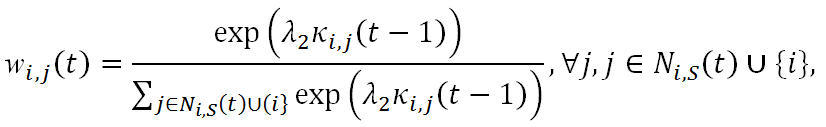
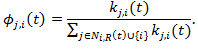
(16) where wi,j(t) is the proportion of the wealth to be invested in agent j; consequently,
ki,j(t) = wi,j(t)Ki(t). (17) The above decision is illustrated in Figure 4. Two remarks need to be made here. First, part of Equation (16) is self-investment, i.e., wi,i(t), and
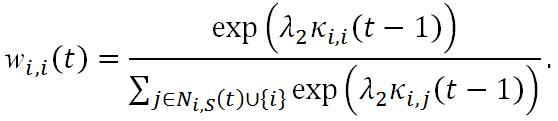
(18) - 2.14
- Like the typical trust game, agent i can certainly hoard a proportion of wealth for himself; however, based on the rules of the trust game, this capital will have no productivity and its effective rate of return is always 1, κi,i(t) = 1, ∀t. Therefore, by Equation (16), hoarding becomes more favorable when an agent suffers general losses on his investment, namely, κi,j(t − 1) < 1 for most j. Of course, when that happens, the social trustworthiness observed by agent i is lower and he can then take a more cautionary step in external investment.
- 2.15
- Second, for the new trustee (j
∉
Ni,S
(t − 1)), κi,j
(t − 1) is not available.
We shall then assume that it is κi,0,
which can be taken as a parameter of agent i's
trust in new strangers.[4] The
culture or the personality which tends to have little trust for new
partners, being afraid that they will take all the money away, has a
lower κ0 and zero in the
extreme. The culture or the personality which tends to be more friendly
toward newcomers has a relatively higher κ0.
Even though κ0 can be
interpreted as a kind of trust toward agents' new trustees in this way,
its appearance in Equation (16) makes this parameter also have a
discriminating role to play. In fact, from Equation (16), one can see
that, depending on its magnitude, κ0
can be discriminating either against new partners or old partners, when
a portfolio decision is made. Therefore, κ0
is not just about trust, but more about the discrimination between the
old and the new. The introduction of this parameter then leaves us room
to examine how this initial trust (discrimination) may impact the later
network formation.
Kickbacks
- 2.16
- Finally, we consider the decision
related to
kickbacks.
When investing in others, agent i also plays the
role of a trustee and receives money from others kj,i
(j ∈Ni,R).
In the end, the total revenues generated by these investments are given
in Equation (19).
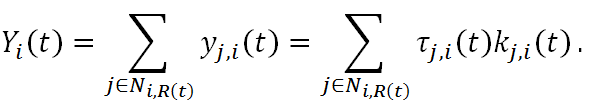
(19) - 2.17
- Let us assume that the total fund
available to
be
distributed to agent i himself and all of his
trustors is simply this sum, Yi(t).
That is, agent i will not make an additional
contribution from his private wealth to this
distribution.[5]
Furthermore, we assume that the decision
regarding kickbacks is also trust-based. We assume
that agent i tends to reciprocate more to those
who seem to have a higher degree of trust in him
and less to those who seem to have less. This
subjective judgement is determined by the received size of investment, kj,i(t).[6] Hence, a
straightforward application of the logit model leads to the proportions
of kickbacks allocated to each trustor of agent i.
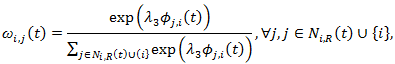
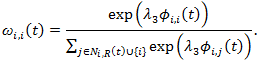
(20) where ωi,j(t) is the proportion of Yi(t) that will be returned to agent j as kickbacks, and
Hence
yjj,i = ωi,j(t)Yi(t). (21) Note that part of Equation (20) is the reserves that agent i keeps for himself. In fact,
(22) By Equations (17) and (18), the self-investment is
ki,i(t) = wi,i(t)Ki(t), (23) and the "retained earnings" are
(24) 
Figure 5. An Illustration of the Kickback Decision: The above figure shows that agent i has two trustors in time t: Ni,R(t) = {1, i + 1}. Their investment size to agent i is denoted by the thickness of the link. In this case the investment from agent 1 to agent i (the dark solid line) is much larger than that from agent i + 1 (the grey dotted line). Hence, based on the reciprocity heuristics, Equation (21), agent i returns more generously to agent 1 than agent i + 1 accordingly, also denoted by the thickness of the line. - 2.18
- Then the behavioral interpretation of Equation(22) is that the agent who has large hoarding size tends to be more selfish in the sense tha he keeps a large proportion of the fund as "retained earnings",reserved for himself. Such people invest a small share in others, but keep a large share to themselves. These people are, therefore, less social and less cooperative. The parameter which dictates this behavior is κ0, introduced in Section 2.4.2. Figure 5 gives a demonstration of the kickback decision.
-
Myopic Trust
- 2.19
- Equations (14), (15), (16), and (20) together specify the behavioral heuristics behind the decisions on networking, portfolios and kickbacks. In other words, the trust-based heuristics are consistently formulated using the stochastic choice model, parameterized by λ1, λ2, and λ3 (the three intensities of choice or the degree of relative reciprocity). Since trust is a quite subtle concept, and a single paper cannot capture its great subtlety, it is necessary to make a remark on the kind of trust formulated in this paper. The trust manifested through the stochastic choice model is only based on the immediate responses, and not the accumulated ones, or any historical ones. Therefore, it implies a trust based on the "short-term memory", which we shall call the myopic trust. The myopic trust may be suitable for capturing social interactions with strangers, but not necessarily for those with acquaintances.
- 2.20
- While the notion of the myopic trust may make our model seemingly different from those models mentioned in Section 1.4, which all build trust upon the long-term memory, it does not mean that agents in our model cannot have a long-term relation. In fact, as we can see from the simulation shown below, agents in our model did in general develop a long-term relation; nonetheless, the partner relations among agents are normally sustained by continuing economic growth rather than by the long-term memory. This may distinguish our model of trust, driven by technology or institutions, from those models of trust based on acquaintances.[7] At this stage, so as to not make the model exceedingly complicated, we shall refrain from pursuing those models of trust based on long-term memory or more deliberate cognition. We, however, will come back to this issue in the following sections.
- 2.21
- It is also useful to make a few remarks on our proposed stochastic choice model in light of the results from the experimental trust games, as we surveyed in Sections 1.2 and 1.3. First of all, as mentioned earlier, the idea of the reciprocity hypothesis (Cochard et al. 2004) is implemented in our model. Equation (16) shows the positive effect of returns (reciprocity) on investment (trust) and, similarly, Equation (20) shows the positive effect of investment (trust) on returns (reciprocity). Secondly, in terms of an N-person trust game, there is a comparative trust hypothesis (Cassar & Rigdon 2011) or the relative reciprocity hypothesis. This has also been captured by the stochastic choice model, because both Equations (16) and (20) clearly indicate, through the parameters λ2 and λ3, that what matters for trustors (trustees) is the relative level of trust (trustworthiness), not the absolute one. Hence, if all the trustees of trustor i increase their returns to i, only those who increase their returns by relatively large amounts will gain additional trust from i. Third, regarding the partner-selection behavior, based on Equation (15), it is the one with the lowest level of trust worthiness that will most likely be removed. Hence, our stochastic choice model has basically incorporated the most essential ingredients of the human-subject experiments.
- 2.22
- The only major ingredient to which experimental economists pay a lot of attention but we do not is the reputation mechanisms and hence the strategies to deal with strangers. Nonetheless, our model is not a randomly-pairing design, neither a fixedly-pairing design; as a matter of fact, it is a hybrid of the two. This uniqueness emanates from our free-to-choose design which is generally absent in experimental studies. The free-to-choose design can allow each agent to maintain the link with those faithful partners; therefore, as mentioned in section 2.1, reputation mechanisms are not that indispensable to us.
Simulation Design
-
Figure 6. The Agent-Based Network-Based Trust Games: The NetLogo Demonstration: The upper left panel shows the user-supplied control parameters. The major control parameters used to run the simulations of the model are set here, including the number of agents (N), the multiplier (α), the degree of relative reciprocity (λ), and the initial trust (κ0). To the right, the upper middle panel gives the dynamics of the network connections, as demonstrated by a ring. Further to the right, the upper right panel shows the distribution of the size of cliques (Equation 5). Right below the size distribution are two characterizations of the current state of the evolving network: one is the cluster coefficient, and the other is the average path length. The lower panels give the monitors of four time series. From left to right, they are the average degree (social capital), the average wealth (physical capital), the average return on the investment, and the Gini index. In addition to the four time series, the time series of the average clique size is also depicted with the average degree in the lower leftmost panel. - 3.1
- The above agent-based model of the trust game has been written using NetLogo, version 5.1.0 (Wilensky 1999, 2005), developed by one of our co-authors, Bin-Tzong Chie. The interface is shown in Figure 6, which includes all the key aspects of the simulation model from its parameter setting, running and result demonstrations.[8]
- 3.2
- Our plan is to first work out a set of simulations so as to facilitate the examination of versions with different parameter settings. As the first step in this exploration, we try to keep a reasonably minimal degree in terms of scale, diversity, and dimension. Regarding scale, we consider a small-scale society, specifically, a society of 100 agents (N = 100). Regarding diversity, we consider a homogeneous society, i.e., all behavioral parameters indexed by i can be identical among all agents. Finally, on dimensionality, we consider a one-dimensional parameter space for the degree of relative reciprocity (λ1, λ2, and λ3).
- 3.3
- In our model, the trust-based behavior is manifested through the logistic distribution with the parameters λs. The three λs correspond to three different kinds of trust-based behavior, namely, the trustee selection, portfolio decision, and kickback decision. In this initial setting of the simulation, we may simplify these three-dimensional trust relations into one dimension by assuming their identity, i.e., λ1 = λ2 = λ3 = λ.
- 3.4
- he minimal model with the above
characterizations
essentially leaves three parameters for us to focus on, the
multiplier (α), the degree of
relative reciprocity (λ) and the
initial trust (κ0).
What we plan to do at this stage is then to examine the impact of these
three parameters on the emergence of a 'good society' in terms of both
the wealth creation and distribution. As for the wealth
creation, we want to know whether agents are able to
self-coordinate themselves by fully exploring the network productivity
with the attainment of the largest possible clique and hence become the
most productive economy. Regarding wealth distribution, we are
interested in knowing, when a society getting richer, whether the rich
will become richer and the poor will remain poor.
The above table specifies a total of 24 sets of parameters. 30 trials are run for each set of parameters.Table 1: Tableau of Control Parameters Parameter Interpretation Value N
K(0)
lmin
α
λ1
λ2
λ3
λ0
TNumber of agents
Initial Capital
Initial linkage number
Multiplier
Trustee Selection
Portfolio
Kickbacks
Initial Trust for Stranger
Number of iterations100
1.00
1
0.2, 0.5, 0.8, 1.1
0, 0.04, 1
0, 0.04, 1
0, 0.04, 1
0, 2
100Parameter Settings
- 3.5
- To do so, we consider the combination of the three parameters with different values. They are summarized in Table 1. The multiplier parameter α is related to the underlying technology of the society. This parameter captures the effect of the networking on productivity. From a primitive agricultural society, to the industrial revolution and further to the communications revolution, we may assume this effect to be significantly different. The network can be better used with the presence of smart phones than without it; hence, the productivity in terms of α should be different. In this paper, we consider four different values of α, i.e., α = 0.2, 0.5, 0.8, and 1.1 (Table 1).
- 3.6
- For λ we begin with two values, zero and non-zero. They together are formed in a sharp contrast. Based on our previous remark (Section 2.5), a zero λ should not be taken as the insignificance of trust. It, at most, implies that the trust formed in our stochastic choice model, i.e., the myopic trust, does not play a role. Given that the alternative, such as the trust based on the long-term memory, is not given in this paper, a zero λ may be broadly interpreted as meaning that agents have already won their trust in each other and their behavior will not be influenced by the trust formed in a myopic manner.[9] It is this interpretation motivating us to take the zero λ as one scenario so as to see the effect of the specific style of trust introduced in the stochastic choice model. For the latter, we consider a value of 1 to make a sharp comparison, but we also take a value close to zero, i.e., 0.04, to see how sensitive our model is once the zero λ is abandoned.
- 3.7
- To evaluate the effect of our initial trust for new trustees, we also consider two different values of κ0 (the trust attitude toward new trustees), κ0 = 0, 2. In the case where κ0 = 0, the initial trust for new trustees is the lowest. Hence, the case where κ0 = 2 can serve as a comparison when the society has some initial degree of trust for new partners.
- 3.8
- This gives us a total of 24 different sets of parameters (four as, three λs and two κ0s); each defines one scenario or one society. We have 30 trials for each of the 24 sets of parameters, and each trial lasts for 100 periods (100 iterations). The results presented below are then based on the summary statistics of these 30 trials.
Simulation Results
-
Organization of Results
- 4.1
- Our results are organized into three kinds of measures. The first kind of measures is the accumulated wealth. Here, we consider the accumulated wealth both in the form of social capital and physical capital. The social capital is measured by the link per capita (Column "d" in Table 2), which gives a picture of how well the society is connected. Since in our model this connection (infrastructure) has a positive effect on productivity, the other side of the same coin is (money) capital per capita (Column "K" in Table 2). Related to the accumulated wealth is the multiplier, as specified in Equation (6). While this multiplier may constrain the effective return, they are in general different, since in addition to the network, the latter can be further complicated by the trust and trustworthy relation maintained between trustors and trustees. We, therefore, decide to report the effective return under column "κ".
- 4.2
- The second kind of measures is for wealth
distribution, which is typically measured by the Gini
coefficient and the result is given under the column "Gini". The third
kind of measures is for network topologies formed in the society.
Within this category, we consider three measures, namely, the average
path length (under the column "APL"), the cluster coefficient ("CC"),
and the maximum clique formed in the society (N*g),
i.e.,
- 4.3
- The first two measures are frequently used in the literature to characterize the network topology. One indicates how in general agents are distant from each other, and the other indicates how tightly they are clustered. The two together enable us to see how well the society has been connected. The last one, the maximum clique of the society, is used to help us determine how well the society has taken advantage of network productivity in general.
- 4.4
- The aforementioned seven measures
will be
presented in
Tables 2 and 3. What is presented is simply the
last one of a total of 100 iterations, and it is averaged over the 30
independent trials. The difference between run and run, as measured by
the standard deviation, is given inside the parentheses, right below
the average.
Multiplier
Table 2: Simulation Results (Part 1) 
- 4.5
- The summary statistics show the corresponding measures in the termination period (T = 100), averaged over 30 runs. Inside the parentheses are the respective standard deviations. If the measure itself is a kind of average, such as d, K, κ, APL and CC, then the average is first taken over all 100 agents for each run, and is then averaged over the 30 runs.
- 4.6
- The underlying technology, characterized by α, can be quite crucial for the development of a society. Social development in the form of social capital depends on it. By looking at the sets of scenarios (societies) with differences only in α, i.e., 1-4-7-10, 2-5-8-11, 3-6-9-12 in Table 2 and 13-16-19-22, 14-17-20-23, and 15-18-21-24 in Table 3, it is clear that when α is low the society is less well-connected and hence poor in social capital (d). Taking society 1 (α = 0.2) as an example, after the long-run evolution, the number of partners (d) which a typical (average) agent has is still less than 30, whereas the same figure in society 10 (α = 1.1) is already beyond 75. A higher α also leads to a richer society and helps the growth of wealth of individuals. However, this richness is not just from α per se. As an illustration, the financial capital owned by a typical agent (K) in the high-tech society (society 10) is 15 times higher than that in the low-tech society (society 1). This difference amplifies their original difference in α (1.1/0.2) by three times.
- 4.7
- With a very minimal threshold for a
link
addition (just a
positive growth of wealth,
 (t) >
0, Equation 11), one may initially assume that the multiplier only
affects the wealth creation but not the network formation; hence, the
low-tech society can still be well-connected, if not wealthier. This
amplification above just rejects this hypothesis and shows that the
network formation is not independent of the multiplier (α).
The multiplier has a dual force. The upper panel of Figure 7 shows the effect of a on the growth
of social capital (number of links, partners) using the set of
scenarios 1-4-7-10. It vividly shows that the high-tech societies take
off faster than the low-tech ones. On the other hand, as shown in the
lower panel of Figure 7, a
well-connected society and a wealthier society reinforce each other in
a positive cycle.
(t) >
0, Equation 11), one may initially assume that the multiplier only
affects the wealth creation but not the network formation; hence, the
low-tech society can still be well-connected, if not wealthier. This
amplification above just rejects this hypothesis and shows that the
network formation is not independent of the multiplier (α).
The multiplier has a dual force. The upper panel of Figure 7 shows the effect of a on the growth
of social capital (number of links, partners) using the set of
scenarios 1-4-7-10. It vividly shows that the high-tech societies take
off faster than the low-tech ones. On the other hand, as shown in the
lower panel of Figure 7, a
well-connected society and a wealthier society reinforce each other in
a positive cycle.
Figure 7. Technology and the Growth of Social Capital and Financial Capital: The upper panel shows the effect of the technology parameter (α) on the growth of social capital (d) over time. The lower panel shows the relationship between social capital (d) and the financial capital (K). Statistics presented here are the d(t) and K(t) averaged over the 30 trials of scenarios 1, 4, 7, and 10 (λ = 0, κ0 = 2). Table 3: Simulation Results (Part 2) 
- 4.8
- The summary statistics show the corresponding measures in the termination period (T = 100), averaged over 30 runs. Inside the parentheses are the respective standard deviations. If the measure itself is a kind of average, such as d, K, κ, APL and CC, then the average is first taken over all 100 agents for each run, and is then averaged over the 30 runs.
- 4.9
- One possible cause of the dual role
of the
multiplier is
that when the multiplier is low, by the portfolio equation (16), agents
tend to have a very high proportion of self-investment, i.e., a
stronger preference for hoarding, and also a high proportion of
retained earnings (Equations 22–24).[10]
This can be seen from the κ in Tables 2 and 3.
Again, by checking any set of scenarios which differs only in α,
one can see that, when α is low, κ is
also low. It is uniformly below 100(%) when α =
0.2, 0.5, which is a sign of a negative investment return.[11] Only after α
increases up to 0.8 does the investment return in general get closer to
100 or become positive. The spirit here is that the multiplier is an
enhancement for sociability and cooperation. A lower multiplier is
disadvantageous for the society to take off due to its highly autarkic
operation (self-investment and the lack of trust), and it easily
creates a doldrum, which may take a lot of time to get out of.
Degree of Relative Reciprocity
- 4.10
- The degree of relative reciprocity has a consistent impact on the formation of networks and the accumulated wealth. Consider the extreme case where λ = 0. By our model, if the degree of relative reciprocity is zero, then all key decisions are independent of the myopic trust; basically, they are formed quite casually as if agents already have some mutual trust among themselves. In this case, the social and economic development become easier or faster. This can be seen in all related statistics of the sets of scenarios which only differ in λ (scenarios 1-2-3, 4-5-6, ... , and 22-23-24). A society composed of all easy-going agents leads to a wealthier society. Not only is the society well connected (a larger degree, a lower average path length, a higher cluster coefficient, and larger cliques), but it also becomes wealthier as a consequence of the network effect. This result indicates that the myopic trust, instead of facilitating networking and growth, can, in effect, become an impediment for it. The result is not entirely surprising; as we remarked earlier, the intensive reliance on the myopic trust may indicate that the society is in a state where everyone treats everyone else as strangers. It is exactly the lack of general trust that makes the economy grow slowly.
- 4.11
- The myopic trust behavior is also not
favorable
to wealth
distribution when the underlying technology advances. As we can see
from Tables 2 and 3, when α is
high, the Gini coefficient corresponding to the scenario of the zero λ
declines dramatically from 0.3 to 0.1. By contrast, it
remains high at around 0.3 for the high-λ scenario
(also see Figure 8). Basically,
it shows that when the degree of the myopic trust is high, not only
does the society progress more slowly economically, but also socially
(in terms of wealth distribution).
Figure 8. Myopic Trust and Lorenz Curve: From top to bottom, the two Lorenz curves correspond to the case of λ being equal to 0 (upper) and 1 (lower). The four curves inside each panel are the scenarios corresponding to α = 0.2, 0.5, 0.8 and 1.1, all under κ0 = 2. The closer the Lorenz curve is to the 45 degree line, the more equal is the wealth distribution. The curve is the average taken over the 30 trials for each scenario. Initial Trust
- 4.12
- In the previous section, we find that a lower λ and hence a higher general trust can help stimulate the social and economic development; it would be interesting to see whether the κ0, the initial trust for new trustees, can matter for the networking and wealth creation. By comparing all pairs of scenarios which differ only in κ0 (Scenarios 1-13, 2-14, 3-15, ... , 11-23, 12-24), we find that the effect is entirely the opposite. In this case, a higher κ0, hence a higher trust for the new trustee, can result in an adverse effect on the social and economic development.
- 4.13
- As we can see from Tables 2 and 3, it results in a lower social capital, lower financial capital, longer path distance, lower cluster coefficient, and smaller cliques. It is not entirely surprising to see this difference by understanding that the parameter λ is basically unbiasedly applied to all partners, whereas κ0, depending its magnitude, is discriminatory either against the incumbent trustees or the new trustees. The discrimination against the incumbents becomes particularly strong when κ0 = 2 (200%), and the realized κ is barely larger than one (100%) (see the column "κ" in Tables 2 and 3). Hence, such a large value of κ0 can constantly dilute agents' investment in the group of incumbent trustees and, very likely, the more productive cliques. By our stochastic choice model, this unfavorable bias will be more evident when λ is large. In fact, a closer look at the two tables shows that the gap between the two scenarios differing in κ0 is most noticeable when the underlying λ reaches to one.
- 4.14
- On the other hand, with
this
"generous" behavior
biased
toward new trustees (κ0 =
2), the wealth distribution has been much improved (see the column
"Gini" in the two tables); as above, this improvement is more evident
when λ = 1. Hence, the discrimination against old
partners and the openness of more opportunities to new partners can
help enhance the wealth equality of the society, but only at a cost of
her efficiency. These scenarios might correspond to some legal
arrangements which try to make the society more inclusive, while
underestimating some unintended or undesirable consequences.
Micro Fine Details and Transition Dynamics
- 4.15
- Up to this point, we have
presented
an overview
of the
model either in terms of its long term properties or the mean dynamics
over multiple runs. These results are more at the macro level, which
may veil the complex and non-linear nature of the model.[12] Therefore, in this
section, to accompany the general results presented above, we also
present some typical micro-level or individual results of the model
(Section 4.5.1)
plus some details of the transition dynamics (Section 4.5.2).
Dynamics of Individual Social Networks
- 4.16
- In agent-based modeling,
what is
shown at the
aggregate
level may be very different from what is shown at the individual level.
To illustrate this point, a typical example is demonstrated here, which
is characterized by a set of parameters (α, λ,
κ0) = (0.2, 0.04, 2),
i.e., Set 2 in Table 2. In
this case, Figure 9, the upper
left panel, shows the time series plot of the number of connections
(social capital) per capita over 30 trials. One can hardly distinguish
these 30 curves since they move altogether upward smoothly. However, in
terms of what each individual may experience, they can be anything but
smooth.
Figure 9. Social Capital at the Aggregate and Individual Level: The upper panels show the time series of the mean social capital for each of the 30 trials under parameter sets 2 (the upper left panel) and 8 (the upper right panel). The lower panels show the time series of the individual social capital of ten selected individuals in one trial under each set of parameters: set 2 (left) and set 8 (right). - 4.17
- To show this sharp contrast between the micro and macro, Figure 9, the lower left panel, demonstrates the time series of the social capital of ten individuals in a single trail under the same values of parameters. We can see that the 'growth experience' is different from agent to agent; probably, the only experience which is commonly shared by all of them is bumping, and the difference is only a matter of degree. Let us take agent 80 in Figure 9, the lower left panel, as an example. His number of links has on one occasion climbed to a peak with a total of 50, and has then declined from there all the way down to 15. Despite this extreme case, none of the ten agents in our demonstration sample experience smooth growth. The bumps they experience accompany the slow growth of social capital at the societal level. As the figure shows, it takes almost 100 periods, i.e., the entire simulation, for this group (the ten agents) to altogether have more than a single digit of connections.
- 4.18
- Figure 9, the upper right
panel and
lower right
panel, is
another example with the set of parameters (α, λ,
κ0) = (0.8, 0.04, 2), set
8 in Figure 2. As in the
previous example, a discrepancy between the aggregate and the
individual remains. In this case, bumps still exist for each individual
series, but to a lesser degree. Unlike the previous falling-wave
pattern, here a strong sustaining force pulls each agent out of
downturns and drives them upward. Hence, the differences shown at the
micro level tell us more about the effect of the level of technology
(since the two sets differ only in the technology coefficient a): it is
much more than just changing the growth rate of social capital.
Dynamics of the Gini Index
- 4.19
- Earlier we have seen the
Lorenz
curves
corresponding to
different technology coefficients, i.e., αs
(Section 4.2), in the two
sets of contrasting scenarios 1-4-7-10 vs. 3-6-9-12 (Figure 8). In this section we demonstrate
the transition dynamics of the wealth distribution also using these two
sets. Qualitatively speaking, there are two types of transition
dynamics, which are shown in Figure 10.
In one case (Figure 10, the
lower panel), all Gini indexes almost monotonically increase but at a
decreasing rate; in the second case (Figure 10,
the upper panel), some Gini indexes increase up to a point and reverse
to decline. This difference is mainly caused by the effect of relative
reciprocity (λ). As mentioned earlier, a strong
effect of relative reciprocity, say, λ = 1, may
cause a more concentrated investment and leave the gains from
networking to a smaller group of agents. Therefore, even though the
multiplier can increase over time, not all trustors, particularly the
'small cap' investors, can benefit from it. This reflects a fundamental
property of the model, i.e., there is a spillover effect
of the wealth. Even though the poor have limited out-reachability, when
the economy has developed, the rich will still constantly expand their
connections, including their connections to the poor (the
underdeveloped region), that not only help the poor but also the rich
themselves. This result is more similar to the convergence hypothesis
in growth theory.[13]
As shown in Figure 10, the
upper panel, when λ is low (λ =
0) and the technology level is high (α = 0.8, 1.1), the spillover
effect is realized faster and we are able to see the turning point of
the Gini index declining from a level above 0.30 to a level below 0.20.
Figure 10. Dynamics of the Gini Index: λ = 0 (the upper) and λ = 1 (the lower); κ0 = 2: The figure shows the dynamics of the Gini index under two sets of scenarios, i.e., 1-4-7-10 vs. 3-6-9-12. These two contrasting sets differ in λ. In one scenario, λ is equal to zero (the upper panel) and, in the other scenario, λ is equal to one (the lower panel). The figure shows how the dynamics of the Gini index changes with respect to different values of α and λ.
Conclusions and Further
Work
- 5.1
- By integrating the network games and trust games, this paper contributes to an agent-based model of network-based trust games. We show that this extension can help us understand the well-established empirical relationship between trust and economic growth. Technology plays a key role in this model. While the contribution of the technology to growth is rather well understood, that understanding is mostly only up to the direct effect. The indirect effect through the formation of networks is either implicit or taken for granted. This paper explicitly shows that technology can help growth through the network formation. Nevertheless, the network formed is determined by various trust-based heuristics in the form of relative reciprocity, which are very much based on the assumptions that people surrounding us are strangers. Trust in each other is then built through the constant interactions, and encapsulated in the stochastic choice model.
- 5.2
- We show that even though trust can be established through repeated interactions, the myopic trust considered in this paper basically has a negative effect on the network formation, economic growth, and wealth distribution. When the degree of the myopic trust (the degree of relative reciprocity) is lessened or completely removed, the economy takes off much more quickly through the simultaneous formation of a well-connected society. Hence, we demonstrate the positive relation between trust and growth in a very simple agent-based model. Here, a key parameter is λ. One may expect that a different culture or personality may lead to a different λ; therefore, the model which we develop here, including the parameter κ0, may further ground the growth deep into cultural or personality factors, which is an area largely ignored in the literature.
- 5.3
- Despite its simplicity, this baseline model provides us with an avenue into more realistic explorations of the complex intertwining relationship between trust and growth. Here, we give a number of possible directions for future work to enhance the empirical relevance of the model.
- 5.4
- Trust and Cognition First, trust is a quite subtle issue. Modeling trust only enables us to realize how subtle it is, in particular, when it is in conjunction with decision making. In this paper, by using a stochastic choice model, trust is modeled in a form of myopic trust. As mentioned in Section 2.5, while this form may be suitable for our interactions with strangers in general, the trust based on the long-term memory may be flexible for general situations. This extension may be made using reinforcement learning (Roth & Erev 1995).
- 5.5
- Non-mandatory Investment Rule Second, the growth curve generated by the proposed model is so smooth that it does not allow for some small friction or local instability along the growth trend to occur, not to mention the possible crashes or crises (collapses of trust). We believe that this excessive smoothness is partially due to the mandatory investment rule, as discussed in Section 4.1, which generates a highly 'spurious' trust among agents which then 'coordinate' them into a very productive network. Therefore, one of the future tasks is to relax these mandatory investment rules by allowing agents to decide on whether they would add an additional link if they could. Likewise, even though their wealth is increasing, they may still consider cutting off some poorly performing links, instead of just adding new ones.
- 5.6
- Uncertainty Finally, there are other considerations which can complicate the trust model used here. One possible complication which is frequently mentioned in the literature is uncertainty. In our paper, the network productivity function is deterministic, but one can easily make it stochastic, a kind of extrinsic uncertainty, and see how the relationship between trust and growth may be different by also taking into account the agents' risk attitude.
Acknowledgements
- An earlier version of this paper was presented at the 2013 Spring Simulation Multi-Conference, San Diego, USA, April 7-10, 2013, 2014 Chinese Economists Society Annual Conference, Guangzhou, China, June 14-15, 2014, and 14th SAET Conference on Current Trends in Economics, Waseda University, Tokyo, Japan, August 19-21, 2014. The authors greatly benefited from the interaction with conference participants, specifically, Yu Zhang, Levent Yilmaz, Gregory Madey, Isamu Okada, and Eizo Akiyama. The authors are grateful to four anonymous referees for their very helpful suggestions. The remaining errors are the authors’ sole responsibility. The first two authors are also grateful for the research support in the form of the Taiwan National Science Council (NSC) Grants, NSC 98-2410-H-032-044-MY3, 101-2410-H-004-010-MY2, and the Ministry of Science and Technology (MOST) Grant, MOST 103-2410-H-004-009-MY3. The third author is grateful for the research support in the form of National Natural Science Foundation of China, 71101117, and the Fundamental Research Funds for the Central Universities, JBK130502.
Notes
-
1The
repetition of the trust game was not even considered an
independent factor in the first available meta-analysis in the
literature (Johnson &
Mislin 2011).
2For example, Burks et al. (2003) find that playing the dual role can reduce both the degree of trust and reciprocity, as what is coined the reduced responsibility hypothesis. This can be a property of interest to agent-based modelers.
3One may wonder if the dual role is a realistic setting. Is it realistic that agent i can be the trustor and trustee simultaneously of agent j? From the daily experiences, specifically, of legal relations, one may suspect that this bidirectional relation is rarely seen. Our setting, however, shall not be confined to such a narrow social domain given that the nature of the issue studied in this paper is about the joint productivity of networking. The cross-holding of shares between companies A and B is a familiar example; in this case, firm A invests in firm B and vice versa. Agent i has a research grant and invites j to join; at the other end, j has a volume requiring editing and invites i to be the co-editor. We can continue on this list with various business relations involving possible dual roles. Hence, the key here is not who invests in whom, but whether an investment relation occurs; the parlance of network analysis, what matters is the undirected network, rather than the directed network
4Obviously, consistent with the general setting in this paper, agents are assumed to be myopic and have a short-memory here. Hence, even though an agent had been connected before, as long as this connection is not continued, he becomes a "new" trustee again.
5For either the altruistic reason or other strategic reasons, violations of this assumption are possible, but in this paper we shall refrain from this more thoughtful design.
6Here, we use the term "seeming" or "subjective", because agent i cannot have a direct observation of agent j's portfolio,
{wj,l(t)l∈Nj,S(t)∪{j}, and then evaluate his received investment in light of this portfolio. For example, kj,i(t) can be big in terms of its absolute size, but relatively small in terms of its weight in the portfolio. In this case, agent j may not trust agent i as much as it seems to be the case.
7However, one has to notice that the acquaintance relation is not explicitly assumed in other models, except Sutcliffe and Wang (2012), which can be considered a model specifically developed for the model of trust kept by acquaintances. This model validates the social brain hypothesis for which a typical group size for humans is 150 individuals. Nonetheless, modern increasingly complex business and social relations may involve a number of partners that is not confined to a limit. See, for example, Grief (1994).
8The model code can be found at http://www.openabm.org/model/3915/
9It is so because the degree of relative reciprocity, λ, through the trust-based selection mechanism (Equations 14, 15, 16, and 20), can be regarded as a socio-cultural factor. When λ is low, selection is low, and it is easier for the society to get mingled. Hence, a society with λ being equal to zero means that the culture of the society places little emphasis on "personal relationships" (guanxi). Guanxi is the pinyin romanization of this Chinese word. Sometimes, it has been translated into relationships, but that translation is not able to sufficiently capture the Chinese cultural underpinning by which the meaning of this word can be properly understood. Guanxi has been considered to be the key for running business as in China; see, for example, Park and Luo (2001) and Luo et al. (2012).
10This is particularly so when the lower α is post-multiplied by a factor
/N
(Equation 6), which is also low due to the low initial degree of the
maximum fully connected network.>11An average κ of less than 100% indicates that agents did not even get their fair shares back. With this negative investment return, two questions arise. First, how could people generally get richer and richer; second, why did they still invest? The answer is that they actually get richer by receiving investment from others. In fact, this result shows that even though the investment return can be negative, as long as people mutually invest in each other, the agglomeration effect can dominate the deficiencies in kickbacks. Here, trust is not only built through returns, but also upon the investment reciprocity. This is essentially the unique feature of this network-based economy, showing how trust alone can beef up the economy.
12In fact, the mathematics of the core of the model, such as the networking decisions of agents, can be characterized by a state-dependent, time-variant, first-order Markov process. The law of motion, nonetheless, is beyond our tractability.
13Of course, one remark that needs to be made here is that our system is finite due to a fixed population size. Therefore, the wealth of the rich cannot be infinitely large and catching-up may occur in the limit. If the population size is constantly growing, then depending on the speed of 'globalization', catching-up may or may not take place.
References
-
ALGAN, Y. &
Cahuc, P.
(2010). Inherited trust and growth. American Economic Review
100(5), 2060–2092. [doi:10.1257/aer.100.5.2060]
ANDERHUB, V., Engelmann, D., & Güth, W. (2002). An experimental study of the repeated trust game with incomplete information. Journal of Economic Behavior and Organization 48(2), 197–216. [doi:10.1016/S0167-2681(01)00216-5]
BALA, V. & Goyal, S. (2000). A noncooperative model of network formation. Econometrica 68(5), 1181–1229. [doi:10.1111/1468-0262.00155]
BAUERNSCHUSTER, S., Falck, O., & Große, N. (2013). When trustors compete for the favour of a trustee: A laboratory experiment. Journal of Economic Psychology 34, 133–147. [doi:10.1016/j.joep.2012.09.004]
BERG, J., Dickhaut, J., & McCabe, K. (1995). Trust, reciprocity, and social history. Games and Economic Behavior 10(1), 122–142. [doi:10.1006/game.1995.1027]
BERGGREN, N., Elinder, M., & Jordahl, H. (2008). Trust and growth: A shaky relationship. Empirical Economics 35(2), 251–274. [doi:10.1007/s00181-007-0158-x]
BEUGELSDIJK, S., de Groot, H., & van Schaik, A. (2004). Trust and economic growth: A robustness analysis. Oxford Economic Papers 56(1), 118–134. [doi:10.1093/oep/56.1.118]
BOERO, R., Bravo, G., Castellani, M., & Squazzoni, F. (2009). Reputational cues in repeated trust games. The Journal of Socio-Economics 38(6), 871–877. [doi:10.1016/j.socec.2009.05.004]
BORNHORST, F., Ichino, A., Kirchkamp, O., Schlag, K., & Winter, E. (2010) Similarities and differences when building trust: The role of cultures. Experimental Economics 13(3), 260–283. [doi:10.1007/s10683-010-9240-x]
BOSSE, T., Schut, M., Treur, J., & Wendt, D. (2008). Trust-based inter-temporal decision making: Emergence of altruism in a simulated society. In L. Antunes, M. Paolucci, & E. Norling (Eds.), Multi-Agent-Based Simulation VIII, Lecture Notes in Computer Science 5003 (pp. 96–111). Heidelberg: Springer-Verlag.
BRAVO, G., Squazzoni, F., & Boero, R. (2012). Trust and partner selection in social networks: An experimentally grounded model. Social Networks 34(4), 481–492. [doi:10.1016/j.socnet.2012.03.001]
BURKS, S., Carpenter, J., & Verhoogen, E. (2003). Playing both roles in the trust game. Journal of Economic Behavior and Organization 51(2), 195–216. [doi:10.1016/S0167-2681(02)00093-8]
BUSKENS, V. (2003). Trust in triads: Effects of exit, control, and learning. Games and Economic Behavior 42(2), 235–252. [doi:10.1016/S0899-8256(02)00563-8]
BUSKENS, V., Raub, W., & Van der Veer J. (2010). Trust in triads: An experimental study. Social Networks 32(4), 301–312. [doi:10.1016/j.socnet.2010.05.001]
CALLANDER, S. & Plott, C. (2005). Principles of network development and evolution: An experimental study. Journal of Public Economics 89(8), 1469–1495. [doi:10.1016/j.jpubeco.2004.03.009]
CASSAR, A. & Rigdon, M. (2011). Trust and trustworthiness in networked exchange. Games and Economic Behavior 71(2), 282–303. [doi:10.1016/j.geb.2010.04.003]
CHARNESS, G., Du, N., & Yang, C.-L. (2011). Trust and trustworthiness reputations in an investment game. Games and Economic Behavior 72(2), 361–375. [doi:10.1016/j.geb.2010.09.002]
COCHARD, F., Nguyen Van, P, & Willinger, M. (2004). Trusting behavior in a repeated investment game. Journal of Economic Behavior and Organization 55(1), 31–44. [doi:10.1016/j.jebo.2003.07.004]
DEARMON, J. & Grier, K. (2009). Trust and development. Journal of Economic Behavior and Organization 71(2), 210–220. [doi:10.1016/j.jebo.2009.02.011]
DECK, C. & Johnson, C. (2004). Link bidding in laboratory networks. Review of Economic Design 8(4), 359–372. [doi:10.1007/s10058-003-0108-9]
DELGADO, M., Frank, R. & Phelps, E. (2005). Perceptions of moral character modulate the neural systems of reward during the trust game. Nature Neuroscience 8, 1611–1618. [doi:10.1038/nn1575]
DI CAGNO, D. & Sciubba, E. (2010). Trust, trustworthiness and social networks: Playing a trust game when networks are formed in the lab. Journal of Economic Behavior and Organization 75(2), 156–167. [doi:10.1016/j.jebo.2010.04.003]
DUFFY, J, Xie, H., & Lee, Y.-J. (2013). Social norms, information, and trust among strangers: Theory and evidence. Economic Theory 52(2), 669–708. [doi:10.1007/s00199-011-0659-x]
ENGLE-WARNICK, J. & Slonim, R. (2004). The evolution of strategies in a repeated trust game. Journal of Economic Behavior and Organization 55(4), 553–573. [doi:10.1016/j.jebo.2003.11.008]
ENGLE-WARNICK, J. & Slonim, R. (2006a). Learning to trust in indefinitely repeated games. Games and Economic Behavior 54(1), 95–114.
ENGLE-WARNICK, J. & Slonim, R. (2006b). Inferring repeated-game strategies from actions: Evidence from trust game experiments. Economic Theory 28(3), 603–632.
FALK, A. & Kosfeld, M. (2012). It's all about connections: Evidence on network formation. Review of Network Economics 11(3), Article 2. [doi:10.1515/1446-9022.1402]
FEHR, E. & Gächter, S. (1998). Reciprocity and economics: The economic implications of homo reciprocans. European Economic Review 42(3–5), 845–859. [doi:10.1016/S0014-2921(97)00131-1]
FORKMANN, S., Wang, D., Henneberg, S., Naudé, P., & Sutcliffe, A. (2012). Strategic decision making in business relationships: A dyadic agent-based simulation approach. Industrial Marketing Management 41(5), 816–830. [doi:10.1016/j.indmarman.2012.06.010]
FUJITA, M. & Krugman, P. (2004). The new economic geography: Past, present and the future. Papers in Regional Science 83(1), 139–164. [doi:10.1007/s10110-003-0180-0]
GOEREE, J. K., Riedl, A., & Ule, A. (2009). In search of stars: Network formation among heterogeneous agents. Games and Economic Behavior 67(2), 445–466. [doi:10.1016/j.geb.2008.12.005]
GOROBETS, A. & Nooteboom, B. (2005). Agent based computational model of trust. In H. Czap, R. Unland, C. Branki, & H. Tianfield (Eds.), Proceeding of the 2005 Conference on Self-Organization and Autonomic Informatics (I), (pp. 160–172). The Netherlands: IOS Press.
GRIEF, A. (1994). Cultural beliefs and the organization of society: A historical and theoretical reflection on collectivist and individualist societies. Journal of Political Economy 102(5), 912–950. [doi:10.1086/261959]
JACKSON, M. & Wolinsky, A. (1996). A strategic model of social and economic networks. Journal of Economic Theory 71(1), 44–74. [doi:10.1006/jeth.1996.0108]
JOHNSON, N. & Mislin, A. (2011). Trust games: A meta-analysis. Journal of Economic Psychology 32(5), 865–889. [doi:10.1016/j.joep.2011.05.007]
KESER, C. (2003). Experimental games for the design of reputation management systems. IBM Systems Journal 42(3), 498–506. [doi:10.1147/sj.423.0498]
KIM, W.-S. (2009). Effects of a trust mechanism on complex adaptive supply networks: An agent-based social simulation study. Journal of Artificial Societies and Social Simulation 12(3) 4: https://www.jasss.org/12/3/4.html
KING-CASAS, B., Tomlin, D., Anen, C., Camerer, C., Quartz, S., & Montague, P. (2005). Getting to know you: Reputation and trust in a two-person economic exchange. Science 308(5718), 78–83.
KNACK, S. & Keefer, P. (1997). Does social capital have an economic payoff? A cross-country investigation. The Quarterly Journal of Economics 112(4), 1251–1288. [doi:10.1162/003355300555475]
KRUEGER, F., Grafman, J., & McCabe, K. (2008). Neural correlates of economic game playing. Philosophical Transactions of the Royal Society B 363(1511), 3859–3874. [doi:10.1098/rstb.2008.0165]
LA PORTA, R., Lopez-de-Silanes, F., Shleifer, A., & Vishny, R. (1999). Trust in large organizations. In P. Dasgupta & I. Serageldin (Eds.), Social Capital: A Multifaceted Perspective (pp. 310–324). Washington D.C.: The World Bank.
LUCE, D. (1959). Individual Choice Behavior: A Theoretical Analysis. New York: John Wiley and Sons.
LUO, Y, Huang, Y., & Wang, S. (2012). Guanxi and organizational performance: A meta-analysis. Management and Organization Review 8(1), 139–172. [doi:10.1111/j.1740-8784.2011.00273.x]
MACY, M. & Skvoretz, J. (1998). The evolution of trust and cooperation between strangers: A computational model. American Sociological Review 63(10), 638–660. [doi:10.2307/2657332]
MCFADDEN, D. (1974). Conditional logit analysis of qualitative choice behavior. In P. Zarembka (Ed.), Frontiers of Econometrics (pp. 105-142). New York: Academic Press.
MCFADDEN, D. (1990). Economic choices. American Economic Review 91(3), 351–378. [doi:10.1257/aer.91.3.351]
PARK, S.-H & Luo, Y. (2001). Guanxi and organizational dynamics: Organizational networking in Chinese firms. Strategic Management Journal 22(5), 455–477. [doi:10.1002/smj.167]
RIESKAMP, J. & Gigerenzer, G. (2002). Heuristics for social interactions: How to generate trust and fairness. Paper presented at a colloquium at the Workshop in Political Theory and Policy Analysis, Indiana University, Bloomington, on April 8, 2002.
ROTH, A. & Erev, I. (1995). Learning in extensive-form games: Experimental data and simple dynamic models in the intermediate term. Games and Economic Behavior 8(1), 164-212. [doi:10.1016/S0899-8256(05)80020-X]
SHEREMETA, R. & Zhang, J. (2014). Three-player trust game with insider communication. Economic Inquiry 52(2), 576–591. [doi:10.1111/ecin.12018]
SLONIM, R. & Garbarino, E. (2008). Increases in trust and altruism from partner selection: Experimental evidence. Experimental Economics 11(2), 134–153. [doi:10.1007/s10683-007-9162-4]
SUTCLIFFE, A & Wang, D. (2012). Computational modelling of trust and social relationships. Journal of Artificial Societies and Social Simulation 15(1) 3: https://www.jasss.org/15/1/3.html.
TYKHONOV, D., Jonker, C, Meijer, S. & Verwaart, T. (2008). Agent-based simulation of the trust and tracing Game for supply chains and networks. Journal of Artificial Societies and Social Simulation 11(3) 1: https://www.jasss.org/11/3/1.html.
VARGA, A. & Schalk, H. (2004). Knowledge spillovers, agglomeration and macroeconomic growth: An empirical approach. Regional Studies 38(8), 977–989. [doi:10.1080/0034340042000280974]
WHITELEY, P. (2000). Economic growth and social capital. Political Studies 48(3), 443–466. [doi:10.1111/1467-9248.00269]
WILENSKY, U. (1999). NetLogo. http://ccl.northwestern.edu/netlogo/. Center for Connected Learning and Computer-Based Modeling, Northwestern University, Evanston, IL.
WILENSKY, U. (2005). NetLogo Small Worlds model. http://ccl.northwestern.edu/netlogo/models/ SmallWorlds. Center for Connected Learning and Computer-Based Modeling, Northwestern University, Evanston, IL.
WILL, O. (2010). HUME 1.0: An agent-based model on the evolution of trust in strangers and division of labour. In Di Tosto G. & Van Dyke Parunak H. (Eds.), Multi-Agent-Based Simulation X, Lecture Notes in Artificial Intelligence, 5683, (pp. 123–134). Heidelberg: Springer-Verlag.
ZAK, P. & Knack, S. (2001). Trust and Growth. Economic Journal 111(470), 295–321. [doi:10.1111/1468-0297.00609]