
 Abstract
- This paper examines the intervention strategies for the diffusion of collective behavior, such as promoting innovation adoption and repressing a strike. An intervention strategy refers to controlling the behaviors of a small number of individuals in terms of their social or personal attributes, including connectivity (i.e., the number of social ties one holds), motivation (i.e., an individual's intrinsic cost–benefit judgment on behavior change), and sensitivity (i.e., the degree to which one follows others). Extensive agent-based simulations demonstrate that the optimal strategy fundamentally depends on the goal and time of intervention. Moreover, the nature of the social network (determined by homophily type and level) moderates the effectiveness of a strategy. These results have substantial implications for the design and evaluation of intervention programs.
- Keywords:
- Intervention Strategy, Diffusion of Collective Behavior, Social Network, Agent-Based Modeling
Introduction
- 1.1
- Many challenges that governments encounter are related to collective behavior, such as how to promote pro-environmental behaviors, voting turnout, and vaccination for infectious diseases, as well as how to repress protests, strikes, and tax evasion. Governments typically address these challenges using rules and legislation, but the effects are often insignificant. Literature shows that the essence of collective behavior is the process of diffusion or contagion. Collective behavior invokes the long-standing theory of interdependence, which posits that the decisions of individuals depend on the behavior of others in relation to considerations of safety, fairness, reputation, information, and influence (e.g., Centola 2010; Centola & Macy 2007; Granovetter 1978; Huckfeldt 2009; McAdam 1986; Rogers 1995; Siegel 2009). Specifically, the literature indicates that people care more about the behaviors of those close to them. Examples include the provision of data on the pro-environmental behavior of neighbors (Allcott 2011), the turnout of household members (Gerber et al. 2008), the participation in protests of friends (McAdam 1986), and the engagement in strikes of house staff (Kravitz et al. 1990). Accordingly, governments can intervene in collective behavior by controlling a small number of individuals. A key question emerges: What type of individuals are the best targets? This study aims to identify the optimal targets to promote or repress the adoption rate of a collective behavior, conditioned by network structure and intervention timing.
- 1.2
- Literature enumerates at least three individual attributes that are critical for locating intervention targets, namely, connectivity, motivation, and conformity. Connectivity refers to the number of social ties that an individual holds. Individuals with large connectivity are expected to be centralized in social networks and have a lot of influence on their surroundings (Keller & Barry 2003); thus, they are often labeled as leaders, elites, influentials, or hubs (e.g., Goldenberg et al. 2009; Siegel 2009, 2011; Watts & Dodds 2007), and are considered good target candidates of intervention efforts (e.g., Libai et al. 2013; Siegel 2011). The second factor, motivation, refers to an individual's cost–benefit judgment[1] about the adoption of a new behavior, aside from that of others. A recent critical argument is that large behavior cascades are driven not by individuals with large connectivity, but by a critical mass of those with high motivation (Watts & Dodds 2007). Specifically, individuals with high motivation generally play the role of rabble-rouser, innovator, or early adopter in the diffusion of collective behavior (Granovetter 1978; Siegel 2009; Valente 2012). Hence, a good means of promoting (or repressing) diffusion is to increase (or reduce) the number of such individuals in a network. The third factor, conformity, describes how obedient a person is to the behaviors of others, or how confident a person is about his/her own judgment. Generally, innovators, rabble-rousers, or opinion leaders are believed to have low conformity (Rogers 1995; van Eck et al. 2011). Janssen (2011) suggests that those with low conformity may be a better target than those with large connectivity for promoting the diffusion of collective behavior. Based on the aforementioned literature, connectivity, motivation, and conformity are selected as indicators for designing intervention strategies in the present study.
- 1.3
- As we talk about "diffusion of collective behavior" or "diffusion intervention," mentioning social network and its structure is important. Social network creates the paths for the diffusion of collective behavior and its structure, hence, influences the scale and diffusion speed of collective behavior (Centola & Macy 2007; Hu, Cui, et al. 2014; Hu, Lin, et al. 2014; Siegel 2009; Watts 2002). For intervention targets, network structure defines their relative position within the channel of diffusion and determines the type of peers they have, which moderates their roles in diffusion and intervention (Janssen 2011; Siegel 2011; Valente 2012; Watts & Dodds 2007). To highlight the importance of network and its structure, we focus on one of the most striking and robust empirical regularities of social networks, homophily, which refers to the tendency of people to seek out and socialize with others with similar trait(s) (McPherson et al. 2001).
- 1.4
- Homophily shapes network structures. Homophily induces a high level of transitivity or clustering (Robinson & Balkwell 1995); that is, if individual A relates to individual B and individual B relates to individual C, then individual A is more likely to relate to individual C. The clustering is sensible because when an individual has friends from the same society, his/her friends are highly likely to be friends with one another. Meanwhile, if an individual has friends from different societies, they are less likely to know one another (Huckfeldt et al. 1995). Generally, decreasing the level of homophily can provide shortcuts for various social communities, reducing social networks into a "small world" (Kossinets & Watts 2009; Watts & Strogatz 1998). Therefore, the current study uses the level of homophily to represent network structure.
- 1.5
- Homophily is classified into two types, namely, status homophily and value homophily. Status homophily refers to the similarity in socio-demographic traits, such as race, age, gender, religion, education, occupation, and geographical location; by contrast, value homophily pertains to the similarity in internal states, such as opinions, attitudes, and beliefs, which are presumed to shape individual orientation toward future behavior (McPherson et al. 2001). The present study defines three types of network in terms of the type of homophily. The first type is status-homo network, which highlights the effects of network structure on the selection of targeting strategy. The other two types of network that correspond to value homophily are motivation-homo and conformity-homo networks, which focus on the interaction of network structure and like-mindedness.
- 1.6
- In addition to network type and structure, the goal and the time of intervention are considered as important moderating factors in selecting intervention targets. As Borgatti (2006) suggested, when the goal is to repress the diffusion of a behavior, the intervention will be based on different tactics than an intervention with the goal of promoting it. One of the clearest signs reflected in previous studies is that those individuals who had (not) adopted are the candidates for repression (promotion) (e.g., Janssen 2011; Libai et al. 2013; Siegel 2011). Moreover, intervention timing matters due to the existing prevalence of the behavior changes the optional targets (Valente 2012). For example, government can initiate a pro-environmental practice because no one knows it, and can also promote adoption in the early stages once environmentalists initiated it or in the late stages when adoption growth becomes weak. The candidates for intervention obviously vary at these three timings.
- 1.7
- In sum, this study attempts to identify the most effective targets to influence the diffusion of collective behavior. To achieve this objective, an agent-based model based on Granovetter's (1978) threshold model of collective behavior is developed. The model considers a heterogeneous population of individuals who must choose between binary options (i.e., adopting a new behavior or not). Individuals are heterogeneous in connectivity, motivation, and conformity. An individual makes decisions based on motivation and the behaviors of network neighbors. This action invokes a long-standing proposition that the more others adopt a behavior, the more an individual is apt to do so as well. The network structure is determined by the type and level of homophily. Intervention is implemented by controlling a number of individuals with a certain trait, such as those with the largest connectivity in the network. Interventions can be either promotion or repression, and be implemented at different times. Our simulation results indicate that the best invention strategy is contingent on the interplay of network type and structure, as well as intervention goal and time.
- 1.8
- The remainder of this paper proceeds as follows. The second and third sections introduce related studies and the agent-based model, respectively. The fourth section discusses the results of the model. Based on the model results, the fifth section presents the conclusions and implications.
Related Studies
-
Diffusion of Collective Behavior: Threshold Model, Network, and Homophily
- 2.1
- Addressing the diffusion processes of behavioral innovations in populations has been a long and intensive research subject among scientists working in economics and sociology.[2] Granovetter's (1978) threshold model was an early formal treatment. In this model, each individual has a threshold,[3] and if the number or proportion of others who adopt a particular behavior exceeds the threshold, then he/she decides to adopt it as well. The threshold model and its variants have been used to understand relevant social phenomena, such as the diffusion of innovations, strikes, and voting (e.g., Granovetter 1978; Siegel 2009; Valente 1996; Watts & Dodds 2007).
- 2.2
- Earlier threshold models make an implicit assumption of complete connectedness[4], that is, "each individual is responsive to the behavior of all the others" (Granovetter 1978, p. 1431). However, complete knowledge about what all others are doing is impractical. Recent studies in this area assume that thresholds are applied to the adoption rate within a local neighborhood, rather than the entire population (e.g., Centola & Macy 2007; Siegel 2009; Valente 1996). This assumption has prompted investigations into the impact of different social network structures on the diffusion of collective behavior, especially by using computational approaches such as agent-based modeling (ABM) (Goldstone & Janssen 2005). Social networks have several structural characteristics in common; among these characteristics, two have been extensively explored, namely, the small-world property (i.e., a high clustering coefficient and a short path length) and the scale-free (or power-law) distribution of personal connectivity (e.g., Centola & Macy 2007; Delre et al. 2007, 2010; Gibbons 2004; Janssen & Jager 2003; Siegel 2009; van Eck et al. 2011; Watts 2002; Watts & Dodds 2007; Watts & Strogatz 1998).
- 2.3
- More
recent studies focus on interesting empirical issues that can
significantly affect network structure and examine how they influence
the diffusion of collective behavior. For example, Hu and his
colleagues examined how cultural differences influence the
configurations of offline vs. online ties or strong vs. weak ties, and
further influence the scale and speed of the diffusion of collective
behavior (Hu, Cui, et al. 2014; Hu, Lin, et al. 2014).
Homophily is thus most frequently mentioned. Literature states that
homophily can work both in favor of the diffusion of collective
behavior and against it simultaneously. On the one hand, homophily
promotes diffusion by helping attain critical mass more easily than
when homophily is lacking (Centola 2010, 2013a; DiMaggio & Garip 2011; Rogers 1995). On the other hand, homophily depresses diffusion by localizing the behavior in some clusters within the network (Centola 2011; Rogers 1995).
Hence, a moderate level of homophily seems to be highly effective in
helping to promote the diffusion of collective behavior (Boyd & Richerson 2002; Chiang 2007; Yavas & Yucel 2014).
However, some other studies claim that the type of homophily may change
its role in the diffusion of collective behavior (e.g., Alstott et al. 2014; DiMaggio & Garip 2011); thus, homophily type is regarded as an important variable in the current study.
Intervening in the Diffusion of Collective Behavior
- 2.4
- Scholars from various fields have been interested in the strategies for influencing the diffusion of collective behavior. In the marketing field, for example, scholars suggest that when introducing a new product, firms could target those potential adopters with a disproportional effect on others. The "disproportional effect" could be measured in connectivity (e.g., "hubs"), persuasiveness (e.g., experts), betweenness (e.g., brokers or gatekeepers), or social value (e.g., revenue leaders) (Haenlein & Libai 2013; Libai et al. 2013). In the field of public health, more than 200 studies suggest that opinion leaders (e.g., celebrities or church leaders) can act as gatekeepers for interventions and accelerate behavior change (Valente & Pumpuang 2007). In politics, in most theoretical models, controlling leaders (e.g., initiators and directors) is associated with the decline of controversial, damaged activities, such as strikes and riots (Bob & Nepstad 2007; McAdam et al. 2001).
- 2.5
- Network centrality is probably the most used indicator for identifying intervention targets (Borgatti 2006; Valente 2012). Several measures are available to identify centrality based on different conceptions (Freeman 2007), the most common of which includes connectivity (i.e., the number of ties incident upon a given individual, also known as degree in network terms), betweenness (i.e., the number of times that any individual needs a given individual to reach any other individual), and closeness (i.e., the average distance of an individual to other individuals). Among these measures, connectivity is most frequently used in intervention studies based on simulation (e.g., Goldenberg et al. 2009; Libai et al. 2013; van Eck et al. 2011), largely because of the ease in computing the connectivity of each individual (Libai et al. 2013). These studies demonstrate that individuals with large connectivity can be ideal targets for intervention.
- 2.6
- However, Watts and Dodds (2007) report that large-scale diffusion can be driven not by individuals with large connectivity (they use the term "influentials"), but rather by a critical mass of individuals with a strong motivation to adopt (they use the term "easily influenced people"). Their results suggest that an examination of the role of influentials requires more careful specification and testing than it has received thus far. Moreover, the motivation of individuals could be another appropriate criterion for identifying invention targets. Several studies in the marketing field had verified these results, indicating that seeding consumers with low motivation to adopt the introduced product could be the optimal strategy under certain conditions (Libai et al. 2005; Miller et al. 2009).
- 2.7
- Another personal factor that is critical to understanding the role of an individual in the diffusion of collective behavior is conformity to the behaviors of others. People are heterogeneous in conformity due to their experience or knowledge on a subject (Cialdini & Goldstein 2004) or due to cultural characteristics (Way & Lieberman 2010). Conformity is often used to distinguish leaders from followers. Leaders are more self-confident in general, such that their decision is more dependent on their own judgments than on the behaviors of others (Rogers 1995). A number of studies reflected this fact in their models (e.g., van Eck et al. 2011), suggesting that conformity can also be a potential indicator for defining intervention targets.
- 2.8
- However, existing works identify intervention targets based mainly on connectivity and motivation (Valente 2012), but rarely on conformity. As far as we know, Janssen (2011) first incorporates these three factors into a model, and estimates the effectiveness of promotional strategies based on them. In Janssen's study, promotion is defined as an incentive for an individual make the new behavior more attractive and is implemented after the behavior had diffused for a period of time. Four types of targets are identified, namely, those with the largest motivation, the smallest conformity, the largest connectivity, and the largest closeness. The results indicate that the second strategy is the most effective on average. However, some questions remain: Is it the case for repression? Even in the case of promotion, is it applicable to different intervention timings and intervention tactics?
- 2.9
- Existing works mainly focus on pre-promotion and pro-repression. For example, marketing researchers often pay attentions to how to seed the market when a new product will be introduced (e.g., Libai et al. 2005, 2013), whereas social movement scholars often aim at how to handle with a movement started already (e.g., Siegel 2011). However, pro-promotion and pre-repression occur most often in reality. Therefore, we consider intervention timing as an important moderating factor in this study.
- 2.10
- Moreover, intervention tactics differ between existing studies. Some tactics are mild. For example, in his work, Janssen (2011) just makes a new behavior a little more attractive; this is similar to a small discount. This tactic does increase adoption, but the effect seems to be insignificant. Some other tactics are aggressive. For example, Siegel (2011) defines repression in the scenario of protest as the removal of participants from the network, similar to murder or imprisonment. Such a violent tactic decreases participation significantly; however, as Siegel (2011) suggested, it may results in complex psychological responses of individuals, such as fear and anger. In this work, we employ a compromised tactic—making targeted individuals change their behavior immediately, but this is all. In the scenario of marketing promotion, this is similar to give away free products to customers. In the scenario of repression on protest, this means that discouraging (potential) participants by persuasions, educations, or mandatory injunctions. In such a setting, we obtain some interesting results.
Agent-based Model
-
Agents and Decision Rule
- 3.1
- Agents
are the building blocks of the model. Each agent represents a
hypothetical individual. In the model, all individuals face a binary
option, that is, insisting an old behavior A or adopting a new behavior
B. Adopting either behavior A or B provides individuals with a utility
that consists of an individual part and a social influence part. The
individual part expresses the basic benefit derived from the behavior
adoption, which is constant over time and is apart from that of others;
meanwhile, the social influence part is obtained from those with the
same choice. Hence, the utility gained in each option for individual i at a given time t can be formalized as:
(1) 
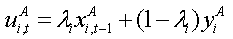
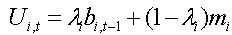
(2) where xAi,t−1 (xBi,t−1) denotes the utility of the social influence part that individual i derived from the adoption of behavior A (B), yAi (yBi) denotes the utility of the individual part, and λi measures individual i's conformity to the behaviors of others. Similar to many prior studies (e.g., Centola 2013b; Centola & Macy 2007; Hu, Cui, et al. 2014; Hu, Lin, et al. 2014; Siegel 2009, 2011; Watts 2002; Watts & Dodds 2007), we assume that social influence usually follows from interactions among individuals, and hence express it as the average fraction of network neighbors with the same behavior.
- 3.2
- The
essence of the dynamics of adopting the new behavior B lies in an
individual's sense of net utility of adopting behavior B compared with
adopting behavior A. Let us represent the net utility of the social
influence part as bi,t-1=xBi,t−1 − xAi,t−1 and the net utility of the individual part as mi=yBi − yAi, then the net utility (Ui,t) of adopting the new behavior B at time t is as follows:
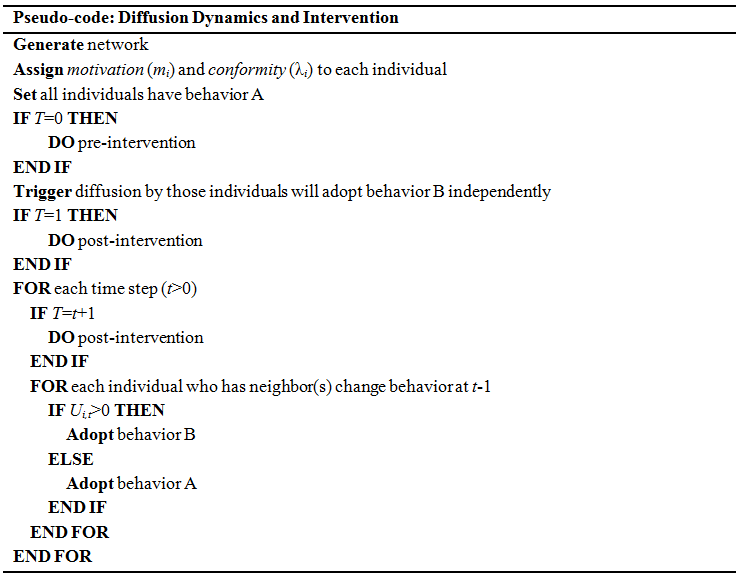
(3) - 3.3
- An individual will adopt behavior B at time t if and only if the net utility is positive, that is, Ui,t>0. Note that mi is individual i's motivation to adopt a new behavior because it is the difference between the benefit (yBi) and the cost (yAi) of adopting behavior B. In this study, we directly focus on the values of motivation. Moreover, the values of bi,t−1 range from −1 to 1 for all time steps. We also assume mi ranges from −1 to 1 in response, drawn from a uniform distribution.
- 3.4
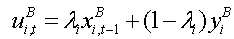
- Initially, all individuals have behavior A, and simultaneously update their decisions at time t>0 by the information of other individuals from time t−1. Figure 1 shows the minimum levels of net social influence (bi) that is required for an individual to adopt behavior B. In the beginning of the diffusion, when bi,t is very low, only individuals with a small conformity or with a large motivation will adopt. Others will only adopt if the majority of their neighbors have adopted. We can also observe that motivation is the most important predictor of adoption. Specifically, those individuals with larger motivation are more likely to be adopters, whereas those with smaller motivation are non-adopters with the highest probability.
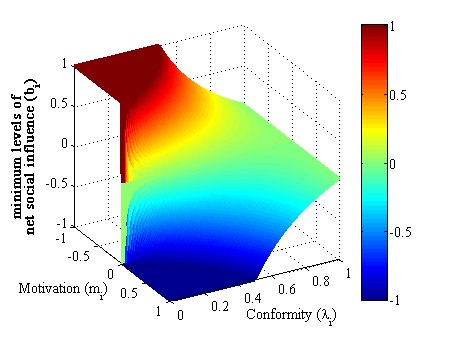
Figure 1. The minimal value of net utility of the social influence part (bi) for an individual to adopt a new behavior Social Network with Tunable Homophily
- 3.5
- Individuals (agents) are located into networks. As previously introduced, the network type and its structure are determined by homophily type and level, respectively. The network formation process is as follows. First, we endow each individual with status trait si drawn from a uniform distribution [i.e., si~U(0,1)]. The si represents the position of the individual in a one-dimension social space, and it can denote age, location, ethnicity, religion, education, or occupation. If two individuals have similar value of status trait, we can expect that they are close in the space, or that they belong to the same social circle with a high probability.
- 3.6
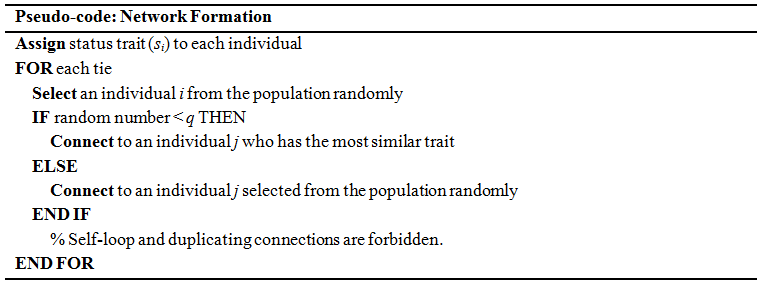
- Second, we build ties between individuals. A tie will be added into the network at each time step. To highlight homophily, i.e., the tendency for individuals seeking out and socializing with similar people, we introduce a parameter q∈[0,1]. With probability q, a new tie connects an individual randomly selected from the population to the one who has the closest status value and is not yet connected to the focal individual. With probability 1−q, it connects two individuals who are randomly chosen from the population. Self-loop and duplicating ties are forbidden. The pseudo-code of network generation is presented in Appendix 1.
- 3.7
- It is obvious that the homophily level of the network increases as q increases. Hence, we use q to represent homophily level in this study. Once the above-mentioned steps are completed, we obtain a status-homo network.
- 3.8
- As previously mentioned, social interactions can be homophilious in value traits that can shape the orientation of people toward future behavior. In our model, two parameters are associated with value trait, namely, motivation (mi) and conformity (λi). As suggested by McPherson et al. (2001, p. 419), value traits "often prove to be derivative of social positions themselves," so that we can obtain motivation-homo and conformity-homo networks by positively correlating the motivation and conformity of an individual to his/her status trait, respectively.
- 3.9
- The structure of these networks is contingent on the value of q (homophily level), irrespective of homophily types. In Figure 2, when q=0, individuals are equally likely to interact with any other, a uniform random network (with a small clustering coefficient and a short average path length) is yielded, in which the notion of individual similarity or dissimilarity has become irrelevant. By contrast, when q=1, all ties will be as local and short as possible (with a large clustering coefficient and a long average path length), yielding a significantly homophilious network.
- 3.10
- One may notes that the formation of network is very similar to the small-world network model proposed by Watts and Strogatz (1998).
Two models not only generate networks with similar structural
characteristics, but also exert similar effects on the diffusion of
collective behavior (see Appendix 2). The difference between the models
is that individuals' connectivity (i.e., the number of ties that one holds) always follows a Poisson distribution in our model, irrespective of the values of q;
by contrast, it may be equal in a small-world network model when the
rewiring probability is small. In other words, our model allows us to
examine how different levels of connectivity affect the role of an individual in intervention under all network settings.
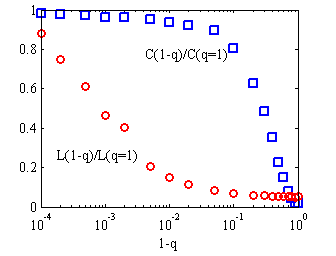
Figure 2. Structural Characteristics of network corresponding to q (C denotes average clustering coefficient and L denotes average shortest path length[5]) - 3.11
- Two
additional aspects are worth noting. First, status-homo networks allow
us to highlight the single effect of structural clustering, whereas the
other two networks allow us to focus on the combined effect of
clustering and like-mindedness. Second, these networks of different
types correspond to different socialization mechanisms. Two mechanisms
are most commonly cited as explanations of homophilious connections. In
the first mechanism, people connect through selective exposure or
social selection; in the second mechanism, connected people become
similar due to the diffusion of characteristics (McPherson et al. 2001). Status traits are observable but value traits (i.e., motivation and conformity)
are "hidden" in general; status-homo networks are driven by the first
mechanism, whereas motivation- and conformity-homo networks are more
frequently driven by the second mechanism.[6]
Intervention Strategies
- 3.12
- In this study, we consider six alternative strategies, namely, targeting those with (1) largest connectivity (LCN), (2) smallest connectivity (SCN), (3) largest motivation (LMT), (4) smallest motivation (SMT), (5) largest conformity (LCF), and (6) smallest conformity (SCF). We also consider another referential strategy, that is, randomly selecting targets from the population (called RND strategy).
- 3.13
- Intervention can be implemented at different timing, as shown in Figure 3. Note that T=0
implies that intervention is implemented before the launch of the
diffusion dynamics, that is, no adoption of the new behavior B exists;
meanwhile, T=1 implies that it is implemented after
rabble-rousers or innovators just initialized behavior B but without
any followers. For pre-interventions, targets are selected from the
entire population. However, if the diffusion had been launched (i.e., T>0),
promotion only targets those individuals who have not yet adopted,
whereas repression only considers those who had adopted already. For
promotion, we set selected targets will always adopt behavior B; for
repression, we set they will never adopt it. The pseudo-codes about
diffusion dynamics and intervention are presented in Appendix 3.
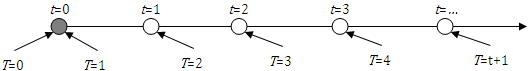
Figure 3. Schematic of intervention timing T Parameter Settings
- 3.14
- All of the parameter settings are provided in Table 1. The simulations are performed with N=1,000 individuals. We set average connectivity of individuals to K=10
because empirical studies indicate that the effective social
interaction of an individual is restricted to a small number of
neighbors (e.g., Eveland & Hively 2009; Singer et al. 2009). The values of q range from 0 to 1 with 0.05 increment; hence, we obtain 21 values for q. We assume uniform distributions (but with different intervals) of status si, motivation mi, and conformity λi for individuals. Note that the motivation and conformity of an individual may correlate to his/her status trait, depending on the predefined type of homophily.
Table 1: Parameter settings Parameter Value Interpretation N 1,000 Population size K 10 Average connectivity of individuals q 0-1 Homophily level si U(0,1) Individual's social status mi U(-1,1) Individual's motivation λi U(0,1) Individual's conformity T 0, 2, or 11 Intervention timing (0 for pre-intervention, 2 for early post-intervention, and 11 for late post-intervention) a 50 The number of targets - 3.15
- Figure 4 shows the diffusion of the new behavior B over time for different values of homophily level q,
in which the colors of blue, green, and red correspond to status-homo,
motivation-homo, and conformity-homo networks, respectively. The
adoption of behavior B rapidly increases in the early stages (t<5)
but slows down in the late stages, which indicates an S-shaped path of
diffusion. We select three time points to intervene the diffusion,
including pre-intervention (T=0), early post-intervention (T=2), and late post-intervention (T=11). Fifty eligible individuals are selected as targets for each intervention.
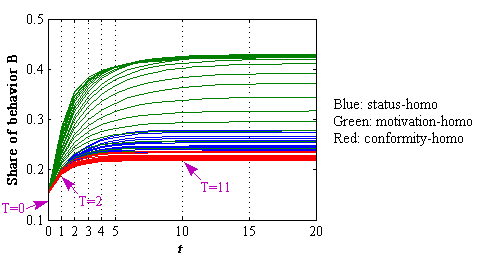
Figure 4. Share of behavior B over time for different values of the homophily level q - 3.16
- Each combination of the different values of parameters constitutes a single simulation run. One thousand simulations are conducted for each unique combination. The model, implemented in Matlab (2009a), is available for viewing at: https://www.openabm.org/model/4212/version/1/view.
Results
-
Preliminary Analysis
- 4.1
- Figure 5
presents the preliminary results of the effect of homophily on the
adoption of new behavior B. The relationship between homophily level (q) and adoption highly depends on homophily type. Specifically, increasing q
increases adoption on status-homo networks, but an opposite
relationship occurs on conformity-homo networks. Moreover, a mixed
relationship is evident in motivation-homo networks; that is,
increasing the level of homophily increases the adoption rate to a
point, but any further increases begin to decrease the adoption rate.
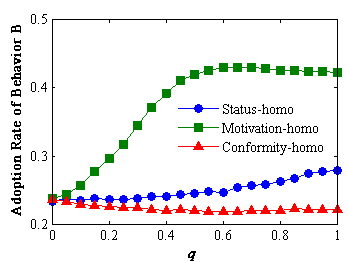
Figure 5. Preliminary results of the effects of homophily (Each simulation is run 30 time steps when generally the result of the model has become stable) - 4.2
- What are the factors that account for these observations? As Siegel (2009) suggested, diffusion of collective behavior over networks relates to a trade-off between the ease of behavioral spread and the nurturing of adoption enclaves. The factor that is more important depends on the feature of the behavior. If the behavior is subjected to simple contagion (i.e., people are predisposed to adopt), the diffusion of the behavior can benefit from increased ease in spreading; otherwise, it benefits from increased effectiveness in nurturing adoption enclaves. At q=0, weak ties prevail, but the adoption rate of behavior B is approximately 23%. This result implies that the diffusion of behavior B is associated more with complex contagion; hence, expanding adoption requires more adoption enclaves.
- 4.3
- For status-homo networks, initial adopters are distributed in a wide range of places. Increasing the homophily level makes them more clustered, which facilitates their joint power on nurturing adoption enclaves. Hence, increasing homophily always increases adoption. However, undue homophily decreases the ease in spreading adoption, such that the adoption increment is minor. For conformity-homo networks, increasing the homophily level induces the initial adopters to gather together. Intuitively, this condition enhances their power to nurture adoption clusters. However, the rest of the members in the clusters are highly likely to be wet blankets who require very strong behavioral confirmations or do not want to adopt it. Additionally, with the decrement of weak ties, increasing the homophily level always decreases adoption, and this outcome is expected.
- 4.4
- For
motivation-homo networks, the mixed relationship between homophily
level and adoption share is merely the trade-off discussed earlier. At
a low level of homophily, the diffusion of behavior B benefits from the
network, increasing the effectiveness of the initial adopters in
nurturing adoption enclaves. However, at a high level of homophily,
further increasing the homophily level is no longer beneficial because
the ease of spreading adoption falls.
Promotion Strategies
- 4.5
- We initially consider the promotion scenario in this subsection. Table 2
presents the most effective strategy that corresponds to different
combinations of homophily type, homophily level, and intervention
timing. For pre-promotion (T=0), the best strategy evidently
depends on homophily level, but not on homophily type. Specifically,
LCN strategy (targeting those individuals with largest connectivity) is the most effective if the homophily level is low; otherwise, SMT strategy (targeting those with smallest motivation) is the best option. For post-promotion (T=2
and 11), LCN strategy is always the best option, irrespective of the
type and level of homophily. The detailed results are illustrated in
Figure 6. Note that the y axes for the plots in Figure 6 (also in the follow-up figures) differ from each other to illustrate the outcomes more clearly.
Table 2: Summary of the optimal strategy for promotion Promotion Timing Homophily
TypeHomophily
LevelBeginning
(T=0)Early
(T=2)Late
(T=11)Status Low LCN LCN LCN High SMT LCN LCN Motivation Low LCN LCN LCN High SMT LCN LCN Conformity Low LCN LCN LCN High SMT LCN LCN 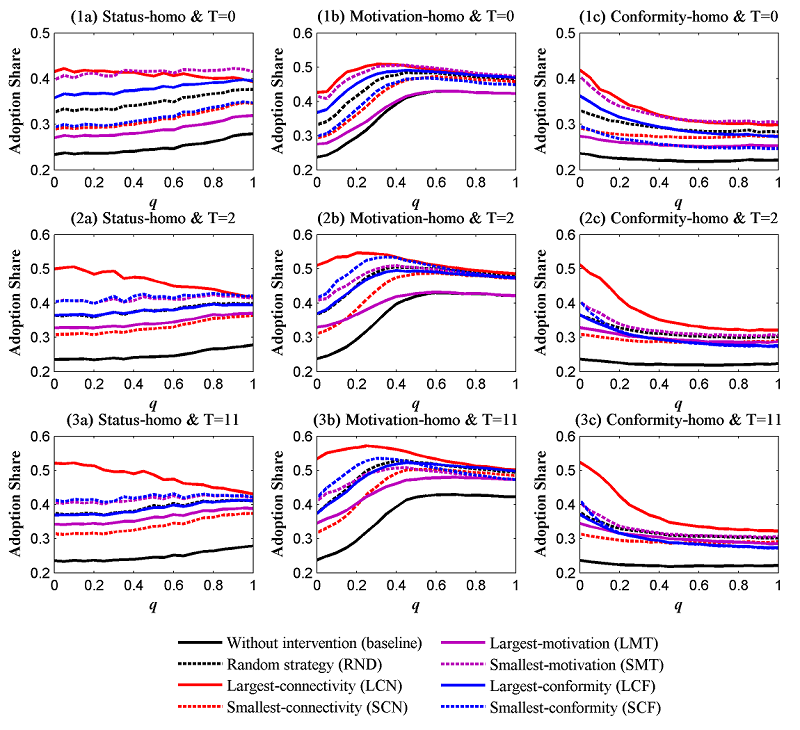
Figure 6. Performances of various promotion strategies - 4.6
- The difference in effectiveness between the intervention strategies is attributed to two factors. The first factor is the number of "contributors" who can be identified using each strategy. In this study, the essence of promotion is expanding adoption rather than accelerating it; hence, contributors refer to those individuals who would not adopt behavior B in the baseline case. The more contributors are selected as intervention targets, the more effective the strategy is, which demonstrates why SMT strategy is always more effective than LMT strategy. The second factor is the degree to which contributors fit the structural advantage of a network in the diffusion of collective behavior. When a network is effective in spreading adoption, LCN individuals control more spreading channels. When the network is propitious to nurture adoption enclaves, LCN individuals also have more power in their clusters. Hence, LCN strategy always is more effective than SC strategy.
- 4.7
- Why is SMT strategy the best option for pre-promotion instead of LCN strategy when a network displays a high level of homophily? Suppose that in such a case, the effectiveness of a strategy primarily depends on the first factor. As SM individuals are more likely to be contributors than LCN individuals, SMT strategy should be more effective. However, the effectiveness of the strategy relies more upon the second factor when the level of homophily becomes low. Hence, LCN strategy becomes the most effective, as previously discussed, because LCN contributors can activate as many spreading channels as possible.
- 4.8
- Notably, the
advantage of a strategy in identifying contributors is no longer
beneficial for post-promotion because a large part of "wrong targets"
(i.e., those who, even without promotion, would adopt behavior B) had
emerged before intervention. Therefore, LCN strategy is always the best
option for post-promotion.
Repression Strategies
- 4.9
- In
this subsection, we focus on the roles of different targeting
strategies in repressing the diffusion of collective behavior. The most
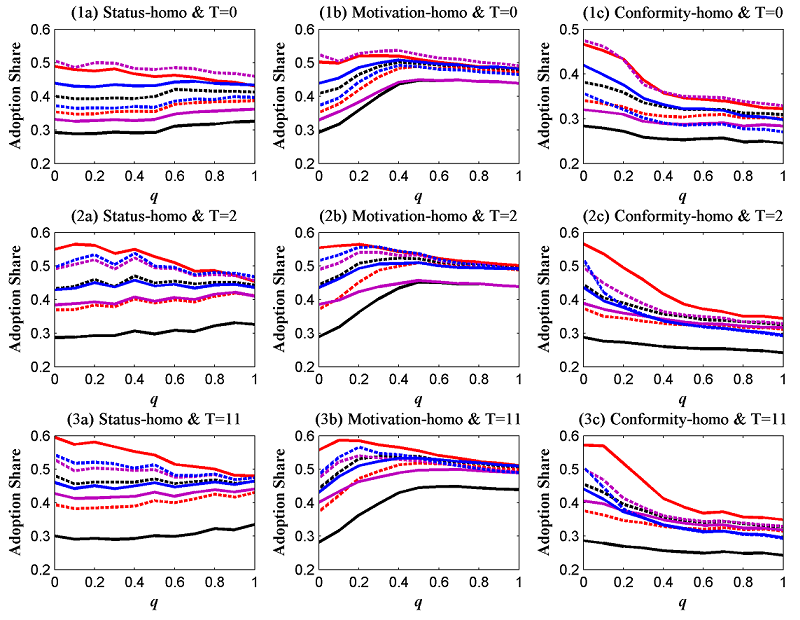
effective strategies in different settings are summarized in Table 3, whereas the complete results are presented in Figure 7.
Table 3: Summary of the optimal strategy for repression Repression Timing Homophily
TypeHomophily
LevelBeginning
(T=0)Early
(T=2)Late
(T=11)Status Low LMT LCN LCN High LMT LCN LCN Motivation Low LMT LCN LCN High LMT LCN LCN Conformity Low LMT LCN LCN High LMT LMT LMT 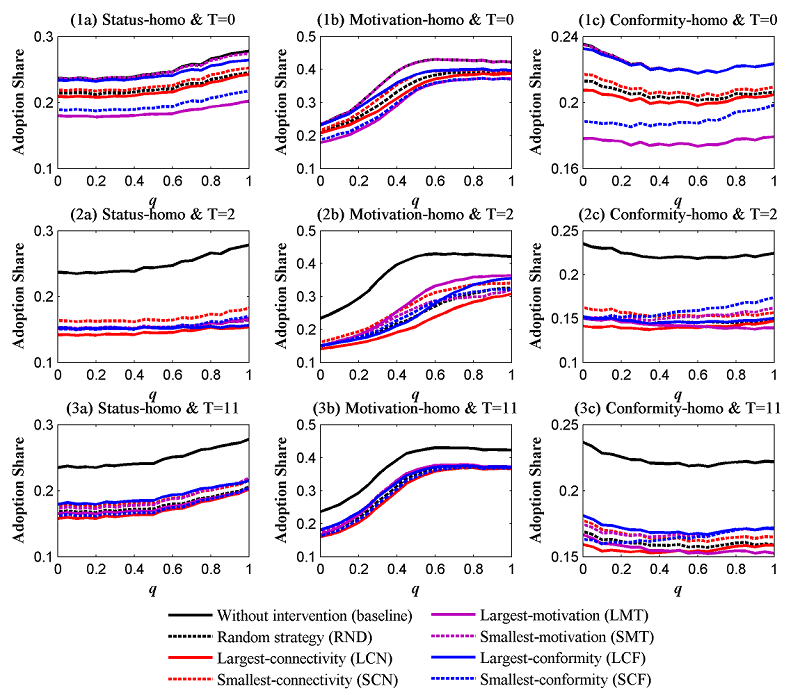
Figure 7. Performances of various repression strategies - 4.10
- Similarly, the two factors (i.e., the identification of contributors and the structural fitness of contributors) can be used to explain these results. For pre-repression, the first factor is the most important predictor of a strategy. The contributors in repression cases refer to those individuals who, even without intervention, would adopt behavior B. As LMT individuals are the most likely to be adopters, LMT strategy is always the optimal option for pre-repression (T=0), irrespective of the type and level of homophily, and this outcome is expected.
- 4.11
- Contributors
had emerged in post-repression cases; thus, the effectiveness of a
strategy primarily depends on the second factor. As previously
discussed, LCN individuals are always at an advantage in structural
fitness. Repressing LCN contributors to a larger extent can collapse
adoption enclaves or block behavior spreading. Therefore, LCN strategy
is evidently the best option in most cases. The exceptions are found in
conformity-homo networks at a high level of homophily; thus, LMT
strategy is the most effective option.
Sensitivity Analysis
(1) Intervention Timing
- 4.12
- The sensitivity of the results regarding intervention timing, T, is examined at low (q=0.2) and high (q=0.8) levels of homophily, respectively. All of the outcomes are shown in Figure 8, which indicates that our findings in Tables 2 and 3 are robust.
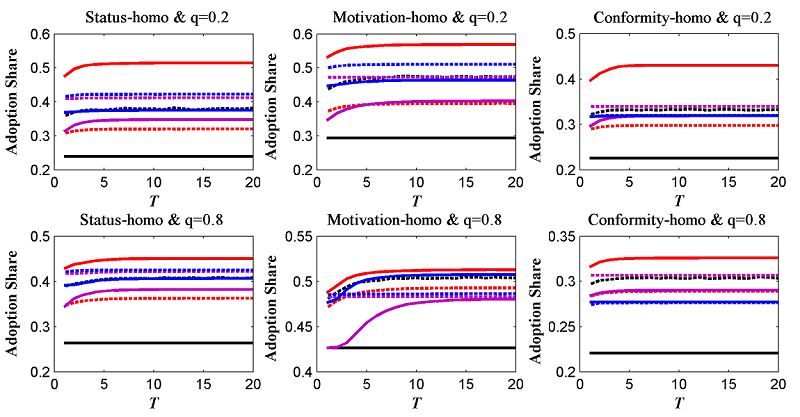
(a) Promotion scenarios 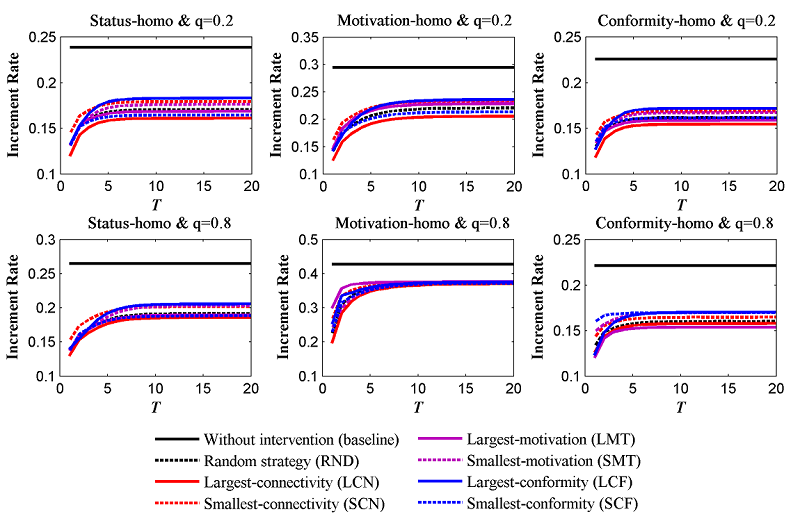
(b) Repression scenarios Figure 8. Sensitivity analysis for intervention timing T - 4.13
- Two additional points should be noted in Figure 8. First, Figure 8
shows that the later the promotion is implemented, the more effective
it is because later promotion can identify contributors to promotion
more easily. However, a key aspect to consider is that "promotion" in
this study is designed to expand adoption share; thus, our findings may
become unsuitable for adoption acceleration, in which contributors
refer to those who, without promotion, would adopt the new behavior,
but at a late date (Libai et al. 2013).
Second, the earlier the repression begins, the more effective it is
because once the new behavior had been well established, intervention
becomes more difficult.
(2) Distribution of Motivation
- 4.14
- In prior studies about threshold models, threshold (or motivation) is usually assumed to be normally distributed. Granovetter (1978)
suggests that the outcomes of behavior diffusion may diverge largely
although the initial condition of threshold may only differ very
slightly. Therefore, we tested the sensitivity of the results to the
distribution of mi, which is normally distributed with the same mean but with different standard deviations [i.e., mi∼N(0,0.5), mi∼N(0,0.75), and mi∼N(0,1)] and is truncated at 0 and 1. Outcomes show that the model dynamics changes with the distribution of mi, but the main findings resulted from the assumption of uniform distribution essentially remain valid (See an example in Figure 9).[7]
(a) Promotion scenarios 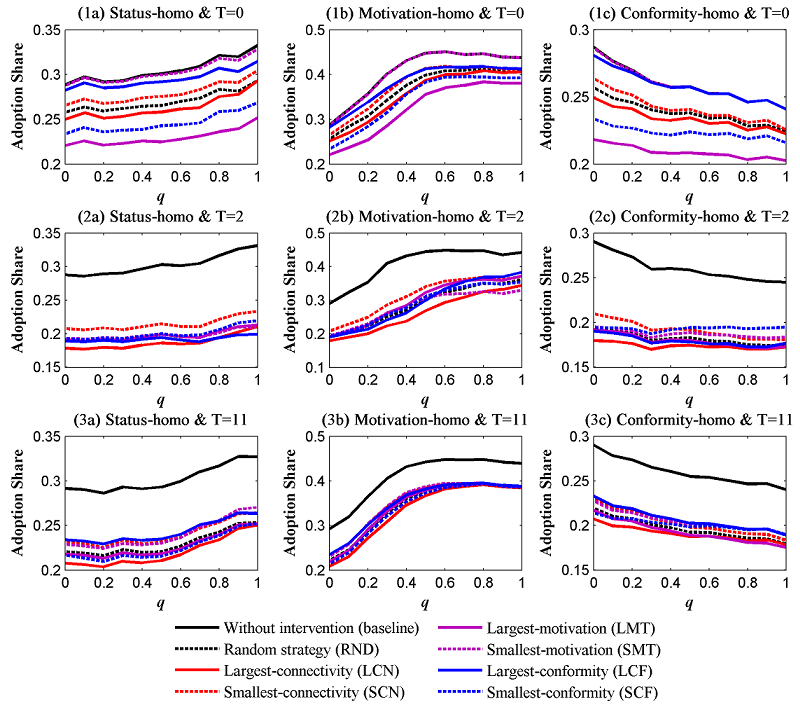
(b) Repression scenarios Figure 9. Sensitivity analysis for motivation distribution (mi∼N(0,1))
Discussion and Conclusions
- 5.1
- This study aims to explore the performance of intervention strategies for influencing the diffusion of collective behavior, and to investigate the relationship between performance and network properties. We focus on three classes of indicators of intervention targets, namely, connectivity, motivation, and conformity. Extensive agent-based simulation experiments demonstrate that the optimal strategy fundamentally depends on the nature of intervention, especially intervention time.
- 5.2
- With respect to pre-intervention, motivation is a leading indicator because individuals with high or low motivation are more likely to be contributors to repression or promotion, respectively. Although intervening in individuals based on motivation is less effective than those with large connectivity, the difference between them is insignificant. Therefore, if the homophily level is not well known, motivation is the safer indicator for pre-intervention strategies. This finding substantiates the argument proposed by Watts and Dodds (2007) that the readiness of a population to adopt an innovation can be a critically important factor that affects its diffusion. Moreover, the results about pre-promotion echo an interesting claim in the marketing field; that is, when a firm introduces an innovation to multiple markets, seeding the weak markets (in which customers have low motivation to purchase it) could occasionally be the best strategy (Libai et al. 2005; Miller et al. 2009).
- 5.3
- Connectivity is important with respect to post-intervention. For post-promotion, intervening in individuals with high connectivity is the best choice regardless of intervention time and nature of the network. This strategy is also the optimal option in most cases toward post-repression. Even in conformity-homo networks with a high level of homophily, the strategy remains the second-best option. Therefore, individuals with high connectivity are safe targets for post-intervention. This finding supports the "influentials hypothesis" in several fields; that is, individuals who influence a large number of their peers are important to the diffusion of collective behavior (e.g., Libai et al. 2013; Siegel 2009; Valente & Davis 1999; Valente & Pumpuang 2007; Watts & Dodds 2007).
- 5.4
- Notably, conformity is an inappropriate indicator of locating the targets of intervention, which counters the argument of Janssen (2011). The reason is that intervention in the current study is based on a totally different tactic. In Janssen's model, intervention is defined as an incentive for an individual to make the new behavior more attractive, which implies that selected targets will not necessarily change their behaviors. In such a setting, individuals with lower conformity to the behaviors of others are more likely affected by "nudging." In our model, intervention means that targeted individuals immediately change their behavior. As we introduced earlier, some other tactics exist. For example, Siegel (2011) defines repression as the removal of adopters from the network. All of these models strongly suggest that considering that we discuss intervention, we should pay special attention to the tactics.
- 5.5
- A key aspect to remember is that although the nature of intervention (its goal and timing) affects the performance of strategy, its effectiveness does rely on the nature of the social network (i.e., its type and structure). Thus, understanding one or two of these factors is insufficient for predicting the performance of intervention. In other words, to understand when and why intervention works, the conditioning effects of each on the others should be considered.
Acknowledgements
- This research was supported by the Fundamental Research Funds for the Central Universities (Program Nos. 2662014BQ049, 2662015QC051 and sk2014043), the National Natural Science Foundation of China (Program Nos. 71001084, 71371149, and 71472146), and the Natural Science Basic Research Plan in Shaanxi Province of China (Program No. 2015JM7379). The authors also thank the anonymous reviewers and editors for their valuable comments.
Notes
-
1Examples include the comparison of the
expected benefit (i.e., receiving a better welfare) and the opportunity
cost (i.e., missing work) of participating in a strike.
2Epidemic models are another important class of model for studying diffusion dynamics, including behavioral diffusion. Epidemic models, such as the SIS and SIR models, consider behavior as an infectious disease or computer virus (e.g., Dodds & Watts 2004, 2005; Rahmandad & Sterman 2008). In epidemic models, individuals will be infected (adopt a new behavior) depending on the chance of exposure to infected others. Similar to threshold models, epidemic models formalize a positive feedback into diffusion dynamics; that is, the more others adopt a behavior, the more an individual is apt to do so as well. However, both classes of models refer to very different essences. Threshold models correspond to complex contagion, which refers to the phenomenon in social networks in which multiple sources of exposure to an innovation are required before an individual adopts the change of behavior (Centola & Macy 2007). Conversely, epidemic models correspond to simple contagion, that is, the innovation may spread after only one incident of contact with an infected neighbor.
3The threshold of each individual is based on a personal calculation of the costs and benefits of performing the behavior, which will depend on the number of others who are doing the same thing. For example, different individuals may have different degrees of ideological commitment (which predispose them to riot) as well as different degrees of caution and risk aversion (which discourage riot participation). Seeing many others riot may both increase the perceived benefits and decrease the perceived risks of joining the riot. For this reason, each individual can be described as having a threshold; that is, the minimum number of other people performing the behavior that makes an individual feel that the behavior is more rewarding than costly.
4This is a plausible assumption in many settings. For instance, during a sequence of political protests (e.g. the protests in Egypt, or East Germany) participants see how many others have been mobilized for a given demonstration, even though they do not have direct connections to other protestors. However, as McAdam (1986) observes in Mississippi's Freedom Summer that "Participants were much more likely than withdrawals to have had ties—especially strong ties—to other volunteers" (p. 80). We can expect that direct network connections and their structure are very important even in the settings of mass movements, protest, and rebellion as well. Siegel (2009) enumerates three reasons for this expectation. First, networks provide the channels of information transfer. Second, networks coordinate and transfer resources. Third, networks transmit direct social influence such as reputation, fairness, social pressure, and "safety in numbers". These make people update their beliefs about the costs and the benefits inherent in participation, and so change their decisions. Moreover, people are hard to get the information about what all others are doing, so that they often infer it based on local participation. Therefore, we believe the model focusing on direct network connections can be applied to mass movements, protests, and rebellion.
5L is defined as the number of ties in the shortest path between two individuals, averaged over all pairs of individuals. C is defined as follows. Suppose that an individual i has mineighbors; then at most mi(mi−1)/2 can exist between them. Let Ci denote the fraction of these allowable ties that actually exist. Define C as the average of Ci over all individuals.
6We are grateful to an anonymous reviewer for pointing out this aspect.
7Details are available from the authors upon request.
Appendix 1
Appendix 2
-
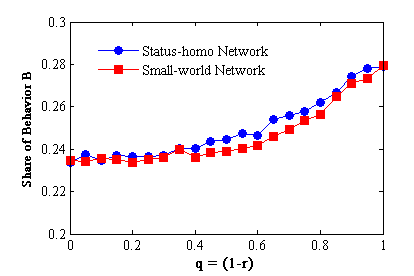
Figure A. Adoption share of behavior B corresponding to q in our model and the rewiring probability (r) in small-world model
Appendix 3
References
-
ALLCOTT, H. (2011). Social norms and energy conservation. Journal of Public Economics, 95(9), 1082–1095. [doi:10.1016/j.jpubeco.2011.03.003]
ALSTOTT, J., Madnick, S., & Velu, C. (2014). Homophily and the speed of social mobilization: the effect of acquired and ascribed traits. PLoS ONE, 9(4), e95140–e95140. [doi:10.1371/journal.pone.0095140]
BOB, C., & Nepstad, S. E. (2007). Kill a leader, murder a movement? Leadership and assassination in social movements. American Behavioral Scientist, 50(10), 1370–1394. [doi:10.1177/0002764207300162]
BORGATTI, S. P. (2006). Identifying sets of key players in a social network. Computational & Mathematical Organization Theory, 12(1), 21–34. [doi:10.1007/s10588-006-7084-x]
BOYD, R., & Richerson, P. J. (2002). Group beneficial norms can spread rapidly in a structured population. Journal of Theoretical Biology, 215(3), 287–296. [doi:10.1006/jtbi.2001.2515]
CENTOLA, D. (2010). The Spread of Behavior in an Online Social Network Experiment. Science, 329(5996), 1194–1197.
CENTOLA, D. (2011). An Experimental Study of Homophily in the Adoption of Health Behavior. Science, 334(6060), 1269–1272.
CENTOLA, D. (2013a). Homophily, networks, and critical mass: Solving the start-up problem in large group collective action. Rationality and Society, 25(1), 3–40.
CENTOLA, D. (2013b). A Simple Model of Stability in Critical Mass Dynamics. Journal of Statistical Physics, 151(1–2), 238–253.
CENTOLA, D., & Macy, M. (2007). Complex contagions and the weakness of long ties. American Journal of Sociology, 113(3), 702–734. [doi:10.1086/521848]
CHIANG, Y.-S. (2007). Birds of moderately different feathers: Bandwagon dynamics and the threshold heterogeneity of network neighbors. Journal of Mathematical Sociology, 31(1), 47–69. [doi:10.1080/00222500601013536]
CIALDINI, R. B., & Goldstein, N. J. (2004). Social influence: Compliance and conformity. Annual Review of Psychology, 55, 591–621. [doi:10.1146/annurev.psych.55.090902.142015]
DELRE, S. A., Jager, W., Bijmolt, T. H. A., & Janssen, M. A. (2010). Will It Spread or Not? The Effects of Social Influences and Network Topology on Innovation Diffusion. Journal of Product Innovation Management, 27(2), 267–282. [doi:10.1111/j.1540-5885.2010.00714.x]
DELRE, S. A., Jager, W., & Janssen, M. A. (2007). Diffusion dynamics in small-world networks with heterogeneous consumers. Computational and Mathematical Organization Theory, 13(2), 185–202. [doi:10.1007/s10588-006-9007-2]
DIMAGGIO, P., & Garip, F. (2011). How network externalities can exacerbate intergroup inequality1. American Journal of Sociology, 116(6), 1887–1933. [doi:10.1086/659653]
DODDS, P. S., & Watts, D. J. (2004). Universal behavior in a generalized model of contagion. Physical Review Letters, 92(21). [doi:10.1103/PhysRevLett.92.218701]
DODDS, P. S., & Watts, D. J. (2005). A generalized model of social and biological contagion. Journal of Theoretical Biology, 232(4), 587–604. [doi:10.1016/j.jtbi.2004.09.006]
EVELAND, W. P., & Hively, M. H. (2009). Political Discussion Frequency, Network Size, and "Heterogeneity" of Discussion as Predictors of Political Knowledge and Participation. Journal of Communication, 59(2), 205–224. [doi:10.1111/j.1460-2466.2009.01412.x]
FREEMAN, L. C. (2007). Social Network Analysis. London, BC, England: SAGE.
GERBER, A. S., Green, D. P., & Larimer, C. W. (2008). Social pressure and voter turnout: Evidence from a large-scale field experiment. American Political Science Review, 102(1), 33–48. [doi:10.1017/S000305540808009X]
GIBBONS, D. E. (2004). Network structure and innovation ambiguity effects on diffusion in dynamic organizational fields. Academy of Management Journal, 47(6), 938–951. [doi:10.2307/20159633]
GOLDENBERG, J., Han, S., Lehmann, D. R., & Hong, J. W. (2009). The Role of Hubs in the Adoption Process. Journal of Marketing, 73(2), 1–13. [doi:10.1509/jmkg.73.2.1]
GOLDSTONE, R. L., & Janssen, M. A. (2005). Computational models of collective behavior. Trends in Cognitive Sciences, 9(9), 424–430. [doi:10.1016/j.tics.2005.07.009]
GRANOVETTER, M. (1978). Threshold models of collective behavior. American Journal of Sociology, 83(6), 1420–1443. [doi:10.1086/226707]
HAENLEIN, M., & Libai, B. (2013). Targeting Revenue Leaders for a New Product. Journal of Marketing, 77(3), 65–80. [doi:10.1509/jm.11.0428]
HU, H., Cui, W., Lin, J., & Qian, Y. (2014). ICTs, Social Connectivity, and Collective Action: A Cultural-Political Perspective. Journal of Artificial Societies and Social Simulation, 17(2) 7: <https://www.jasss.org/17/2/7.html>
HU, H., Lin, J., & Cui, W. (2014). Cultural Differences and Collective Action: A Social Network Perspective. Complexity, In press.
HUCKFELDT, R. R. (2009). Interdependence, Density Dependence, and Networks in Politics. American Politics Research, 37(5), 921–950. [doi:10.1177/1532673X09337462]
HUCKFELDT, R. R., Beck, P. A., Dalton, R. J., & Levine, J. (1995). Political environments, cohesive social-groups, and the communication of public-opinion. American Journal of Political Science, 39(4), 1025–1054. [doi:10.2307/2111668]
JANSSEN, M. A. (2011). Targeting Individuals to Catalyze Collective Action in Social Networks. Paper presented at the annual conference of the Computational Social Science Society of America, Santa Fe, NM.
JANSSEN, M. A., & Jager, W. (2003). Simulating market dynamics: Interactions between consumer psychology and social networks. Artificial Life, 9(4), 343–356. [doi:10.1162/106454603322694807]
KELLER, E., & Barry, J. (2003). The Influentials: One American in Ten Tells the Other Nine How to Vote, Where to Eat, and What to Buy. New York: The Free Press.
KOSSINETS, G., & Watts, D. J. (2009). Origins of Homophily in an Evolving Social Network. American Journal of Sociology, 115(2), 405–450. [doi:10.1086/599247]
KRAVITZ, R., Linn, L., Tennant, N., Adkins, E., & Zawacki, B. (1990). To strike or not to strike? House-staff attitudes and behaviors during a hospital work action. Western journal of medicine, 153(5), 515.
LIBAI, B., Muller, E., & Peres, R. (2005). The role of seeding in multi-market entry. International Journal of Research in Marketing, 22(4), 375–393. [doi:10.1016/j.ijresmar.2005.09.004]
LIBAI, B., Muller, E., & Peres, R. (2013). Decomposing the Value of Word-of-Mouth Seeding Programs: Acceleration Versus Expansion. Journal of Marketing Research, 50(2), 161–176. [doi:10.1509/jmr.11.0305]
MCADAM, D. (1986). Recruitment to high-risk activism: The case of Freedom Summer. American Journal of Sociology, 92(1), 64–90. [doi:10.1086/228463]
MCADAM, D., Tarrow, S., & Tilly, C. (2001). Dynamics of contention. Cambridge, UK: Cambridge University Press. [doi:10.1017/CBO9780511805431]
MCPHERSON, M., Smith-Lovin, L., & Cook, J. M. (2001). Birds of a feather: Homophily in social networks. Annual Review of Sociology, 27, 415–444. [doi:10.1146/annurev.soc.27.1.415]
MILLER, K. D., Fabian, F., & Lin, S. J. (2009). Strategies for online communities. Strategic Management Journal, 30(3), 305–322. [doi:10.1002/smj.735]
RAHMANDAD, H., & Sterman, J. (2008). Heterogeneity and network structure in the dynamics of diffusion: Comparing agent-based and differential equation models. Management Science, 54(5), 998–1014. [doi:10.1287/mnsc.1070.0787]
ROBINSON, D. T., & Balkwell, J. W. (1995). Density, transitivity, and diffuse status in task-oriented groups. Social Psychology Quarterly, 58(4), 241–254. [doi:10.2307/2787126]
ROGERS, E. M. (1995). Diffusion of innovations. New York: Free Press.
SIEGEL, D. A. (2009). Social Networks and Collective Action. American Journal of Political Science, 53(1), 122-138. [doi:10.1111/j.1540-5907.2008.00361.x]
SIEGEL, D. A. (2011). When Does Repression Work? Collective Action in Social Networks. Journal of Politics, 73(4), 993–1010. [doi:10.1017/S0022381611000727]
SINGER, H. M., Singer, I., & Herrmann, H. J. (2009). Agent-based model for friendship in social networks. Physical Review E, 80(2). [doi:10.1103/PhysRevE.80.026113]
VALENTE, T. W. (1996). Social network thresholds in the diffusion of innovations. Social Networks, 18(1), 69–89. [doi:10.1016/0378-8733(95)00256-1]
VALENTE, T. W. (2012). Network Interventions. Science, 337(6090), 49–53.
VALENTE, T. W., & Davis, R. L. (1999). Accelerating the diffusion of innovations using opinion leaders. Annals of the American Academy of Political and Social Science, 566, 55–67. [doi:10.1177/0002716299566001005]
VALENTE, T. W., & Pumpuang, P. (2007). Identifying opinion leaders to promote behavior change. Health Education & Behavior, 34(6), 881–896. [doi:10.1177/1090198106297855]
VAN ECK, P. S., Jager, W., & Leeflang, P. S. H. (2011). Opinion Leaders' Role in Innovation Diffusion: A Simulation Study. Journal of Product Innovation Management, 28(2), 187–203. [doi:10.1111/j.1540-5885.2011.00791.x]
WATTS, D. J. (2002). A simple model of global cascades on random networks. Proceedings of the National Academy of Sciences of the United States of America, 99(9), 5766–5771. [doi:10.1073/pnas.082090499]
WATTS, D. J., & Dodds, P. S. (2007). Influentials, networks, and public opinion formation. Journal of Consumer Research, 34(4), 441–458. [doi:10.1086/518527]
WATTS, D. J., & Strogatz, S. H. (1998). Collective dynamics of 'small-world' networks. Nature, 393(6684), 440–442.
WAY, B. M., & Lieberman, M. D. (2010). Is there a genetic contribution to cultural differences? Collectivism, individualism and genetic markers of social sensitivity. Social Cognitive and Affective Neuroscience, 2014(5), 203–211. [doi:10.1093/scan/nsq059]
YAVAS, M., & Yucel, G. (2014). Impact of homophily on diffusion dynamics over social networks. Social Science Computer Review, Inpress, 1–19.