
 Abstract
- The overall burden of foodborne illness is unknown, in part
because of under-reporting and limited surveillance. Although the
morbidity associated with foodborne illness is lower than ever, public
risk perception and an increasingly complex food supply chain
contribute to uncertainty in the food system. This paper presents an
agent-based model of a simple food safety system involving consumers,
inspectors and stores, and investigates the effect of three different
inspection scenarios incorporating access to information. The
increasing complexity of the food supply chain and agent-based modeling
as an appropriate method for this line of investigation from a policy
perspective are discussed.
- Keywords:
- Agent-Based Modeling, Search, Food Safety, Inspection, Policy
Introduction
- 1.1
- Food exhibits multi-dimensional features; food plays a role
in many contexts, including basic survival, cultural norms, economics,
trade, and social situations. We all have a vested interest in food
because we all have to eat. Underpinning all of these different roles
is the notion that food should be safe. There are many stakeholders,
from consumers[1],
to industry, food scientists, farmers, retailers, and regulatory
agencies who have different criteria for determining appropriate food
choices, leading to trade-offs and tensions in determining the best
policy options for food safety systems.
- 1.2
- Over the past few decades, the global food supply chain has
grown more complex, and breakdowns in food safety have garnered a lot
of public attention. There are many notable examples of food safety
crises that have ignited public discussion, changed consumer habits,
and impacted legislation and industry practices: the bovine spongiform
encephalopathy (BSE) outbreak in the United Kingdom, which peaked in
1993 with approximately 1000 new cows being infected weekly (Centers for Disease Control and
Prevention 2013a); the Maple Leaf Foods Listeria
monocytogenes outbreak in 2008, which resulted in 57
confirmed cases and 23 human deaths, partly because the deli meat in
question was served to high-risk populations (Birk-Urovitz 2011); and,
most recently, the scandal in the European Union when horsemeat was
found in prepared foods, such as lasagna and burgers, that were labeled
as beef products (Waldie 2013).
These all led to demands for new and more stringent production methods
and legislation. Food safety challenges have arisen from population
growth and an aging population, a global market for food products and
global supply chains, increased demand for protein, and climate change
pressures on agricultural practices (Newell
et al. 2010). These changes in food systems raise policy
questions related to the optimal management of risk, which is also tied
to food safety at an affordable cost.
- 1.3
- In order to investigate these concerns, a basic agent-based model (ABM) has been developed to explore the impact of small changes in system-level rules. Much of the literature examines consumer, industry, or government responses to food safety incidents in isolation; the agent-based model considers the interaction between consumers, retailers, and inspectors. The model is intended to provide insight into these interactions, rather than serve as a predictive tool (Epstein 2008). Three model versions, representing different inspection scenarios, are described using the Overview, Design Concepts and Details (ODD) framework and compared. This paper provides background on the complexity of the food safety environment, the theory surrounding ABMs, employs the ODD framework for describing ABMs, the model results, and conclusions.
Background
- 2.1
- The global food safety system is complex: trade, culture,
microbiology and spatial and economic aspects all interact to form a
system with interdependent elements (Miller
& Page 2007, p. 9). As defined by Simon (1962), a complex system is one
where "a large number of parts … interact in a nonsimple way." A
distinction must be made here between complex and complicated systems;
in complicated systems, the elements within the system maintain some
degree of independence and can be studied independently. Complex
systems are, by definition, not reducible (Miller
& Page 2007).
- 2.2
- A contributing factor to food safety's complexity is a lack
of certainty; the overall infection and disease burden from unsafe
food, even in OECD countries, is unknown (Newell
et al. 2010; Rocourt,
Moy, Vierk, & Schlundt 2003) and small breakdowns at
any stage of the system can lead to widely distributed outbreaks, given
the interconnected trade system and extensive movement of people (Havelaar et al. 2010; Newell et al. 2010; Rocourt et al. 2003).
Consumers may also assess safety along competing dimensions (Green, Draper, & Dowler 2003);
the safety of a food can be defined in the immediate term, for example,
food that is not contaminated by bacteria, or in the long-term, as in
food that will not cause health problems, such as high cholesterol, in
the future. Food safety can also be viewed through the competing lenses
of values and science (Nestle 2010):
food produced in large, industrialized plants may be free from
contamination and therefore considered safe, but consumers may express
distrust of a complicated system involving industrialized agriculture,
and its associated environmental effects, as well as the concentration
of the food industry into the hands of a few very large, powerful
companies. As noted by Havelaar et al. (2010),
"The consumer demands fresh, tasty, healthy and
wholesome food products. Nevertheless, safety is in this framework
considered an absolute requirement; placing unsafe food on the market
is not an option in the consumer's mind." However, defining exactly
what safe food means to consumers can be a challenging exercise.
- 2.3
- Food-borne disease, for the purposes of this paper, refers
to all diseases caused by consuming food contaminated[2] by any bacterial,
viral, prion, or parasitic agent (Rocourt
et al. 2003). Currently, the overall disease burden of
food-borne diseases is unknown (Newell
et al. 2010). The Centers for Disease Control and Prevention
(CDC) estimates that there are 48 million cases, 128,000
hospitalizations, and 3000 deaths related to foodborne illness annually
in the United States; this means that 1 in 6 Americans are sick each
year (Centers for Disease Control
and Prevention 2013b). The Public Health Agency of Canada
estimates that 4 million Canadians, or 1 in 8, are sick each year (Public Health Agency of Canada 2013).
These estimates come with many built-in assumptions, and both
organizations acknowledge that there is underreporting. Although
foodborne disease is caused by a variety of pathogens, including common
bacteria such as Escherichia coli, Salmonella,
and Campylobacter jejuni, viruses such as Hepatitis
A and noroviruses, and parasites such as Trichinella
and Toxoplasma gondii, the most common symptom is
diarrhoeal disease. Most cases of foodborne disease are relatively
mild, and many people do not view diarrhoea as a serious outcome of
disease but rather an inconvenience, which contributes to
underreporting of pathogens that cause milder disease (Rocourt et al. 2003). However,
in more serious cases, foodborne diseases may result in severe
complications or death, particularly among vulnerable segments of the
population: pregnant women, young children, immune-compromised
individuals, and older adults (Gerba,
Rose, & Haas 1996). Given
differences with reporting structures and surveillance, it can be
difficult to compare data across countries and jurisdictions, since a
higher number of reported cases could simply be the result of a better
surveillance system and not necessarily from more illnesses (Rocourt et al. 2003).
- 2.4
- It should be clarified that the current regime of Hazard
Analysis Critical Control Points (HACCP) and risk analysis[3] (Verbeke, Frewer, Scholderer, &
De Brabander 2007), developed over the last 30 years (Phillips 2009), has led to
declines in estimated foodborne disease incidence (Centers for Disease Control and
Prevention 2013b). One definition of regulation that is
applicable here is that it "is the sustained and focused attempt to
alter the behaviour of others according to defined standards or
purposes with the intention of producing broadly identified outcome"
(Black 2002, p. 20, as cited in Havinga
2006). Most of the time, the system works at mitigating
hazards, but when it does not, there can be serious illnesses and
death, and public trust in the food system more generally is damaged.
Changes in production systems and trade present new opportunities for
pathogens to proliferate or adapt to new hosts. Food safety policies
are often national or regional, but as the system has become
increasingly globalized, current management systems of risk analysis
and HACCP may be overwhelmed by new pathogens and hazards.
- 2.5
- Despite new efforts in testing and safety, no pathogens
have been eradicated or contained, and new ones are emerging (Newell et al. 2010).
Increasingly, viral pathogens are a food safety concern, as shown by
recent Hepatitis A outbreaks in the US linked to frozen berries and
pomegranate seeds imported from Turkey (Centers
for Disease Control and Prevention 2013c), but global
microbiological quality control criteria focus on bacterial counts,
which is insufficient for dealing with viral contamination (Newell et al. 2010). The food
system is also changing rapidly, challenging current policies.
- 2.6
- Rules that inform decision-making are fundamentally
different in areas of uncertainty. The perception of risk by people
exposed to a hazard tends to be fundamentally different from the
technical assessment of risk. When social and psychological aspects are
included, consumers tend to consistently overestimate some risks while
underestimating others, and they are often keen to listen to negative
information while ignoring positive information (Thaler & Sunstein 2008;
Verbeke et al. 2007; Yeung & Morris 2001).
This has led to a gap between how experts and the general public view
food risks, leading to frustration on both sides. Heuristics, or mental
shortcuts used to make decisions, are prevalent in consumer
decision-making and lead to persistent biases. The availability
heuristic, for example, leads people to view events that are recent,
dramatic, or otherwise easily recalled as more likely to occur (Tversky & Kahneman 1974).
Verbeke et al. (2007)
highlight fright and panic elements in the social amplification of
risk. Fright is related to the individual's perception of the severity
of the risk, and is increased if the risks are perceived as unavoidable
or if there are differing stakeholder perspectives on managing the
risk. Whether information is perceived as reassuring or frightening
depends on one's opinion (Sandman
1994). Panic relates to the perception of risk: for example,
how many people are exposed to the risk, whether it is unknown or
uncertain, and whether it may come with long-term consequences has
differing impact. Since food is a complex area, and a lot of
information available may sound uncertain, incomplete, and
contradictory (especially online), there is a lot of opportunity for
public fear following foodborne illness outbreaks.
- 2.7
- The consequence is that while there is now a lower morbidity due to foodborne diseases, more recalls than ever are leading to poor public perception (Kramer, Coto, & Weidner 2005). Outbreaks, due to the nature of our changed food system, tend to be spread out over a wide geographic area due to low-level contamination in processed foods (Rocourt et al. 2003, p. 8) and may require new approaches to dealing with their associated illnesses, in part because of anti-microbial resistance (Newell et al. 2010). As stated by Havelaar et al. (2010) "Due to the nature of microbes and our food chain, measures to ensure food safety have to be implemented on a global scale, necessitating a global approach." Part of this global approach requires interdisciplinary research and new methods to understand and promote food safety from farm to fork in an interconnected, complex system.
Rationale
for using Agent-Based Modelling
- 3.1
- ABM has been met with enthusiasm in some fields of the
social sciences, but has not yet been extensively used in public
policy. Although some success has been seen in modeling land use
management, public health, and water policy, there have been fewer
applications in business and policy analysis (Moss
2008). This is especially true with respect to food policy.
- 3.2
- The strength of ABMs is that they provide a way to
represent complex systems more simply, by focusing on the system's
individuals and their behaviours (Railsback
& Grimm 2012). Axelrod (2003)
states that most modeling in the social sciences is informed by
rational choice theory, not because many scholars feel that its
assumptions accurately represent human behaviour, but because it allows
for deduction. Adaptive behaviour offers a viable alternative to
optimization; but it requires simulation since the consequences of
adaptation cannot be deduced. ABM offers an opportunity to relax the
assumptions of rational choice theory to more realistically model how
individuals make decisions. By using straightforward behavioural rules,
ABMs can model decision-making in a more realistic manner.
- 3.3
- ABM's ability to deal with heterogeneous populations that
can use individual data, rather than aggregate data, is a unique
feature with strong application to the social sciences. In many cases,
social science problems are dealing with heterogeneous populations
where variation is masked by aggregate data. The individual-based
perspective marks an important departure from many theoretical
positions in sociology and policy studies, which view society as a
"hierarchical system of institutions and norms that shape individual
behavior from the top down" (Macy
& Willer 2002, p. 144). Since people react to changes
in their environment, and these reactions can cause further changes,
this leads to difficulties in backtracking and applying different
solutions to complex problems (Rittel
& Webber 1973). Methods that can incorporate change
over time and control for these changes are able to more accurately
capture social processes, and this is one area where simulation holds a
lot of promise.
- 3.4
- Although many people consider prediction to be a primary
goal of modelling, depending on the data available and the goals of the
modeling exercise, it is not the only one. Epstein (2008) notes that
there are many other reasons to build models, including explaining a
phenomenon, guiding data collection, discovering new questions,
illuminating uncertainties and dynamics, demonstrating trade-offs,
challenging theory, and opening new opportunities for policy
discussion. Importantly, since all models are simplified abstractions,
Epstein (2008) notes that
"all the best models are wrong. But they are fruitfully wrong."
Stylized models that are designed to offer insight to a complex system
or problem so that further discussion of policy alternatives,
legislative changes, or other adjustments may take place may still be
very useful, even if they are incapable of prediction.
- 3.5
- Only a few authors have explored food safety using
agent-based models.[4]
One example used the BSE outbreak in the United Kingdom as a case study
to evaluate public risk perceptions using Cultural Theory (Bleda & Shackley 2012).
The archetypes (individualist, hierarchist, fatalist and egalitarian)
from Cultural Theory were used to inform assumptions about agent
perceptions. Social amplification of risk by the media and trust of
government of science were also incorporated into the model. Verwaart
and Valeeva (2011)
constructed a model looking at producer decisions for improving animal
health practices. The model incorporated economic incentives with
social influence and was grounded in the theory of planned behaviour.
Tykhonov et al. (2008)
constructed an ABM of the trust and tracing game designed to collect
data on decision-making behaviour in a food supply chain where there is
asymmetric information about food safety and food quality. The model
incorporated trading agents, representing producers, middlemen,
retailers, and consumers as well as a tracing agent. The agents were
separated thrifty, opportunistic, or quality-minded categories, which
affected their behaviour. Although it is possible to run experiments
with human subjects to collect data on their behaviour in a trust and
tracing game, these experiments are very time-consuming. By
constructing a model, the authors could figure out which iterations of
the game were the most interesting and then conduct these as
experiments with human subjects. By incorporating theories of human
behaviour with food safety scenarios, these models indicate the
potential for advancing ABM in this area.
- 3.6
- A concern voiced in the literature involves the scientific rigor and reproducibility of ABMs. Many of the models published in the literature are not described using a standard format that allows for others to reproduce them, making independent replication of results impossible (Richiardi, Leombruni, Saam, & Sonnessa 2006). In order to contribute a reproducible model, a model description following the Overview, Design Concepts, and Details (ODD) protocol is given below.
Model
Description
- 4.1
- The following section follows the ODD framework (Grimm et al. 2010) to clearly
outline the objectives and implementation of a basic food safety
inspection model. Using NetLogo (version 5.0.1),[5] a simulated
environment was programmed where consumers, stores, and inspectors
interact. One of the goals of the model was to observe the effect of
information asymmetry on consumer behaviour. The system-level rules
governing these interactions were changed in different versions of the
model, allowing for comparisons between the scenarios. Insights from
these scenarios can then be used to inform policy discussion.
Purpose
- 4.2
- The purpose of this model is to provide insight into the
role of information and its influence on the optimal level of
inspectors in a food system. To explore this, we compare three search
strategies used by inspectors: a random strategy,[6] one where stores can
signal to inspectors and consumers that there is a problem,[7] and lastly, an
adaptation of the signalling stores scenario that includes false
positive and false negative signals.[8]
Entities, state variables and scales
- 4.3
- The entities included in the model are stores, consumers
and inspectors. Food products and suppliers are assumed to be embedded
within the stores. The tick counter is used to keep track of discrete
time steps. Each time the 'go' procedure is called, the tick counter
increases by one tick. Please see Table 1 for a summary of variables
and their descriptions.
State variables
- 4.4
- Patches: Patches have a variable called
'store'; 100 store patches are scattered throughout the model. All
other patches represent empty space. Stores are either contaminated or
clean – these are represented by red and green in the model. In the
scenario that includes possible errors in store signals, store patches
also have a variable for the chance of a false positive or false
negative signal, which ranges from .01 to .1.
- 4.5
- Consumers: Consumer agents are a breed
of turtle in NetLogo. There are 2000 of them at the start of the model
run.
Table 1: Variable description Variable name Description Range Consumers use a range of patches within which to search for potential destination stores Immune system Consumers have a probability that ranges from 10% to 50% of becoming sick should they land on a contaminated patch Sick Consumers become sick if they land on a contaminated store and the random number generated is less than immune-system Bad store patches List of stores that have made this consumer sick in the past Destination Changes each time step; set to the most suitable store within the consumer's range that is not a member of bad-store-patches Heal counter If a consumer becomes sick, it remains sick for 3 time steps and does not move - 4.6
- Inspectors: Inspectors have a range
within which they look for patches to inspect; this range is twice the
range of consumers. The number of inspectors in the model has been
varied. Firstly, experiments were run using 1-15 inspectors to get a
sense of model outcomes. More detailed experiments were then run using
1 inspector, 3 inspectors, and 5 inspectors, respectively.
- 4.7
- Minimal spatial element: Consumers and inspectors both have
a range within which they can see potential destinations. There are no
collectives in the model. Simulations last for 150 time steps (or
ticks, in NetLogo); the length of one time step is not specified, given
that this is a highly stylized model. However, in a real system, the
relevant time step would be days.
Process Overview and Scheduling
- 4.8
- Once the model is set up, the following processes,
described under submodels, are executed in the following order.
• One store per time step is randomly selected and becomes contaminated.
• In the model versions with store closures, stores that have not been visited in 10 time steps close.
• Consumers execute their consume procedure, as follows:
- Destination-set
- Consumers evaluate all stores within their range, and choose a store patch that is not on their list of bad-store-patches. If no such store exists, the consumer wanders by randomly setting its heading and moving forward three patches.
- Eat
- If the store is contaminated and the random-number generated is less than immune-system, the consumer becomes sick and adds this patch to the list bad-store-patches. The consumer also sets its heal counter to 1.
- If the consumer is sick, it does not execute the above two procedures, but instead adds 1 to its heal-counter.
• Inspectors test
- The testing procedure varies depending on the complexity of the model version.
- In this most basic model, inspectors move randomly to a
store within their range. If the store happens to be contaminated, the
inspector changes the contaminated variable from 1 back to 0 and
changes the store's colour to orange. If the store is not contaminated,
the inspector does nothing.
- In the 'stores signal' scenario, 5 stores per time step
are selected to signal; if they are contaminated, they turn pink, which
lets consumers know to avoid the store and lets inspectors know to come
check it first.
- In the 'stores signal with errors' scenario, 5 stores per time step are selected to signal. If the store is contaminated and a random floating point number is greater than the store's 'signal-error' variable, then the store signals. If the floating point number is smaller, then the store will not signal even though it is contaminated (a false negative). As well, if the selected store is not contaminated, but the random floating point number is less than the store's 'signal-error variable, then the store will signal even though it is not contaminated (a false positive.)
• Consumers that have been sick for three time steps heal.
- 4.9
- Since there are no collectives in the model, the order in
which each consumer, inspector or patch executes the above is not
important. For a summary of the three scenarios, see Table 2.
Design Concepts
- 4.10
- A number of concepts and theories underlie the model's
design, and they have been used to influence the variables and the
submodels used in the model.
- 4.11
- Basic principles: The following basic
principles, adapted from the literature on food safety, have been
incorporated into the model.
- 4.12
- Embedded supply chain: In the model, suppliers and
producers are embedded and only stores are explicitly shown in the
model. Since consumers only interact with stores and restaurants, and
they bear the brunt of responsibility for supplying 'safe' food
products, this element greatly simplified the construction of the
model. The literature also supports this point: "When major food safety
issues arise, both retailers and manufacturers will be affected (if not
harmed) by any recall, even if they are not to blame for the problem"
(Grievink, Josten and Valk 2002, p. 481-2, as cited by Havinga 2006).
- 4.13
- Inspection system: In the Canadian context, the Canadian
Food Inspection Agency is responsible for enforcing policies set by
Health Canada that govern the safety of food sold in Canada; the CFIA
fulfills this mission by inspecting federally-governed abattoirs and
food processing plants. When food safety emergencies occur, the CFIA
responds along with Health Canada, provincial ministries, and industry;
food recalls are coordinated by CFIA staff. The CFIA is
also responsible for enforcing laws on labeling and packaging,
regulating products derived from biotechnology (although Health Canada
is responsible for assessing the safety of new foods) and certifying
exports and initial import inspections of food and agricultural
products, among other responsibilities (Government
of Canada 2013). Provincial governments are responsible for
provincially-licensed abattoirs, which can only sell meat in the
province in which they are licensed. Restaurant and food service
inspection is quite fragmented, and is generally carried out by
municipalities, regional health authorities, or the provincial
government, depending on the province (Government
of Canada 2014). Although products sold in grocery stores and
restaurants have generally been inspected further up the supply chain,
these inspections are not represented in the model. The model presented
in this paper most closely mirrors the inspection of restaurants and
food service outlets.
- 4.14
- Immune system: This is one area where there is no real
answer in the literature. Although there have been advancements in
predictive microbiology, a method used to predictively model pathogen
spread, persistence, and death in a food source (Lammerding & Paoli 1997;
Walls & Scott 1997), this research does not provide a clear
translation of how pathogen loads in a food source affect the actual
occurrence of illness.[9]
Certain groups, such as the elderly, young children, pregnant women,
and immune-compromised people are more susceptible to foodborne
pathogens than others (Gerba et al.
1996), but there is uncertainty as to the actual likelihood
of illness from consuming contaminated food products. As such, model
runs were completed using an immune system parameter that is
heterogeneous and varies throughout the population between .1 and .5.
- 4.15
- Consumer avoidance: Previous research conducted by the Food
Standards Association in the UK indicates that, if they had concerns
about hygiene, up to 70% of respondents would not purchase again from a
food service outlet (as cited by Choi,
Nelson, & Almanza 2011). As well, focus group
research from the UK has indicated that personal experience with food
poisoning is an important source of knowledge for changing food safety
behaviour, and some quoted participants indicated that getting sick
after eating specific products from a supermarket meant that they would
never return (Green et al. 2003).
Since the literature did not provide adequate explanation of
what factors would influence a consumer to return to a food service
outlet where they believed they had contracted an illness, this concept
was simplified for use in the model: consumer agents will not return to
stores where they have become sick in the past.
- 4.16
- Store signals: It is possible for a store to close
temporarily and trigger an investigation from inspectors if it realizes
that there is a problem with its food. For example, during the 2012 XL
Foods E. coli outbreak, a Regina restaurant called
Flip decided to close its doors when five people reported cases of E.
coli, and the only common feature with all five cases was
that they had recently eaten at Flip (CBC
News 2012a). Although the restaurant had recently been
inspected and had passed, the owner voluntarily closed the restaurant
to keep any other customers from becoming sick while the source of the
contamination was determined. This element has been incorporated as a
signalling mechanism, where stores change their colour to communicate
with inspectors that they should be inspected first and so consumers
can avoid that location until the contamination has been rectified.
- 4.17
- Store signals with errors: On occasion, stores with a
suspected problem may choose to ignore it and not close; there is also
the possibility that a store will close unnecessarily. The restaurant
Flip, as mentioned above, closed temporarily to undergo thorough
testing, which found no E. coli present on surfaces
or food samples (CBC News 2012b).
This has been represented in the model by stores signalling with a
small chance of either a false positive or false negative signal. This
allows for less than perfect information in signalling, which reduces
the efficiency of inspections.
- 4.18
- Asymmetric information: This principle is informed by
Akerlof's (1970) work on
asymmetric information in markets. Consumers and inspectors are unable
to tell if a store is contaminated prior to landing on it. An
interesting application of this theory in future models would be to
incorporate signals of quality, such as branding, inspection
certificates, or other quality assurance methods.
- 4.19
- No consumption while sick: Given the typical symptoms
of diarrhoea and vomiting that accompany foodborne illness,
the assumption
that one would stay home and avoid going out to stores or restaurants
seems reasonable. This was also implemented for practical modeling
reasons, as it prevents a consumer from landing on a contaminated store
and becoming sick while already infected from a previous visit.
- 4.20
- Emergence: The important results from
the model are the overall numbers of sick agents, contaminated stores,
inspected stores, and "naïve" agents at the end of the model. Since the
changes between model versions are imposed by changes in the rules that
agents follow, the results are built in and not the result of emergent
behaviour.
- 4.21
- Adaptation/learning: Consumers adapt
their behaviour by updating the list bad-store-patches. If they have
gotten sick from eating at a contaminated store, they add this store to
the list and avoid this patch in the future (even if the store has
since been inspected and it is no longer contaminated). Consumers also
avoid signalling stores.
- 4.22
- Objectives: Consumers want to avoid
getting sick, and this fits into their adaptive behaviour of avoiding
stores that have made them sick in the past. Store patches want to
avoid contamination, and if that is not possible, avoid making
consumers sick by signalling – although this is imposed. An implicit
assumption is that inspectors should inspect efficiently; again, the
different inspection strategies are imposed, rather than allowing the
agents to choose which they prefer.
- 4.23
- Sensing: Inspectors and consumers have
the same sensing capabilities: both types of agent can sense when a
patch is signalling, and they can tell whether a store is contaminated
once they land on it. However, landing on a contaminated store may make
consumers sick, but inspectors can reverse the contaminated variable so
that the store is safe again. Consumers cannot sense whether a patch
has recently been inspected or whether consumers near them are sick.
- 4.24
- Interaction: At this stage, neither
consumers nor inspectors interact with one another directly. Consumers
interact with stores by visiting them (although other consumers may be
present there at the same time) and consuming, and inspectors interact
with stores.
- 4.25
- Stochasticity is used in generating a random number to
determine whether or not the consumer will get sick. Also, if consumers
complete the 'wander' procedure, they determine a heading randomly and
move three patches in that direction. Prediction is not used. There are
no collectives, or "aggregations of agents that affect the state or
behavior of member agents and are affected by their members" (Railsback & Grimm 2012,
p. 41), in the model.
- 4.26
- Observation: The following attributes
are tracked using BehaviorSpace at each time step. This output was then
analyzed in R (version 2.15.1)
- The number of agents that are sick (indicated by brown agents in the model)
- The number of signalling (pink) stores at any one time
- The number of contaminated (orange) stores that inspectors inspect
- The number of stores that stay contaminated (red)
- The number of "naïve" consumers (those that have never gotten sick over the course of the model run, indicated by yellow agents)
Initialization
- 4.27
- Model runs were executed with 2000 consumers, 100 stores,
and 1, 3 or 5 inspectors. The world was set to 33x33, for 1089 total
patches, with a centre origin point. The world wraps both horizontally
and vertically. Each simulation was run for 150 time steps; in earlier
tests that measured runs at every step, the model appeared to stabilize
by the 150 step mark.
- 4.28
- To determine the appropriate number of consumers and
stores, simulations were run at various levels of stores and consumers.
The actual density of food service outlets is about 1 for every 350
Canadians (Statistics Canada 2006).
However, approximating this density in NetLogo would have a prohibitive
time cost; running very large simulations in BehaviorSpace is extremely
slow. To balance the effects of scaling up with the time cost of
running multiple scenarios, 2000 consumers and 100 stores were included
in the model.
- 4.29
- Consumers: All consumers have immune-system set to between
.1 and .5, sick set to 0, heal-counter set to 0, and range set to 5.
The lists destination and bad-store-patches are empty. Consumers are
scattered randomly throughout the world. In future work, consumers will
be made more heterogeneous, but at this point, they are all the same at
the start of the model.
- 4.30
- Patches: 100 patches are selected, and store is set to 1.
All store-patches have the contaminated variable set to 0 at
initialization.
- 4.31
- Inspectors: All inspectors have a range of 10. They are
scattered randomly throughout the world.
- 4.32
- Most of these initial values were estimated, as there is
little empirical data available. No data was incorporated from other
models or external data files.
Submodels
- 4.33
- Consumers: "Healthy" consumers are asked
to complete the consume procedure; consumers that are sick must remain
on their last destination for 3 time steps. The consume procedure
contains two sub-procedures: destination-set and eat. To
destination-set, consumers identify which patches within their range
are stores that are not on the list bad-store-patches (and are not
signalling that they are contaminated, depending on the model version).
They then choose one of these destinations from the patch-set and move
there. If no patches within their range meet the criteria, the consumer
wanders by setting their heading randomly and moving forward three
patches. In the eat procedure, the consumer identifies whether or not
the patch they have landed on is contaminated. If it is contaminated
and the random number generated is less than the consumer's
'immune-system,' the consumer's sick variable changes to 1 from 0 and
the consumer changes its colour to brown, then adds this patch to the
its list bad-store-patches. All consumers execute this code in a random
order. More than one consumer can land on a store at the same time.
- 4.34
- Inspectors: Inspectors are asked to
complete the test procedure. Depending on the model version, the
inspector is instructed to test any signalling (pink) stores within its
range first, since these ones are signalling that they may be
contaminated. Otherwise, the inspector chooses a store within its range
at random and checks it. When the inspector lands on a store that is
contaminated, it changes the store's contaminated variable back to zero
and changes the patch colour from red (or pink, if it was signalling)
to orange. If the patch is not contaminated, the inspector does
nothing.
- 4.35
- Patches: Only patches that are stores
and belong to the agent-set 'store-patches' will be discussed here. All
other patches simply represent empty space. Store patches all start out
green to indicate that they are not contaminated, and one store per
turn is instructed to change its contaminated variable to 1 from 0 and
its colour to red. Agents cannot sense this information prior to
landing on the store, unless the store is pink to signal contamination.
In versions that incorporate signalling, five patches per time step are
instructed to check themselves for contamination. If a selected patch
is contaminated, it signals this to consumers and inspectors by
changing its colour to pink. In the scenario that allows for signals
with errors, the signal procedure incorporates a random floating point
number. If the store is contaminated and the random number is less than
its 'signal-error' variable, the store will not signal even though it
should, and if the patch is not contaminated but the random number is
less than its 'signal-error' variable, the store will signal, even
though it is clean.
Table 2: Model versions Baseline Signal with certainty Signal with errors Consumers Avoid "bad stores" Avoid "bad stores" & signalling stores Avoid "bad stores"& signalling stores Inspectors Test randomly Test signalling stores first; if none in range, test randomly Test signalling stores first; if none in range, test randomly Patches Random contamination Random contamination, up to 5 stores signal per time step Random contamination, up to 5 stores signal per time step (but signals are uncertain)
Analysis
of model results
- 5.1
- Initially, all model scenarios were run with the number of
inspectors ranging from 1-15. The marginal returns of adding additional
inspectors are minimal once there are five inspectors in the model;
therefore, more detailed runs were conducted using 100 repetitions each
of one, three, and five inspectors. Each model run lasted for 150 time
steps and all data was collected at the end of the model run. Analysis
of variance (ANOVA) was conducted to check the statistical significance
of having one, three, and five inspectors for each scenario, and was
followed by post-hoc analysis using pair-wise t-tests, using the
Bonferroni correction to account for multiple comparisons. Unless
otherwise stated, the pairwise analysis results are statistically
significant (p <.001).
- 5.2
- The first scenario is the most simple; inspectors move
randomly from store to store and consumers receive no information
besides whether or not they become ill. The number of sick consumers
declines substantially as the number of inspectors goes up, but with
decreasing marginal returns (see Table 3).
As well, the number of contaminated stores decreases as inspectors are
added, and the number of inspected stores increases, again with
decreasing marginal returns. The decrease in contaminated stores is
likely fueling the declines in the number of sick consumers. Lastly,
the number of naïve consumers increases as there are more inspectors in
the model, but even with five inspectors, only a very small percentage
(1.2%, on average) of the total population never experiences an illness
over the course of the model run.
Table 3: Random Inspection Scenario 1 inspector 3 inspectors 5 inspectors ANOVA Mean SD Mean SD Mean SD F(1,298) p-value Sick Consumers 499.22 38.41 310.21 38.02 227.48 35.36 1807 p<.001 Contaminated Stores 49.02 3.86 26.24 3.06 17.03 2.69 2463 p<.001 Inspected Stores 29.47 3.36 51.97 3.84 60.62 4.09 1947 p<.001 Naïve Consumers 0.91 1.627 8.35 3.83 25.66 10.58 633.2 p<.001 - 5.3
- The next step in advancing the model was to allow five
randomly selected stores per tick to signal. This signalling mechanism
would be similar to a store realizing that there was a problem and
voluntarily closing its doors and inviting in inspectors to help
rectify the issue. In this scenario, signalling information is perfect;
that is, a signal indicates that the store is definitely contaminated.
The results of this scenario are shown in Table 4.
- 5.4
- Since inspectors move first to signalling stores within
their range and consumers avoid these stores, even though very few
stores were self-testing at any given time, the number of sick
consumers was considerably reduced compared to the random inspection
model. The effect of signalling information is profound: outcomes are
better with only one inspector when there is signalling (209.8 sick
consumers, on average), compared to having five inspectors conducting
random inspections (227.48 sick consumers, on average). Inspectors are
also able to control the number of contaminated stores more
effectively, particularly when there are few inspectors. Increasing the
number of inspectors from 3 to 5 shows that the effectiveness of the
signal mechanism is subject to considerable decreasing marginal
returns, likely because the inspectors' ranges begin to overlap and a
signalling store could end up with more than one inspector there at the
same time. In the case of signalling stores, there was no significant
effect in post-hoc testing (p > .05) of
increasing the number of inspectors from three to five, even though the
overall ANOVA results were still significant. The number of naïve
consumers also increases compared to the random inspection scenario,
but even with five inspectors in the model only about 6% of the total
population, on average, avoids becoming ill over the course of the
model run. This is an interesting result; it is possible that the
density of consumers to stores and the frequency of visits are such
that it is nearly impossible for consumers to avoid illness throughout
the simulation. To investigate further, it would be necessary to
measure whether consumers become ill frequently throughout the
simulation, and also to run additional experiments varying the ratio of
consumers to stores.
Table 4: Stores Signal with Certainty 1 inspector 3 inspectors 5 inspectors ANOVA Mean SD Mean SD Mean SD F(1,298) p-value Sick Consumers 209.8 39.24 161.32 30.67 136.63 30.04 231.6 p<.001 Contaminated Stores 20.57 2.55 11.92 2.22 9.21 2.15 883.4 p<.001 Inspected Stores 57.61 3.62 66.16 3.75 68.6 3.97 368.8 p<.001 Naïve Consumers 34.69 11.22 74.39 18.12 120.52 25.61 992.5 p<.001 Signalling Stores 5.09 2.12 0.44 0.61 0.17 0.4 439.5 p<.001 - 5.5
- Finally, a scenario was constructed to investigate the
impact of imperfect information in store signals. This variation on the
stores signal scenario included errors: when stores are selected to
signal whether or not they were contaminated, there is a chance between
1% and 10% that a 'clean' store may signal, or that a contaminated
store may not. In this variation, there were slightly more sick
consumers, on average, compared to the version with perfect signalling
information, as well as slightly higher levels of contaminated stores
and lower levels of inspected stores. However, the difference between
the two scenarios shrinks as more inspectors are added. Once again, in
the case of signalling stores, there was no significant effect of going
from three to five inspectors in post-hoc testing (p
> .05), even though the overall ANOVA results were still
significant. Table 5 shows
the results for the scenario with stores signalling with errors.
Table 5: Stores Signal with Errors 1 inspector 3 inspectors 5 inspectors ANOVA Mean SD Mean SD Mean SD F(1,298) p-value Sick Consumers 223.55 37.37 168.63 26.64 139.81 31.72 327 p<.001 Contaminated Stores 23.58 2.45 13.06 2.11 9.72 2.12 1224 p<.001 Inspected Stores 48.26 4.11 55.55 4.33 58.7 4.31 287.4 p<.001 Naïve Consumers 26.22 8.39 63.04 17.52 103.72 25.21 890.3 p<.001 Signalling Stores 9.1 3.04 0.87 0.97 0.29 0.57 574.1 p<.001 - 5.6
- To check for a significant effect of scenario type while
controlling for the number of inspectors present, analysis of variance
was conducted. Post-hoc analysis using pair-wise t-tests was also
completed. Unless otherwise stated, the pairwise analysis results are
statistically significant (p <.001). The
ANOVA results are reported in Table 6.
Table 6: All three scenarios 1 inspector 3 inspectors 5 inspectors ANOVA ANOVA ANOVA F(2,297) p-value F(2,297) p-value F(2,297) p-value Sick Consumers 1812 p<.001 666 p<.001 252.5 p<.001 Contaminated Stores 2678 p<.001 1013 p<.001 350.1 p<.001 Inspected Stores 1494 p<.001 343.6 p<.001 161.8 p<.001 Naïve Consumers 465.5 p<.001 575.5 p<.001 547.8 p<.001 - 5.7
- The post-hoc analysis showed that as inspectors are added,
the difference between the scenarios shrinks; this is especially true
for the stores signal with certainty and stores signal with errors
scenarios. When there is one inspector, the difference in the number of
sick consumers between stores signalling with certainty and stores
signalling with errors is significant (p <
.05), but with three inspectors, the results are not statistically
significant (p > .05) and with five
inspectors, they are identical (p = 1). As well,
with three inspectors, the difference in the number of contaminated
stores is significant between the stores signal with certainty and
stores signal with errors scenarios (p <
.01), but once there are five inspectors, the results are no longer
significant (p >.05).
- 5.8
- Figure 1 shows the
differences in the number of sick consumers for all three scenarios.
The considerable difference in the number of sick consumers in the
signalling scenarios compared to the random inspection scenario is
clearly shown, as is the diminishing marginal returns of adding
additional inspectors.
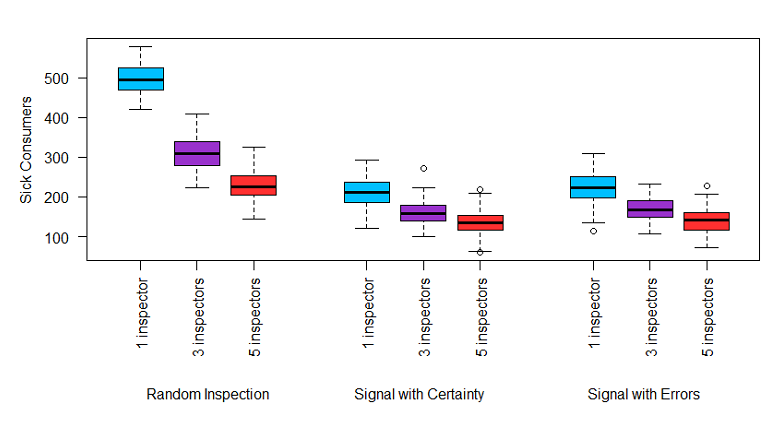
Figure 1. Sick consumers, all scenarios - 5.9
- Figure 2 shows the
number of contaminated stores for all three scenarios. Giving
inspectors more information through signalling, even if that
information is flawed, considerably reduces the number of contaminated
stores.
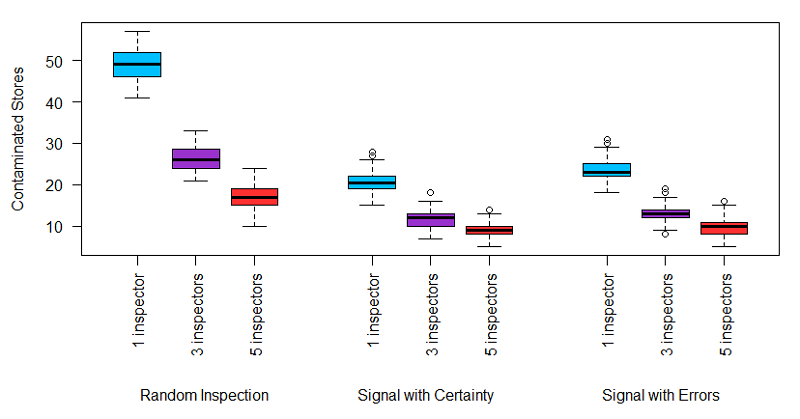
Figure 2. Contaminated stores, all scenarios - 5.10
- Figure 3 shows the
number of inspected stores for all three scenarios. Since in the signal
with errors scenario, some stores are signalling without actually being
contaminated, fewer stores are successfully inspected.
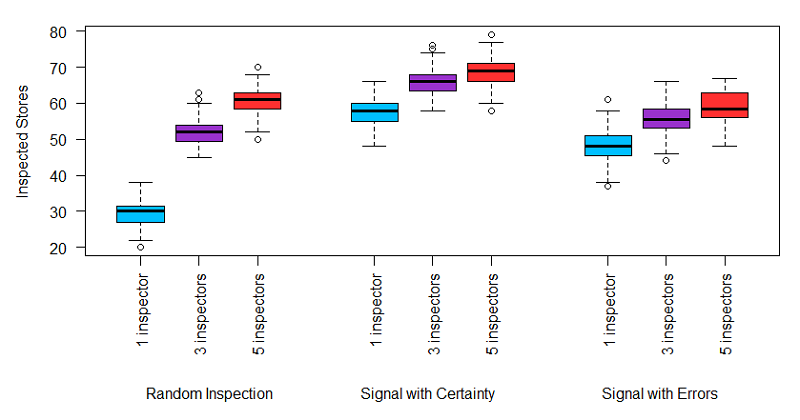
Figure 3. Inspected stores, all scenarios - 5.11
- Finally, Figure 4
shows the number of naïve consumers for all scenarios. Since consumers
avoid stores that are signalling under the assumption that they are
contaminated, fewer consumers become sick over the course of the model
run in the stores signal with certainty scenario. However, when stores
signal with errors, some stores that are contaminated should signal but
do not, which results in slightly more consumers becoming ill at some
point during the model run.
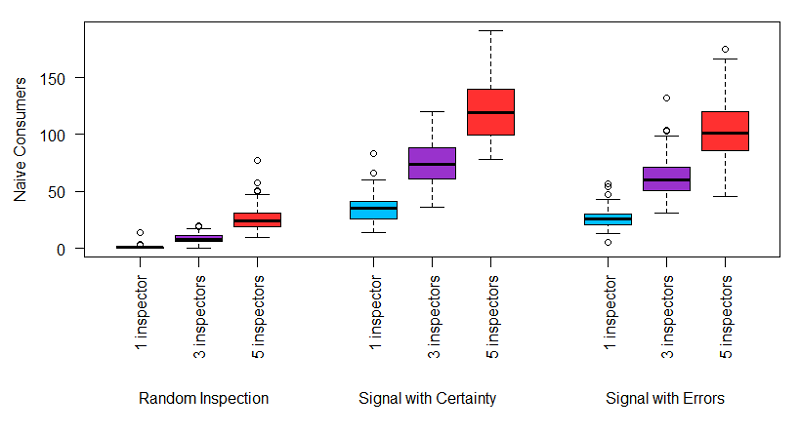
Figure 4. Naive consumers, all scenarios
Discussion
and conclusions
- 6.1
- The above research shows that food safety is a complex
problem, and that ABMs are an interesting way of studying complex
problems. A simple model of a food safety system was presented using
the ODD framework. The model results have a few applications to policy.
Firstly, as stated by Bonabeau (2002)
and Moss (2008), ABMs were
noted as having great potential for policy but had been applied in only
a few situations. This model advances the literature by providing a
model that incorporates inspectors, consumers, and stores into a food
safety simulation. Only a handful of other models have been found in
this area (Bleda & Shackley
2012; Tykhonov et al.
2008; Verwaart
& Valeeva 2011). The model results also show the
effect of giving inspectors and consumers more information: even if the
information provided by stores signalling is uncertain, the outcome of
having one inspector with access to imperfect signalling information
(223.55 sick consumers, on average) is similar to five inspectors using
random inspections (227.48 sick consumers, on average). In the current
climate of government austerity, employing new means of improving
consumer and inspector access to food safety information could improve
outcomes without taxing already thin resources.
- 6.2
- There are a number of avenues for future work using this
model. Namely, the model should be adapted to better take advantage of
the strengths of ABM by incorporating more heterogeneity and complexity
into individual agents. As well, inspection rules that are closer to
the real world system, such as a tiered system of oversight which is
used by the Regional Health Authorities in Saskatchewan and has been
proposed by the CFIA (Canadian
Food Inspection Agency 2012), will be incorporated in future
work, as will the influence of retailer compliance on outcomes. Some
jurisdictions have also made inspection results public, giving
consumers more information with which to make decisions on where to eat
(Filion & Powell 2009;
Simon et al. 2005); the
effect of this information on decision making will be used to inform
future models. Green et al.'s (2003)
work on the social meanings of food choice, the influence of social
norms on decision making, and the role of information in social
networks could be incorporated by including communication between
neighbouring agents to share information on experiences with the safety
of certain food outlets.
- 6.3
- In his work discussing New Public Management, Hood (1991) discusses three sets of core values in public management: sigma (efficiency), theta (fairness), and lamda (robustness). He characterizes sigma values as most closely related to New Public Management, where frugality is the standard of success and waste is the standard of failure. For theta values, the achievement of fairness is the standard of success and unfairness or bias is the standard of failure. Lastly, for lamda values, resilience is the standard of success and catastrophe, risk or breakdown is the standard of failure. These value sets apply to food production systems as well as to public management. In many supply chains, the tendency of business interests is to lean towards sigma values, where efficiency is king. However, as supply chains increase in complexity and change ever more rapidly as more actors are involved in the production and distribution of food, a movement towards greater resilience may be warranted,[10] even as this results in redundancies. As noted by Miller and Page (2007), a certain level of redundancy in complex systems may make them more readily adaptable. The balance of valuing efficiency or resilience is another trade off within the food policy space, as Hensen and Caswell (1999, p. 591) note: "Rather, it is evident that policy is the outcome of a complex trade-off between alternative demands that reflect the interests of the different groups that might be affected. In the case of food policy this will include consumer, food manufacturers, food retailers and farmers, both at home and abroad, as well as government itself and taxpayers. One of the key challenges facing policymakers is to balance these alternative demands because, in many cases, these different groups apply alternative criteria, both when judging the need for food safety regulation, ex ante, and the success/failure of food safety regulation, ex post. Furthermore, these criteria are generally not explicitly stated, with the result that the policy debate lacks coherence and, in some cases, transparency." Complex problems, if they are to be effectively handled by regulatory structures, require transparency and information shared between all stakeholders. Agent-based models that incorporate transparency, accountability and information exchange may be a useful source of insight for accomplishing these objectives.
Acknowledgements
-
The feedback and comments provided by Drs. Peter Phillips and James Nolan on an earlier draft of this paper are acknowledged. This research was supported by a Doctoral Fellowship provided by the Social Sciences and Humanities Research Council of Canada.
Notes
-
1For a
more detailed discussion, see Smith
DeWaal 2003.
2Contamination by chemical hazards or environmental pollution is beyond the scope of this study.
3For a more detailed discussion, see Schlundt 1999.
4Another ABM study looking at compliance and pig farmers is available in Dutch (van Asselt, Osinga, Asselman, & Sterrenburg, 2012).
5NetLogo is available here: https://ccl.northwestern.edu/netlogo/
6View this model in the CoMSES Model Library: https://www.openabm.org/model/4137/version/2/view
7View this model in the CoMSES Model Library: https://www.openabm.org/model/4141/version/2/view
8View this model in the CoMSES Model Library: https://www.openabm.org/model/4139/version/2/view
9One such example that was decided by the courts took place in the United States, where FSIS tried to shut down a processing plant that had exceeded Salmonella counts. The plant refused on the basis that the product had come contaminated from the slaughterhouse, and the plant never failed any sanitation tests. A federal judge ruled that FSIS could not withdraw inspection based on Salmonella counts alone: "The appeals court ruling supports arguments of those who say that pathogen testing results should not be a basis for enforcement actions until scientists can determine what constitutes a unsafe level of Salmonella in ground meat" (Rawson & Becker 2004).
10This sentiment is echoed by Hennessy et al. (2003), who comments that narrow technology development platforms that may not be able to adapt to changes may introduce systemic risk into food production.
References
- AKERLOF, G. (1970). The market
for "lemons": Quality uncertainty and the market mechanism. The
Quarterly Journal of Economics, 84(3),
488–500. [doi:10.2307/1879431]
AXELROD, R. (2003, August). Advancing the Art of Simulation in the Social Sciences. Forthcoming in a special issue on agent-based modeling in the Japanese Journal for Management Information Systems.
BIRK-UROVITZ, E. (2011). The 2008 Canadian Listeriosis Outbreak: A Result of Knowledge Ignored. McMaster University Journal of Medicine, 8(1), 65–67.
BLEDA, M., & Shackley, S. (2012). Simulation modelling as a theory building tool: The formation of risk perceptions. Journal of Artificial Societies and Social Simulation, 15(2).
BONABEAU, E. (2002). Agent-Based Modeling: Methods and Techniques for Simulating Human Systems. Proceedings of the National Academy of Sciences of the United States of America, 99(10), 7280–77287. [doi:10.1073/pnas.082080899]
CANADIAN FOOD INSPECTION AGENCY. (2012, November 5). Improved Food Inspection Model: Proposed Draft. Government of Canada. Retrieved from http://www.inspection.gc.ca/DAM/DAM-aboutcfia-sujetacia/STAGING/text-texte/acco_modernization_modeldraft_1344008567583_eng.pdf. Archived at: http://www.webcitation.org/6NsSKyvXF.
CBC NEWS. (2012a, October 2). Regina eatery voluntarily closes over E. coli worries. CBC News Saskatchewan. Retrieved August 7, 2013, from http://www.cbc.ca/news/canada/saskatchewan/story/2012/10/02/sk-restaurant-concerns-121002.html. Archived at: http://www.webcitation.org/6NsSREYrl.
CBC NEWS. (2012b, October 6). No E. coli found in Regina eatery temporarily closed. CBC News Saskatchewan. Retrieved July 7, 2014, from http://www.cbc.ca/news/canada/saskatchewan/no-e-coli-found-in-regina-eatery-temporarily-closed-1.1284654. Archived at: http://www.webcitation.org/6RdGSFMHN.
CENTERS FOR DISEASE CONTROL AND PREVENTION. (2013a, February 21). BSE (Bovine Spongiform Ecephalopathy, or Mad Cow Disease). Retrieved May 29, 2013, from http://www.cdc.gov/ncidod/dvrd/bse/. Archived at: http://www.webcitation.org/6NsSWhYgy.
CENTERS FOR DISEASE CONTROL AND PREVENTION. (2013b, April 18). CDC Features: Trends in Foodborne Illness in the United States, 2012. Retrieved May 17, 2013, from http://www.cdc.gov/Features/dsFoodNet2012/index.html. Archived at: http://www.webcitation.org/6NsSa6uuw.
CENTERS FOR DISEASE CONTROL AND PREVENTION. (2013c, July 19). Multistate outbreak of hepatitis A virus infections linked to pomegranate seeds from Turkey. Viral hepatitis outbreaks. Retrieved July 19, 2013, from http://www.cdc.gov/hepatitis/Outbreaks/2013/A1b-03-31/. Archived at: http://www.webcitation.org/6NsSdCdk4.
CHOI, J., Nelson, D. C., & Almanza, B. (2011). The impact of inspection reports on consumer behaviour: A pilot study. Food Control, 22, 862–868. [doi:10.1016/j.foodcont.2010.11.007]
EPSTEIN, J. M. (2008). Why Model? Journal of Artificial Societies and Social Simulation, 11(4), 12: https://www.jasss.org/11/4/12.html.
FILION, K., & Powell, D. A. (2009). The use of restaurant inspection disclosure systems as a means of communicating food safety information. Journal of Foodservice, 20, 287–297. [doi:10.1111/j.1748-0159.2009.00151.x]
GERBA, C. P., Rose, J. B., & Haas, C. N. (1996). Sensitive populations: who is at the greatest risk? International Journal of Food Microbiology, 30, 113–123.
GOVERNMENT OF CANADA. (2013, January 20). CFIA At A Glance. Canadian Food Inspection Agency. Retrieved July 11, 2014, from http://www.inspection.gc.ca/about-the-cfia/organizational-information/at-a-glance/eng/1358708199729/1358708306386. Archived at: http://www.webcitation.org/6RdGkoMzy.
GOVERNMENT OF CANADA . (2014, February 25). Restaurant and Food Service Inspection in Canada. Canadian Food Inspection Agency. Retrieved July 11, 2014, from http://www.inspection.gc.ca/food/information-for-consumers/report-a-concern/restaurants-and-food-services/eng/1323139279504/1323140830752. Archived at: http://www.webcitation.org/6RdGozhyB.
GREEN, J., Draper, A., & Dowler, E. (2003). Short cuts to safety: Risk and "rules of thumb" in accounts of food choce. Health, Risk & Society, 5(1), 33–52. [doi:10.1080/1369857031000065998]
GRIMM, V., Berger, U., Deangelis, D. L., Polhill, J. G., Giske, J., & Railsback, S. F. (2010). The ODD protocol: A review and first update. Ecological Modelling, 21, 2760–2768. [doi:10.1016/j.ecolmodel.2010.08.019]
HAVELAAR, A. H., Brul, S., De Jong, A., De Jonge, R., Zwietering, M. H., & H. Ter Kuile, B. (2010). Future challenges to microbial food safety. International Journal of Food Microbiology, 139, S79–S94. [doi:10.1016/j.ijfoodmicro.2009.10.015]
HAVINGA, T. (2006). Private regulation of food safety by supermarkets. Law & Policy, 28(4), 515–533. [doi:10.1111/j.1467-9930.2006.00237.x]
HENNESSY, D. A., Roosen, J., & Jensen, H. H. (2003). Systemic failure in the provision of safe food. Food Policy, 28, 77–96. [doi:10.1016/S0306-9192(03)00003-4]
HENSON, S., & Caswell, J. (1999). Food safety regulation: an overivew of contemporary issues. Food Policy, 24, 589–603. [doi:10.1016/S0306-9192(99)00072-X]
HOOD, C. (1991). A public management for all seasons? Public Administration, 69(Spring), 3–19.
KRAMER, M. N., Coto, D., & Weidner, J. D. (2005). The science of recalls. Meat Science, 71, 158–163. [doi:10.1016/j.meatsci.2005.04.001]
LAMMERDING, A. M., & Paoli, G. M. (1997). Quantitative risk assessment: An emerging tool for emerging foodborne pathogens. Emerging Infectious Diseases, 3(4), 483–487. [doi:10.3201/eid0304.970411]
MACY, M. W., & Willer, R. (2002). From Factors to Actors: Computational Sociology and Agent-Based Modeling. Annual Review of Sociology, 28, 143–166. [doi:10.1146/annurev.soc.28.110601.141117]
MILLER, J. H., & Page, S. E. (2007). Complex adaptive systems: An introduction to computational models of social life. Princeton & Oxford: Princeton University Press.
MOSS, S. (2008). Policy Modelling: Problems and Prospects (No. CPM Report 08-195) (pp. 1–12). Manchester Metropolitan University Business School: Centre for Policy Modelling. Retrieved from http://cfpm.org/cpmrep195.html. Archived at: http://www.webcitation.org/6NsSh90K9.
NESTLE, M. (2010). Safe Food: The Politics of Food Safety (Updated and Expanded.). Berkeley and Los Angeles: University of California Press.
NEWELL, D. G., Koopmans, M., Verhoef, L., Duizer, E., Aidara-Kane, A., Sprong, H., … Kruse, H. (2010). Food-borne diseases – The challenges of 20 years ago still persist while new ones continue to emerge. International Journal of Food Microbiology, 139, S3–S15. [doi:10.1016/j.ijfoodmicro.2010.01.021]
PHILLIPS, P. W. B. (2009). The kaleidoscope of risk analysis: The state of the art 25 years after the Red Book. In Commentary on the proceedings of the 1st International Conference on Risk Assessment. Brussels.
PUBLIC HEALTH AGENCY OF CANADA. (2013, May 9). Estimates of food-borne illness in Canada. Retrieved May 17, 2013, from http://www.phac-aspc.gc.ca/efwd-emoha/efbi-emoa-eng.php. Archived at: http://www.webcitation.org/6NsSjFKJ9.
RAILSBACK, S. F., & Grimm, V. (2012). Agent-Based and Individual-Based Modeling: A Practical Introduction. Princeton, New Jersey: Princeton University Press.
RAWSON, J. M., & Becker, G. S. (2004, August 3). CRS Issue Brief for Congress: Meat and poultry inspection Issues. Congressional Research Service - The Library of Congress.
RICHIARDI, M., Leombruni, R., Saam, N., & Sonnessa, M. (2006). A Common Protocol for Agent-Based Social Simulation. Journal of Artificial Societies and Social Simulation, 9(1): https://www.jasss.org/9/1/15.html.
RITTEL, H. W. J., & Webber, M. M. (1973). Dilemmas in a general theory of planning. Policy Sciences, 4(2), 155–169. [doi:10.1007/BF01405730]
ROCOURT, J., Moy, G., Vierk, K., & Schlundt, J. (2003). The present state of foodborne disease in OECD countries. World Health Organization.
SANDMAN, P. M. (1994). Mass media and environmental risk: Seven principles. Risk: Health, Safety & Environment, 5, 251–260.
SCHLUNT, J.(1999). Principles of food safety risk management. Food Control, 10, 299–302. [doi:10.1016/S0956-7135(99)00050-X]
SIMON, H. A. (1962). The Architecture of Complexity. Proceedings of the American Philosophical Society, 106(6), 467–482.
SIMON, P. A., Leslie, P., Run, G., Jin, G. Z., Reporter, R., Aguirre, A., & Fielding, J. E. (2005). Impact of restaurant hygiene grade cards on foodborne disease hospitalizations in Los Angeles County. Journal of Environmental Health, 67(7), 32–36.
SMITH DE WAAL, C. (2003). Safe food from a consumer perspective. Food Control, 14, 75–79. [doi:10.1016/S0956-7135(02)00114-7]
STATISTICS CANADA. (2006, June 28). Canadians spending more on eating out. Canadian Year Book Overview 2006. Retrieved January 6, 2014, from http://www41.statcan.gc.ca/2006/0163/ceb0163_002-eng.htm. Archived at: http://www.webcitation.org/6NsSmGWyI.
THALER, R., & Sunstein, C. (2008). Nudge: Improving decisions about health, wealth and happiness. New York: Penguin Group.
TVERSKY, A., & Kahneman, D. (1974). Judgment under Uncertainty: Heuristics and Biases. Science, 185(4157), 1124–1131.
TYKHONOV, D., Jonker, C., Meijer, S., & Verwaart, T. (2008). Agent-based simulation of the trust and tracing game for supply chains and networks. Journal of Artificial Societies and Social Simulation, 11(3), 1: https://www.jasss.org/11/3/1.html.
VAN ASSELT, E., Osinga, S., Asselman, M., & Sterrenburg, P. (2012). Agent Based Modeling: het simuleren van nalevingsgedrag. Beleidsonderzoek Online, November 2012, 1–8. doi:10.5553/Beleidsonderzoek.000015
VERBEKE, W., Frewer, L. J., Scholderer, J., & De Brabander, H. F. (2007). Why consumers behave as they do with respect to food safety and risk information. Analytica Chimica Acta, 586, 2–7. [doi:10.1016/j.aca.2006.07.065]
VERWAART, T., & Valeeva, N. I. (2011). An agent-based model of food safety practices adoption. In S. Osinga, G. Janlofstede, & T. Verwaart (Eds.), Emergent Results of Artificial Economics. Berlin: Springer-Verlag.
WALDIE, P. (2013, February 11). EU cracks down after horsemeat found in beef products. The Globe and Mail. Retrieved May 23, 2013, from http://www.theglobeandmail.com/news/world/investigation-over-horse-meat-leads-to-romania-and-poland-as-alleged-sources/article8428028/
WALLS, I., & SCOTT, V. N. (1997). Use of predictive microbiology in microbial food safety risk assessment. International Journal of Food Microbiology, 36, 97–102. [doi:10.1016/S0168-1605(97)01260-9]
YEUNG, R. M. W., & Morris, J. (2001). Food safety risk: Consumer perception and purchase behaviour. British Food Journal, 103(3), 170–186. [doi:10.1108/00070700110386728]