
 Abstract
- If local circumstances can generate local social trends, it follows that global circumstances can generate global trends. Furthermore, modern global circumstances match the conditions used to create artificial evolutionary systems. If it is possible for evolutionary forces to arise in global society, then it is possible that key forces shaping global society are evolutionary in nature. We can experimentally test for the possibility of evolutionary forces in global society by using a multi-agent simulation. This paper presents a simulation programmed to capture the evolutionary prerequisites observed in global society. Trends arising from this simulation are tested against three known trends and three assumed trends arising from global society. The results from this experiment support the hypothesis that a wealth aggregation evolutionary imperative is shaping key trends in global society.
- Keywords:
- Evolution, Economics, Fitness Test, Evolutionary System, Aggregation
Introduction
- 1.1
- If the shape of human society is determined solely by unencumbered individual free-will, no identifiable long-term social trends would exist. Aggregate statistics, such as crime rates, would appear as probability distributions resulting from disconnected individual decisions changed moment to moment and year to year. On the other hand, if peoples' decisions are shaped by circumstance, then long-term social trends will emerge.
- 1.2
- There are many examples of recognisable long-term trends, such as the empirical similarity of violent crime rates throughout many European countries and cities between the years 1200 AD to 2000 AD (Eisner 2003). These trends suggest that circumstance does influence the shape of social trends in countries and cities. This possibility is supported by research in behaviour economics (Ariely 2009). More recently, Turchin, Currie, Turner and Gavrilets (2013) successfully recreated the historical emergence of complex societies in the ancient world by using a multi-agent simulator designed to emphasise two key societal circumstances.
- 1.3
- This paper begins with the premise that globally applied circumstances will generate global trends. One set of shared circumstances arises from the nature of the modern world economy. Specifically, the free-market empowers people, organizations and countries relative to how much wealth they individually possess or otherwise control. Were these conditions to be placed into an artificial evolutionary system, a wealth aggregation fitness test would result. If it is possible for global society to generate evolutionary forces, then modern global society could be under the influence of a global wealth aggregation evolutionary imperative.
- 1.4
- Successful wealth aggregation in a closed system requires wealth to become concentrated in the hands of the successful aggregators. Therefore, the presence of successful wealth aggregation will necessarily result in wealth inequality. The strength of the evolutionary forces will be evidenced by the degree of inequality.
- 1.5
- Wealth aggregation will be revealed by elevated levels of starvation among poorly performing wealth aggregators, especially if this occurs in the presence of abundant food supplies. In addition, a practical disregard for sustainability is predicted to occur because freely available long-lasting goods act to equalize wealth and thus contradict wealth aggregation. Much of the eco-system is predicted to decline as it is increasingly dismantled and converted into the protected individual wealth necessary for wealth aggregation.
- 1.6
- All the situations described above are present in modern society and all are predicted by the presence of a wealth aggregation fitness test. The key role played by the fitness test can be demonstrated by examining fitness tests in established artificial evolutionary systems.
Fitness Tests in Artificial Evolution
- 2.1
- A key characteristic of artificial evolutionary systems is the fitness test. The fitness test determines the primary problem evolutionary processes will solve. In the absence of a fitness test, artificial evolutionary systems default to a self-replication evolutionary imperative (Zykov et al. 2005).
- 2.2
- Hillis (1998) used a number sorting fitness test in his evolutionary system. This empowered his agents relative to how well they sorted numbers. Starting with agents made up of randomly generated computer code, evolutionary processes resulted in number sorters that challenged the best human designed programmes (Johnson 2001, p. 173). In addition, Hillis (1998, pp.146–147) notes:
'One the interesting things about the sorting programs that evolved in my experiment is that I do not understand how they work. I have carefully examined their instruction sequences, but I do not understand them: I have no simpler explanation of how the programs work than the instruction sequence themselves. It may be that the programs are not understandable – that there is no way to break the operation of the program into a hierarchy of understandable parts.'
Hillis' observation concerning the potential power of evolutionary solutions must be balanced by Lipson's (2005, p. 22) observation that, 'evolutionary algorithms do not provide guarantees on solution optimality, and do not always find the optimal solution.' - 2.3
- Lipson (2005) used a mobility fitness test in his evolutionary system. He began by programming the physical characteristics of such things as the rods and actuators necessary to build 'bodies'. He added the raw materials necessary for the agents to evolve programming to control the body. This provided the means for his agents to simultaneously evolve a body and the means to control it. Lipson then created agents randomly made up of these bits and applied a mobility fitness test. The mobility fitness test resulted in agents evolving an increasing ability to move. Lipson physically built some of evolved designs in order to demonstrate that they worked in reality.

Figure 1. Image of robots evolved in Lipson's artificial evolutionary system featuring a mobility fitness test. (Lipson 2005, p. 9)
Global Human Society as an Artificial Evolutionary System
- 3.1
- In society, different people and social organizations are characterized by different behaviour that will result in different levels of success in the world. From a system point of view, this could be described as a closed system populated by agents made up of differing, or random, behaviour.
- 3.2
- While Hillis' agents are rewarded for number sorting and Lipson's agents are rewarded for mobility, people and social organizations in the modern world are rewarded for aggregating wealth. Empowerment through wealth aggregation occurs globally and has a real impact on the distribution of power in society. In modern global society, a lack of economic wealth can and does lead to death. Inside an evolutionary system, empowering individuals through wealth would create a wealth aggregation fitness test.
- 3.3
- On the other hand, hunter/gatherers are empowered according to their ability to utilize renewable resources for the purpose of successfully giving birth to healthy new generations. This evolutionary imperative describes the default evolutionary fitness test of self-replication. If it is possible for global society to act as an evolutionary system, then it is possible that modern global circumstances have caused a wealth aggregation imperative to overpower a self-replication imperative. This possibility forms the hypothesis and describes the characteristics of the multi-agent simulation experiment used to test the hypothesis.
Design of Experiment
-
Hypothesis and Objectives
- 4.1
- The hypothesis is that a wealth aggregation evolutionary imperative is dominant in shaping modern human society. The objectives of the experiment are to use simulation to:
- Determine the degree to which a wealth aggregation evolutionary imperative can generate trends similar to those of global human society.
- Determine the stability of the results when the environment, the agents, and the agents' decisions are changed.
Key Challenges and Solutions
- 4.2
- A major challenge to this work is the lack of historical empirical social data. The experiment needs to simulate thousands of years in order to generate meaningful evolutionary data. However, we have practically no empirical global social data for these time periods. Even basic data, such as world population figures, are estimated.
- 4.3
- Furthermore, even today, there is little data on some major global social trends. For example, research for this paper has uncovered only a vague estimation of global starvation rates. The UN claimed that 58% of all modern human deaths were caused by effects of starvation (Ziegler 2001). However, this 2001 starvation figure appears not have been supported, challenged or followed up by subsequent research. It is possible that a definition of starvation has yet to be established for the purpose of empirical research.
- 4.4
- Another key challenge is that human society has only made one run. In the absence of extensive social data spanning thousands of years, it is unlikely we could ever establish whether society's historical path is 'average' or 'exceptional' based on initial conditions.
- 4.5
- In order to overcome both these challenges, the simulation is designed to capture a wide range of possible new findings and varying assumptions. It can also report on a wide range of social phenomena. However, for the purpose of this paper, the simulator will be restricted to reporting on a few relatively well-established global trends. In addition, assumptions will be minimized by excluding all societal elements not required to test for the predicted social trends.
The Method
- 4.6
- This simulator possesses a simple environment populated by agents with a high degree of behaviour variability. This allows for evolutionary selection to take place. System dynamics are designed to cause two fitness tests to emerge in succession; self-replication and then wealth aggregation.
- 4.7
- 115 unique simulation runs will be generated by changing one or more of three factors: the initial characteristics of the agent sets, the environment, and the agents' subsequent decision-making. The simulation runs are then compared to known and inferred trends in global society.
- 4.8
- To ensure the simulation programming is not intrinsically generating trends, each of the 115 simulation runs are re-run with a single change that alters the nature of the economy from one based on non-renewable resources to one based on renewable resources. The simulations with renewable resources are predicted to display much weaker tendencies of wealth aggregation.
- 4.9
- For the rest of this paper, a 'renewable run' refers to a simulation possessing the characteristics of a renewable economy. A 'non-renewable run' refers to a simulation possessing the characteristics of a non-renewable economy.
The Design of Simulation
- 4.10
- There are three main parts to this simulation: environment, agents, and system control.
Environment
- 4.11
- The environment is made up of patches described by four variables. Two variables, wants and needs, represent non-renewable and renewable resources respectively. These two resources are each covered by an additional variable representing resistance to harvesting. These four variables are randomly generated from a user defined range during the setup.
- 4.12
- The agents consume the same amount of needs in each iteration. If an agent does not possess this minimum level of needs, that agent will 'die' of starvation.
- 4.13
- Wants empower agents' ability to harvest in proportion to how many wants are possessed and utilized. An agent's stock of wants is diminished in proportion to its utilization. Crucially, wants empower agents relative to other agents in proportion to an agent's possession of wants. This is predicted to cause a wealth aggregation fitness test to emerge in the system.
- 4.14
- After the 1700th iteration, the agents are able to obtain wants in one of two ways. In the non-renewable economies, wants can be only harvested directly from the environment. In renewable economies, wants can only be obtained by converting needs into wants. During these experiments, all agents are restricted to only one means of obtaining wants for the duration of each run. This ensures a clear distinction between non-renewable and renewable runs.
Agents
- 4.15
- With the exception of four user set global variables, an agent's behaviour is defined by variables that are randomly generated on initiation. Once the simulator is running, new agents inherit these variables from their parents. Inheritance facilitates evolutionary selection. These variables can be 'mutated' allowing the possibility for new potential to appear in the system. All aspects of agents' behaviour are influenced by inherited variables.
- 4.16
- The full list of agent variables is available in Appendix C. The design of the 'mutation' process is explained in Appendix E. An iteration of agent behaviour can be seen in the flow chart below.
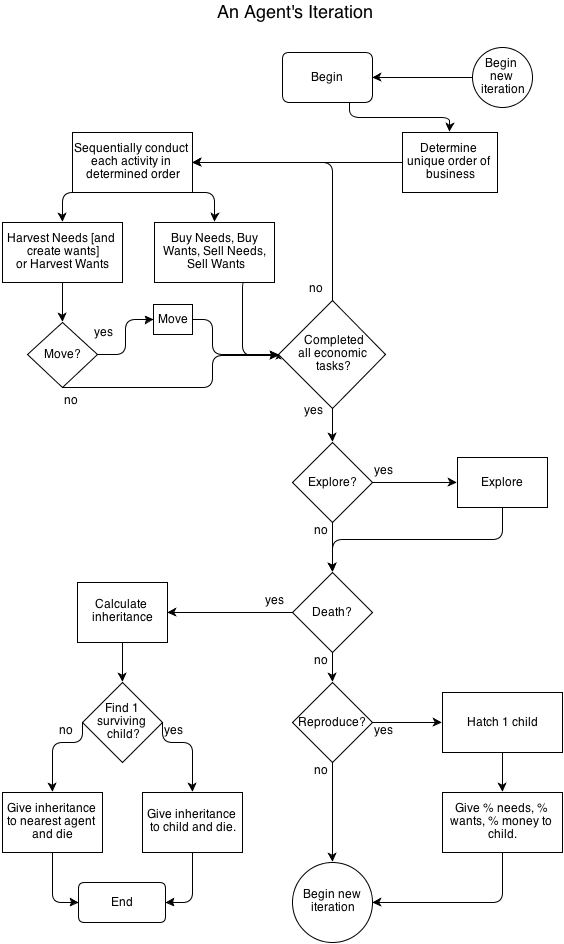
Figure 2. Flow chart for an agent's iteration. System Control
- 4.17
- All the runs are initiated with 1,100 agents possessing randomly generated characteristics. Trading is enabled on the 700th iteration. This allows agents to establish their trading behaviour before wants appear in the system. The process of trading is explained in Appendix F.
- 4.18
- For non-renewable runs, the choice to harvest wants is introduced to 15 random agents on the 1700th iteration. This allows the system to slowly adapt to what is a radical change of behaviour. If all agents are simultaneously introduced to want harvesting, the system tends to experience a drastic population decline, sometimes to the point of extinction.
- 4.19
- In renewable runs, agents are able to convert needs into wants at a ratio of 10 needs into 3 wants. This ability is initiated in 15 random agents on the 1700th iteration. The manner in which agents obtain wants is the only difference between renewable and non-renewable runs.
- 4.20
- In these simulations, a want economy cannot appear before the 1700th iteration. However, in this simulation it is possible for the want economy to remain dormant for thousands of iterations after the 1700th before becoming dominant.
Reproducing the Experiments
- 4.21
- To facilitate the exact reproduction of all the experiments referred to in this paper, random number generator seeds are used to control three factors: the generation of agent sets, the environment, and the initial state of agents' decision-making. Each of 115 simulation runs features a unique combination of these three factors and this combination is subsequently used to identify each unique run. Each unique combination is run twice; once as a renewable economy and once as a non-renewable economy.
- 4.22
- These experiments were run on NetLogo version 5.0.4 (Wilensky 1999) using the Societal Simulator v203.
- 4.23
- This model can be downloaded here: http://www.openabm.org/model/3960/version/1/view
The Experiment's Benchmarks: Global Society's Trends
- 4.24
- The simulator will be tested against three known global trends and three presumed trends. The known trends are population, per capita oil extraction, and the Gini coefficient. The three presumed trends are starvation, per capita food supply and life span. Except for population and per capita oil extraction, historical charts are not available. Therefore, the experimental goal is to determine the extent to which all six trends emerge when a wealth aggregation fitness test is invoked.
World population
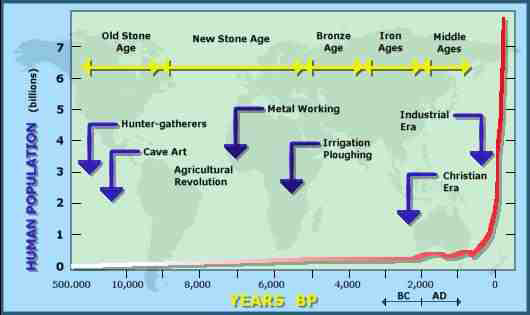
Figure 3. The world's estimated historical population (University of Michigan 2013). - 4.25
- For thousands of years before the industrial revolution, the population remained within a relatively narrow band. Once the industrial revolution began, the population dramatically increased.
Per Capita Oil Production
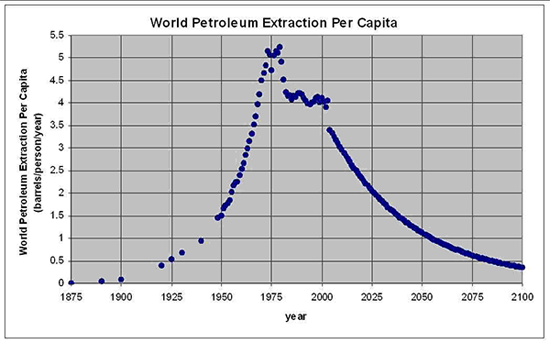
Figure 4. World Petroleum Extraction Per Capita (Roper 2013). - 4.26
- Significant oil production is a recent phenomenon, lasting only about 100 years before peaking. It is the dominant non-renewable energy source in modern society. Note that everything past 2010 is presumed data. Matching the trend succeeds if the simulator's per capita extraction significantly elevates and peaks while the population continues to grow.
World Gini Coefficient
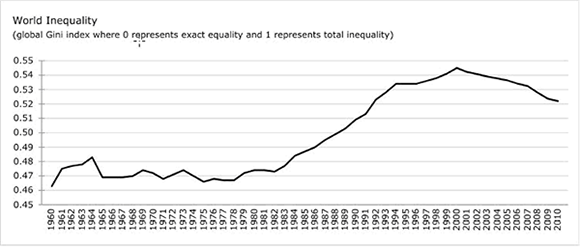
Figure 5. World Gini curve from 1960 to 2010 (Milanovic 2005, pp. 180–81). - 4.27
- Milanovic (2012, p.8 footnote) says, 'Our knowledge of the long-run evolution of global inequality is indeed very tentative, as far as its exact levels are concerned, but very clear as far as broad tendencies since the mid-19th century: the Industrial Revolution, by creating a massive divergence between the rich Western countries and the rest of the world, has pushed global inequality up.' A successful match is an elevated Gini Coefficient while the non-renewable economy is dominant.
- 4.28
- The act of wealth aggregation in a closed system, such as the world economy, is equivalent to wealth concentration. Therefore, successful wealth aggregation will necessarily create inequality. This relationship allows us to use the Gini coefficient as an indication of the presence and strength of wealth aggregation forces in the system.
Starvation Statistics
- 4.29
- A search failed to locate robust research on world starvation rates. Regardless, we can infer that modern society has a starvation problem. In spite of the presence of abundant food supplies, at least 1 in 8 people in the global community are malnourished (FAO 2012). In addition, the nature and frequency of world-wide charity drives is evidence of continuing starvation crises. Therefore, the simulator will be examined for evidence of elevated starvation.
Per Capita Food Supply
- 4.30
- A successful non-renewable economy is predicted to increase the per capita food supply because of increased productive capacity. Per capita food supply is required in order to create the context for starvation. A rise in starvation while the food supply is dropping is not remarkable. However, rising starving in the presence of a rising food supply necessarily indicates aggregation activity.
Life Span
- 4.31
- In the absence of medicine and disease, the shift from a self-replication evolutionary imperative to a wealth aggregation evolutionary imperative is predicted to cause the population's average life span to drop (because an aggregation imperative chooses aggregation over everything else, including life). This is frequently the first chart to respond to changing fitness tests in the system.
The Simulation's Corresponding Charts
- 4.32
- The main presentation of the simulation charts is seen below:
A) B) C) 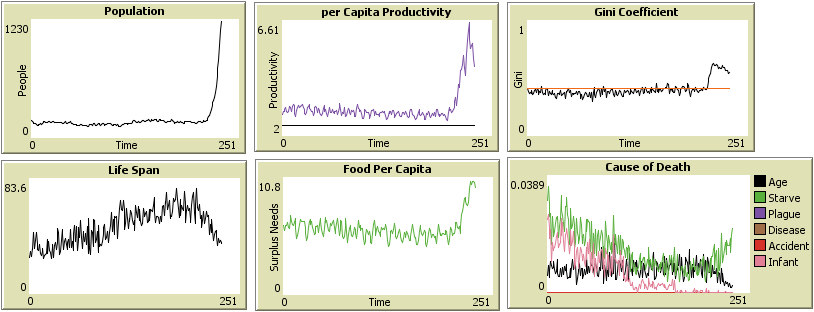
D) E) F) Figure 6. A) population, B) per Capita Productivity, C) Gini Coefficient, D) Life Span, E) Food per Capita, F) Cause of Death charts for the simulation run with random seed settings: agent set 590, environment 580, agent behaviour 0. Notes for figure 6:
- The Random Seed Settings indicate the seed settings for the random number generators controlling the creation of the agent set, the environment, and the decision making of the agents respectively. See the 'Reproducing the Experiments' section.
- The per Capita Productivity takes the sum of the harvest of wants and needs and divides it by the population. In non-renewable runs, testing indicates that once the baseline needs harvest is established (the only harvest measured in the first 1700 iterations), everything above that line can be considered want harvesting. Because oil is such a dominant energy source in modern society, the want harvesting is considered to be broadly analogous to oil harvesting. In renewable runs, only need harvesting is measured. Therefore, this chart cannot be used for comparison between renewable and non-renewable runs.
- The Gini Coefficient is a standard economic tool used to determine the fairness of distribution in an economic system. 0 is totally fair (or equal) and 1 is totally unfair (or unequal). The lower the line, the more equal the wealth distribution.
- Life Span is the sum of all the ages of the agents that have died during an iteration divided by the number that died.
- Food per Capita takes the sum of all the needs possessed by all the agents and divides it by the number of agents.
- The Cause of Death chart features old age (the black line) and starvation (the green line). These are the only possible causes of death in these simulations. 'Old age' was set to 75 iterations for these runs, after which the probability of death from old age is tested at 1 in 10 in each iteration. The pink line indicates the percentage of 'children' who starved to death. Child starvation is included in the main starvation figure represented by the green line. The death rates are calculated by dividing the number of deaths arising from a particular cause by the population.
- The charts were set to write every 10 iterations for these runs. An approximate number of iterations can be determined from the charts by multiplying the indicated number by 10 and adding 100. The first 100 iterations are left uncharted in order to allow the simulation to settle down. Omitting the initial chart oscillations facilitates more readable charts.
- 4.33
- Three additional charts will be included in order to better understand simulation trends. One is the stock of unharvested non-renewable reserves (wants):
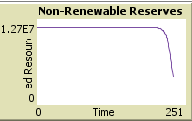
Figure 7. Non-renewable reserves for the simulation run with random seed settings: agent set 590, environment 580, agent behaviour 0 - 4.34
- Finally, two charts called Trading Culture 1 and Trading Culture 2 are used to confirm the presence of aggregation evolutionary selection taking place in the simulation.
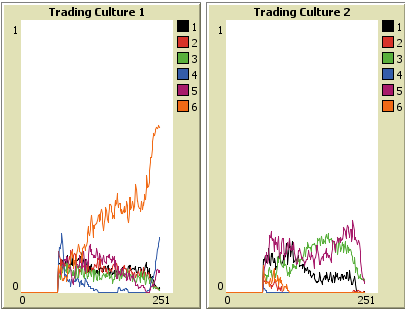
A) B) Figure 8. A) Trading Culture 1 and B) Trading Culture 2 charts for the simulation run with random seed settings: agent set 590, environment 580, agent behaviour 0 - 4.35
- The Trading Culture charts track agents by the order in which they execute five economic operations: harvest, buy needs, buy wants, sell needs, sell wants. There are six combinations of these five operations available to the agents. For example, the graphed line labelled '1' in both charts is attributed to this order: harvest, buy needs, buy wants, sell needs, sell wants. The graphed line labelled '6' in both charts is attributed to this order: sell needs, sell wants, harvest, buy needs, buy wants.
- 4.36
- The manner in which the harvest is undertaken describes the difference between Trading Culture 1 agents and Trading Culture 2 agents. Trading Culture 1 agents have evolved to harvest in a manner that favours wants while Trading Culture 2 agents favour needs. The specifics are as follows: All agents have evolved savings levels for both needs and wants. After the 1700th iteration, any agent will choose to harvest needs if its possession of needs is below its savings level. Any agent will choose to harvest wants if its wants is below its savings level and its needs is above its savings level. Behaviour diverges when possession of wants and needs both exceed the savings levels of an agent. In this case, agents that have evolved to continue harvesting wants are classified as Trading Culture 1. Agents that have evolved to continue harvesting needs are classified as Trading Culture 2. In effect, Trading Culture 1 agents have an insatiable appetite for wants. This makes this class of agents an intrinsically better want aggregation agent than a Trading Culture 2 agent. This is the only difference between Trading Culture 1 agents and Trading Culture 2 agents.
- 4.37
- Each line in these graphs represents the percentage of the population that chooses a particular order and a particular habit of harvesting. The sum of the percentages of the twelve lines from both graphs is 100% at all times.
Satisfying the Hypothesis
- 4.38
- The hypothesis succeeds if the non-renewable runs tend to exhibit the six trends indicated as experimental benchmarks while the renewable runs avoid trends indicating a wealth aggregation imperative.
Satisfying the Null Hypothesis
- 4.39
- The null hypothesis succeeds if:
- The non-renewable runs persistently fail to exhibit the benchmark trends.
or - The renewable runs persistently generate tends indicating the presence of a wealth aggregation imperative.
Number of Simulation Runs
Non-renewable runs: 115
Renewable runs: 115
Total Runs: 230 - The non-renewable runs persistently fail to exhibit the benchmark trends.
Results
- 5.1
- The results for each individual run is listed in Appendix A.
Aggregate Results from Non-Renewable Runs
- 5.2
- 100% of the runs exhibit the following experimental benchmark trends:
- rising population
- sharp rise in per capita productivity
- increased Gini coefficient
- increased starvation
- increased food supply
- decline in life span
Conclusion
- 5.3
- The behaviour of 115 non-renewable simulation runs supports the hypothesis and satisfies the 1st experimental objective.
Stability Test Results
- 5.4
- Each simulation run was initiated using a unique combination of agent sets, environment, and agent's decision-making. Settings for each of these three groups were sometimes held the same in order to test the effect of changing each group in isolation. None of the three groups exhibited undue influence (see Appendix A).
- 5.5
- The following chart lists the total number of unique settings used in each of the following groups: agent sets, environment, and agents' decision-making.
Table 1: Unique random generator seed settings for each category. Random Generator Seed Number of unique settings Agent Sets 32 Environment 40 Agents' Decision Making 47 - 5.6
- 100% of the simulation runs exhibited the benchmark trends predicted by the hypothesis. Therefore, altering the agent sets, the environment, or agents' decision-making did not prevent the predicted tendencies from appearing.
Conclusion
- 5.7
- The predicted tendencies are robust and support the hypothesis. This satisfies the 2nd experimental objective.
- 5.8
- Two examples of typical non-renewable runs:
A) B) C) 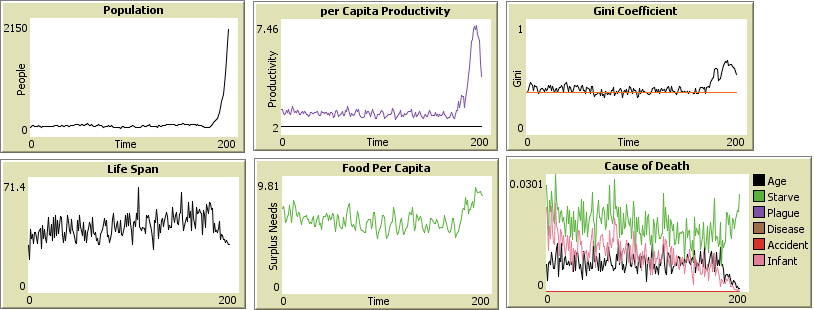
D) E) F) Figure 9. A) Population, B) per Capita Productivity, C) Gini Coefficient, D) Life Span, E) Food per Capita, F) Cause of Death charts for the following random seed settings: agent set 2, environment 1, agent behaviour off. A) B) C) 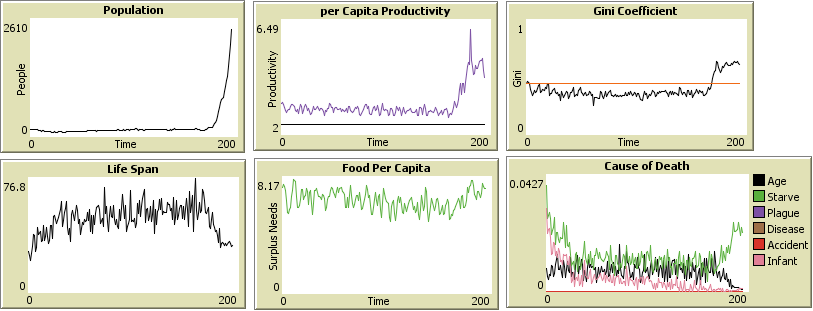
D) E) F) Figure 10. A) Population, B) per Capita Productivity, C) Gini Coefficient, D) Life Span, E) Food per Capita, F) Cause of Death charts for the following random seed settings: agent set 9, environment 3, agent behaviour 30 Aggregate Results from Renewable Runs
- 5.9
- Testing for the presence of key indicators of a wealth aggregation imperative:
- 10.4% exhibit an increasing Gini coefficient.
- 5.2% exhibit an increasing Gini coefficient, increasing food supply, and increasing starvation.
Conclusions
- 5.10
- Renewable simulation runs fail to consistently exhibit the predicted effects of wealth aggregation. This supports the hypothesis.
- 5.11
- The following are two typical renewable runs:
A) B) C) 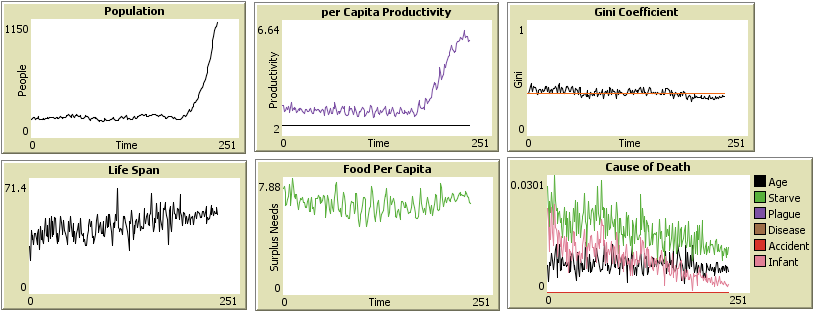
D E) F) Figure 11. A) Population, B) per Capita Productivity, C) Gini Coefficient, D) Life Span, E) Food per Capita, F) Cause of Death charts for the following random seed settings: agent set 2, environment 1, agent behaviour off. Renewable run. A B) C) 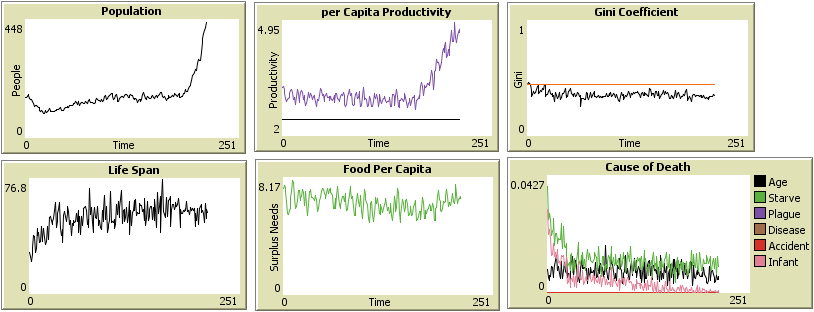
D) E) F) Figure 12. A) Population, B) per Capita Productivity, C) Gini Coefficient, D) Life Span, E) Food per Capita, F) Cause of Death charts for the following random seed settings: agent set 9, environment 3, agent behaviour 30. Renewable run. Examining Extreme Behaviour in Non-Renewable Runs
- 5.12
- Two elements significantly impact the shape of the non-renewable runs. One is the 'burn rate' of the non-renewable resources. If a non-renewable population use up the wants relatively slowly, the population rise will be atypically large. The simulation population was 6036 when stopped.
A) B) C) 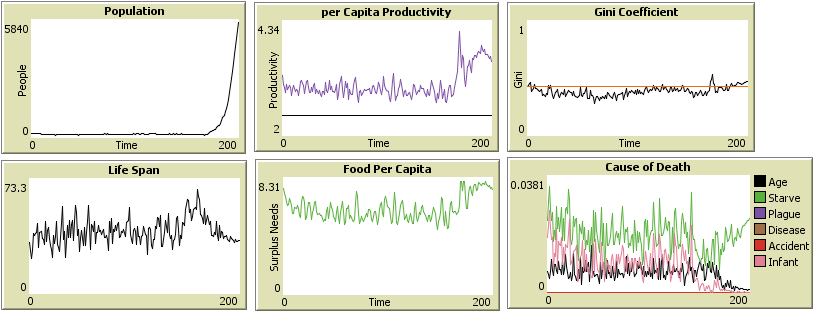
D) E) F) Figure 13. A) Population, B) per Capita Productivity, C) Gini Coefficient, D) Life Span, E) Food per Capita, F) Cause of Death charts for the following random seed setting: agent set 9, environment 2, agent behaviour off. 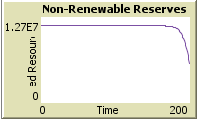
Figure 14. Non-renewable reserves for the following random seed setting: agent set 9, environment 2, agent behaviour off. Initial want stock level: 11,501,893 - 5.13
- Note that even though the per Capita Productivity has peaked, there are significant quantities of wants left to harvest.
- 5.14
- An additional effect of the slow 'burn' of wants is a relatively small Gini coefficient increase. This indicates the aggregation imperative is weak in this system. This is supported by the relatively small impact on the life span and starvation rates. It should be noted that the sudden drop in starvation and corresponding rise in life span evident in these charts occurred before the 1700th iteration.
- 5.15
- If using wants relatively slowly causes a large population increase, it follows that consuming wants quickly will tend to stunt the population growth. The simulation population was 677 when stopped.
A) B) C) 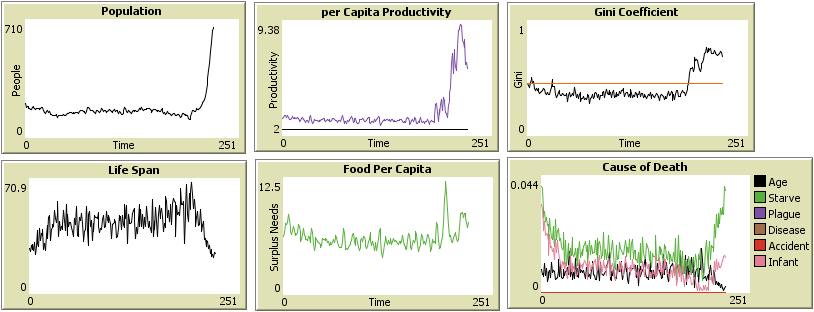
D) E) F) Figure 15. A) Population, B) per Capita Productivity, C) Gini Coefficient, D) Life Span, E) Food per Capita, F) Cause of Death charts for the following random seed setting: agent set 9, environment 18, agent behaviour off. 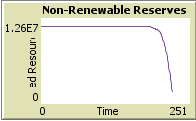
Figure 16. Non-renewable reserves for the following random seed setting: agent set 9, environment 2, agent behaviour off. Initial want stock level: 11,469,449 - 5.16
- Notice there is little non-renewable resource left to harvest. Also, the rapid use of non-renewable resources result in a relatively high Gini-coefficient, high starvation, and a rapid per Capita Productivity peak.
- 5.17
- 'Culture' is the second element that impacts the system. During typical non-renewable runs, a single 'culture' appears to rise up and dominate its environment. The simulation population was 1618 when stopped.
A) B) C) 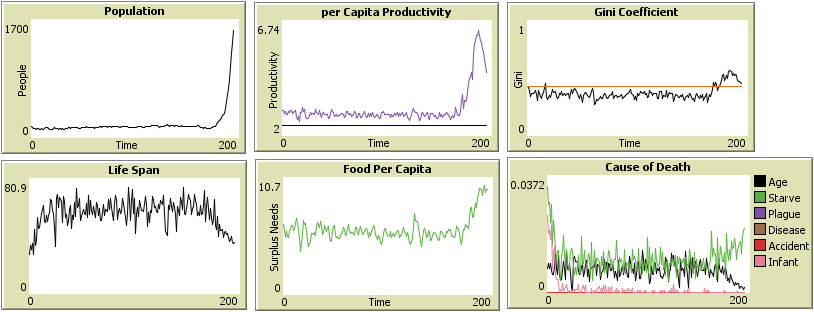
D) E) F) Figure 17. A) Population, B) per Capita Productivity, C) Gini Coefficient, D) Life Span, E) Food per Capita, F) Cause of Death charts for the following random seed setting: agent set 550, environment 550, agent behaviour 0. 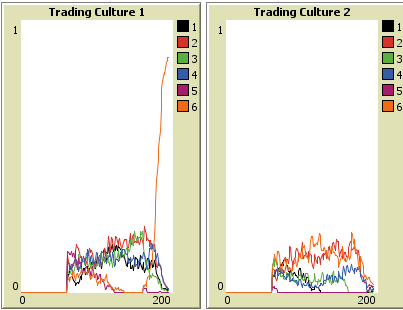
A) B) Figure 18. A) Trading Culture 1 and B) Trading Culture 2 charts for the following random seed setting: agent set 550, environment 550, agent behaviour 0. - 5.18
- When a single culture dominates, the resulting charts tend to be smooth and the population tends to rise with more vigour. On the other hand, when two or more 'cultures' are struggling for dominance, the resulting charts tend to become relatively jagged and the growth processes become inefficient. The simulation population was 513 when stopped.
A) B) C) 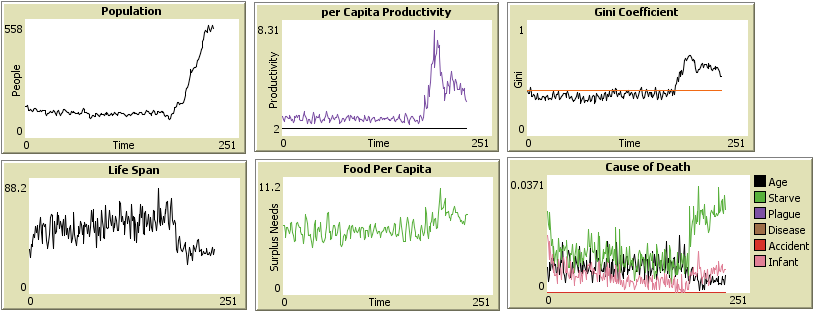
D) E) F) Figure 19. A) Population, B) per Capita Productivity, C) Gini Coefficient, D) Life Span, E) Food per Capita, F) Cause of Death charts for the following random seed setting: agent set 4, environment 1, agent behaviour off. 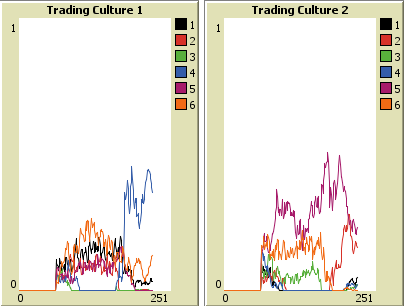
A) B) Figure 20. A) Trading Culture 1 and B) Trading Culture 2 charts for the following random seed setting: agent set 4, environment 1, agent behaviour off. - 5.19
- The population curve exhibits a relatively shallow slope and follows a wobbly progression. In the 'culture' charts you can see various 'cultures' struggling for dominance.
- 5.20
- In the following run, there are two cultures struggling for dominance – culture 1 and 6 in the Trading Culture 1 chart. When culture 1 overtakes culture 6, a distinctive kink appears in the population curve. The simulation population was 578 when stopped.
A B) C) 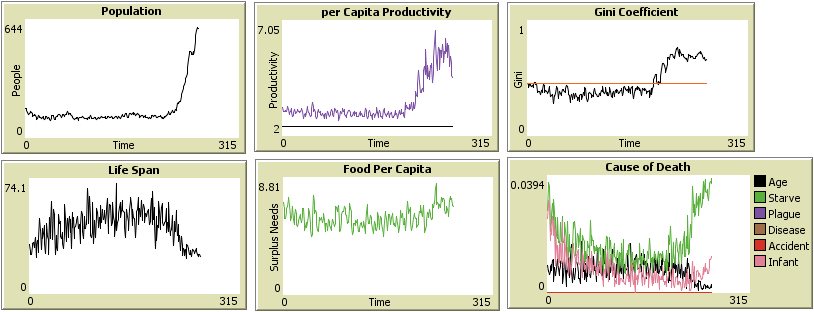
D) E) F) Figure 21. A) Population, B) per Capita Productivity, C) Gini Coefficient, D) Life Span, E) Food per Capita, F) Cause of Death charts for the following random seed setting: agent set 9, environment 20, agent behaviour off. 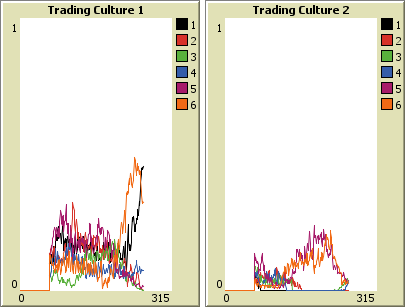
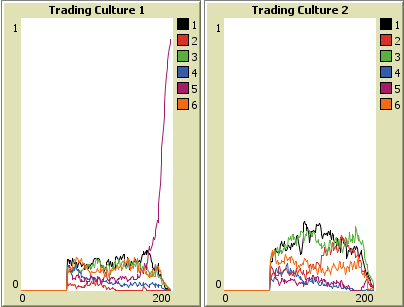
A) B) Figure 22. A) Trading Culture 1 and B) Trading Culture 2 charts for the following random seed setting: agent set 9, environment 20, agent behaviour off. - 5.21
- The non-renewable run that looks the least like human society features strongly competing 'cultures'. In the run below, the Gini coefficient indicates that the wealth aggregation imperative is rising and falling chaotically. The population fluctuates. The overall result is a weak and somewhat chaotic population growth that does not closely match the human population curve. It only just manages to capture the tendency of a rising population. Notice also that Trading Culture 2 agents remain prominent in this non-renewable run. This may be an example of an evolutionary system failing to find the optimal solution.
A) B) C) 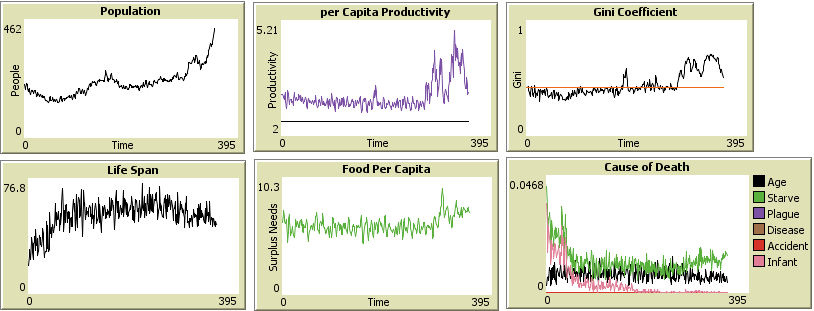
D) E) F) Figure 23. A) Population, B) per Capita Productivity, C) Gini Coefficient, D) Life Span, E) Food per Capita, F) Cause of Death charts for the following random seed setting: agent set 9, environment 3, agent behaviour 130. 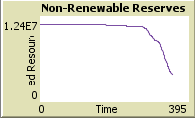
Figure 24. Non-renewables Reserves for the following random seed setting: agent set 9, environment 3, agent behaviour 130. 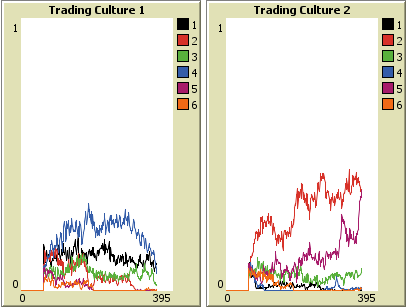
A) B) Figure 25. A) Trading Culture 1 and B) Trading Culture 2 charts for the following random seed setting: agent set 9, environment 3, agent behaviour 130. Examining Renewable Runs Exhibiting Wealth Aggregation
- 5.22
- The following two sets of graphs demonstrate the strongest Gini coefficient rise exhibited by any of the renewable runs.
A) B) C) 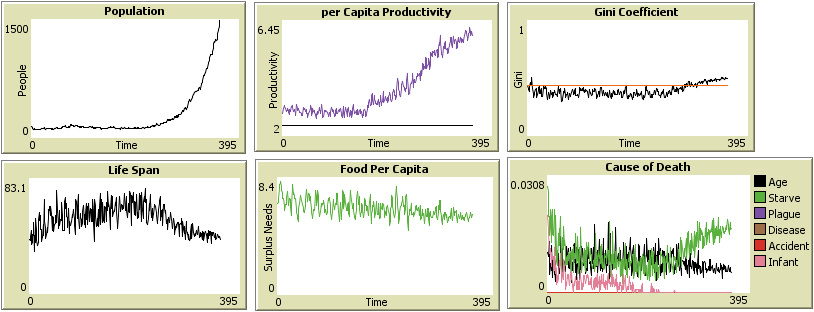
D) E) F) Figure 26. A) Population, B) per Capita Productivity, C) Gini Coefficient, D) Life Span, E) Food per Capita, F) Cause of Death charts for the following random seed setting: agent set 600, environment 600, agent behaviour 0. Renewable run. 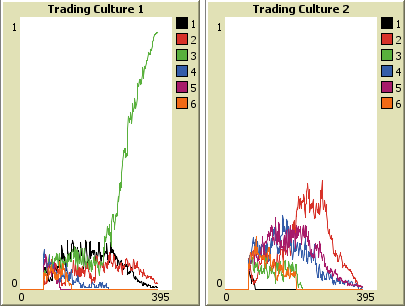
A) B) Figure 27. A) Trading Culture 1 and B) Trading Culture 2 charts for the following random seed setting: agent set 600, environment 600, agent behaviour 0. Renewable run. A) B) C) 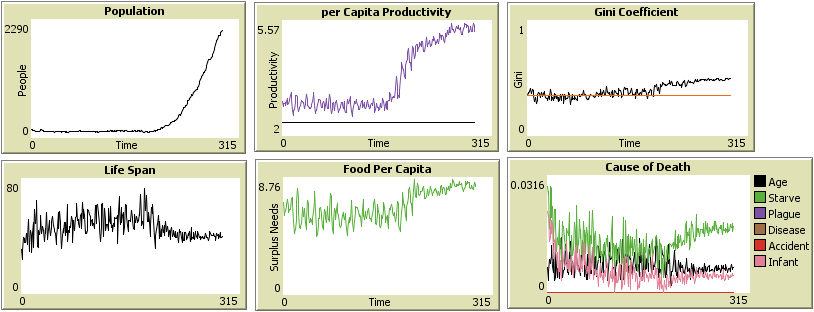
D) E) F) Figure 28. A) Population, B) per Capita Productivity, C) Gini Coefficient, D) Life Span, E) Food per Capita, F) Cause of Death charts for the following random seed setting: agent set 9, environment 3, agent behaviour 31. Renewable run. 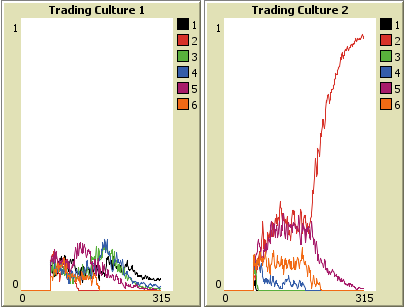
A) B) Figure 29. A) Trading Culture 1 and B) Trading Culture 2 charts for the following random seed setting: agent set 9, environment 3, agent behaviour 31. Renewable run. - 5.23
- The precise factor(s) causing the relatively strong expression of the wealth aggregation imperative in these renewable runs is unknown. It is interesting to note that both these runs experience a single 'culture' dominating the environment once the renewable want economy is activated. It is possible that the newly dominating 'culture' possess characteristics leading to a naturally higher Gini coefficient than the 'cultures' it replaces. This is suggested by the fact that the rise of the Gini coefficient tends to match the rise of the dominant culture.
Testing the Simulation Integrity
- 5.24
- It is important to ensure that the programming used to allow the agent to harvest wants past the 1700th iteration is not intrinsically generating the benchmark trends. This possibility can be explored by examining trends generated by agents with active want harvesting code in absence of non-renewable resources.
- 5.25
- The following simulation is run to 6000 iterations. Only agents possessing want harvesting codes remain in the post non-renewable economy. However, these agents possess no wants after 3000 iterations. Therefore, a wealth aggregation imperative cannot be operating in this timeframe. It can be observed that all the charts have returned to near the original base lines. Therefore, it can be concluded that the programming used to facilitate want harvesting is not intrinsically creating the benchmark trends.
A) B) C) 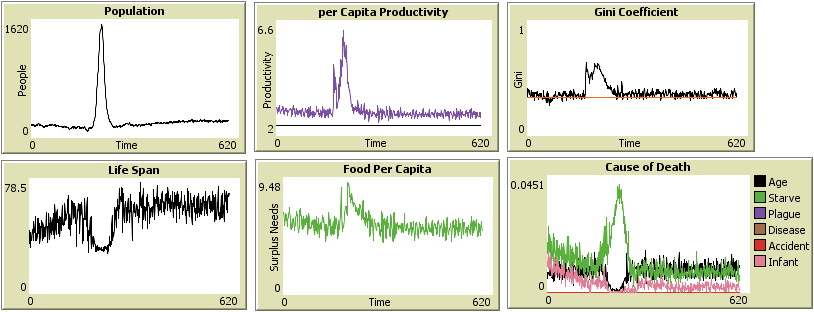
D) E) F) Figure 30. A) Population, B) per Capita Productivity, C) Gini Coefficient, D) Life Span, E) Food per Capita, F) Cause of Death charts for the following random seed setting: agent set 9, environment 15, agent behaviour off. 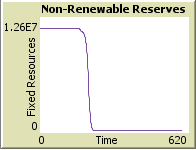
Figure 31. Non-Renewable Reserves for the following random seed setting: agent set 9, environment 15, agent behaviour off. 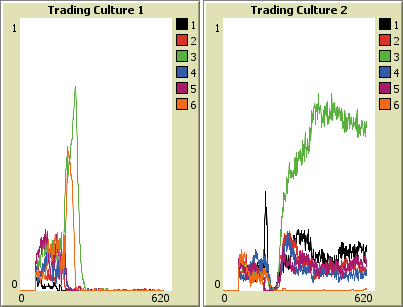
A) B) Figure 32. A) Trading Culture 1 and B) Trading Culture 2 charts for the following random seed setting: agent set 9, environment 15, agent behaviour off. - 5.26
- It is also important to establish whether wealth aggregation forces are actually present in the simulation. Evidence for the aggregation forces can be found by examining the 'Trading Culture' charts. If wealth aggregators are being selected by an evolutionary fitness test, then a rise in the Gini-coefficient should tend to coincide with the rise of Trading Culture 1 agents. This is because agents in Trading Culture 1 are intrinsically better wealth aggregators than those belonging to Trading Culture 2.
- 89.6% of the non-renewable runs saw Trading Culture 1 dominate the system during the growth of the want economy.
- 2.6% of the non-renewable runs saw Trading Culture 2 dominate the system during the growth of the want economy.
- 7.8% of the non-renewable runs saw a mix of cultures in the system during the growth of the want economy.
- 5.27
- In renewable runs, there are no wants to harvest. Therefore, there are no differences between the behaviour of Trading Culture 1 and Trading Culture 2 agents in renewable runs. As such, the hypothesis predicts a more even distribution of 'Trading Cultures' in renewable runs.
- 37.4% of the renewable runs saw Trading Culture 1 dominate the system during the growth of the want economy.
- 32.3% of the renewable runs saw Trading Culture 2 dominate the system during the growth of the want economy.
- 30.3% saw a mix of cultures in the system during the growth of the want economy.
- 5.28
- Below are two examples of agents from Trading Culture 1 exerting their dominance during the rise of non-renewable economies:
A) B) Figure 33. A) Trading Culture 1 and B) Trading Culture 2 charts for the following random seed setting: agent set 540, environment 530, agent behaviour 0. 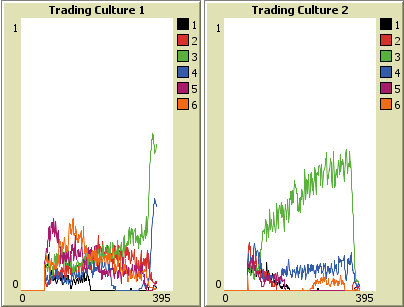
A) B) Figure 34. A) Trading Culture 1 and B) Trading Culture 2 charts for the following random seed setting: agent set 9, environment 3, agent behaviour 36.
Final Comments
- 6.1
- The experimental results provide strong support for the hypothesis. Even in the face of changing agent sets, changing environments, and changing decision-making, the simulated trends remain robust and continue to match trends established by modern society.
- 6.2
- Consider some of the most serious problems facing humanity today. Global society has experienced high levels of starvation in the presence of abundant food (FAO 2012). The world is experiencing a rapidly declining eco-system (UNEP 2012). Wealth inequality is intensifying in many of our most advanced countries in spite of empirical evidence that this harms society at all levels (Wilkinson 1996). As has been widely reported, the presence of habit-created diseases, such as obesity, is intensifying in many modern countries. Decades after the first warnings were made public there have been no serious attempts to counter the possibility of man-made climate change. All these events are progressing exactly as a wealth aggregation hypothesis predicts.
- 6.3
- The hypothesis suggests that in order to make real progress in creating a sustainable and prosperous society for everyone, we first need to address the presence of a wealth aggregation imperative. It could be that the worst of humanity's 'modern problems' are the result of global evolutionary forces shaping modern society to ensure the maximum performance of the wealth aggregation agents populating the world.
Acknowledgements
- The quality of both this paper and the underlying theory were significantly improved through the efforts of Norman Young. By contributing a computer, Gill Elliott greatly aided this research. Thanks go to Kelly White, Alan Gooding, Norman Young, Patricia Gooding for running many of the simulations required for this paper. I would also like to thank Nigel Gilbert for providing a platform through which this work could be published.
Appendices
-
Appendix A - Results of Each Simulation Run
Appendix B - List of Patch Variables
Appendix C - List of Agent Variables
Appendix D - Simulation User Instructions
References
-
ARIELY, D. (2009). Predictably Irrational: The Hidden Forces that Shape Our Decisions. London: HarperCollins.
EISNER, M. (2003). Long-Term Historical Trends in Violent Crime. Chicago: University of Chicago. Available at <https://soci.ucalgary.ca/brannigan/sites/soci.ucalgary.ca.brannigan/files/long-term-historical-trends-of-violent-crime.pdf>.
FAO (2012). The State of Food Insecurity in the World 2012, Food and Agriculture Organization of the United Nations. Rome. <http://www.fao.org/docrep/016/i3027e/i3027e00.htm>. Archived by WebCite® at http://www.webcitation.org/6GdLrkBZ6>.
HILLIS, D. W. (1998). The Pattern on the Stone. NY: Basic Books.
JOHNSON, S. (2001) Emergence. London: Penguin Books.
LIPSON, H. (2005). "Evolutionary Design and Evolutionary Robotics", Biomimetics. CRC Press (Bar Cohen, Ed.) pp. 129–155. Available at <http://ccsl.mae.cornell.edu/papers/Biomimetics05_Lipson.pdf>. [doi:10.1201/9781420037715.ch4]
MILANOVIC, B., (2012) Global Income Inequality by the Numbers: in History and Now – An Overview, Policy Research Working Paper 6259. The World Bank Development Research Group Poverty and Inequality Team. <http://ideas.repec.org/p/wbk/wbrwps/6259.html>. Archived by WebCite® at <http://www.webcitation.org/6GdMD6LmX>.
MILANOVIC, B. (2005) Worlds Apart: Measuring International and Global Inequality. Princeton: Princeton University Press.
ROPER, D. (2013). <http://www.roperld.com/science/minerals/fossilfuels.htm>. Archived by WebCite® at http://www.webcitation.org/6GdKrdDZp.
TURCHIN, P., Currie, T., Turner, E., Gavrilets, S. (2013). "War, Space, and the Evolution of Old World Societies", Proceedings of the National Academy of Sciences of the United States of America. September 23, 2013. doi:10.1073/pnas.1308825110. <http://www.pnas.org/content/early/2013/09/20/1308825110>. [doi:10.1073/pnas.1308825110]
UNEP (2012). GEO5 Global Environmental Outlook (Press Release). Author. Retrieved from <http://www.unep.org/geo/pdfs/geo5/GEO5-Global_PR_EN.pdf>. Archived by WebCite® at <http://www.webcitation.org/6GdQ4Q0Vi>.
UNIVERSITY OF MICHIGAN (2013). <http://www.globalchange.umich.edu/globalchange2/current/lectures/human_pop/human_pop.html>. Archived by WebCite® at <http://www.webcitation.org/6GdLdyl3T>.
WHO, (2013). Retrieved from: <http://www.who.int/gho/mortality_burden_disease/life_tables/situation_trends/en/index.html>. Archived by WebCite® at <http://www.webcitation.org/6GdR23gKG>.
WILENSKY, U. (1999). NetLogo. <http://ccl.northwestern.edu/netlogo/>. Center for Connected Learning and Computer-Based Modeling, Northwestern University, Evanston, IL.
WILKINSON, R., (1996). Unhealthy Societies: The Afflictions of Inequality. London: Routledge. [doi:10.4324/9780203421680]
ZIEGLER, J. (2001). "The Right to Food: Report by the Special Rapporteur on the Right to Food, Mr. Jean Ziegler, Submitted in Accordance with Commission on Human Rights Resolution 2000/10". United Nations.
ZYKOV V., Mytilinaios E., Adams B., Lipson H. (2005). "Self-reproducing machines". Nature 435(7038), pp. 163–164. [doi:10.1038/435163a]