
 Abstract
- This paper presents a model to generate dynamic patterns of maritime piracy. Model details, outputs and calibration are illustrated. The model presented here is a tool to estimate the number of pirates and their area of action. The Gulf of Aden is considered as a case study, and data on pirate attacks, vessels routes and flows through the Gulf of Aden in the year 2010 are used to build the model. Agent-based modelling is employed to simulate pirate, vessel and naval forces behaviours.
- Keywords:
- Maritime Piracy, Crime, Map Generation, Simulation, Agent-Based Modelling
Introduction
- 1.1
- Maritime piracy has increased dramatically in recent years and it is estimated that this type of crime costs the global economy over $7 billion per year (Ploch 2010). Not surprisingly, this has attracted attention from the military and international institutions such as the United Nations. It is claimed that the primary motivation for pirate attacks is financial gain obtained either through hijacking and theft of cargo or ransoms collected following the kidnapping of the vessel and crew (Hastings 2009).
- 1.2
- A number of approaches to fight maritime piracy have been implemented (e.g. Rengelink 2012). For example, a UN Security Council resolution (Oct 2008) provides the legal basis for the pursuit of pirates into Somali territorial waters. The UN sanction in 2008 and a US presidential order in 2010 both banned the payment of ransoms to a list of individuals known to be involved in piracy. In August 2008, the Maritime Security Patrol Area (MSPA) was set up in the Gulf of Aden by the Western Navies Combined Task Force and in February 2009 a transit lane off the Gulf of Aden through which ships are advised to sail was established (the International Recommended Transit Corridor). Despite efforts to reduce piracy, a recent empirical analysis of daily counts of piracy in Somalia and the Gulf of Aden provided no evidence as to the effectiveness of such policies to date (Shortland & Vothknecht 2010). However, fighting piracy is both an urgent and difficult task. To illustrate, consider that in 2010, 30 ships were allocated to the fight against piracy but that these are required to patrol a region of two-million square miles (Chalk 2010). Thus, understanding maritime piracy and optimising strategies aimed at reducing it is of clear importance.
- 1.3
- Several scholars have attempted to investigate the phenomenon from qualitative (O'Meara 2007) and descriptive (Abbot & Renwick 1999; Vagg 1995) perspectives, or focused on how to apply international law to this type of crime (Treves 2009). The majority of the quantitative research has been carried out by political scientists and in such studies, macro-level features of different states are used to explain the variation in the frequency of attacks. Perhaps the most relevant quantitative findings are two-fold: firstly, the risk of piracy is not evenly distributed across the world's oceans (Marchione & Johnson 2013); and, secondly, maritime piracy is thought to be more prevalent off the coast of failed or weak states (Hastings 2009).
- 1.4
- To explain observed patterns, Daxecker and Prins (2011) propose a general explanation of maritime piracy that emphasizes the importance of institutional and economic opportunities. They use a monodic-year unit of analysis that includes all states in the international system and cases from 1991 to 2007. By defining the country-year as the unit of analysis they provide descriptive statistics on spatial and temporal trends. The authors conclude by showing a positive and statistically significant relationship between piracy attacks and both state failure and economic opportunity.
- 1.5
- Such findings offer insight into how the problem may be addressed through political or other approaches – approaches that may be targeted towards the restoration of law and order in weak states – but offer only the most general intelligence as to where attacks are most likely to occur in the future while state fragility remains. Spatial analyses of maritime piracy that may assist in the latter endeavor are proposed by Caplan et al. (2011). Using Risk Terrain Modeling, they define a way to standardize risk factors to common geographic units over a continuous surface. To generate such a map, separate layers representing the intensity of each risk factor are combined to produce a composite "risk terrain" map. In their study, to try to explain spatial patterns of maritime piracy, the authors put forward three risk factors: state status, shipping routes and maritime choke-points. In output RTM generates a GIS map that highlights high-risk areas. Their results are promising but the maps are time invariant and provide no insight into how the interactions between pirates, vessels (potential targets) and naval forces might lead to observed patterns of attacks.
- 1.6
- Temporal patterns of maritime piracy are discussed by Shortland and Vothknecht (2010) who evaluate the effectiveness of the international naval mission in the Gulf of Aden between 2008 to 2010. The authors claim that pirates actions can be modeled according to a rational choice framework just as Becker (1968) and Sandler and Enders (2004) did for criminal activities and terrorism respectively. Surprisingly, their evidence suggests that the incidence of piracy in the Gulf of Aden has increased since the inception of the naval counter-piracy measures discussed above.
- 1.7
- The methods so far discussed are top-down approaches for which data are collected in the real world, associations are examined using statistical methods and the data generating process inferred. However, spatial and temporal patterns of pirate attacks have also been explored using mathematical and agent-based models. Two examples are the work of Fu et al. (2010) and Jakob et al. (2010). Fu et al. attempt to explain changes in economic losses experienced by the global shipping industry over time in terms of the costs potentially incurred as a consequence of maritime piracy. To do so, they use a simulation model to investigate how maritime piracy might affect losses through the increased cost of insurance, and the potential increased costs associated with ships being forced to take (longer) alternate routes to avoid the risk of piracy. To do this, they use data on shipping movements between 2003 and 2008 and identify the primary routes used and those that may have to be used to avoid the risk of piracy. Focusing on the effect of piracy on the Far East-European markets, the authors conclude that their model is able to reproduce the losses observed in the real world, and hence suggest that these are likely to be due to piracy.
- 1.8
- Jakob et al. propose a spatially explicit agent-based (Gilbert 2008) platform for analysing, reasoning and visualizing information in the maritime domain with the emphasis on detecting, anticipating and preventing pirate attacks. The platform is designed for the development and evaluation of counter-piracy methods, however, the authors neither explicitly state the methodologies used to calibrate and evaluate the model, nor describe the techniques they use to assess model outcomes.
- 1.9
- The contribution of the current study is twofold. First, a method of calibrating the behaviours of a set of agents that, through their activity (or lack of it) likely contribute to patterns of maritime piracy is introduced. As with other direct contact predatory crimes (see Cohen and Felson 1979) we hypothesize that incidents of piracy occur when motivated offenders – in this case pirates, suitable targets – in this case vessels, converge in space and time in the absence of capable guardians. Capable guardians could be anyone who, through their presence can prevent piracy. In the context of piracy, such guardians will typically either be naval vessels or private security teams – here we focus on the former. Thus, we consider three classes of agents – pirates, vessels, and naval forces, and see whether a simple model of their activity generates maps of piracy that resemble the empirical record. The second contribution is the use of techniques to visualize and compare simulation model outputs with observed empirical patterns. This is of great importance for assessing model performance and (for example) considering how simulated strategies may impact upon maritime piracy.
- 1.10
- In the work presented, an agent-based model is employed to produce dynamic maps of maritime piracy attacks in 2010 in the Gulf of Aden. This model is informed by a series of data sets, described in Section 2. A description of the model is in Section 3 and model calibration is discussed in Section 4. Section 5 concludes the paper.
Data
- 2.1
- Five sources of data are used in the proposed model. First, data concerning incidents of maritime piracy for the calendar year 2010 around the Gulf of Aden were obtained from the National Geospatial Intelligence Agency's[1] (NGIA) Anti-Shipping Activity Messages database. The NGIA collect and collate incidents of maritime piracy, and issue warnings to mariners in real-time. Their data come from a variety of sources including, but not limited to, the International Maritime Bureau and the International Maritime Organization. For each attack, the location is recorded and represented using the Latitude and Longitude coordinate system. The date on which attacks took place is also recorded, along with information about the type of vessel attacked, and a free-text description of the event. Video 1 shows a dynamic visualization of the entire NGIA dataset for the period 1990 to 2012. Zones with a high density of attacks are coloured in shades of green – the lighter the shade the greater the density. The density values calculated for each frame of the video are derived using a spatial and temporal smoothing algorithm. The approach to spatial smoothing is discussed below, but with respect to time, a linear inverse weighting is applied for each time interval so that attacks that occurred most recently are given the most importance. Noticeably, a burst of pirate attacks is observed around the Gulf of Aden in the year 2010, and it is in this area that we focus our attention in what follows.
Video 1: NGIA dataset visualization - 2.2
- We analyse all incidents of maritime piracy. Figure 1(a) shows each of the 56 incidents of piracy (red dots) that were recorded in 2010 around the Gulf of Aden.
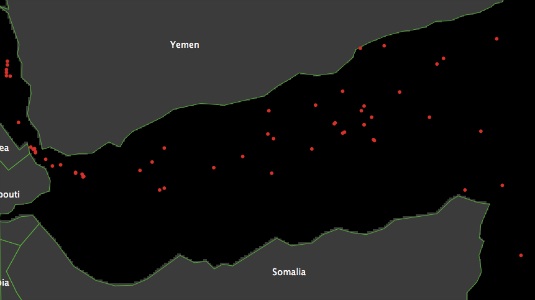
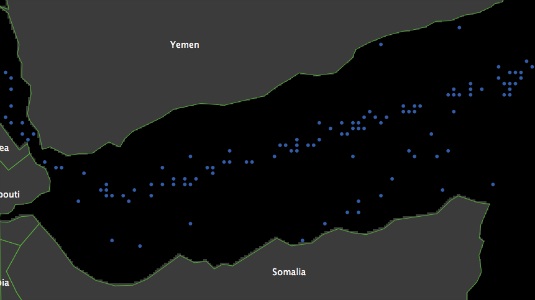
(a) Pirate attacks (b) Vessel routes Figure 1. Pirate attacks and vessel routes in 2010 - 2.3
- Second are data concerned with the movement of ships through the area of interest. These positions are difficult to collect: one can either buy this information or collect Surface Synoptic Observation (SYNOP) data. We do the latter, collecting a sample of data for the period 15 November to 31 December 2010[2]. SYNOP is a numerical code used for reporting weather observations. The data include meteorological measures along with the Longitude and Latitude of the location at which the observation was taken, and when it was taken. Individual vessels routinely transmit SYNOP data thereby allowing their location to be tracked over time. Figure 1(b) shows the entire dataset collected through SYNOP in 2010 for the Gulf of Aden. Each blue dot represents a SYNOP numerical code.
- 2.4
- Third, the number of vessels passing through the Suez Canal in 2010, both from north to south and from south to north, is obtained from the Canal Suez Traffic Statistics[3]. These data are used to simulate vessel volumes in the Gulf of Aden. It is assumed that all the vessels that went through the Suez Canal also went through the Gulf of Aden. Table 1 shows figures for both flows: north to south and south to north.
Table 1: Vessels transiting the Gulf of Aden 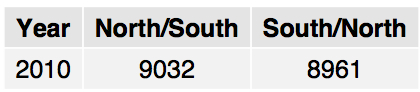
- 2.5
- Fourth, information on the number of naval units operating in the Gulf of Aden in 2010 are taken form the work of Chalk (2010), who identified 14 international naval units operating in the Gulf. Apart from NATO, a number of other states sent frigates to protect and/or escort shipping off the Horn of Africa, including India, China, Russia, Pakistan, Saudi Arabia, the Netherlands, and Malaysia.
- 2.6
- And finally, the flag (the country to which the vessel is registered) and type of all the vessels passing through the Suez Canal in the year 2010 were obtained from monthly reports issued by the Canal Suez Traffic Statistics[4].
Model
- 3.1
- The model is implemented on and generates a dynamic map. It consists of a 286 × 160 grid for which each cell is represented by 3 × 3 pixels. Each pixel edge represents 1.4 miles, therefore each cell is 17.64 squared miles. Other dimensions could be used, but this scale is more than adequate to examine the phenomenon of interest and provides a tractable model that uses a relatively fine temporal resolution (see below). Land is coloured grey and the sea black. Country borders are shown as green lines. There are four type of agents that are free to move across the sea: pirates coloured in magenta, successful pirate attacks coloured in red (they do not move), vessels and navy units in cyan and green respectively (see Figure 5a). The condition action rules that govern agent behaviour (see below) allow the testing of hypotheses and a method of generating dynamic maritime piracy risk maps.
Defining maritime piracy maps
- 3.2
- Before discussing the model further, we describe how the spatial pattern that we seek to simulate is defined. Let pirate attack density be a cell variable. It is based on the count of pirate attacks in that cell during the year 2010. As illustrated in Figure 1(a), pirate attacks are rather scattered and consequently for the cell dimensions used, rarely occur in the same cells. For this reason, a transformation is used to obtain a sensitive density value for the risk of piracy in each cell. One solution would be to increase the cell size. However, problems with using coarse grids for this type of analysis are well known and include the ecological fallacy (Robinson 1950) of assuming that within a (large) cell the risk of attack is equal at all locations. A related and more important issue is the modifiable areal unit problem (Openshaw 1984). In this case, the problem is that the distribution of a particular point pattern may look quite different if it is summarised by aggregating events to different sets of boundaries. This may be the case even if the different boundaries only differ in subtle ways, and the problem is particularly acute if events occur near to the boundaries. For these reasons, a different approach is proposed. Instead of simply counting the number of attacks that occur in each cell, we use a kernel density estimator. Conceptually, for each attack, one can think of the approach as providing an estimate of how accurate it is to assign that attack to a particular cell. The density is computed using the method as described in Tarn (2007). As with other estimators, the algorithm used estimates density values for a grid of regular sized cells by identifying events within a given bandwidth of each cell and then computing a weighted sum of events. Events are weighted by their proximity to the centre of the cell of interest and so cells with large numbers of events clustered around the centroid of the cell will have the highest density values. This particular method (Tarn 2007) is used as it not only computes a density estimate in two dimensions but also selects the optimal bandwidth to describe a particular point pattern.
- 3.3
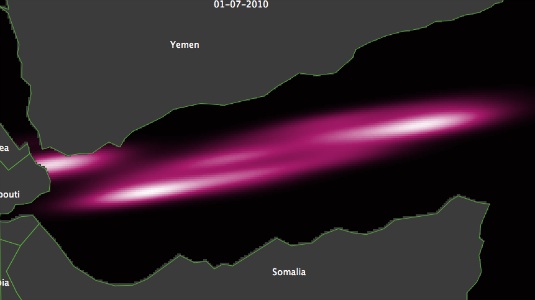
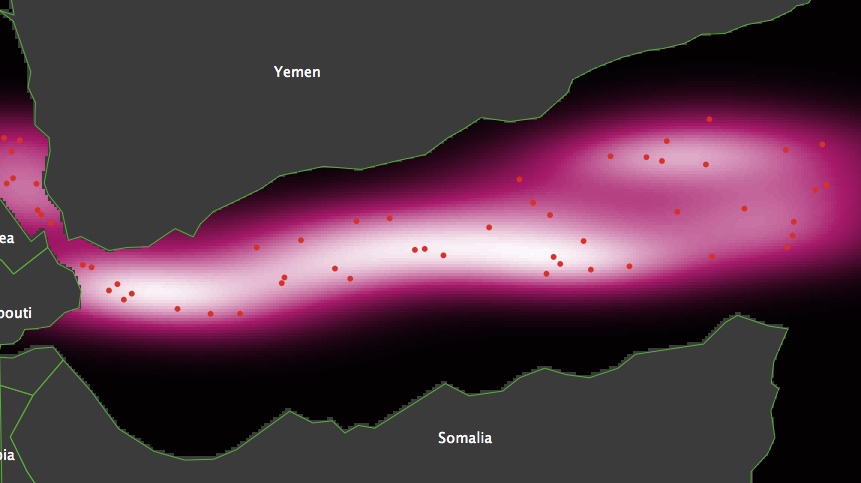
- Pirate attacks that occurred during the first six months of the year 2010 are transformed into the density map shown in Figure 2. Density is visualized in shades of magenta, the lighter the higher the density is, the darker the lower. The transformation proposed here shows two areas with high concentrations of incidents of piracy. The one with the highest density is between Yemen and Somalia. The choke-point south-west of Yemen is also an area with a high density of attacks.
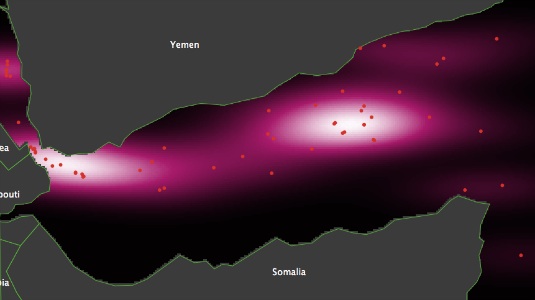
Figure 2. Density map of observed pirate attacks in 2010 Defining vessel route maps
- 3.4
- Maritime piracy cannot occur in the absence of target vessels and so estimates of the typical location of such ships is a key element of a model of maritime piracy. Figure 1(b) shows vessel locations, as recorded in the SYNOP data from 15 Nov 2010 to 31 Dec 2010 off the Gulf of Aden. It is possible to detect a main route starting from the Suez Canal, going through the Gulf of Aden and then forking north-east towards the open sea.
- 3.5
- The vessel route map used here is derived from the SYNOP data and is defined as the likelihood of finding a vessel on a particular cell (vessel density) in the year 2010. This map has to be consistent with the shape of the land, and therefore around choke-points (where there is less room for manoeuvre) the density must increase, whereas the further a vessel moves into the open sea the lower the density will be. The vessel route map is generated through a two-step process. First, the main route is identified as a polyline as shown in Figure 3(a) [5]. The cells that intersect the polyline are then used to define the main route in the model. Ships can, of course, also move through other cells but the probability of them doing so decreases the further a cell is from the main route. The second step is therefore to establish these probabilities. To do this, for each cell on the main route, we estimate the distance of that cell from the coastline. This value, labelled breadth, approximates the maximum distance a vessel could realistically be found between it and the coastline. For each cell on the main route, let dist be a vector of n random-normal values generated within the interval [0 breadth]. The probability of a vessel travelling through a cell that is d cells from the main route is then estimated by counting the number of values of dist ∈ [0 breadth] that are equal to d. Figure 3(b) shows the route map for vessels. Vessels sailing south to north follow the same route as vessels sailing north to south. Cell vessel density is visualized in shades of blue, the lighter the colour the higher the density, the darker the colour the lower.
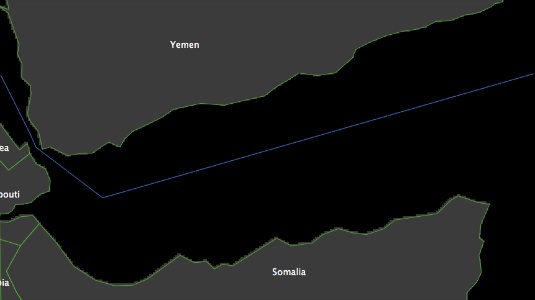
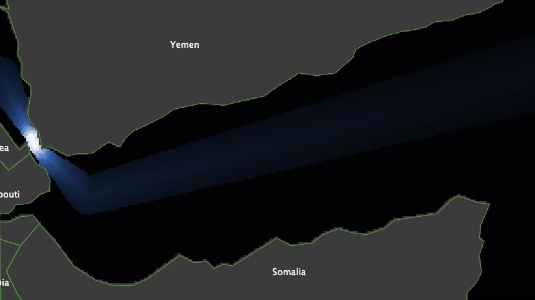
(a) Vessel route (b) Vessel density map Figure 3. Vessel route map Defining pirates', naval units' and vessels' behaviours
- 3.6
- Pirates, naval units and vessel agents are free to move across the sea. A set of parameters is defined in order to simulate their behaviours, as follows:
- na: naval units radius area of action
- I: naval units radius of influence;
- np: number of pirates;
- pa: pirates radius of action;
- pit: pirate inactivity time;
- npz: number of zones in which pirates operate;
- pI: pirates radius of influence
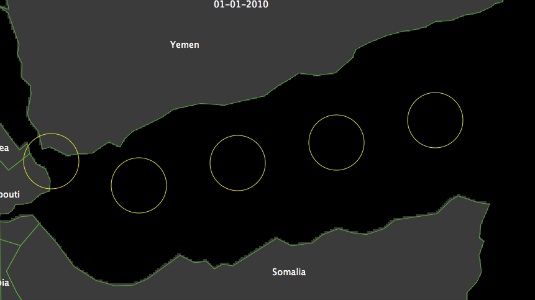
Figure 4. An example of the pirates range of action - 3.7
- At regular intervals determined using a uniform random number generator, vessels begin journeys either from the north-west or east or the map. Given the geography of the area, those starting from the north-west can go only east, those starting from east can move only north-west. Vessels follow a predefined route through the Gulf of Aden as suggested by the handbook: Best Management Practices to Deter Piracy off the Coast of Somalia and in the Arabian Sea Area[6]. The exact starting location of each vessel is determined by randomly selecting one of the cells at the margin of the route. As vessels move, they follow a route for which the cells are of the same density as the starting cell. Thus, most (but not all) vessels will follow a route that is close to the centre of the shipping lanes shown in Figure 3(a). On the basis of an empirical study conducted by the Office of Naval Intelligence (ONI) Piracy Team in 2009[7], the mean vessel speed is set at 15 knots. To add some variability, the actual speed is sampled from a random normal distribution with a mean of 15 knots, and a standard deviation of 2 knots.
- 3.8
- Insufficient literature is available to define the behaviours of the pirate and naval units using existing data. Consequently, for the purposes of this model, both pirate and naval agents are allocated an area of action, within which they conduct a biased random walk. The number of areas allocated to each class of agent, and the size of those areas is estimated through model calibration. Both pirates and naval units follow the same rules for sailing. For each simulation step, they move 4.2 miles (which equates to 15 knots) and adjust their compass h as follows h = h±random(20). If they hit the boundary of their area of activity their compass is set as h= h-180.
- 3.9
- Figure 5(a) illustrates a snap-shot of one simulation step (the simulated date is shown at the top of the figure). Every 7 simulation steps correspond to an interval of 2 hours, and consequently a simulated year corresponds to 30,660 simulation steps.
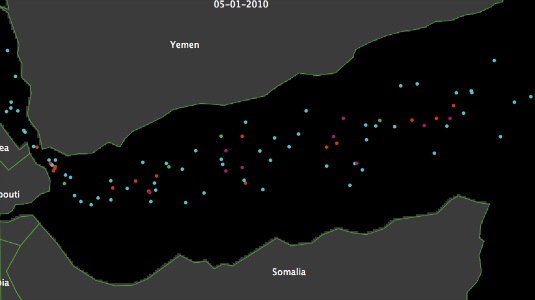
(a) Run snapshot (b) Simulated map Figure 5. Visualization of the simulation (red dots=pirates, blue dots=vessels, green dots=naval units) - 3.10
- Parameter I specifies the range over which the presence of a naval unit repels pirates, whereas pI specifies the range over which pirates can detect the presence of potential target vessels. Parameter pit indicates the number of days pirates are inactive after a successful attack and is used to model the post attack activity associated with collecting a ransom or transporting hijacked cargo.
- 3.11
- Pirate attacks occur when three conditions are met:
- the distance between a pirate and a potential target vessel is less than pI.
- the distance from the closest navy unit is greater than that over which naval forces influence pirate decision making (I).
- If conditions 1 and 2 are met, a pirate agent's decision as to whether to attack is influenced by three factors:
Conditions on the open seas vary by season, and research indicates clear seasonal patterns in the risk of maritime piracy (e.g. Marchione & Johnson 2013). Consequently, account is taken of this in the model, and the monthly probability of a successful attack is estimated using NGIA data for the ten-year period (1999–2009) prior to the period for which we simulate attacks (see Figure 6). According to these data, attacks are more likely in the Spring and Autumn months.- the (simulated) season
- the type of vessel encountered (e.g. bulk cargo, oil tanker – see Table 3, and
- the flag (the country to which it is registered) of the vessel
- 3.12
- The type of vessel and where it comes from is also known to have a significant influence on the risk (number of vessels attacked divided by those transiting) of victimization (Mejia et al. 2009). Consequently, estimates of the risk associated with different types of vessels and those registered to particular states are taken from Mejia et al. (2009). Empirical data (shown in Tables 2 and 3 respectively) are used to replicate the flow of different types of vessels, and those registered to different states, through the Gulf of Aden. In the model, we include the 10 types of vessels and the 113 different flags that are considered in the Meija et al. work.
- 3.13
- To model the probability of attack, let s(), t() and f() be season, vessels' type and vessels' flag attack probability density functions, respectively. Each time conditions 1 and 2 (see above) are met, a random number c is sampled from a uniform distribution between 0 and 1, and if s()*t()*f() > c, then a pirate attack takes place.
- 3.14
- Video 2 is a visualisation of one model run. A larger area than the one under analysis is displayed to allow for a better perspective of the behaviour of the model. Agent colour schemes are the same as those described at the beginning of Section 3. For simplicity, and for the example shown (but not in what follows), pirates and naval units operate in the same three zones, identified by yellow circles. Orange circles identify the naval units areas of influence. Pirate attacks are initially shown as big red dots which decrease in size over time.
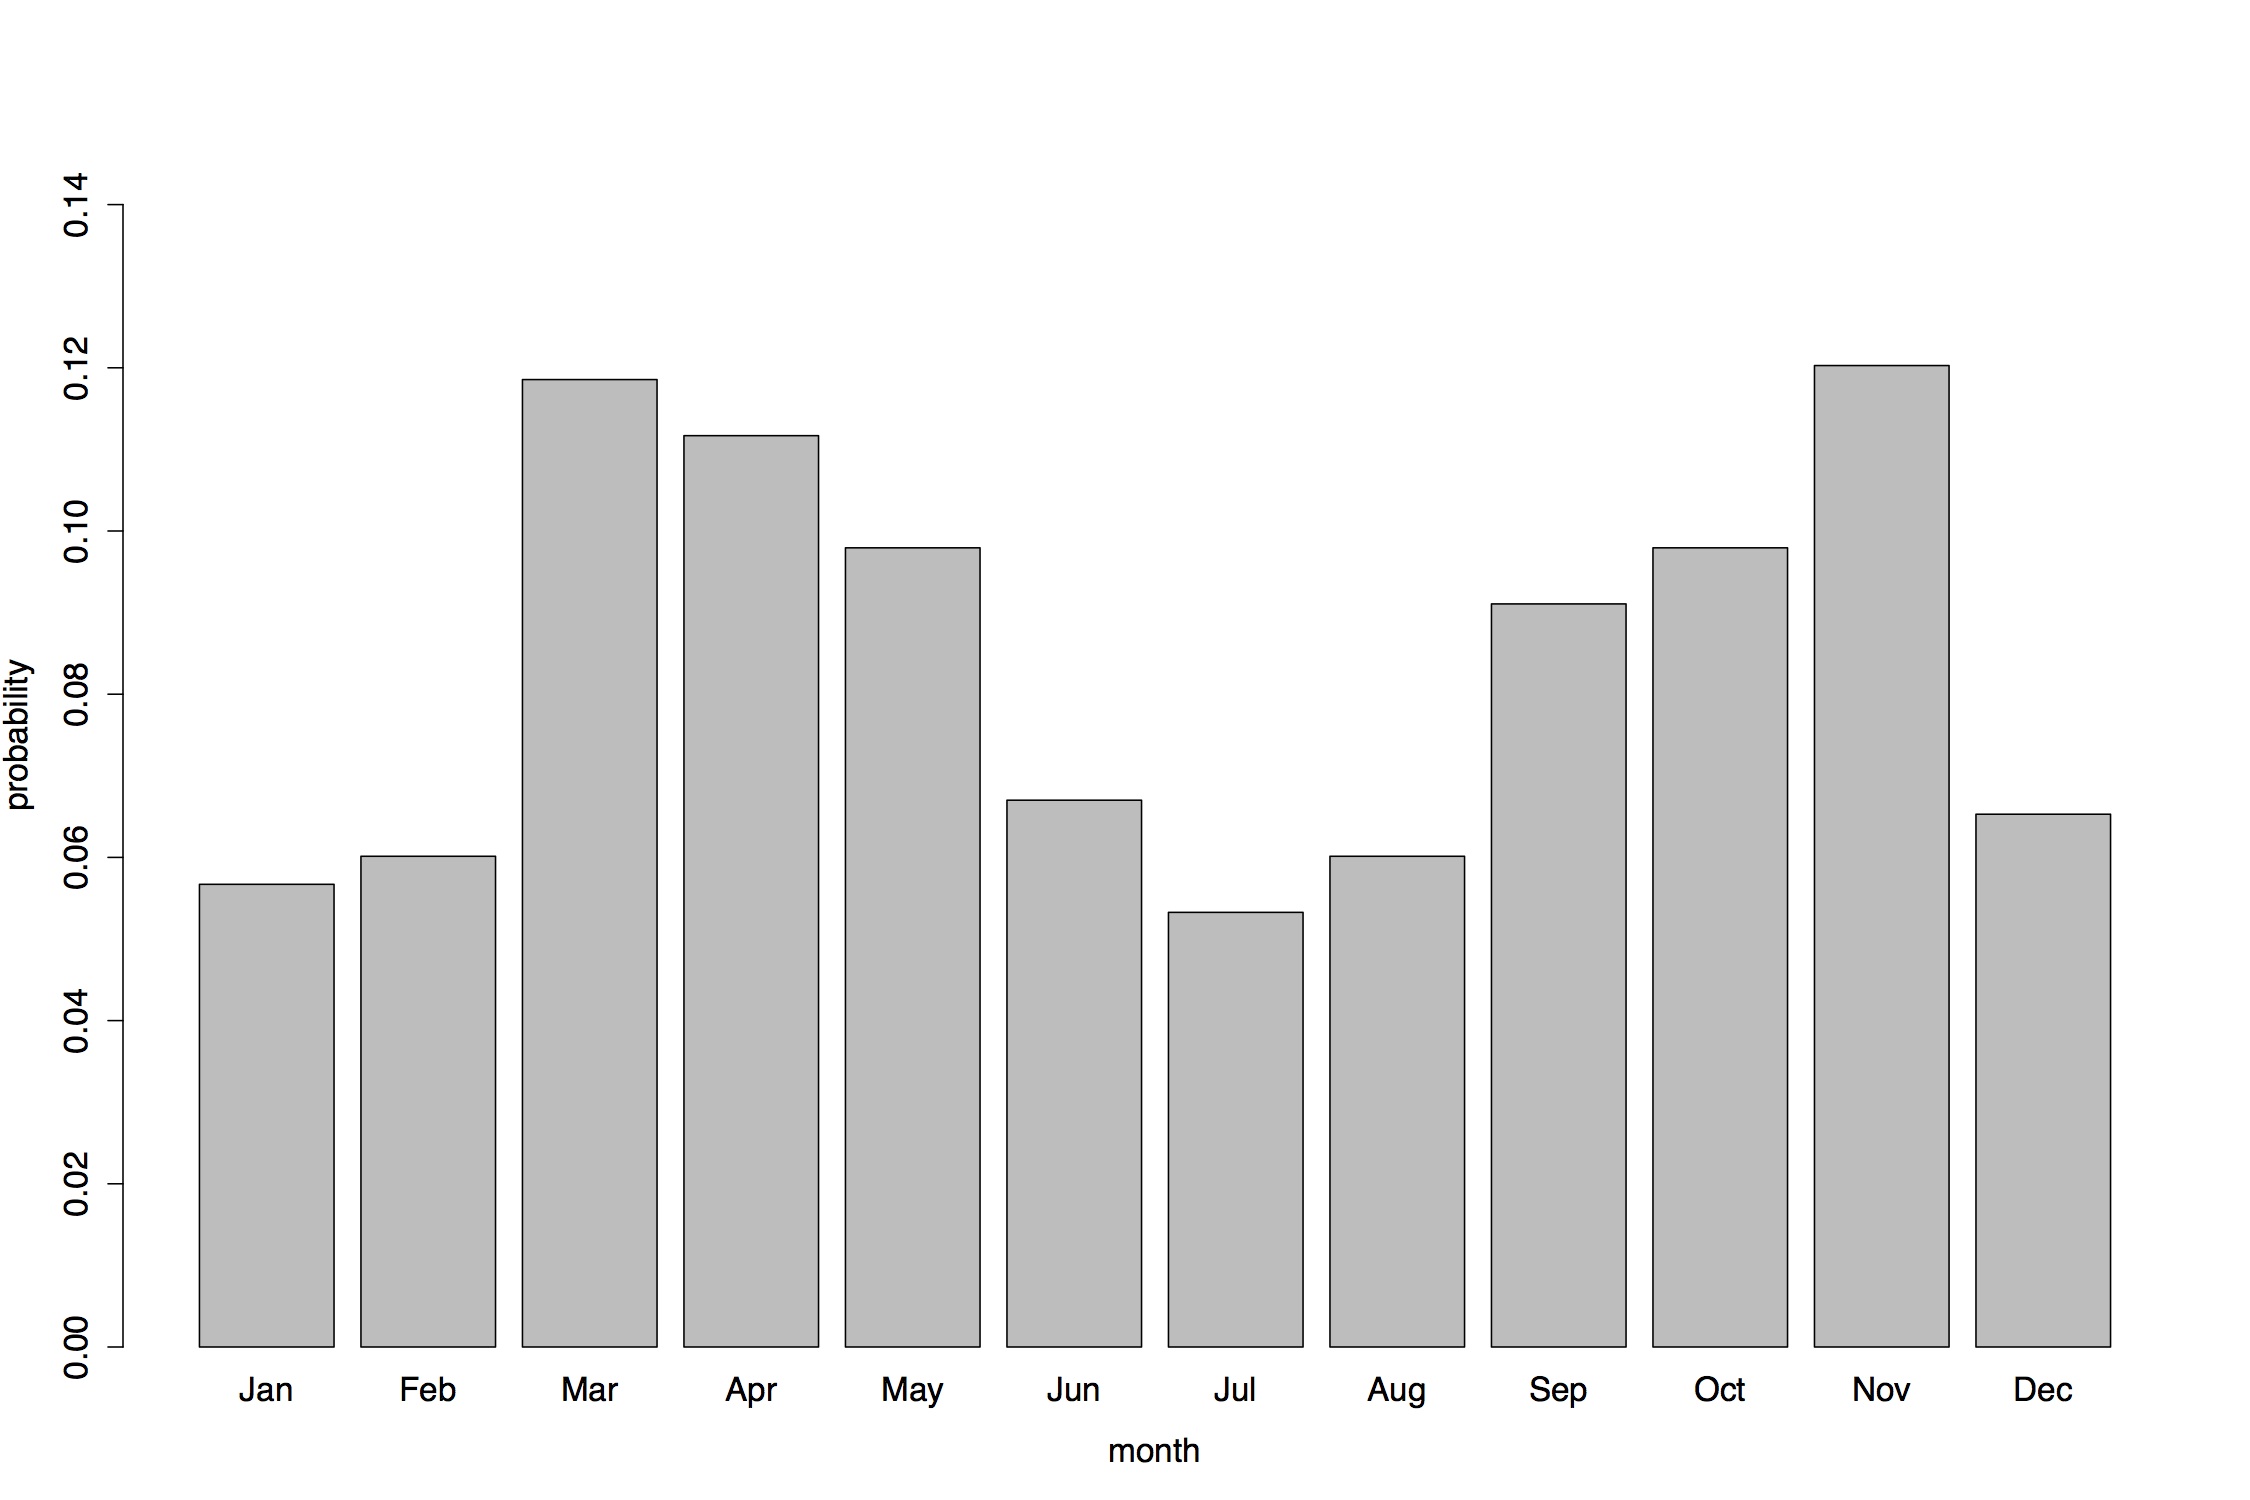
Figure 6. Probability of pirates attacks around the Gulf of Aden for the period 1999–2009 (Source: National Geospatial Intelligence Agency's Anti-Shipping Activity Messages database) Table 2: Vessel type passing through the Gulf of Aden in 2010 (Source: Canal Suez Traffic Statistics) 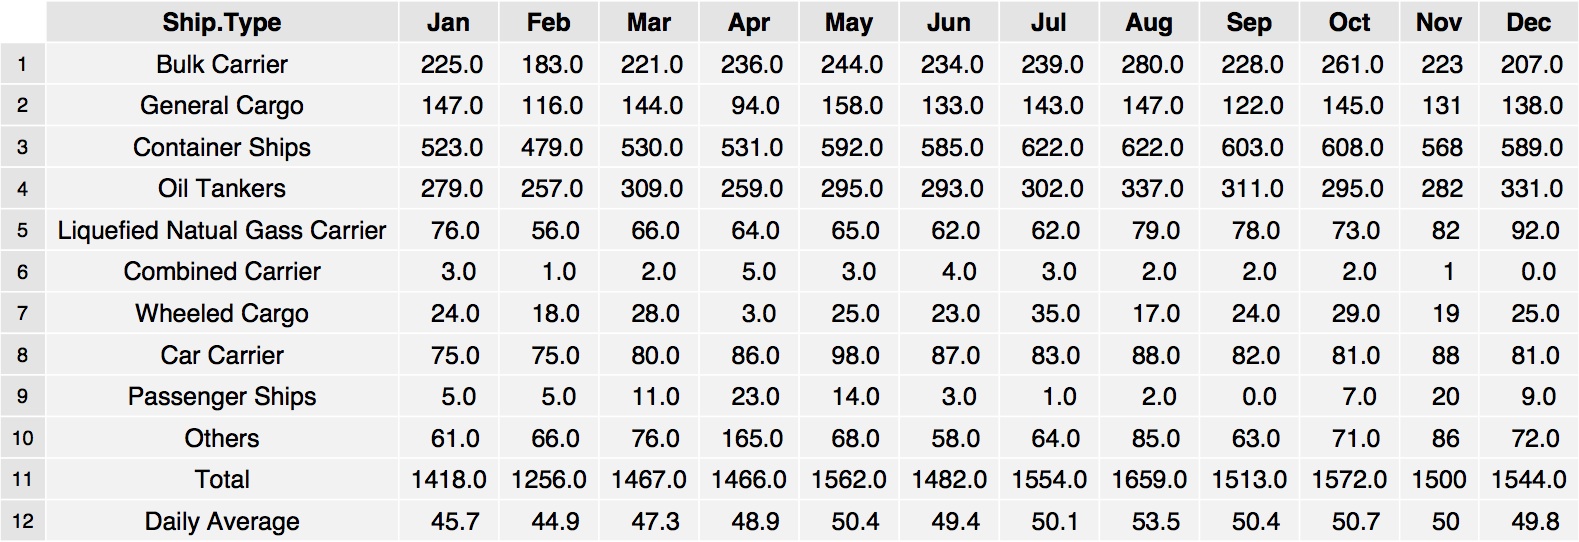
Table 3: Vessel flag passing through the Gulf of Aden in 2010 (Source: Canal Suez Traffic Statistics) 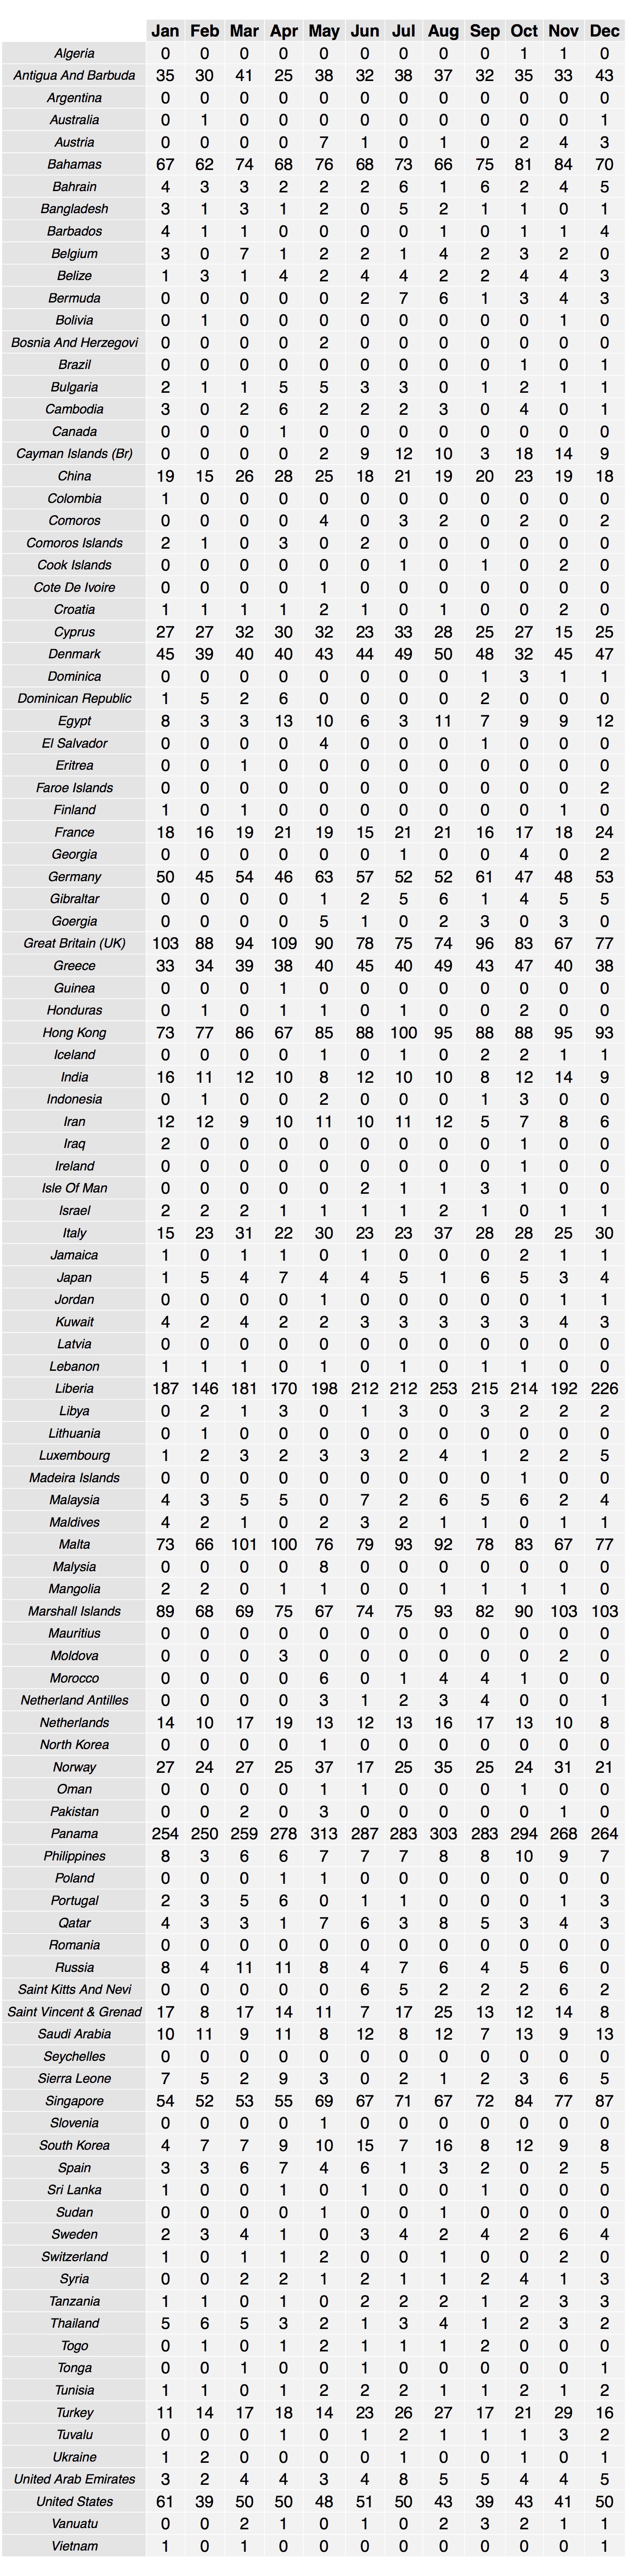
Video 2: Visualisation of a model simulation Comparing risk maps
- 3.15
- The map shown in Figure 5(b) shows the full extent (the area shown in Video 2 is a much larger area) of a simulated maritime piracy map, generated using one set of the parameter values discussed above. It should be clear from the description of the model that data concerning the locations of attacks were not used to inform the condition action rules that govern agent behaviour, and so the simulated outcomes are not simply the product of presupposed emergence.
- 3.16
- Visual inspection of the simulated map is insufficient to assess whether or not the model reproduces the patterns observed in the real data. To do this more systematically, a method to assess the goodness of fit is proposed. Each simulation is compared to the observed data with respect to the location, time and overall number of attacks that occurred during the period of interest. Specifically, to compare model performance we use a kernel density based two-sample comparison test for multi-dimensional data originally developed in biology to examine cell morphology after a given manipulation (Duong et al. 2012).
- 3.17
- The discrepancy measure T is:

(1) where f is the kernel density estimate. In order to measure model performance with respect to the overall number of attacks produced, the bandwidth H is optimised only for the observed attacks (for a detailed description of the algorithm, see Chacon and Duong 2010), and kept constant when estimating the density of the simulated attacks. x1 and x2 are the 3-variate (longitude, latitude and time) samples of observed and simulated pirates attacks respectively. A z-score of the discrepancy measure is computed as follows:
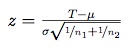
(2) where μ and σ are the mean and standard deviation of T respectively (for the estimation of μ and σ please seeDuong et al. 2012); n1 and n2 are the number of observations for observed and simulated pirate attacks. The Z-score is used to compare model performance, and high values suggest that two distributions are drawn from different populations.
Model Calibration
- 4.1
- In the absence of data to calibrate some of the model variables, to examine the sufficiency of the model to generate patterns similar to those observed in the real world, we use a Genetic Algorithm to estimate parameters. Specifically, we use the Mebane et al. (2011) Genetic Optimisation Using Derivatives technique. This approach combines a derivative-based (Newton or quasi-Newton) method in the creation of new individuals (in the vocabulary of genetic algorithms) in the genetic algorithm with the typical mutation and crossover methods.
- 4.2
- The fitness of each individual is the mean of the z-score (equation 2) of 15 runs of the model for the first six months of the year 2010. Twenty Generations of 20 individuals were used by the genetic algorithm to estimate parameters. Optimisation results are shown in Table 4.
Table 4. Model calibration 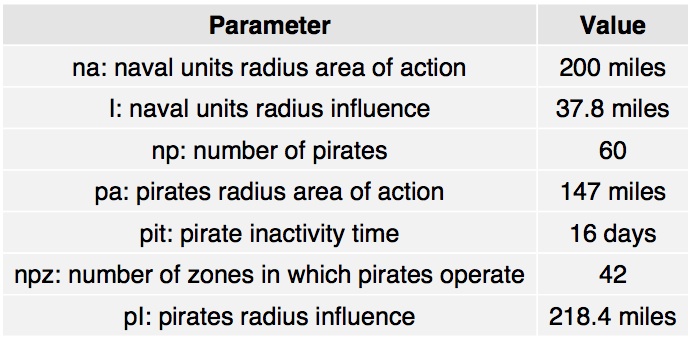
- 4.3
- Considering the influence of the parameter values on model outcomes, insight can be gained from examining which combinations of parameter values generate outcomes that most closely approximate the empirical record. The best results are observed when there are 60 pirates (np) operating in 42 zones (npz), with range of action of (pa =) 147 miles, with 16 days of pirate inactivity and a radius influence of 218.4 miles. For the Naval forces, it seems that simulation outcomes most closely replicate the real world patterns sampled when the range of influence is (I =) 37.8 miles and the range of action is (na =) 200 miles. The mean Z-score (computed across 15 runs) for the parameter settings shown in Table 2 of 1.44 (standard deviation=0.4) is less than the critical value of 1.96, suggesting that the model output does not differ significantly to that observed. The mean number of attacks is 57 with a standard deviation of 6.6, which compares well with the 56 attacks observed.
- 4.4
- Figure 7 compares the observed map 7 (a), and a map generated during one run of the model that used the best parameter settings 7 (b). The latter has a z-score of 1.28 and 55 attacks. Visual inspection of the map generated indicates that the difference between the two distributions is due to the simulation model generating two high density clusters too close to each other. This is partly caused by the restricted mobility of the vessel agents transiting the Gulf of Aden. For example, in the calibrated model, no vessel navigated off the south-east coast of the Yemen nor off the north-east cost of Somalia.

(a) Observed map (b) Simulated map Figure 7. Maps comparison 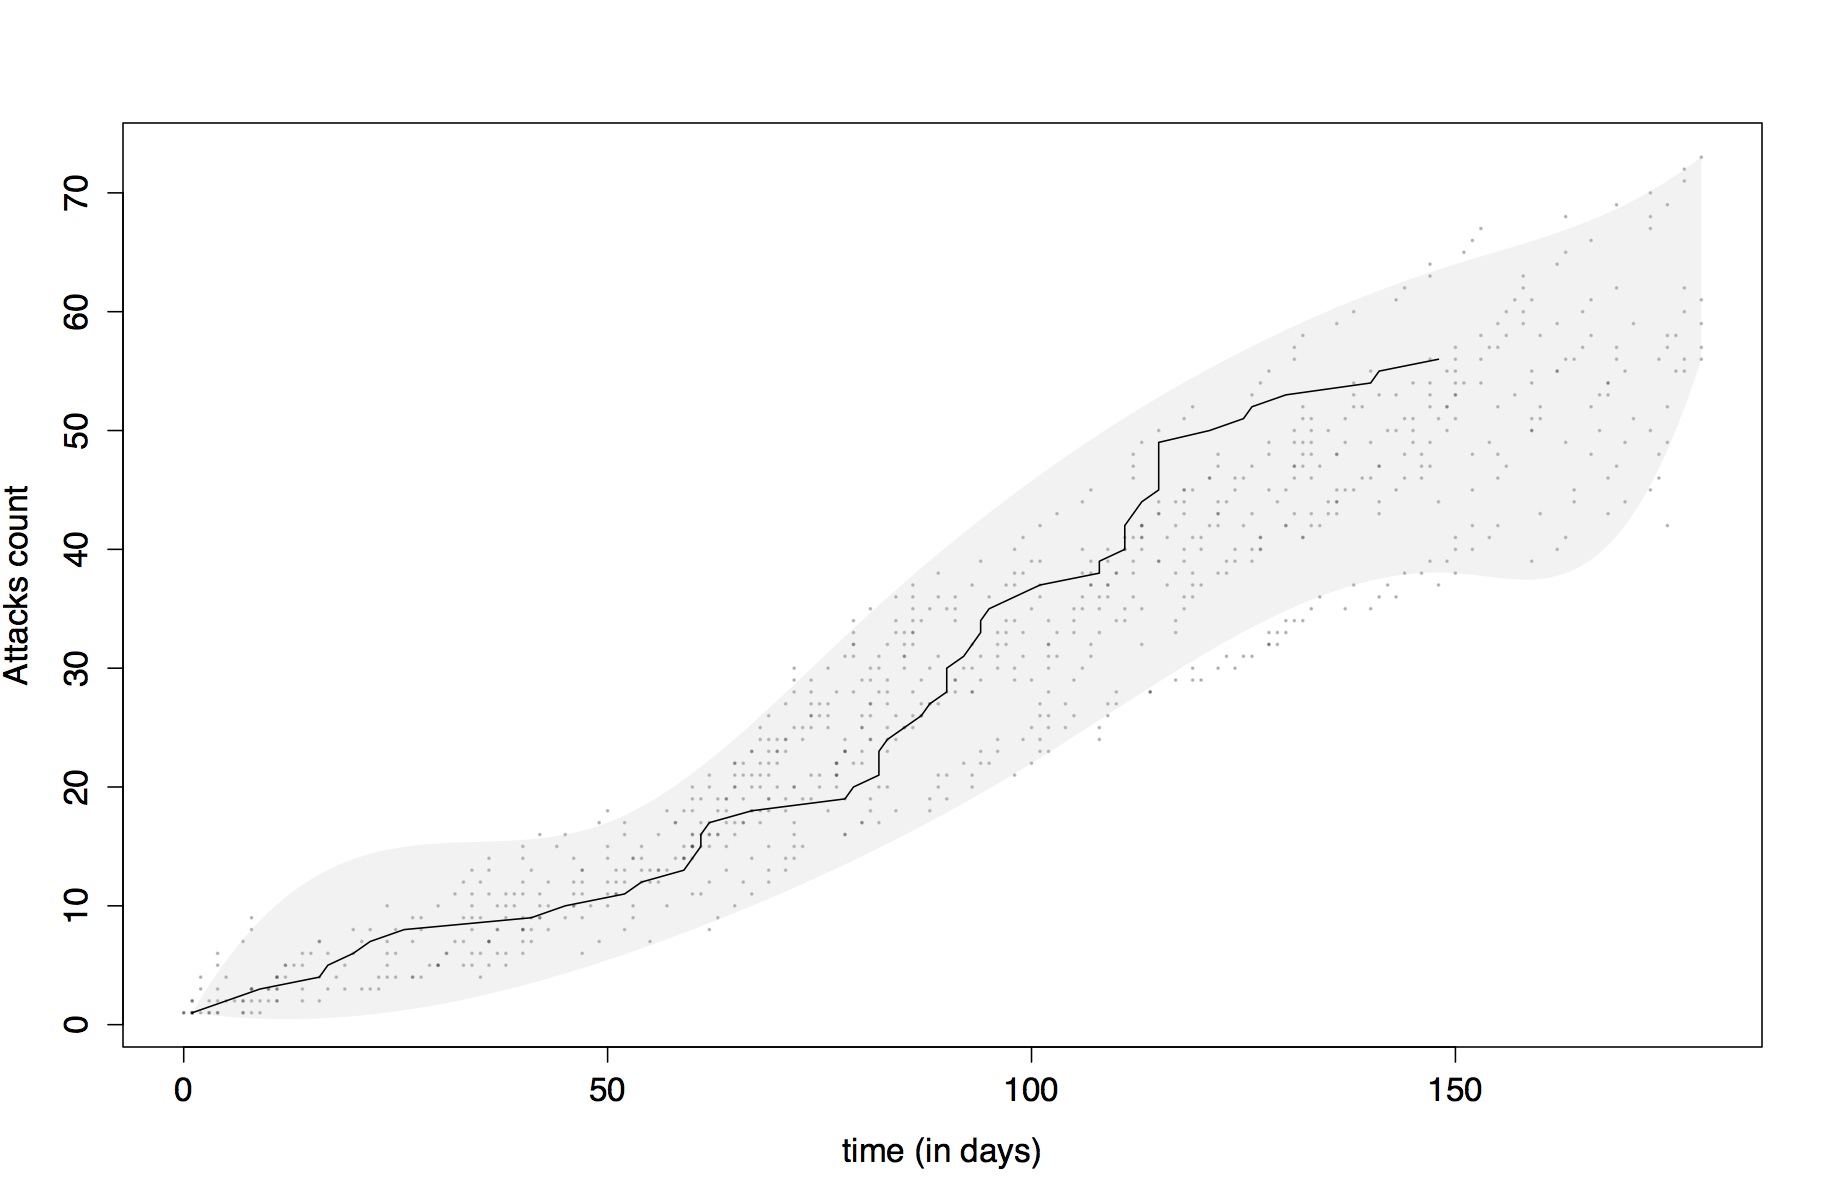
Figure 8. Observed and simulated pirate attack time series. - 4.5
- The above analysis compares how well the model reproduces the space-time distribution of attacks, but does not consider the more general pattern in the number of attacks observed over time. To do this, Figure 8 shows the cumulative number of attacks observed over time in the real data (black line), along with the results from the 15 simulation runs generated using the optimised parameter settings. The dots are the actual simulated results and the grey region highlights the timeline pattern produced by the model. The top and bottom edge of the grey area are a polynomial interpolation of the maximum and minimum attack counts for each day respectively. The model matches the observed time series well.
Discussion
- 5.1
- In this paper an agent-based approach is employed to test a simple model of maritime piracy. The model proposed is calibrated using empirical observations concerning the volume of vessels sailing through the Gulf of Aden, a sample of SYNOP data to estimate the geometry of shipping routes, estimates of seasonal variation in the risk of attack, and estimates of how the risk of attack differs by vessel type and state of registration. Model outputs are tested using empirical data (not used in the calibration of the model) concerning the location of pirate attacks around the Gulf of Aden during the first six months of the year 2010. A method for measuring the goodness of fit of the space-time distribution of attacks is suggested and results presented. Despite the simplicity of the model, it appears to approximate the observed spatial distribution of pirate attacks rather well. Consequently, we suggest that the model may prove useful as a way of providing insight into attack locations and for use as a test-bed for examining the potential impact of simulated policy interventions designed to reduce maritime piracy.
- 5.2
- Due to a lack of information on pirate and naval strategies, pirate numbers and so on, we examine how varying model parameters impacts upon model outcomes. The aim of so doing was to see if particular parameter combinations provide outcomes that are more similar to observed patterns, which in turn allows us to make some cautious inferences about the possible number of pirate vessels, their range of behaviour and that of the naval units. Considering model outcomes for the different parameter settings, we find that the model that most closely replicates the observed data is that for which there are 60 pirates operating in 42 zones, with a range of action of 147 nautical miles, a radius of influence of 218.4 miles, and 16 days of inactivity between attacks. For the 14 naval forces (this parameter being based upon empirical data), these were estimated to have an influence and range of action of 200 and 37.8 nautical mile respectively. This is not to say that this is how pirates and naval forces do behave but that – of all of those tested – this model is the most able to explain observed patterns.
- 5.3
- The pirates' radii of action and influence – as estimated by the model - are very large. However, these may not be unrealistic estimates. Firstly, pirates have substantial mobility and can patrol large areas, either under power or by allowing their boats to drift in the open sea. Moreover, pirates operating off the Coast of Somalia are known to use motherships to sail for long periods in open water, which can substantially extend their range of operations (Shortland & Vothknecht 2010). Pirates are frequently equipped with GPS navigation systems, mobile telephony and fast boats (skiffs) powered by two 100 bhp outboard motors (Shortland & Vothknecht 2010) that can easily reach 30 knots. This technology allows them to monitor very large areas and to be able to attempt an attack on vessels that are far away from their position. For example, if a vessel is sailing at 15 knots, a pirate skiff 200 miles away can reach the vessel in 4 hours if the two are sailing towards each other, and in 13 hours if the pirate boat is chasing the target vessel. Therefore a very large radius of influence, as found in the proposed model, may not be unrealistic and may support the idea that pirates use sophisticated technological tools, or coordinate their activity to plan their attacks.
- 5.4
- In contrast, the best model parameter for the naval units suggests that they operate across large areas (a radius of 200) but have a relatively small range of influence (37.8 miles). This would suggest that naval units can only detect or deter the activity of pirate vessels that are in their vicinity. This difference in the area of influence of the pirates and naval vessels is not unreasonable given the asymmetry associated with the challenge of detecting targets for the two types of actor. To elaborate, for naval forces the task of identification involves the detection of small vessels against a backdrop of waves encountered in the open seas, which can be challenging using conventional sensors such as radar. In contrast, pirates will often be searching for large vessels that actually transmit their position in real time, allowing their location to be more easily detected. Apropos, the apparent limited effect of the naval forces in the model more generally, this is consistent with the research reviewed in the introduction regarding the impact of International Policy against piracy off the coast of Somalia in early 2010 (Shortland & Vothknecht 2010; Chalk 2010).
- 5.5
- In the current model, pirates choose their targets according to a probability function based on the current season, and the type and flag of potential target vessels. Vessels move following a predefined route across the Gulf of Aden and naval units patrol the sea following a biased random walk. Further development of the model could explore more sophisticated agent design as well as the impact of exogenous factors such as political and economic influences. Doing so may lead to simulation outcomes that are able to approximate extended time series observed in the empirical record. A further refinement of the model would be to incorporate adaptation behaviours for the vessel agents so that, for example, with some constraints, vessels can change the routes they take as a consequence of recent pirate activity. Additionally, the model might be used to estimate the potential impacts of different naval strategies. For instance, what is the effect of increasing naval strength or different patrol patterns? Such questions could be examined using agent-based models such as the one proposed here, which explicitly models the complex interactions between actors, but they are beyond alternative approaches such as econometric analysis.
- 5.6
- The work reported here is an initial demonstration and although agent rules and interactions are simple, it provides the basis for developing and testing more accurate and realistic agent behaviour, and the simulated impact of specific types of policy intervention. Despite the limitations of the model, the results are encouraging insofar as they suggest that this approach to modelling may provide useful insight into the phenomenon of maritime piracy and interventions designed to reduce it.
Notes
-
1(NGIA, https://www1.nga.mil/Pages/default.aspx)
2 See, http://www.mundomanz.com/meteo_p/byind?l=1
3 See, http://www.suezcanal.gov.eg/TRstat.aspx?reportId=3
4 Reports can be downloaded by changing the number from 45 to 56 at the end of the URL: http://www.suezcanal.gov.eg/Files/Publications/45.pdf.
5 The main route was calculated by finding the polyline that returned the smallest sum of the squared distance from each point.
6 http://www.secure-marine.com/bmp3/bpm3_pdf.pdf
7 http://www.marad.dot.gov/documents/Factors_Affecting_Pirate_Success_HOA.pdf
Acknowledgements
- The authors acknowledge the financial support of the Engineering and Physical Sciences Research Council (EPSRC) under the grant ENFOLD-ing – Explaining, Modelling, and Forecasting Global Dynamics, reference EP/H02185X/1.
References
-
ABBOT, J. & Renwick, N. (1999). Pirates? maritime piracy and societal
security in southeast Asia. Global Change, Peace & Security, 11(1), 7–24. [doi:10.1080/14781159908412867]
BECKER, G. (1968). Crime and punishment: An economic approach. Journal of Political Economy, 76(2), 169–217. [doi:10.1086/259394]
CAPLAN, J., Moreto, W. D., & Kennedy, L. W. (2011). Forecasting global maritime piracy utilizing the risk terrain modelling approach to spatial risk assessment. In Crime and Terrorism Risk. Taylor and Francis.
CHACON, J.E. & Duong, T. (2010). Multivariate plug-in bandwidth selection with unconstrained pilot matrices. Test, 19, 375–398. [doi:10.1007/s11749-009-0168-4]
CHALK, P. (2010). Piracy off the horn of Africa: scope, dimensions, causes and responses. Brown Journal of World Affairs, 16(2), 89–108.
COHEN, L. E., & Felson, M. (1979). Social change and crime rate trends: A routine activity approach. American Sociological Review, 44(4): 588-608. [doi:10.2307/2094589]
DAXECKER, U. & Prins, B. (2011). Insurgents of the sea: Institutional and economic opportunities for maritime piracy. Journal of Conflict Resolution, 57(6), 940-965. [doi:10.1177/0022002712453709]
DUONG, T., Goud, B., & Schauer, K. (2012). Closed-form density-based framework for automatic detection of cellular morphology changes. Proceedings of the National Academy of Science, 109, 8382–8387. [doi:10.1073/pnas.1117796109]
FU, X., Ng, A. K., and Lau, Y. Y. (2010). The impacts of maritime piracy on global economic development: the case of Somalia. Maritime Policy and Management, 37(7), 677–697. [doi:10.1080/03088839.2010.524736]
GILBERT, G. (2008). Agent-based models. Number 153. Sage Publications, Inc.
HASTINGS, J. (2009). Geographies of state failure and sophistication in maritime piracy hijackings. Political Geography, 28(4), 213–223. [doi:10.1016/j.polgeo.2009.05.006]
JAKOB, M., Vaněk, O., Urban, Š., Benda, P., & Pěchouček, M. (2010). Agentc: agent-based testbed for adversarial modeling and reasoning in the maritime domain. In Proceedings of the 9th International Conference on Autonomous Agents and Multiagent Systems. Volume 1, pp. 1641–1642.
MARCHIONE, E. & Johnson, SD (2013). Space-time Dynamics of Maritime Piracy. Journal of Research in Crime and Delinquency. 50(4) 504-524. [doi:10.1177/0022427812469113]
MEBANE, Walter R., Jr. & Jasjeet S. Sekhon. (2011). Genetic Optimization Using Derivatives: The rgenoud Package for R. Journal of Statistical Software, 42(11), 1–26. http://www.jstatsoft.org/v42/i11/ [doi:10.18637/jss.v042.i11]
MEJIA et al. (2009). Is maritime piracy random? Applied Economics Letters, 16, 891–895. [doi:10.1080/13504850701222186]
O'MEARA, R. (2007). Maritime piracy in the 21 ST century: A short course for US policy makers. Journal of Global Change and Governance, 1(1).
OPENSHAW, S. (1984). The modifiable areal unit problem. Concepts and Techniques in Modern Geography, 38, 41.
PLOCH, L. (2010). Piracy Off the Horn of Africa. DIANE Publishing.
ROBINSON, W.S. (1950). Ecological Correlations and the Behavior of Individuals. American Sociological Review, 15(3), 351–357. [doi:10.2307/2087176]
RENGELINK, H. (2012). Trends in Organized Crime. Springer.
SANDLER, T. & Enders, W. (2004). An economic perspective on transnational terrorism. European Journal of Political Economy, 20(2), 301–316. [doi:10.1016/j.ejpoleco.2003.12.007]
SHORTLAND, A. & Vothknecht, M. (2010). Combating Maritime Terrorism off the Coast of Somalia. Deutsches Institut für Wirtschaftsforschung. [doi:10.2139/ssrn.1735401]
TREVES, T. (2009). Piracy, law of the sea, and use of force: developments off the coast of Somalia. European Journal of International Law, 20(2), 399–414. [doi:10.1093/ejil/chp027]
VAGG, J. (1995). Rough seas? British Journal of Criminology, 35(1), 63.
TARN, D. (2007). ks: Kernel Density Estimation and Kernel Discriminant Analysis for Multivariate Data in R. Journal of Statistical Software 21(7), 1–16.