
 Abstract
- The present article uses agent-based social simulation to study rational behaviour in networked innovation. A simulation model that includes network characteristics and network participant's characteristics is run using parameter sweeping, yielding 1450 simulation cases. The notion of coalitions was used to denote partnerships in networked innovation. Coalitions compete against each other and several variables were observed for winning coalitions. Close analysis of the variations and their influence on the average power per winning coalition was analysed using stepwise multiple regression analysis. The analysis brought forward two main conclusions. First, as average betweenness centrality per winning coalition increases, the average power per winning coalition decreases. This implies that having high betweenness centrality as a network participant makes it easier to build a successful coalition, as a coalition needs lower average power to succeed. Second, as the number of network participants increases, the average power per winning coalition decreases. This implies that in a larger network, it may be easier to form a successful coalition. The results form the basis for the development of a utility-based recommendation system that helps people choose optimal partners in an innovation network.
- Keywords:
- Coalition Formation, Networked Innovation, Creativity, Simulation of Social Networks, Social Behaviour, Complex Networks
Introduction
- 1.1
- The rise of the Internet has sparked off a snowballing development of new technologies. In such a rapidly changing world, it is very hard for companies to remain innovative. Only few companies can retain their market share by relying on their internal R&D departments. An increasing number of companies connect to other parties outside the firm to come up with innovations more easily, faster and more cheaply; this is referred to as networked innovation. By sharing their knowledge in their social network, they can profit in a number of ways. To illustrate, Google shares its Android mobile platform technology under an open source license. By doing so, others can advance Google's knowledge. Google is well aware that they do not have to invent new technology themselves in order to make money from it. Instead, they use the expert knowledge that is present among the Android developer community and profit from increased adoption and popularity of their Android platform. If good initiatives arise, Google adopts the technology behind it, works together with its originators, or acquires the technology. They fend off risks of financial failure by making effective and efficient use of the knowledge that is present in their network.
- 1.2
- The value of networked innovation is emphasised by Cassiman and Veugelers (2006), who found that supportive expertise present in an R&D's social network can boost new product development. Furthermore, Kratzer and Lettl (2008) concluded that people that are on the edge of two social networks have more information, as a result thereof being more creative than others in their network. Ronald Burt (2004) coined the term brokerage for such situations. Perry-Smith (2006) points out the significance of a central network position and weak ties outside the firm to be more creative.
- 1.3
- In sum, we can be more creative by profiting from knowledge within our network. Yet, the innovative process does not merely consist of one's creative utterances. Good ideas are often generated, but are for some reason not implemented. Klein and Sorra (1996) point out the importance of skilfulness and commitment for the implementation of innovation. Kotter (1996) suggests a powerful guiding coalition to lead organisational change. Such a coalition is not driven by mere organisational hierarchy, but rather by status, information, expertise, reputations and relationships. The guiding coalition can persuade others in the network to support innovation implementation, which is one of the crucial steps in innovation management (Adamides & Karacapilidis 2006). A coalition implies a shared intention (commitment) from distinct parties (Ensminger & Surry 2008; Sie et al. 2010). It is necessary to have commitment of all members in order to effectively persuade others in the network. Therefore, we argue that a coalition must have added value for all coalition members as compared to no cooperation (superadditivity). To aid the decision on whom to form a coalition with, we zoom in on the connections that people make during open networked innovation. Forming the right coalitions leads to more innovative power for organisations.
- 1.4
- A number of problems arise when in search of coalitions. Firstly, people are not aware of the value of peers in their network neighbourhood (Beham et al. 2010). Secondly, the number of weak ties increases as a social network grows, thereby leading to information overload (De Choudhury et al. 2008). Finally, people lack the cognitive abilities (bounded rationality (Selten 1998; Simon 1982, 1991)) to adequately make a choice whom to connect with in order to receive support in adopting their innovation.
- 1.5
- In the work presented here, we adopt an agent-based simulation methodology to study coalition formation under rational play in networked innovation. We explicitly limit ourselves to rational play, because the agents' cooperation mechanism is based on game theory. More specifically, prospective connections between agents are viewed as coalitions, and the Shapley value (Hart 1987; Shapley 1953) is used to compute the added value of cooperation (forming a coalition) over non-cooperation. Agents exhibit rational behaviour by forming valuable coalitions. The agent-based simulation of networked innovation presented in this paper allows us to analyse the dynamics of coalition formation in networked innovation. The analysis will lead to a model that helps us predict the behaviour of innovators and its outcomes in a network of innovators. Subsequently, this will result in a recommendation of coalitions in real-life by means of innovation-intervening computer software, similar to work by Sie et al. (2012).
- 1.6
- Gilbert, Pyka and Ahrweiler (2001) previously developed a simulation of innovation networks. Their simulation was characterized by: 1) actors, 2) kenes, and 3) research strategies. The actors in the simulation represented firms. These firms possessed knowledge and skills, represented by so-called kenes. Research strategies dominated the behaviour of the agents and the interaction between agents. That is, an agent could do research and generate knowledge on its own, but it could also form alliances with other agents in order to 'lurk' (copy knowledge and skills) from those agents. Moreover, agents cooperated to generate new knowledge.
- 1.7
- We argue that the dynamics of coalitions in networked innovation is very much dependent on the network characteristics and the characteristics of the network's members. By network characteristics we mean the network size and network density (Harary et al. 1965). By the characteristics of the network's members, we mean their age, gender, personality, betweenness centrality and power. By power, we mean the power to influence others of the value of an idea, but this is also dependent on the innovative capabilities of the individual. Besides, power is updated at each simulation iteration, which resembles a form of reputation. Consequently, the purpose of the present study is to determine whether these have an influence on the power and successfulness of coalitions. A detailed description of the method of simulation and our model will be presented in the next section. Thereafter, we provide the results of our simulation. Next, we analyse the results using stepwise multiple linear regression, and we will discuss these results in the subsequent section. We conclude with some final thoughts and suggestions for future work.
Methods
-
Simulation scenario, iterations and phases
- 2.1
- We run our simulation using the Netlogo simulation environment. It provides a means to do agent-based social simulation. Agent-based social simulation is an application of two areas, namely agent-based computing and computer simulation to a third area, social science (Davidsson 2002). Agent-based computing is mainly aimed at the interaction between distinct computer software programs called agents. Computer simulation is a method by which computers can simulate real world behaviour. Unlike agent-based computing, computer simulation does not necessarily employ agents. It uses for instance statistical models and Bayesian models to simulate and study the behaviour of liquids (Allen & Tildesley 1999). Agent-based social simulation allows one to study the dynamics of social interaction such as networked innovation, without the need to implement an intervention system in practice to pilot its workings. This is especially useful if researchers have a one-shot chance of intervening, when intervention is very costly, or when experimental participants are scarce.
- 2.2
- Besides the fact that there is no need to intervene in a real-world setting to test the functioning of the model, there are a number of other advantages to the modelling approach we employ. Meisel and Collins (1973) highlight four advantages of simplified simulation models. First, a simplified model may be less expensive in terms of modelling time and computational power needed to run the model. Second, a simplified model may require fewer input requirements. Third, a simplified model may be easier to transfer or combine with other models, since it employs few and compound variables, which translate more easily to variables in other models. Finally, a simplified model may be easier to interpret, since it reduces the complexity of the model in terms of number of variables, and the number of possible interdependences between variables.
- 2.3
- Also, the model that we built is a representation of reality, and is based on extensive literature research on the factors that may influence the situation at hand. This allows for simulating the behaviour in networked innovation. Yet, it is impossible to take into account each and every factor, and accounting for each and every interdependence between factors makes it even harder to resemble reality closely enough. Often, such models tend to undersimplify, and yield behaviour that is far from a correct representation of reality. On the other hand, we have Ockham's razor, which suggest that we leave out variables that either contribute little to nothing to the simulation result or make the model unnecessarily complex. Though, there is always the possibility of leaving out too many variables (the model tends to oversimplify) his simulation model. Hence, a simulation model should have a complexity that suits the modelling objectives and the available data. In this case, empirical data is not within the authors' reach, which makes it difficult to estimate the model fitness using the same, data-driven supervision employed by Gilbert and Gutierrez (1973) in their plant-aphid-parasite model.
- 2.4
- The agent-based social simulation that we developed comprises a simulation scenario. A simulation scenario is a workflow, or a number of actions that has to be performed during the simulations. Actions can be performed multiple times, and they often take place in pre-defined sequences. When multiple sequences are run in a simulation, we call them iterations. An iteration often influences the subsequent iteration by means of reinforcement, as is the case with our simulation. An iteration consists of multiple phases, to distinguish different types of activities performed during the iteration. During an iteration, we start off with an initialisation phase to set up the agent's and environment's parameters; this is followed by a number of phases in which the agents interact. Akin to a simulation of agent coalition formation by Klusch and Gerber (2002), we distinguish four phases (as depicted in Figure 1):
- Initialisation: The agent and environment parameters are set up
- Simulation: The candidate coalitions are determined
- Negotiation: Coalitions are formed
- Evaluation: The winning coalition and reinforcement is determined
Initialisation
- 2.5
- The simulation commences with setting up the network of agents given a predefined network density (Setup Network). Network nodes represent individuals and the edges form their relationships. Two individuals are said to be related when the agents are known to each other. Agents receive initial values for the parameters age, Belbin personality and gender (Setup Agents). Based on their position in the network, the agents' betweenness centrality (Brandes 1994) is estimated (Calculate Betweenness Centrality). Betweenness centrality tells us how dependent others are on an individual in a network. For instance, when we have two companies A and B, and only one person in company A connects to company B, then the employees in companies A and B are very much dependent on that single person in terms of information exchange. As a result, that person will have high betweenness centrality. Intuitively, having such a good network position leads to increased power. Also, high betweenness centrality will increase the creativity of an agent (Calculate Creativity).
Simulation
- 2.6
- During the simulation phase, the initial parameters and the calculations of betweenness centrality and creativity will be used to let the agents generate new 'ideas' (Generate Ideas). The ideas are abstract and do not own any content. They receive a value based on the creativity calculation performed in the initialisation phase (Assign value to ideas). Based on the idea value and the betweenness centrality, an agent's power is determined (Compute agents' power). An agent that has high power is more likely to convince others of the value of an idea. Besides, if it has high betweenness centrality, it may have more decision power, as other agents are dependent on this agent. Power and social similarity (age, gender, personality) (Ibarra 1992; McPherson et al. 2001) contribute to the likelihood that an agent will be selected for cooperation, the so-called agent score (Find candidate coalitions). For instance, if agent A has high power and is very similar to agent B, then agent B will most likely choose agent A to cooperate with (and form a coalition).
Negotiation
- 2.7
- We use the Shapley value, a measure well known in game theory, to calculate the value of prospective coalitions. The Shapley value calculates the added value of forming a coalition with another agent over going at it alone (Calculate Dyads' Strength). Subsequently, dyads are formed based on the calculated dyad strength: the dyad which has the highest prospective value is formed (Form Dyads). It must be noted that a coalition must be at least as strong as the accumulated strength of its members (superadditivity). In fact, a coalition must be stronger than the accumulated strength of its members (monotonicity). In this case, agents are compelled to cooperate by setting the individual gain to zero. The latter reflects that in real life one inherently needs support to have one's idea accepted by the community. To do so, we form coalitions (Kotter 1996). As opposed to humans, agents always play rationally, and thus choose to form a coalition with the highest-scoring prospective coalition. That is, a coalition may consist of zero to multiple dyads (Accumulate Dyads / Form Coalitions). Next, the coalitions' strengths are calculated (Compute Coalitions' Strength).
Evaluation
- 2.8
- Finally, a winning coalition is determined, that is, the coalition that has the highest accumulated power (Declare Winning Coalition). Payoff in the form of additional power (in the next iteration) is given to the agents of the winning coalition (Payoff Winning Coalition). Payoff is divided among members of the coalition, relative to their power (Divide Payoff among Members). No payoff is given to non-winning agents, for in the next iteration, power for all agents is normalized between 0 and 100, which implies a relative change for all agents irrespective of their payoff in the previous iteration. The power update gives us insight into the overall emergent behaviour in networked innovation. More specifically, we see how agent power changes, and how this influences the formation of coalitions and the structure of coalitions.
- 2.9
- In sum, the simulation expresses dynamic behaviour in two ways. First, the agents generate ideas based on their creativity, plus a random value. In turn, this affects the power of an agent. Second, agents that belong to a winning coalition receive a positive update of their power. One may call the result reputation.
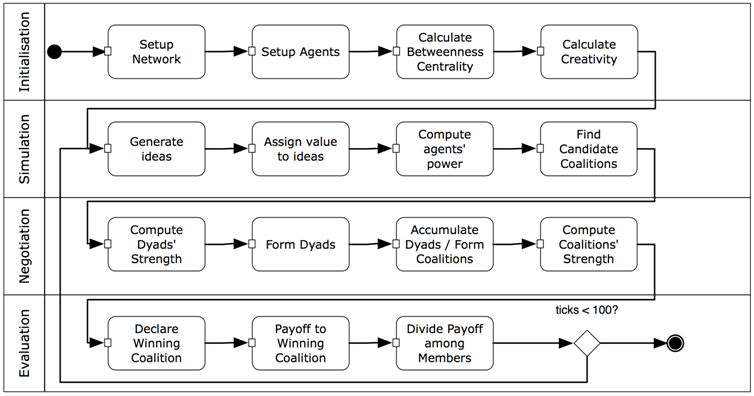
Figure 1. The activity flow of one iteration. Agent interaction model
- 2.10
- The above overview of iterations and phases does not by itself make a simulation run. In agent-based simulation, agents have an internal reasoning model. This model may be regarded as the internal reasoning structure of an agent and allows an agent to perceive other agents and its environment. Figure 2 shows the internal reasoning structure of our agents. Note that every agent is the same by nature, but initial parameters such as gender, age and personality may vary per agent.
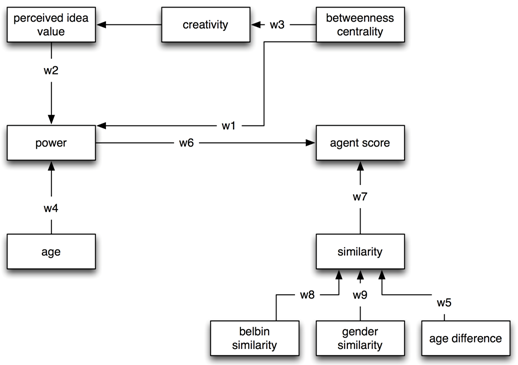
Figure 2. The agent internal reasoning model; for a detailed description, see text Social network setup
- 2.11
- Two main factors were used to determine the setup the social network: 1) number of turtles and 2) network density. Let Gn,N denote a network having n edges and N vertices. The vertices V1 to VN are represented by the number of turtles (agents). The edges E1 to En are represented by relationships between the turtles. Network density describes the probability pe that a relationship E is formed between two turtles (pe = N * network density). In other words, it is the number of relationships that is formed, as a proportion of the total number of edges that can be formed ((N*N/2)). It similar to Erdös and Rényi's formation of a random graph (Erdös & Rényi 1960), yet the probability p that an edge E is formed between two vertices Vx and Vy, is equal to the network density.
Agent reasoning model
Weights
- 2.12
- There are two factors that mainly influence the decision to form a coalition: 1) power and 2) homophily. Power and the similarity between two individuals (homophily) directly influence the agent's score. The agent's score represents the likelihood that agent A is interested in forming a coalition with agent B. There are seven other factors that indirectly contribute to an agent's score through the two central factors. The factors (including the agent score) are connected through weights (Figure 2), to indicate the effect of one factor on another. The value of the weights is not decided upon arbitrarily; literature was used to determine their value. The value per weight may vary, as is shown in Table 1. Note that it is not a goal to perfectly and precisely display reality in this model. To do so, we would have to include all possible factors and the exact weights between them to exhibit the appropriate behaviour. We merely seek to simulate behaviour that sufficiently closely resembles reality. In fact, it is common knowledge among agent-based modelling researchers that a more complex model often results in a less representative simulation of a situation. In our practice, this means we included relatively few factors in our simulation model to maximise outcome.
Table 1: Weights, their values, and origin in literature Weight Value Literature w1 0.45 (Brass 1984; Ibarra 1992, 1993; Krackhardt 1990; Perry-Smith 2006; Simon 1982) w2 0.45 (Klein & Sorra 1996) w3 0.67 (Kraatz 1998; Kratzer & Lettl 2008; Tsai & Ghoshal 1998) w4 0.1 (Burkhardt & Brass 1990) w5 1 (Ibarra 1993; McPherson et al. 2001) w6 1 (Ibarra 1992; Kotter 1996) w7 1 (Ibarra 1993; McPherson et al. 2001) w8 0.25 (Ibarra 1993; McPherson et al. 2001) w9 0.25 (Ibarra 1993; McPherson et al. 2001) - 2.13
- The concept of betweenness centrality originates from Social Network Analysis (Wasserman & Faust 1994) and is used to express someone's position in a network. It measures how dependent others are on a target node (individual) in a network. It is computed by the number of shortest paths between individuals that pass through a node, as a proportion of all shortest paths possible. In our case, betweenness centrality measures how dependent people are on one another if they want to connect. People cannot form a coalition if there is no path that connects them. If an agent possesses high betweenness centrality, agents very likely have to pass it to reach any one agent in the network. Betweenness centrality has an impact on a number of factors. First, people that are on the edge of two networks, and thus have higher betweenness centrality, are more likely to be creative or innovative than others (Kratzer & Lettl 2008; Tsai & Ghoshal 1998). To take this one step further, interorganisational ties may advance social learning, thereby contributing to organisational growth (Kraatz 1998). Secondly, central individuals are found to be more powerful (Brass 1984;Ibarra 1992, 1993; Krackhardt 1990; Perry-Smith 2006; Simon 1982).
- 2.14
- Age and perceived value of an idea are also associated with power. Age is found to correlate positively with power (Burkhardt & Brass 1990). Klein and Sorra (1996) suggest that 'innovation-values fit', the extent to which an innovation (idea) fits the perceiver's values, influences support for an innovation. In our model this is represented by the perceived value of an idea.
- 2.15
- Homophily, the similarity between people, has a positive influence on support and friendship relationships (Ibarra 1992). Various types of homophily may exist, such as age and gender (McPherson et al. 2001). For our model, we use age, gender and personality to express similarity. Besides, a change in thought must be led by a group that has decision power and persuasive power. Kotter (1996) denotes such a group by a guiding coalition.
Variables
- 2.16
- Age is represented as a random value between 15 and 65, the so-called 'working age' of people. Gender is represented as a random value of 0 (female) or 1 (male). Personality is difficult to represent. Multi-attribute personality scores such as the Big Five personality traits have been considered, but for the time being, we choose to use the Belbin Team Roles (Belbin & Belbin 1996). The nine Belbin profiles express the role of a person within a team. Use of these predefined team roles eases the computation of similarity. Agents have a power attribute, which corresponds to their power in the model. Agents' ultimate score is influenced by both their power and their similarity to other agents.
Table 2: An overview of the variables, their initial value, value range, and how they increment. Variable Variable abbreviation Range Increment Initial value Betweenness centrality Cbi 1 – ∞ n/a n/a Creativity Cri 0 – 100 progressive n/a Power Pi 0 – 100 progressive Gender Geni 0 = female, 1 = male n/a random Age Agei 15 – 65 1 15 + Random(50) Belbin personality Beli 1 – 9 1 Random(9) Perceived idea value vij 0 – 100 progressive n/a Similarity Simik -50 – 50 1 n/a Belbin similarity SimBelik 0 – 100 100 (Boolean) n/a Age similarity SimAgeik 0 – 100 1 n/a Gender similarity SimGenik 0 – 100 100 (Boolean) n/a Formulae
Some of the variables in Table 2 do not have an initial value. They are calculated during the simulation. Their respective formulas are shown in Table 3.
After the dyads are formed, coalitions are collected by accumulating all dyads that are interconnected. That is, if dyads {i,j} and {j,k} are formed, the resulting coalition is {i,j,k}. The strength of this coalition {i,j,k} is calculated by taking the sum of strengths of its members i, j, and k.Table 3: Formulae used for determining intermediate value and weights. # Name Abbreviation Formula Variables 1 Creativity Cri Cri = w3 * Cbi w3, Cbi 2 Idea value vij vij = random(100) + Cri Cri 3 Power (update) Pi(t+1) Pi(t+1) = w1 * Cbi +w2 * vij +w4 * agei + Pi(t) w1, Cbi , w2, vij, w4, agei, Pi(t) 4 Similarity Simik Simik = w8 * SimBelik + w9 * SimGenik - w5 * SimAgeik w8, SimBelik, w9, SimGenik, w5, SimAgeik 5 Agent score Scorej Scorej = w7 * Simik + w6 * Pi w7, Simik, w6, Pi 6 Dyad score Dyadij Dyadij = Scorei + Scorej – individual_gaini - individual_gainj Scorei, Scorej, individual_gaini, individual_gainj Procedure and data collection
- 2.17
- During execution of the simulation model we set two parameters using parameter sweeping to see how they influence coalition formation among agents: 1) network density (number of relationships divided by the number of total possible relationships) and 2) number of turtles (number of network participants). In parameter sweeping, we vary the values for these independent variables in a structured way within a predefined range. Parameter sweeping allows one to report and analyse the dynamics of simulations within a wide parameter space. It requires little human effort, as one does not have to enter all parameter combinations manually (Brueckner & Van Dyke Parunak 2003). The range of the network density parameter varies from .01 to 0.05 with an increment of .01 (5 values). The range of the number of turtles parameter varies from 2 to 30, with an increment of 1 (29 values). This results in 145 possible combinations of parameters. Each combination of the parameters (simulation run) is executed 10 times to yield stable results. This implies that in total we run 1450 simulations. We observe the following parameters for their fluctuations and to find relationships with the average power per winning coalition:
- network density: The extent to which relationships are formed as a function of all possible relationships
- number of turtles: The total number of participants in the network
- average-betweenness-per-winning-coalition: We measure the average betweenness centrality of the members of a winning coalition to see if there is a relationship between the independent variables and this dependent variable
- average-idea-value-per-winning-coalition: We measure the average idea value of the members of a winning coalition to see if there is a relationship between the independent variables and this dependent variable
- max-power-per-winning-coalition: We measure the highest power of a member of a winning coalition to see if there is a relationship between the independent variables and this dependent variable
- max-idea-value-per-winning-coalition: We measure the highest idea value of a member of a winning coalition to see if there is a relationship between the independent variables and this dependent variable
Data Analysis
- 2.18
- We will analyse the simulation results in two steps. First, we use multiple regression analysis to create a model that uses the independent variables to predict the dependent variable average power per winning coalition. Second, we investigate the validity of the model by analysing the correlation between its residuals (Durbin-Watson statistic), as regression assumes absence of such correlation. A Durbin-Watson statistic near 2 implies that there is no correlation between adjacent residuals. When using regression, it is key that the residuals be independent.
Results
- 3.1
- A total of nine variables were exported from the simulation to determine if and to what extent they predicted the average power per winning coalition. The correlation coefficients for the variables using Pearson Bi-variate correlation are provided in Table 4. High correlation exists between the pairs {total number of coalitions, number of turtles}, {max betweenness per winning coalition, average betweenness per winning coalition}, {max idea value per winning coalition, average idea value per winning coalition}. Moderate correlation exists between the pairs {max betweenness per winning coalition, average power per winning coalition},
Table 4: Correlation coefficients for each of the variables. average power per winning coalition network density number of turtles average betweenness per winning coalition average idea value per winning coalition max power per winning coalition max idea value per winning coalition average power per winning coalition 1.00 network density -.28 1.00 number of turtles -.59 .00 1.00 average betweenness per winning coalition -.57 .33 .41 1.00 average idea value per winning coalition .05 .07 .14 .29 1.00 max power per winning coalition .26 .12 -.08 .11 .30 1.00 max idea value per winning coalition -.38 .22 .41 .56 .76 .29 1.00 - 3.2
- The outcome of multiple regression analysis using the stepwise method is presented in Table 5. Table 5 shows the predictive values for the variables of the best scoring model in which six variables were included.
Table 5: Multiple regression analysis of the simulation for average power per winning coalition. Six variables were included in the model, sorted in the order they were entered. b SE b β Constant 42.42 2.95 Number of turtles -.44 .03 -.31* Average betweenness per winning coalition -.33 .02 -.27* Max power per winning coalition .56 .03 -.29* Network density -115.39 13.43 -.14* Average idea value per winning coalition .31 .02 .50* Max idea value per winning coalition -.24 .01 -.54* Note. R2= .68. * p < .001 - 3.3
- Using the stepwise method, a significant model emerged (F6,1443 = 514,675, p < 0.001). As shown in Table 5, two variables have slightly larger predictive capability on the average power per winning coalition: number of turtles and max betweenness per winning coalition. The R2 shows that the variables account for 68% of the predictability of average power per winning coalition. The variable network density yielded no significant results. To make sure no auto-correlation exists we used the Durbin-Watson statistic. A Durbin-Watson value of 1.80 (near 2) implies that there is no auto-correlation.
Discussion
- 4.1
- The correlation scores in Table 4 inform us about the co-occurrence of variables. We see that, as the network size (number of turtles) increases, so does the total number of coalitions. This is to be expected, as a larger network implies more candidate connections between people. However, a decreasing network density may have a counter effect on the number of coalitions that is formed. Most important for the multiple regression analysis is that there is no relationship between the independent variables (predictors) number of turtles and network density. Otherwise, the multiple regression model could not be written in the form of Y = c+b1X1+b2X2.
- 4.2
- The R2 of .68 indicates that the variables in Table 5 account for 68% of the predictive value of the average power per winning coalition. Our results are in contrast with literature that shows that betweenness centrality influences power within networks (Brass 1984). Table 5 shows that the average betweenness centrality of a winning coalition has negative predictive power on the average power of a winning coalition. The study by Brass, though, was not designed to take into account innovation within networks, a special case of social networks. Subsequently, we see a positive association of the average idea value per winning coalition and the power of a coalition, in line with our reasoning.
- 4.3
- Another value that stands out is the network density. The reason for this is that we used relatively small variations of the network density, thus compensating for the supposedly high association observed in Table 5.
- 4.4
- A notable observation we find in a combination of Tables 4 and 5. Average betweenness per winning coalition correlates moderately high with the average power per winning coalition (-.57). Besides, it has a negative predictive power on the average power per winning coalition. A high betweenness often means that one has a lot of contacts in one's social network that others do not have. Having lots of contacts implies one cannot maintain close relationship with all contacts, leading to an increased number of weak ties. Literature is suggestive of the strength of weak ties (Granovetter 1973; Hauser et al. 2007) in social networks (Granovetter 1973). Especially, networked learning (Jones et al. 2008) and networked innovation (Burt 2004; Hauser et al. 2007) value weak ties as predictors of successful cooperation in networks. Our results imply practically the same; Table 5 shows that average betweenness per winning coalition has negative predictive power for the average power per winning coalition. In other words, having high betweenness centrality makes it easier to build a successful coalition as one needs a lower average power to succeed.
- 4.5
- Another interesting observation lies in the negative association with the number of turtles on the average power per winning coalition (Table 5). This implies that as the network size increases, it becomes easier to build a successful coalition. Although other factors may influence the process as well, we may conclude that it may be easier to form a successful coalition in a larger network.
- 4.6
- There are two implementations of the Shapley value. First, we have the situation in which all agents form a coalition at once, the one that we used in this simulation. Second, the agents may join a coalition one after another. In case of a high-betweenness agent attracting a lot of partners, we could consider using the second method of coalition formation to further optimise the simulation. Besides improving the way the Shapley value is calculated and used for the formation of coalitions, we may decide to implement the nucleolus. The Shapley value does not consider the expected contribution of an agent to a coalition, whereas the nucleolus (Schmeidler 1969) does. During payoff distribution, the nucleolus tries to minimise the maximum dissatisfaction of participants in a coalition.
Conclusion
- 5.1
- The present study investigated whether network characteristics and network member's characteristics influence the average power per winning coalition. To aid people in their search for optimal coalitions, we studied the dynamics of coalitions in networked innovation. We ran a simulation of networked innovation under rational behaviour (to yield optimal decisions), and monitored the variable variations. Multiple regression analysis led to a model that predicts the average power per winning coalition as a function of network size and network density.
- 5.2
- The current study allows us to make two interesting observations. First, average betweenness negatively influences the average power per winning coalition. This means that having high betweenness centrality makes it easier to build a successful coalition, as one needs lower average power to succeed as a coalition. Second, the number of network participants negatively influences the average power per winning coalition. This implies that in a larger network, it may be easier to form a successful coalition.
- 5.3
- The regression model presented in this paper offers interesting uses. Our simulation presumes rational play by network participants. In other words, optimal decisions are made concerning the formation of coalitions. Assuming rational play, we compute how coalitions should ideally be formed within networked innovation. An important implication of this model is that we can assist in real life networked innovation by recommendation of optimal coalitions (with a necessary average power or betweenness centrality), given that we know what the network density and network size are.
Future Work
- 6.1
- The model presented in this work was based on extensive literature review. The research articles that we studied employ empirical methods to determine if and what relationships between variables exist. We combined the outcomes of several influential studies to develop a simulation model. We programmed agents on an individual level to study the emergent dynamics of networked innovation (macro level), an approach that is characteristic for agent-based social simulation. The next step in the process of deriving a model that correctly describes reality is the validation of the model. We plan to validate our model by testing its behaviour against empirical data. Subsequently, we will use the model to generate optimal coalitions for innovation in networks in an empirical setting.
References
-
ADAMIDES, E. D., & Karacapilidis, N. (2006). Information technology support for the knowledge and social processes of innovation management. Technovation, 26(1), 50–59. . [doi:10.1016/j.technovation.2004.07.019]
ALLEN, M. P., & Tildesley, D. J. (1999). Computer Simulation of Liquids (p. 385). Oxford University Press, USA. Retrieved from http://books.google.nl/books?hl=nl&lr=&id=O32VXB9e5P4C&oi=fnd&pg=PR17&dq=%22computer+simulation%22&ots=qmPZ_encmd&sig=ott59hx3M-uRfu7y1AZQod7mEfY#v=onepage&q&f=false.
BEHAM, G., Kump, B., Ley, T., & Lindstaedt, S. (2010). Recommending knowledgeable people in a work-integrated learning system. Procedia Computer Science, 1(2), 2783–2792. . [doi:10.1016/j.procs.2010.08.003]
BELBIN, M., & Belbin, R. (1996). Team roles at work (2nd ed., p. 162). Butterworth-Heinemann Oxford. Retrieved from http://www.lavoisier.fr/notice/frMTOALX3HXOQALO.html
BRANDES, U. (1994). A Faster Algorithm for Betweenness Centrality. Journal of Mathematical Sociology, 25, 163–177. [doi:10.1080/0022250X.2001.9990249]
BRASS, D. J. (1984). Being in the Right Place: Structural Analysis of Individual Influence in an Organizaton. Adminstrative Science Quarterly, 29(4), 518–539. [doi:10.2307/2392937]
BRUECKNER, S. A., & Van Dyke Parunak, H. (2003). Resource-Aware Exploration of the Emergent Dynamics of Simulated Systems. AAMAS'03 (pp. 718–788). Melbourne, Australia: ACM.
BURKHARDT, M. E., & Brass, D. J. (1990). Changing Patterns or Patterns of Change: The effects of a change in technology on social network structure and power. Administrative Science Quarterly, 35(1), 104–127. [doi:10.2307/2393552]
BURT, R. S. (2004). Structural Holes and Good Ideas. American Journal of Sociology, 110(2), 349–399. . [doi:10.1086/421787]
CASSIMAN, B., & Veugelers, R. (2006). In search of complementarity in innovation strategy: Internal R&D and external knowledge acquisition. Management Science, 52(1), 68. [doi:10.1287/mnsc.1050.0470]
DAVIDSSON, P. (2002). Agent Based Social Simulation : A Computer Science View. Journal of Artificial Societies and Social Simulation, 5(1), 4–8.
DE CHOUDHURY, M., Sundaram, H., John, A., & Seligmann, D. (2008). Dynamic prediction of communication flow using social context. Proceedings of the nineteenth ACM conference on Hypertext and hypermedia - HT '08, 49. New York, New York, USA: ACM Press. . [doi:10.1145/1379092.1379105]
ENSMINGER, D. C., & Surry, D. W. (2008). Relative ranking of conditions that facilitate innovation implementation in the USA. Australasian Journal of Educational Technology, 24(5), 611–626.
ERDÖS, P. & Rényi, A. (1960), On The Evolution of Random Graphs, Publ. Math. Inst. Hung. Acad. Sci., no. 5, pp. 343–347
GILBERT, N., & Gutierrez, A. P. (1973). A plant-aphid-parasite relationship. Journal of Animal Ecology, 42(2), 323–340. [doi:10.2307/3288]
GILBERT, N., Pyka, A., & Ahrweiler, P. (2001). Innovation Networks - A Simulation Approach. Journal of Artificial Societies and Social Simulation, 4(3). Retrieved from https://www.jasss.org/4/3/8.html.
GRANOVETTER, M. S. (1973). The strength of weak ties. American journal of sociology, 78(6), 1360–1380. JSTOR. Retrieved October 7, 2010, from http://www.jstor.org/stable/2776392. [doi:10.1086/225469]
HARARY, F., Norman, R. Z., & Cartwright, D. (1965). Structural models: An introduction to the theory of directed graphs. New York, NY, USA: Wiley.
HART, S. (1987). Shapley value. The New Palgrave, 318–320.
HAUSER, C., Tappeiner, G., & Walde, J. (2007). The learning region: the impact of social capital and weak ties on innovation. Regional Studies, 41, 75–88. [doi:10.1080/00343400600928368]
IBARRA, H. (1992). Homophily and Differential Returns : Sex Differences in Network Structure and Access in an Advertising Firm. Science, 37(3), 422–447. [doi:10.2307/2393451]
IBARRA, H. (1993). Network Centrality, Power, and Innovation Involvement: Determinants of Technical and Administrative Roles. Academy of Management Journal, 36(3), 471–501. [doi:10.2307/256589]
JONES, C. R., Ferreday, D., & Hodgson, V. (2008). Networked learning a relational approach: weak and strong ties. Journal of Computer Assisted Learning, 24(2), 90–102. . [doi:10.1111/j.1365-2729.2007.00271.x]
KLEIN, K. J., & Sorra, J. S. (1996). The Challenge of Innovation Implementation. Academy of Management Review, 21(4), 1055–1080.
KLUSCH, M., & Gerber, A. (2002). Dynamic coalition formation among rational agents. IEEE Intelligent Systems, 17(3), 42–47. [doi:10.1109/MIS.2002.1005630]
KOTTER, J. P. (1996). Leading Change (p. 208). Harvard Business Press. Retrieved from http://books.google.nl/books?id=ib9Xzb5eFGQC&lpg=PR11&ots=Mvn9eIASZ_&dq=kotter 1996&lr&pg=PR11#v=onepage&q=kotter 1996&f=false.
KRAATZ, M. S. (1998). Learning by Association? Interorganizational Networks and Adaptation to Environmental Change. The Academy of Management Journal, 41(6), 621. . [doi:10.2307/256961]
KRACKHARDT, D. (1990). Assessing the Political Landscape: Structure, Cognition, and Power in Organizations. Administrative Science Quarterly, 35(2), 342–369. [doi:10.2307/2393394]
KRATZER, J., & LETTL, C. (2008). A Social Network Perspective of Lead Users and Creativity: An Empirical Study among Children. Creativity and Innovation Management, 17(1), 26–36. . [doi:10.1111/j.1467-8691.2008.00466.x]
MCPHERSON, M., Smith-Lovin, L., & Cook, J. M. (2001). Birds of a Feather: Homophily in Social Networks. Annual Review of Sociology, 27(1), 415–444. . [doi:10.1146/annurev.soc.27.1.415]
MEISEL, W. S., & Collins, D. C. (1973). Repro-modeling: An approach to efficient model utilization and interpretation. Systems, Man and Cybernetics, IEEE Transactions on, (4), 349–358. [doi:10.1109/TSMC.1973.4309245]
PERRY-SMITH, J. (2006). Social Yet Creative: The Role of Social Relationships in Facilitating Individual Creativity. Academy of Management Journal, 49(1), 85–101. [doi:10.5465/AMJ.2006.20785503]
SCHMEIDLER, D. (1969). The nucleolus of a characteristic function game. SIAM Journal on Applied Mathematics, 1163–1170. [doi:10.1137/0117107]
SELTEN, R. (1998). Features of Experimentally Observed Bounded Rationality. European Economic Review, 42, 413–436. [doi:10.1016/S0014-2921(97)00148-7]
SHAPLEY, L. S. (1953). A value for n-person games. Contribution to the Theory of Games. (H. W. Kuhn & A. W. Tucker, Eds.)Annals of Mathematics Studies, 2, 28.
SIE, R. L. L., Bitter-Rijpkema, M., & Sloep, P. B. (2010). A Simulation for Content-based and Utility-based Recommendation of Candidate Coalitions in Virtual Creativity Teams. Procedia Computer Science: RecSysTEL2010, 1(2), 2883–2888. [doi:10.1016/j.procs.2010.08.015]
SIE, R. L. L., Van Engelen, B. J., Bitter-Rijpkema, M., & Sloep, P. B. (2012). COCOON CORE: CO-author Recommendation based on Betweenness Centrality and Interest Similarity. In N. Manouselis, K. Verbert, H. Drachsler, & O. . Santos (Eds.), Recommender Systems for Technology Enhanced Learning: Research Trends & Applications. Springer.
SIMON, H. A. (1982). Models of bounded rationality. MIT Press.
SIMON, H. A. (1991). Bounded rationality and organizational learning. Organization Science, 2(1), 125–134. [doi:10.1287/orsc.2.1.125]
TSAI, W., & Ghoshal, S. (1998). Social Capital and Value Creation : The Role of Intrafirm Networks. The Academy of Management Journal, 41(4), 464–476. [doi:10.2307/257085]
WASSERMAN, S., & Faust, K. (1994). Social Network Analysis: Methods and Applications (p. 825). Cambridge: Cambridge University Press. [doi:10.1017/CBO9780511815478]