
 Abstract
- Ethnocentrism refers to the tendency to behave differently towards strangers based only on whether they belong to the ingroup or the outgroup. It is a widespread phenomenon that can be triggered by arbitrary cues, but the origins of which are not clearly understood. In a recent simulation model by Hammond and Axelrod, an ingroup bias evolves in the prisoners' dilemma game. However, it will be argued here that the model does little to advance our understanding of ethnocentrism. The model assumes a spatial structure in which agents interact only with their immediate neighbourhood, populated mostly by clones, and the marker becomes an approximate cue of whether the partner is one. It will be shown that agents with an ingroup bias are successful compared to unconditional co-operators since they only exclude non-clones, but are outcompeted by less error-prone kin identifiers. Thus, the results of the simulations can be explained by a simple form of kin selection. These findings illustrate how spatial assumptions can alter a model to the extent that it no longer describes the phenomenon under study.
- Keywords:
- Agent-Based Modelling, Ethnocentrism, Prisoners' Dilemma, Spatial Interactions, Validation
Introduction
- 1.1
- Human beings are adapted to living in groups. Ethnocentrism refers to the tendency to behave differently towards people depending on whether they belong to the same group, the ingroup, or some other group, the outgroup. Ethnocentrism is sometimes referred to as an ingroup bias (Brewer 1999), defined as beneficial behaviour towards the ingroup but differentiating it from previous definitions by not necessarily including outgroup hostility (Sumner 1906, LeVine and Campbell 1972). The two terms will here be used interchangeably. There is vast evidence for an ingroup bias, both from field studies and laboratory experiments (Brewer and Campbell 1976, Kramer and Brewer 1984, Yamagishi and Mifune 2009), but it is not clearly understood why people are sometimes willing to take on a short-term cost based on ethnic markers. Within small groups, apparently altruistic behaviour can often be explained by kin selection (Hamilton 1964) or reciprocity (Trivers 1971). However, people co-operate in groups large enough to expand beyond interactions with relatives and people they know.
- 1.2
- In-group bias can be triggered by minimal cues from arbitrary group definitions (Tajfel et al. 1971, Doise et al. 1972, Ahmed 2007). There is evidence that ingroup bias works on an implicit level (Otten and Wentura 1999) and the bias seems to be regulated by the hormone oxytocin, suggesting deep biological roots (De Dreu et al. 2011). The objective for an evolutionary model of ethnocentrism is thus to find minimal conditions for when group discrimination emerges from arbitrary group markers that are not subject to direct reciprocity or kin recognition.
- 1.3
- The model that will be investigated here was presented by Hammond and Axelrod (2006b), and aimed at finding minimal conditions for ethnocentrism to emerge. In the model, agents have a group phenotype and one strategy for how to play in a prisoners' dilemma, co-operate or defect, towards members of the ingroup, and one for how to play towards members of the outgroup. Defection is always rational in a one-shot game, while co-operation is socially optimal. An ethnocentric agent is defined as one who co-operates with the ingroup and defects towards the outgroup. Agents populate a toroidal lattice where they communicate only with their immediate neighbours. Agents are born with a marker (group membership) and their strategies, and reproduce, onto neighbouring patches, according to how well they have performed in previous interactions.
- 1.4
- The model is successful in the means of providing a breeding ground for ethnocentric agents, which come to dominate the population. As was acknowledged already in a previous publication, however, the strict spatial structure is both a necessary and sufficient condition for co-operation to emerge in the model (Hammond and Axelrod 2006a) and it causes such high degrees of relatedness in agents' neighbourhoods that the model was first launched as an illustration of the "armpit effect" (distinguishing strangers from unfamiliar kin) (Axelrod et al. 2004).
- 1.5
- Nevertheless, the model has gained much interest among researchers of ethnocentrism, from pure replication studies (Wilensky and Rand 2007) to further analyses and extensions of the model. It is also part of the simulation software NetLogo's Models Library (Wilensky 2003). There are several simulation studies that have tried to explain the results of the model. It has been observed that humanism (indiscriminate co-operation) is the most successful strategy in the first rounds of the simulations, and that ethnocentrism triumphs humanism first when the population is dense (Schultz et al. 2008), hypothesized to be a product of ethnocentric exploitation of humanitarians rather than free-rider suppression (Schultz et al. 2009), and then hypothesized to the contrary (Kaznatcheev 2010).
- 1.6
- In the words of Kaznatcheev (2010), the model "expand[s] beyond random interactions to facilitate the emergence of cooperation", and the strong effect of the spatial structure found already by Hammond and Axelrod (2006a) should raise concerns on its implications for ethnocentrism. In one study, viscosity is kept at high levels, but the structure is changed into Barabási-Albert networks (and sexual reproduction is added). The results "indicate that the spread of favoritism towards similar others highly depends on the network topology and the associated heterogeneity of the studied population" (Lima et al. 2009). Another simulation study concludes that kin selection may be a driving force in the model (Li in preparation). Finally, it has been concluded that while ethnic markers maintain co-operation, what creates it "is not the visible group tags of agents, but rather children residing close to their parents" and that spatial viscosity is a mechanism to increase the probability of self-interaction (Kaznatcheev and Schultz 2011).
- 1.7
- It could thus be that the model, through spatial viscosity, creates a setting for kin selection to initially favour co-operation towards similar others, and that this later on generalises into ethnocentrism. We will see, however, that in the model, spatial viscosity and markers are two sides of the same coin: they both function as a means for self-identification.
- 1.8
- We will start out with a more detailed description of the Hammond-Axelrod model. Then the rest of the paper will scrutinise the model through simulations to provide a fuller understanding of what makes the ethnocentric strategy successful and draw conclusions on whether the ethnocentric strategy in the model has any bearing on the real-world phenomenon we want to describe.
- 1.9
- First, the significance of the spatial structure will be examined, by replicating previous findings that the structure in itself generates co-operative interactions, and that with only markers and without spatial structure, both ingroup and outgroup will be defected against. We will also see how large the neighbourhood may be before the ethnocentric strategy fails. Second, it will be examined why ethnocentric agents are more successful in the model than universal co-operators, and how robust the strategy is against misidentifying kin. Third, the significance of the number of markers in the model will be investigated together with the resistance of the ethnocentric strategy against pure kin discriminators. Finally, the main findings will be summarised and conclusions drawn for the applicability of the model and what can be learnt from it for computer modellers using spatial structures.
Description of the model
- 2.1
- Below follows a description of the Hammond–Axelrod model (2006b) with standard parameter settings. For a more formal description, see the appendix of their paper.
- 2.2
- Agents populate a toroidal lattice consisting of 50*50 patches, each with room for at most one individual. The lattice is empty in the beginning, becoming populated through immigration and reproduction as described below. Each agent has one out of four visible ethnic markers, one strategy for how to play towards an ingroup member (exhibiting the same ethnic marker), co-operate or defect, and one strategy towards outgroup members. The simulation runs for 2,000 rounds and the outline of a round in the simulation is the following:
- 2.3
- Immigration. An agent with random traits enters the population. The potential to reproduce (PTR) of all agents is reset to 0.12.
- 2.4
- Interaction. Each agent interacts once with each of its immediate horizontal and vertical neighbours in a prisoners' dilemma. The agent observes the ethnic marker of the partner and chooses a strategy accordingly. A co-operating agent reduces its PTR by 0.01 and increases that of its partner by 0.03.
- 2.5
- Reproduction. Each agent is chosen in a random order and reproduces one offspring with the probability of their PTR onto an empty neighbouring patch, if there is one. The offspring inherits the traits of its parent, but may mutate into another group or another in- or outgroup strategy, with a probability of 0.005 per trait. An agent surrounded by populated patches cannot reproduce at that round.
- 2.6
- Death. Each agent has a probability of 0.1 to die.
- 2.7
- Simulations will also be run for a version of the model with random interactions (without spatial structure). The maximum size of the population will be kept at 50*50 = 2,500, implemented by multiplying the PTR of all agents by one minus the density (population size divided by 2,500). The more crowded the population, the less likely it is for each agent to reproduce.
- 2.8
- The original simulations were run in NetLogo. As the advantages of using NetLogo, such as visualisation of spatial dynamics, will not be used here, all simulations will be programmed directly in Java for full flexibility. Replicating in a different language also serves to test the robustness of the implementation with respect to the conceptual model (as discussed in Wilensky 2003).
- 2.9
- Results will be averaged over 100 runs, and frequencies of strategies will be represented by mean and standard error, as in the original study (Hammond and Axelrod 2006b). Distributions of frequencies of strategies over all runs are slightly skewed due to boundary effects for rare and highly dominant strategies, but the differences between the mean and the median are small, usually less than one percentage unit.
- 2.10
- The program code and documentation is available at: http://www.openabm.org/model/3391
Spatial structure
- 3.1
- Agents populate a toroidal lattice and interact only with their four immediate neighbours. Admittedly, this setting bears little resemblance to social networks in the real world. Nor is the model (or minimal models in general) constructed to imitate the world, but rather to find minimal assumptions that can lead to observed phenomena. Is the assumption of the spatial structure credible, then, or is it an oversimplification creating the results? We will first see what impact the assumptions of spatial viscosity have on the results and then examine how generalisable they are to resemble actual social networks.
The lattice structure with neighbouring offspring induces co-operation
- 3.2
- This section will replicate previous findings that the lattice structure causes co-operation to dominate, while only markers do not (Hammond and Axelrod 2006a).
- 3.3
- In a null model, where all agents are equally likely to be selected as interaction partners and there are no markers, the share of co-operative agents averages 12% (±0.3 standard error). This is higher than in the previous simulation, but with four interactions per round and agent, which is the maximum number of neighbours in the spatial model, instead of one, the share drops to 3.4%, comparable to the less than 5% found previously. Adding a lattice structure with neighbouring offspring increases the share of co-operators to 80% (80.4±0.3).
- 3.4
- With random interactions and four markers, ingroup biased agents reach 23% (23.0±0.8). With four interactions per round, which reduces random drift and increases the selection pressure, the number drops to 10% (9.7±0.5) (see Table 1).
Table 1: Population shares of all possible strategies given different numbers of interactions/round and available markers.
Interactions/roundMarkers None Outgroup Ingroup All 1 4 61.0±0.9 10.3±0.5 23.0±0.8 5.6±0.3 2 65.1±0.9 14.4±0.6 14.7±0.6 5.8±0.3 4 4 85.9±0.5 3.2±0.2 9.7±0.5 1.1±0.1 2 89.1±0.3 5.1±0.2 4.8±0.2 1.0±0.1 - 3.5
- Thus, the lattice structure changes the strategic structure of the interactions such that defection is no longer the successful strategy. With random interactions, co-operating with ingroup members is an exception, and an ingroup biased agent has a larger share than other (contingent) co-operators only because it co-operates with fewer agents. With only two markers, when in- and outgroup biased agents co-operate with the same number of agents, they are equally successful. In the spatial model, co-operation gives better payoff than defection and ingroup biased agents out-compete indiscriminate co-operators. The lattice structure is both necessary and sufficient for co-operation to dominate.
- 3.6
- Is it then reciprocity from repeated interactions with the same agents or interactions with kin due to neighbouring offspring that induces the success of the ingroup bias? A previous study showed that it is the latter case. When offspring is located at a random patch on the lattice, the results are similar to the null model (Kaznatcheev and Schultz 2011).
Co-operative strategies require a small neighbourhood
- 3.7
- The specific assumptions of local interactions and neighbouring offspring changed the conditions from favouring defectors to favouring co-operators, and contingent co-operators if discrimination was possible. How specific need these assumptions be? Social networks generally comprise more than a few highly related individuals. How many neighbours are allowed before defectors take over and does the spatial structure need to take the form of a lattice? The question will be examined by varying the number of neighbours in the lattice structure, changing structure into a small-world network, and finally by looking into assorted interactions without an underlying structure.
Varying the number of neighbours
- 3.8
- Varying the span of the neighbourhood shows that ingroup biased agents perform at best with six neighbours (77%±0.5%) and that they tie with defectors at sixteen (48%±1%) (see Figure 1). With only two neighbours, all strategies are almost equally successful. The model is not restricted to exactly four neighbours, but still to an interval from four to fourteen, which is small for ethnocentrism to be expected to be at work.
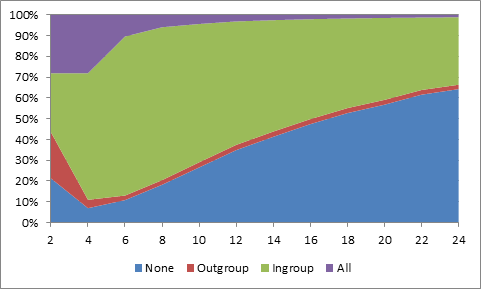
Figure 1. Population share of agents co-operating with no one, only outgroup, only ingroup or everyone with respect to size of neighbourhood. Small-world networks
- 3.9
- While a lattice structure is clearly not reminiscent of social networks, small-world networks (Watts and Strogatz 1998) have been influential in theory and applications. In its regular form, such a network is a regular ring lattice, where agents populate a circle and are connected to their closest neighbours on the circle. It resembles the toroidal lattice structure, but without such artificial restrictions as disabling interactions between grandparents and grandchildren that come from the latter with four neighbours. The regular ring lattice can then be rewired into a small-world network by reconnecting each edge between two connected agents by a probability p to another agent chosen at random over the entire circle. The result is a network where the minimum number of nodes that need to be passed between two randomly selected nodes is greatly reduced and that traits are more easily spread throughout the network. With p = 1, we obtain a random network.
- 3.10
- On a regular ring lattice (p = 0) and greatly reconnected networks (p ≥ 0.3), ingroup biased agents perform worse than on the toroidal lattice. With values in between, however, they perform slightly better, peaking when there is slight reconnection (somewhere round p = 0.05). Ingroup biased agents are most numerous with four or six neighbours, and with p = 0.05, they constitute the largest type up to twenty neighbours, which thus seems to be the maximum on small-world networks with optimal settings (see Table 2).
Table 2: Maximum number of neighbours allowed for the ingroup biased strategy to constitute the majority of the population given different rewiring probabilities p. p 0 0.01 0.05 0.1 0.2 0.3 0.4 0.5 1 Max. neighbours 12 16 20 18 14 10 8 6 4 Non-spatial assortment
- 3.11
- A fixed network structure with neighbouring offspring captures the phenomenon that interactions may take place more often among peers. However, instead of assuming specific social structures to induce assortment, agents could interact with anyone in the population, but more commonly with those sharing its marker. This has been implemented as a weight: all outgroup members have weight 1 and all ingroup members have weight w. Interaction partners are then selected randomly with a probability according to their weight. If the weight is one less than the number of markers, then ingroup members are selected in half of the interactions on average in the initial stages of the simulation. The results are presented in Table 3 and show that larger weights reduce the share of ingroup biased and increases that of outgroup biased agents, except for when the number of markers is large. With increasing weights, co-operating only with outgroup members more and more resembles co-operating with no one. With many markers, however, the number of ingroup members is either small or constituted by a cluster of successful kin co-operators, more reminiscent of social networks with few neighbours.
Table 3: Population shares of all possible strategies given different numbers of markers and weighted probability for interacting with ingroup members. Markers Weight None Outgroup Ingroup All 4 3 62.8±0.9 15.1±0.6 16.2±0.7 6.0±0.3 10 58.5±1.1 24.5±1.0 11.1±0.5 5.9±0.3 10 9 53.9±1.1 17.7±0.7 21.0±0.9 7.4±0.5 100 42.8±1.1 32.4±1.2 13.8±0.7 10.9±0.6 100 99 26.7±1.0 15.9±0.9 37.1±1.2 20.3±1.1 - 3.12
- Thus, for the model to produce a breeding ground for a co-operating strategy, it needs to make specific assumptions on small neighbourhoods populated by offspring, thus maintaining a large share of kin interactions. More general assumptions of non-spatial assortment are not sufficient. In the next section, we will see what makes markers and ingroup bias a successful combination.
Ethnocentrism vs. altruism
- 4.1
- The spatial structure of the model transforms the underlying game such that co-operation is successful instead of defection. Still, when markers and an ability to discriminate based on them are introduced, contingent co-operators will outcompete those who co-operate indiscriminately. This section will provide an explanation as to why this is the case.
Markers are fairly accurate indicators of kinship
- 4.2
- Tracking whether neighbouring agents are kin (that is, they have a common descent, in these simulations meaning they have the same immigrant as their ancestor) shows that 71% of the interactions are between kin with the same marker and that in only 12% of cases do not markers and kinship correspond (see Table 4). If a neighbour belongs to the ingroup, then the probability that the agent is a relative (or, more correctly, a possibly mutated clone of the same immigrant) is 89%. Markers are thus not really "weak and potentially deceptive indicators" of kinship (Axelrod et al. 2004), but rather fairly accurate ones.
Table 4: The share of the total number of connections between two neighbouring agents divided into non-relatives (N), relatives (R), outgroup (O) (agents have different markers) and ingroup (I), together with probabilities for a relative to belong to the ingroup and for an ingroup member to be related. Population Connections NO NI RO RI p(i|r) p(r|i) N/share 1571 2131 16.6% 8.7% 3.5% 71.2% 95.3% 89.2% Std. err. 43 97 0.2% 0.2% 0.1% 0.3% 0.1% 0.2% Ethnocentrics exclude almost only nonkin
- 4.3
- Table 4 suggests why co-operators are so successful with the specific spatial structure of the model: 75% of the interactions are among kin. An ingroup biased agent manages to avoid donations to nonkin, with 89% of their donations being to kin (out of which 61% are direct clones: parent or child). But being selective should come with a risk when your choice is based on crude distinctions, namely that of missing potentially fruitful co-operation with kin. However, such is not the case in this model. A neighbouring relative has a 95% probability of having the same marker. Both ethnocentric and altruistic (co-operating with everyone) agents interact mostly with kin, but an ethnocentric agent manages to exclude many non-related individuals without taking the cost of excluding kin.
- 4.4
- What happens, then, if the marker actually becomes a deceptive indicator of kinship, such that it not only includes some nonkin, but also excludes some kin? One way to investigate this is to leave the mutation rate of the strategies intact, but increase that of the marker. The result is detrimental to the ingroup bias (see Figure 2). At a marker mutation rate of 30%, altruists surpass ethnocentrics. A mutation rate of 50% means that the offspring is equally likely to belong to the ingroup as to the outgroup. With three outgroup markers available, however, offspring and marker are still correlated. At 75%, markers are no indicators of descent, as the offspring has equal probabilities of acquiring any of the markers. In between these two rates, at 60%, also outgroup biased agent surpass those with an ingroup bias, finding more relatives in the other groups. At higher rates, markers are negatively correlated with parent-child relationships, and, although unrealistic, it may be noted that at 90%, outgroup biased agents exclude almost no kin and become more numerous than altruists.
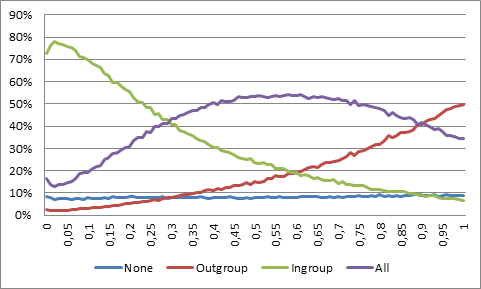
Figure 2. Population share of different strategies with respect to mutation rate of the marker. - 4.5
- If the marker is instead difficult to perceive, such that there is a probability that someone with the same marker will falsely be perceived by an ingroup co-operator to belong to the outgroup, then altruists will take over if ethnocentrics defect in every other interaction with an ingroup member (see Figure 3). Note that an outgroup member will still not be perceived as an ingroup member, why the outgroup will still safely be excluded at high error rates.
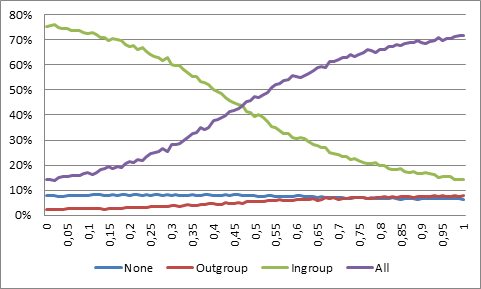
Figure 3. Population share of different strategies with respect to probability that an ingroup biased agent will defect against an ingroup member. - 4.6
- Thus, agents are surrounded mostly by kin. Ethnocentrics outcompete altruists since they are capable of excluding nonkin, while misidentifying kin less than five per cent of the time. The more distant the relative, the higher the probability of misidentification, but a distant relative is also more likely to have mutated strategies. Direct clones, which constitute 43% (43.4±0.2) of the neighbourhood, bear the same marker with a probability of 99.5%. Markers are deceptive mainly by including some nonkin, but only 11% of the time. In the next section, we will see what happens with improved kin recognition.
Ethnocentrism vs. kin discrimination
- 5.1
- Ingroup biased agents fare well from being fairly efficient kin discriminators. Is it then a robust strategy against less error-prone kin identifiers, or is kin identification all there is to the model, with crude markers being nothing but a substitute of kin signals when such are not made available? This will be tested by introducing a new strategy into the model and varying the potential number of markers in the population.
Kin discriminators outcompete ethnocentrics
- 5.2
- Two new strategies are introduced into the model. Agents can discriminate based either on ethnic marker or on kin marker, that is, whether they are of common descent. Thus, contrasting to previous models, some agents can now directly assess whether they are kin or not. As for the ethnic marker, there is a probability of 0.005 that the kin marker will mutate, meaning that child and parent (or any of its relatives) will not be perceived as kin, and that the offspring will become the ancestor of a new family tree. The kin marker is implemented as a reference to the highest node in the family tree, that is, the immigrant or mutated offspring that is the ancestor of the present agent. Note that agents are either group or kin discriminators, and will thus consider only the group or kin marker, respectively. The results show that kin discriminators practically eliminate all other strategies, except for a slight share of ingroup biased agents (see Table 5). Thus, ingroup bias is successful only in the absence of more refined discrimination.
Table 5: Population shares of all possible strategies. None Outgroup Ingroup Nonkin Kin All Share 2.0 1.3 16.4 1.3 76.2 2.8 Std. err. 0.1 0.1 0.9 0.1 0.9 0.1 Ethnocentrics become kin discriminators with many ethnic markers
- 5.3
- Increasing the potential number of ethnic markers in the population makes nonrelated agents less liable to share marker. Indeed, if markers are sufficiently many, then every new immigrant will import a new marker into the population, and ethnic markers will coincide with kin markers. From this we will expect that with more markers, ethnocentrics will be increasingly indistinguishable from kin discriminators and converge to being equally successful. Simulations verify that this is the case and show that the difference goes below ten percentage units at 36 markers.
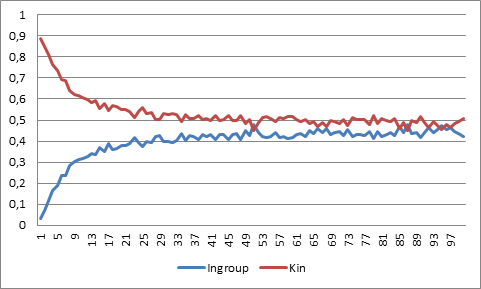
Figure 4. Population share of ingroup biased and kin biased strategies with respect to number of ethnic markers. - 5.4
- Ingroup biased agents are really approximate kin discriminators and do not resist invasion by kin identifiers. In particular, they are less successful than agents in an environment with more refined ethnic markers, which makes the strategy unstable to slight improvements in kin recognition.
Kin discriminators manage without spatial viscosity
- 5.5
- The spatial structure of the model with local interactions and neighbouring offspring produces clusters of relatives and works together with the ethnic markers to avoid giving help to nonkin. This structure is useful also to a kin discriminator, who already avoids giving help to nonkin, but then also ends up in interactions without payoff less often. Is spatial viscosity then a necessary means for kin discrimination to prosper?
- 5.6
- Simulations with random interactions show that two strategies dominate the population: co-operating with no one and co-operating only with kin, with the two strategies being equally successful (see Table 6). The average share R of agents with which an agent has common descent is 28%, so kin discriminators differ from universal defectors in about every fourth interaction (as often as an ingroup biased agent). The difference between the two kinds of agents can be increased by reducing the base PTR and death rate to, say, one tenth of their standard values, while keeping the other parameters intact. Agents will then be more long-lived, compensated by less reproduction every round, while potential costs and benefits from interactions increase relatively. Note that parameter values in the original model are arbitrarily chosen and that it is not obvious what they correspond to in a well-mixed population, so with respect to showing existence of kin discriminative dominance, such a setup is equally valid, and shows the direction when agents encounter more interactions. The result is that kin discriminators increase considerably and that relatedness R at least doubles, both almost reaching levels obtained in the spatially structured standard model with ingroup biased agents.
Table 6: Results from simulations without spatial structure, with standard settings and with reduced PTR = 0.012 and death rate = 0.01. Values are presented with standard error and are the size of the population, degree of relatedness in the population, share of agents co-operating with no one, only outgroup, ingroup, nonkin or kin, or with everyone. Pop. R None Outgroup Ingroup Nonkin Kin All Standard 873 28.1 36.2 5.0 11.7 4.9 39.3 3.0 Std. err. 7 1.9 1.9 0.3 0.8 0.5 1.9 0.2 Reduced 1822 68.7 22.5 4.1 4.2 4.2 63.5 1.6 Std. err. 21 1.9 1.8 0.4 0.3 0.5 1.9 0.1 - 5.7
- Local interactions are not a prerequisite for kin discriminators. With spatial structure and local interactions, ethnocentrics are turned into efficient kin identifiers, and we have a case of kin selection. However, the spatial structure is not necessary for kin selection to be at work, and similar results can be achieved in random interactions when the efficiency of the kin identification does not depend on local interactions in small neighbourhoods.
- 5.8
- Ethnocentric agents can evolve gradually into kin discriminators by increasing the number of ethnic markers available. Not only is the strategy invasible by kin discriminators in both structured and unstructured environments, but the latter also prosper in both of them. An ingroup biased strategy based on crude distinctions can thus be numerous only if the crude distinctions cannot be improved upon and if very specific spatial assumptions are fulfilled. Without the first assumption, we would expect efficient kin discriminators to dominate in almost any environment.
Conclusions
- 6.1
- Ethnocentrism is a phenomenon that leads to more favourable perceptions of and interactions with people exhibiting similar ethnic markers along some line. What is puzzling is that it extends beyond kin selection and direct reciprocity, phenomena that we have a good understanding of, and affects behaviour towards perfect strangers. Seemingly, the model examined here captures this phenomenon: with only four markers in the population, and no built-in bias to favour anyone (initially, all strategies are equally likely), agents end up with an ingroup bias. However, as we have seen here, due to modelling design choices, the markers are not very crude at all.
- 6.2
- For the model to favour ingroup biased agents, it needs to make the assumption that agents interact only locally in a small neighbourhood, into which offspring is reproduced. Translating this into the real world means that you will spend your life communicating mostly with your closest family members (who are clones in the model), and a few other people in repeated interactions. Intuitively, these assumptions seem to offer little breeding ground for ethnocentrism to emerge: recognising individuals seems a small matter for a human being in such small groups, and seems hard to generalise to using arbitrary markers among strangers. And indeed, the model fails to offer such generalisations. With local interactions, the marker becomes a fairly accurate proxy for kin recognition. If someone has got the same marker as you, the probability that you are derived from the same clone is 89%. And by excluding agents with other markers, there is only a five per cent risk that you will defect against a relative, and only 0.5% against a first-generation clone (parent or child).
- 6.3
- The resulting process is a very simple form of kin selection. Agents do not need to take on a personal cost to invest in kin for the benefit of a common gene. By being a co-operator, the chances that an interaction partner will be a co-operator increases significantly. What is being played is thus not really a prisoners' dilemma. The expected payoff for co-operating is higher than that of defecting, not only from the gene's eye view, but also for each individual. With an increased ability to target agents of common descent, the expected payoff increases.
- 6.4
- With random interactions, agents do play a prisoners' dilemma, and the defecting strategy dominates. Ingroup biased agents perform better than the other strategies, but the reason for this is that they co-operate with fewer individuals than outgroup biased agents, who in turn outperform universal co-operators. Hence, ethnic markers do not induce co-operation. With local interactions, co-operation is rational, since most neighbours are kin, but the more you can target co-operation to relatives, the better you will do. If the model only allows for crude markers, but that do not exclude kin, then discriminating based on these will inevitably become a successful strategy.
- 6.5
- Consequently, the model also seems to have little application to explaining the so called green-beard effect in simple organisms (Hamilton 1964; Dawkins 1976), where individual recognition may not occur. A green-beard is a perceptible trait that can help individuals identify other individuals with a common gene and give preferential treatment to these, differing from ethnocentrism in humans in that it may actually function as a means for kin recognition. The green-beard effect is susceptible to invasion by individuals displaying green beards without taking the costs of giving preferential treatments to others displaying them. What needs to be explained is how costly co-operative behaviour can evolve towards individuals displaying green-beards with the threat of them being false-beards. However, the model starts out in co-operative environment, and green-beards are used for exclusion of nonkin. Green-beard discrimination does not incur costs in the model, but it reduces them, compared to the universal co-operation that would otherwise take place.
- 6.6
- The design choices of the model turned the ingroup bias into a kin bias, rendering ethnocentrism a deceptive description. This illustrates the importance of verifying consequences of modelling assumptions. A design choice that alters the outcome significantly, as did the local interaction structure, may also have changed the model so that it no longer describes the phenomenon that is being investigated. Local interactions both allowed for kin selection to be at work and, because of this, changed the strategic structure of the interactions such that agents were essentially not playing a prisoners' dilemma. However, it has been shown that if we accept other strategic structures, then an ingroup bias may evolve in certain games even where kin selection is eliminated through random interactions (Jansson in preparation). There may be a future for the model outside the realm of prisoners' dilemmas. Some assumptions may force the desired results such that a model no longer describes what it was intended for, others may prevent them from occurring.
References
-
AHMED, A.M. (2007). Group identity, social distance and intergroup bias. Journal of Economic Psychology, 28, 324-337. [doi:10.1016/j.joep.2007.01.007]
AXELROD, R., Hammond, R.A., & Grafen, A. (2004). Altruism via Kin-Selection Strategies that Rely on Arbitrary Tags with which They Coevolve. Evolution, 58, 1833-1838. [doi:10.1111/j.0014-3820.2004.tb00465.x]
BREWER, M.B. (1999). The Psychology of Prejudice: Ingroup Love or Outgroup Hate? Journal of Social Issues, 55, 429-444. [doi:10.1111/0022-4537.00126]
BREWER, M.B., & Campbell, D. T. (1976). Ethnocentrism and intergroup attitudes: East African evidence. New York: Halstead Press.
DAWKINS, R. (1976). The Selfish Gene. Oxford: Oxford University Press.
DE DREU, C.K.W., Greer, L.L., Van Kleef, G.A., Shalvi, S., & Handgraaf, M.J.J. (2011). Oxytocin promotes human ethnocentrism, Proceedings of the National Academy of Sciences of the United States of America, 108, 1262-1266. [doi:10.1073/pnas.1015316108]
DOISE, W., Csepeli, G., Dann Konstanz, H.D., Gouge, C., Larsen, K., & Ostell, A. (1972). An experimental investigation into the formation of intergroup representations. European Journal of Social Psychology, 2, 202-204. [doi:10.1002/ejsp.2420020208]
HAMILTON, W.D. (1964). The genetical evolution of social behaviour. I. Journal of Theoretical Biology, 7, 1-16. [doi:10.1016/0022-5193(64)90038-4]
HAMMOND, R.A., & Axelrod, R. (2006a). Evolution of contingent altruism when cooperation is expensive. Theoretical Population Biology, 69, 333-338. [doi:10.1016/j.tpb.2005.12.002]
HAMMOND, R.A., & Axelrod, R. (2006b). The Evolution of Ethnocentrism. Journal of Conflict Resolution, 50, 1-11. [doi:10.1177/0022002706293470]
JANSSON, F. (2013). What Strategic Structures Support the Evolution of Ethnocentrism? In F. Jansson, Modelling Two-Person Interactions Within and Between Cultural Groups. Doctoral thesis. Västerås: Mälardalen University Press Dissertations.
KAZNATCHEEV, A. (2010). The Cognitive Cost of Ethnocentrism, In S. Ohlsson & R. Catrambone (Eds.), Proceedings of the 32nd Annual Conference of the Cognitive Science Society (pp. 967-971). Austin: Cognitive Science Society.
KAZNATCHEEV, A., Shultz, T.R. (2011). Ethnocentrism Maintains Cooperation, but Keeping One's Children Close Fuels It. In L. Carlson, C. Hoelscher, & T. F. Shipley (Eds.), Proceedings of the 33rd Annual Conference of the Cognitive Science Society (pp. 3174-3180). Austin: Cognitive Science Society.
KRAMER, R.M., Brewer, M.B. (1984). Effects of group identity on resource use in a simulated commons dilemma. Journal of Personality and Social Psychology, 46(5), 1044-1057. [doi:10.1037/0022-3514.46.5.1044]
LEVINE, R.A., & Campbell, D.T. (1972). Ethnocentrism: Theories of conflict, ethnic attitudes, and group behavior. New York: Wiley.
LI, X. (in preparation). Game Theory Analysis: Evolutionary Spatial Cooperation.
LIMA, F.W.S., Hadzibeganovic, T., Stauffer, D. (2009). Evolution of ethnocentrism on undirected and directed Barabási-Albert networks, Physica A, 388(24), 4999-5004. [doi:10.1016/j.physa.2009.08.029]
OTTEN, S., Wentura, D. (1999). About the impact of automaticity in the minimal group paradigm: evidence from affective priming tasks. European Journal of Social Psychology, 29(8), 1049-1071. [doi:10.1002/(SICI)1099-0992(199912)29:8<1049::AID-EJSP985>3.0.CO;2-Q]
SCHULTZ, T.R., Hartshorn, M., Hammond, R.A. (2008). Stages in the Evolution of Ethnocentrism, In B.C. Love, K. McRae, & V.M. Sloutsky (Eds.), Proceedings of the 30th Annual Conference of the Cognitive Science Society (pp. 1244-1249). Austin: Cognitive Science Society.
SCHULTZ, T.R., Hartshorn, M., Kaznatcheev, A. (2009). Why is Ethnocentrism More Common than Humanitarianism?, In N. A. Taatgen & H. van Rijn (Eds.), Proceedings of the 31st Annual Conference of the Cognitive Science Society (pp. 2100-2105). Austin: Cognitive Science Society.
SUMNER, W.G. (1906). Folkways. A Study of the Sociological Importance of Usages, Manners, Customs, Mores, and Morals. Boston: Ginn and Company.
TAJFEL, H., Billig, M., Bundy, R., & Flament, C. (1971). Social categorization in intergroup behavior, European Journal of Social Psychology, 1, 149-178. [doi:10.1002/ejsp.2420010202]
TRIVERS, R.L. (1971). The Evolution of Reciprocal Altruism. The Quarterly Review of Biology, 46, 35-57. [doi:10.1086/406755]
WATTS, D.J., Strogatz, S.H. (1998). Collective dynamics of small-world networks. Nature 393(1), 440-442. [doi:10.1038/30918]
WILENSKY, U. (2003). NetLogo Models Library: Ethnocentrism. http://ccl.northwestern.edu/netlogo/models/Ethnocentrism. Center for Connected Learning and Computer-Based Modeling, Northwestern University, Evanston, IL.
WILENSKY, U., & Rand, W. (2007). Making Models Match: Replicating an Agent-Based Model, Journal of Artificial Societies and Social Simulation, 10(4), 2 https://www.jasss.org/10/4/2.html
YAMAGISHI, T., & Mifune, N. (2009). Social exchange and solidarity: in-group love or out-group hate? Evolution and Human Behavior, 30, 229-237. [doi:10.1016/j.evolhumbehav.2009.02.004]