
 Abstract
- To maximise the possibility of success for a new product and minimise the risk and opportunity cost of a failed product, firms must understand the diffusion dynamics of competing products. The diffusion dynamics of competing products emerge from the aggregation of consumers' decisions. At the individual level, a consumer's decision consists of "which product to buy among the available products" and "when to buy a product". Individual product choices are affected by local and global social interactions among consumers. It would be helpful for firms to be able to determine the characteristics of the relevant social network for their target market and how changes in this social network influence their market shares. In addition, determining the distribution of product purchase times of consumers and how their variation affects market shares are interesting issues for firms. In this study, therefore, we propose an agent-based simulation model that generates the market share paths (market shares over time) of competing products. We apply the model to estimate the social network and purchase time distribution of the Korean netbook market. Our observation is that Korean netbook consumers tend to buy a product without hesitation, and their social network is rather regular but sparse. We also conduct sensitivity analyses with respect to the social network and the purchase time distribution.
- Keywords:
- Agent-Based Product Diffusion Model, Individual Purchase Time, Social Network Structure, Estimation, Sensitivity Analysis
Introduction
- 1.1
- Today's product markets are competitive. Because high-tech firms usually have similar levels of technology and utilise similar marketing research methods for the elicitation of consumer needs, it is highly probable that there exist simultaneous innovations (Goldenberg and Efroni 2001). In such market situations, products with similar functions compete with each other to expand their market shares, and a significant percentage of new products disappear from store shelves after their low sales. Therefore, to maximise the possibility for the success of a new product and minimise the risk and opportunity cost of a failed product, firms must understand the diffusion dynamics of competing products.
- 1.2
- The diffusion dynamics of competing products emerge from the aggregation of consumers' decisions. At the individual level, a consumer's decision is composed of "which product to buy among the available products" and "when to buy a product". Individual product choice is affected by social interactions among consumers. Within their social network, consumers communicate their evaluations of products to their friends and influence their friends' purchases. This phenomenon is called the network effect, or word-of-mouth effect.
- 1.3
- Product families have different logical social network structures, even within a single physical social network, consisting of online and offline social connections. For example, a person asks different friends for suggestions when considering high-tech products versus clothes. There are two structural features of a social network that affect the network effect. One feature is the rewiring probability, which affects the number of shortcuts among consumers. The shortcuts are known to reduce the number of steps between consumers by linking people whose friends do not know each other (Granovetter 1973). Because these shortcuts help consumers transfer information to distant consumers, we may say that the rewiring probability contributes to the diffusion of information about products in a global manner. The other feature is the degree of connectivity, which determines the degree of clustered ties in a network, i.e., the number of neighbours. A greater degree of clustered ties in a network is known to provide stronger social reinforcement for buying a new product (Centola and Macy 2007). Because the clustered ties help consumers receive information on products from their neighbours, we may state that the degree of connectivity contributes to the diffusion of product information in a local manner.
- 1.4
- Product purchase timing can be modelled as a probability distribution, and different product families have different purchase time distributions. For example, consumers tend to buy information technology products earlier in the product cycle, and, as a result, their purchase time distribution can be approximately modelled as an exponential-like distribution. In contrast, expensive durables such as automobiles and refrigerators have purchase time distributions in the shape of normal distributions. People tend to take their time and contemplate adopting such durables because these products are costly and have long lifespans. This deliberation results in a small number of people buying the durables early in the product cycle followed by a large number of people buying the durables later. Empirical studies by Rogers (2003) show us that the process of adoption over time is typically illustrated as a normal distribution.
- 1.5
- Based on these conditions of the consumers' social network and product purchase times, we are interested in the problem of how a firm can determine the social network and the purchase time distribution appropriate for a target product market. In addition, we are interested in a sensitivity analysis that predicts what will occur when the social network structure or the purchase time distribution changes from the current market conditions and how a firm can gain market share. We address these problems using a novel experimental approach called agent-based diffusion modelling and simulation, which is capable of predicting the future market share paths (i.e., market shares over time) of competing products. In the agent-based simulation model, a consumer-agent simulates the purchase behaviour of a consumer, and a set of consumer-agents with their interaction structure corresponds to the social network of consumers. The nodes of the social network are consumer-agents, and each link represents a friendship between two consumer-agents. The social network can be modelled as an artificial market. Each consumer-agent chooses products based on their individual evaluations and their neighbours' evaluations (i.e., the network effect) of the products. We propose a fuzzy multi-attribute utility model to formalise their product choice. The product choice model also considers the heterogeneous propensity of consumers—consumers place different weights on the importance of product attributes and varying degrees of sensitivity to the network effect. Some people with strong personalities may not be susceptible to the network effect, whereas others who are very sensitive to the trends of public opinion accommodate themselves to the decisions of early product adopters.
- 1.6
- We choose to use small-world network model for the social network of consumer-agents. Rewiring a small fraction of connections in a ring lattice form, where every node is linked to its neighbours with a fixed degree of connectivity, results in a small-world network (Watts and Strogatz 1998). In this network, nodes are highly clustered, and the information transfer time between nodes is short. It is well known from empirical evidence that the small-world network represents many types of real social networks (Alkemade and Castaldi 2005). Normally, the rewiring probability of a small-world network is within the range of 0.01 and 0.1. As illustrated in Figure 1, a high rewiring probability leads to rapid product information transfer between clusters of nodes, causing the global network effect to increase. The degree of connectivity normally has a value between 4 and 20 (Kim et al. 2011). When the number of network connections is zero, individuals choose products based only on their own product evaluations, without interactions with neighbours to obtain product evaluation information. As shown in Figure 1, a high degree of connectivity leads to rapid product information transfer within clustered ties, causing the local network effect to increase. Therefore, we can observe local and global network effects by varying the rewiring probability and the degree of connectivity from zero to positive values.
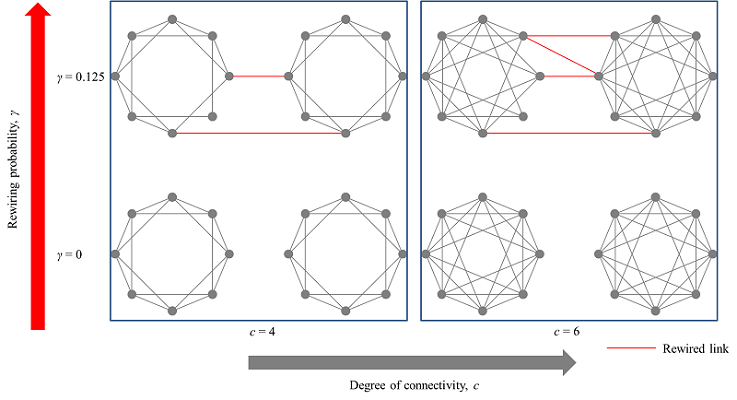
Figure 1. Examples of small-world networks with respect to their rewiring probability and degree of connectivity when the number of nodes is 8 - 1.7
- Consumers' product purchase times are assigned randomly using the shifted Gompertz distribution. This distribution is a well-known purchase time distribution with various shapes (Bemmaor and Lee 2002). Equation (1) gives the general form of the shifted Gompertz distribution:
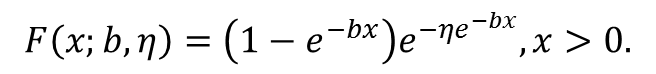
(1) - 1.8
- Figure 2 plots shifted Gompertz distributions when the shape parameter, η, is 0.01, 0.1, 1, and 10. The scale parameter, b, is fixed at 0.4, following Bemmaor (1994). Customers' tendency to buy fashionable products can be modelled by the shifted Gompertz distribution with η=0.01, which resembles an exponential distribution. However, the shifted Gompertz distribution with η=10 has a shape similar to a normal distribution and satisfactorily explains the purchase times of expensive durables. Thus, a smaller shape parameter, which represents consumers buying products earlier in the cycle, leads to a higher rate of product diffusion. The shape, determined by η, of a shifted Gompertz distribution determines the diffusion speed of a product because consumers purchase products according to the distribution. Therefore, we can observe how the market shares of competing products differ when we change the shape parameter.
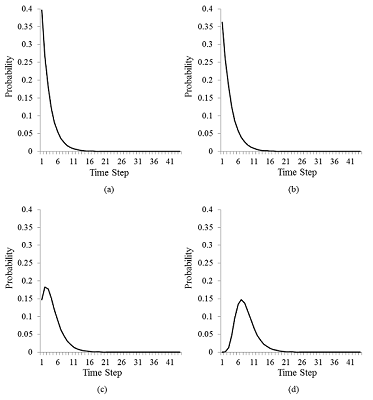
Figure 2. Examples of shifted Gompertz distributions: (a) when the shape parameter is 0.01 and the scale parameter is 0.4, (b) when the shape parameter is 0.1 and the scale parameter is 0.4, (c) when the shape parameter is 1 and the scale parameter is 0.4, and (d) when the shape parameter is 10 and the scale parameter is 0.4. - 1.9
- To narrow our scope, we apply the agent-based simulation model to the case of the Korean netbook market. In this study, our contributions are threefold. First, we compare the market share paths generated by the simulation with the real sales data obtained from a Korean e-commerce company to estimate the rewiring probability and the degree of connectivity of the social network and the shape parameter of the shifted Gompertz distribution most appropriate for the Korean consumers. After estimating the three parameters, we conduct sensitivity analyses with respect to these parameters. As stated above, the rewiring probability determines the speed of inter-clustered product information transfer, the degree of connectivity determines the speed of intra-clustered product information exchange, and the shape parameter fixes product diffusion speed. Thus, we control the parameters individually to generate different global and local network effects and different diffusion speeds. Based on the observed results, we suggest strategic implications for firms desiring to increase or maintain market share in each case.
- 1.10
- The remainder of this paper is organised as follows. Section 2 explains related agent-based simulation models for product diffusion. Section 3 introduces the details of our proposed model. Section 4 presents the empirical study and sensitivity analyses with marketing implications. Finally, Section 5 presents a discussion and concluding remarks.
Literature Survey
- 2.1
- Simulation models for product diffusion can be divided mainly into cellular automata models (Goldenberg and Efroni 2001; Goldenberg et al. 2001; Moldovan and Goldenberg 2004; Guseo and Guidolin 2009; Schwarz and Ernst 2009) and agent-based social network models (Janssen and Jager 2001; Janssen and Jager 2003; Delre et al. 2007a; Delre et al. 2007b; Kim et al. 2011; Gunther et al. 2011). A cellular automata model is composed of cells in a regular grid. Each cell has a finite number of states and belongs to one of the states (e.g., '0' for non-adoption and '1' for adoption). At each time step of simulation, the state of any single cell is determined by the neighbouring cells' previous states and a transition function that specifies an identical rule acting on each of the adjacent cells. Transition functions can be defined as either simple rules or probability functions. Using a very simple transition function, Goldenberg and Efroni (2001) soundly demonstrated the propagation of awareness of emergent needs in the market. Goldenberg et al. (2001) further proposed a probabilistic transition function for cells in consideration of interpersonal factors and external factors to explore the underlying process of word-of-mouth communications. Moldovan and Goldenberg (2004) later investigated how the adverse effects of negative word-of-mouth and consumer resistance to change may decrease market size. Guseo and Guidolin (2009) focused on the state transitions of a cellular automata network rather than the state transitions of the cells themselves. They focused on the state transitions of edges among cells under the assumption that market potential is associated with the collective knowledge in the communication network. The state of an edge between two nodes is determined by the states of other edges connected to the two nodes, and the market potential is determined by the number of active edges. The market potential is applied to the adoption process of cells. However, Schwarz and Ernst (2009) indicated that cellular automata models yield spatially explicit results but merely use the states of their cells for the simulation without capturing the heterogeneity of the cells where such heterogeneity exists.
- 2.2
- The agent-based social network model has recently drawn attention from researchers investigating collective market dynamics. Janssen and Jager (2001) studied the dynamics of markets from a psychological perspective and defined four cognitive processes for behavioural decisions, relying on the level of uncertainty and the level of satisfaction, and showed that these behavioural rules determine the artificial consumer's decision making. In a subsequent study, Janssen and Jager (2003) explored the effects of the different social network structures of the agents and showed that a market organises itself via interactions among agents' decision-making processes, product characteristics, and the network structure of the agents. Delre et al. (2007a) studied the effect of social processes on diffusion dynamics and the effects of consumer heterogeneity and consumers' network structure on diffusion speed. Delre et al. (2007b) also investigated the effectiveness of different promotional strategies for the launch of a product. However, the agent-based social network models in these studies consider only a single product category. These models do not consider competitive market conditions under which a consumer chooses a product among competing products. Concerning the purchase time of the agent, these models allow every agent to compare the utility of a product with a threshold value that is given randomly and adopt the product when the utility exceeds the threshold. The threshold-based model of product adoption is easy to implement and appropriate for the diffusion modelling of a single product category because it involves only binary options, such as adoption or non-adoption (Granovetter 1978). However, when several products compete in a market, the threshold-based model is difficult to apply because there may be several products that simultaneously exceed the threshold of a particular consumer. Kim et al. (2011) proposed an agent-based simulation for estimating the diffusion of competing products in an automobile market. In their simulation, an agent chooses a car using a multi-attribute decision-making heuristic called fuzzy TOPSIS (Technique for Order Preference by Similarity to Ideal Solution). Under this heuristic, each agent selects the best car from among competing models as being the closest to the positive ideal solution and the farthest from the negative ideal solution. The authors assume a uniform distribution to model consumers' purchase times. Additionally, our study posits that consumers' purchase times have different distributions according to product type. Gunther et al. (2011) proposed a model for assessing marketing activities such as launch timing, market targeting, and pricing for biomass-based fuel that will be used in Austria in the near future. In this study, an agent adopts either biomass-based fuel or fossil fuel on the basis of threshold-based adoption rules.
The Agent-Based Simulation Model
- 3.1
- This model has three input variables: the experts' ratings of product attributes, the agents' weights for product attributes, and the agents' degrees of sensitivity to the network effect. We assume that all consumer-agents share the experts' opinions through mass media in the beginning of product diffusion and follow the experts' opinions. Thus, a consumer-agent's evaluation is initially set to the experts' ratings of product attributes with a consideration of the agent's own weights for product attributes. In addition, in the real world, the extent to which consumers are influenced by the network effect differs according to individual characteristics. Thus, each agent has a degree of sensitivity to the network effect that represents the individual's sensitivity to his or her neighbours' opinions.
- 3.2
- We assume that the three input variables are assessed using the five linguistic terms listed in Table 1. Because linguistic assessment is imprecise, modelling using a fuzzy set is an effective approach to quantifying these terms. The vagueness of each term in this study is characterised as a value set with a triangular membership functions shown in Figure 3-(a) (Zimmermann 2001). As illustrated in Figure 3-(b), a value set defined as (a, b, c) is called a triangular fuzzy number, and the corresponding membership function indicates the degree of certainty that a value in the set belongs to the linguistic term. In particular, we scaled triangular fuzzy numbers within the range of [0, 100], as suggested by Yeh and Kuo (2003), down to the range of [0, 1]. It is also possible for a specific application domain to induce triangular fuzzy numbers using survey (or experimental) data (Hong and Lee 1996), but this work remains a large and challenging research issue.
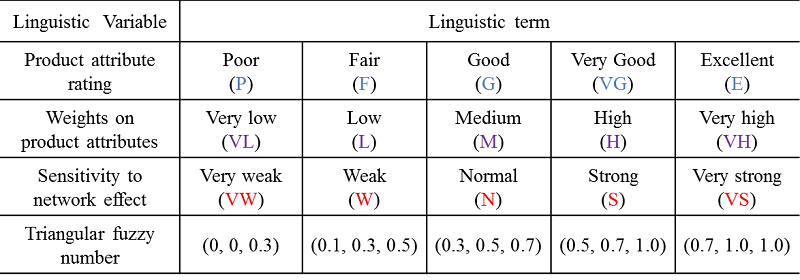
Table 1. Linguistic variables and triangular fuzzy numbers 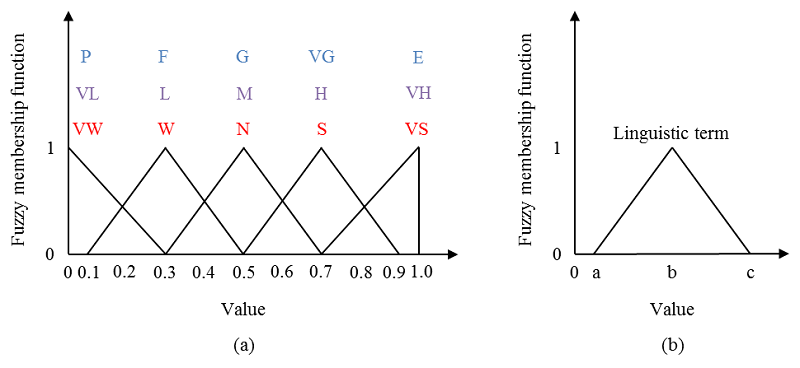
Figure 3. (a) The fuzzy membership functions of the five linguistic terms in Table 1; (b) a depiction of a triangular fuzzy number - 3.3
- The diffusion simulation consists of an initialisation stage and an execution stage. In the initialisation stage, we construct a social network of consumer-agents with a specific rewiring probability and a degree of connectivity and assign each agent three personal properties: a product purchase time, weights for product attributes, and a degree of sensitivity to the network effect. We assign each agent's purchase time by using a shifted Gompertz distribution with a specific shape parameter value. For the last two properties, we conduct a questionnaire survey with the five linguistic terms, build empirical distributions, and assign each agent randomly chosen values from the distributions.
- 3.4
- The execution stage proceeds as follows. We assume that there are m products pi (i = 1,…, m) in an artificial market, and each product has n observable attributes dj (j = 1,…, n). Let the experts' ratings of the products with respect to the attributes be given as follows:
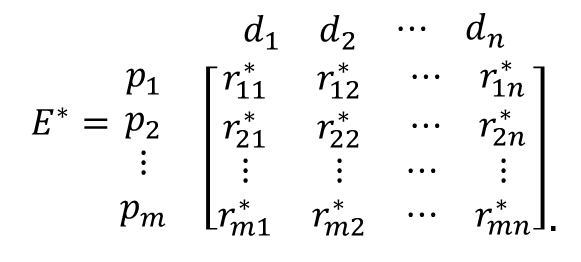
(2) In this matrix, r*ij is the triangular fuzzy number that corresponds to the experts' linguistic evaluation of attribute dj of product pi (see Table 1).
- 3.5
- At the beginning of the execution stage, each consumer-agent accepts the experts' opinions with a consideration of the attribute weights. Let W*k = (w*1k, …,w*nk) be the attribute weight vector of consumer-agent k, in which the elements of the vector are also denoted by the triangular fuzzy numbers in Table 1. The agent multiplies the attribute weight vector W*k by the experts' product rating matrix E*. The result is consumer-agent k's personalised fuzzy decision matrix D*k, which is defined as
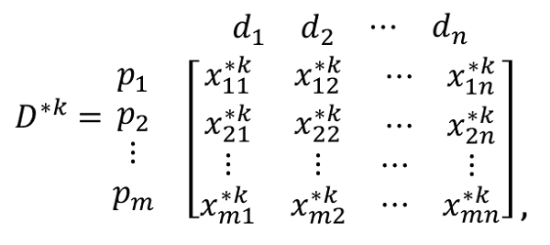
(3) where x*kij = r*ij ⊗ w*jk. Let A*1 = (a1, b1, c1) and A*2 = (a2, b2, c2) be two triangular fuzzy numbers. The multiplication operator ⊗ of the two triangular fuzzy numbers is then defined as A*1 ⊗ A*2 = (a1a2, b1b2, c1c2) (Zimmermann 2001). The new fuzzy number, x*kij, can be regarded as the partial utility of product pi with respect to attribute dj evaluated by the consumer-agent k without considering the network effect.
- 3.6
- For the consumer-agent k to choose a product, it is required that the attribute-level fuzzy utilities x*ij (i=1,…,m; j=1,…,n) be aggregated for each product and compared among products. However, this fuzzy, multi-attribute decision-making approach suffers from various drawbacks such as a lack of sensitivity when comparing similar fuzzy numbers, counterintuitive outcomes in some circumstances, and complex computational processes (Deng and Yeh 2006). To avoid the drawbacks in the product choice process, we employ a common and useful defuzzification technique called the centre-of-gravity (COG) approach (Wang and Luoh 2000). In fuzzy set theory, defuzzification has been used as an effective means of interpreting the membership degree of a triangular fuzzy number as a specific crisp value. The COG is an expected geometric centre of mass. Given a fuzzy number x*kij, denoted as (xk(1)ij, xk(2)ij, xk(3)ij), its COG, xkij, is defined as
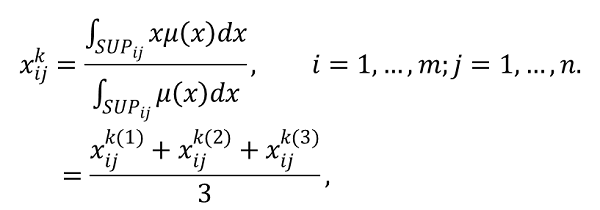
(4) where SUPij is the support of x*kij and μ(x) is the membership function of x*kij. By applying the defuzzification method in equation (4) to the personalised fuzzy decision matrix D*k in equation (3), we obtain a personalised decision matrix Dk that is composed of crisp values (equation (5)). This matrix contains consumer-agent k's personalised utilities with respect to product attributes.
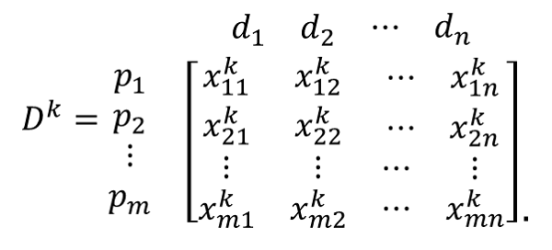
(5) - 3.7
- Consumers also reflect on the product ratings of their neighbours in making purchase decisions. To model network effects in product choice, we average the product attribute ratings forwarded from neighbours. The utility of consumer-agent k with respect to the attribute dj of product pi is then defined as the weighted average of a personalised component and a network effect component:
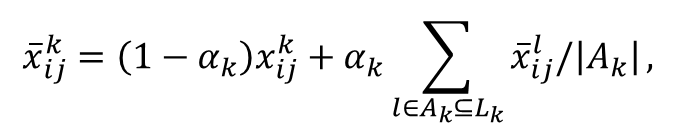
(6) where Lk is the set of consumer-agent k's neighbours, Ak is the set of adopters in Lk, and αk is the defuzzified sensitivity degree of consumer-agent k to the network effect (0 ≤ αk ≤1). When a consumer is more innovative, the personalised component is weighted more heavily. In contrast, when a consumer is less innovative, the network effect component is weighted more heavily. By incorporating the network effect component into equation (5), a complete attribute utility matrix, Sk, is obtained as
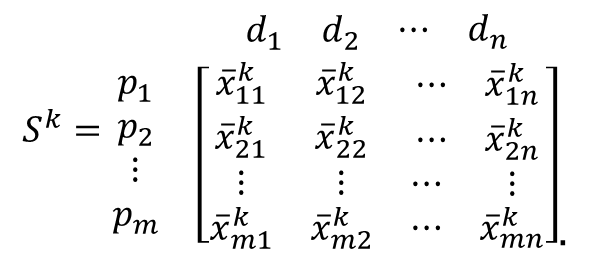
(7) - 3.8
- From the beginning of the simulation, consumer-agent k updates the attribute utility matrix Sk with the attribute ratings forwarded by neighbouring adopters (see equation (6)). When the simulation time reaches the given purchase time of the agent, the agent chooses a certain product with a certain probability, Pk(i), using a popular choice rule called the multinomial logit rule (Train 2009), which is defined by equation (8):
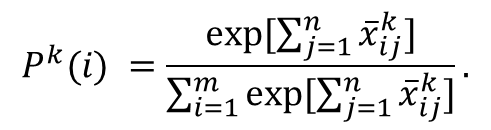
(8) - 3.9
- When using individual purchase time distributions as in the simulation model, all consumer-agents eventually buy products at the end of the simulation because every agent is assigned a purchase time. In general, however, all agents do not adopt new products in real-world markets. For this case, we add a dummy product (i.e., it is not a real product but represents no adoption) to the simulation model. Because the dummy product is equivalent to the product in use, its utility is calculated by assuming that the ratings of all the product attributes are "fair". Such a modification enables our model to incorporate no product adoption in equation (8).
- 3.10
- The following steps summarise the simulation process:
Initialisation
Step 1. Create a consumer-agent network with a rewiring probability and a degree of connectivity.Step 2. Assign weights to product attributes and the degree of sensitivity to the network effect to consumer-agents using empirical distributions.
Step 3. Generate consumer-agents' purchase times using a shifted Gompertz distribution with a shape parameter.
Step 4. Establish experts' linguistic ratings on each competing product.
Execution
Step 5. At simulation time t = 0, introduce the experts' ratings of competing products to all consumer-agents, who each create the personalised decision matrix Dk in equation (5) using their individual weights for the product attributes.Step 6. All consumer-agents update the attribute utility matrix Sk in equation (7) by requesting information from neighbours who purchased any products before the current time t. Those whose purchase times are equal to the current time t select products using the multinomial logit rule.
Step 7. Set t = t+1. If the simulation time reaches the termination time, stop the diffusion; otherwise, return to Step 6.
Experimental Design
-
Korean netbook market
- 4.1
- Netbooks are a family of notebooks focusing on mobility and Internet use. Netbook products were released in online shopping malls in the first half of 2008 in Korea. The products of six producers make up the netbook market, and three products from two producers occupied 60 per cent of the total market. These three products had similar release times (two of the three products were introduced two weeks earlier than the other, but we ignore this time difference in this experiment) and were introduced approximately three months earlier than the other products, for which the market shares and variations were small.
Data description
- 4.2
- Product attributes listed as major buying criteria in commercial expert review websites (e.g., PC World) include CPU performance, data storage size, memory size, display size, battery life, weight, and price. The websites provided graded ratings of the three netbooks in July 2008, just before the products' release on the Korean market. We averaged the ratings of the products for each attribute; the results are summarised in Table 2. The CPU performance, memory sizes, and prices of the three products are the same. Based on the rating results, it was not easy to predict which product would be a winner in the market.
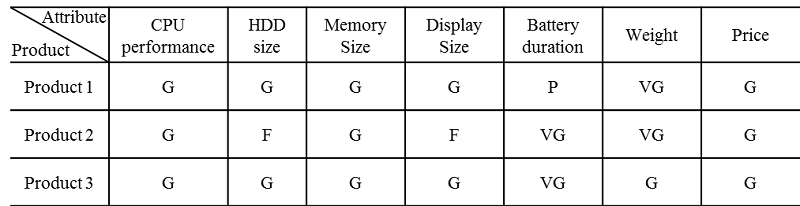
Table 2. Experts' product attribute ratings for the three products - 4.3
- We conducted a questionnaire survey to obtain individual consumers' weights for the attributes of a netbook and their sensitivity level to the network effect. Of 153 respondents, there were 100 valid responses included in our analysis. The survey results are summarised in Tables 3 and 4. Table 3 shows that CPU performance, weight, and price are important attributes (i.e., approximately 30% or more of the respondents rated these attributes as "very high"). As shown in Table 4, no respondents were very strongly sensitive to the network effect; 41% of the respondents rated themselves as "strongly or normally" sensitive to the network effect, and 59% of the respondents were "weakly or very weakly" sensitive to the network effect.
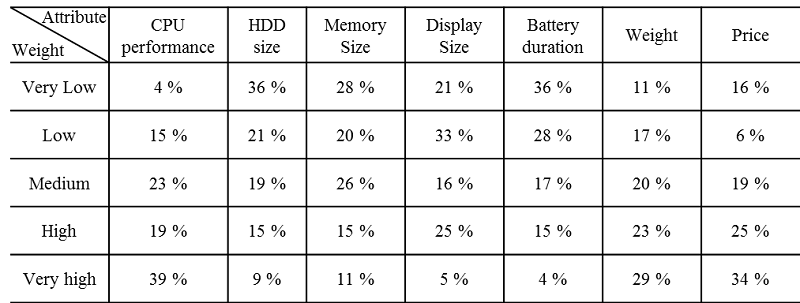
Table 3. Consumers' weights for the netbook attributes 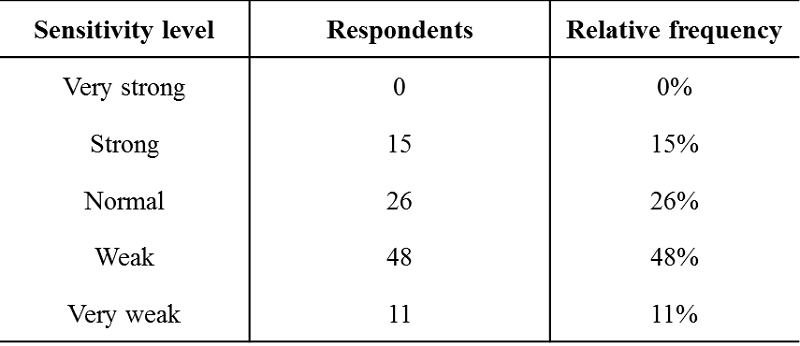
Table 4. Consumer sensitivity to network effects Description of the experiment
- 4.4
- Using the Netlogo software ( http://ccl.northwestern.edu/netlogo), we created a small-world network of 5,000 consumer agents to represent the Korean netbook market. The experiment consists of an empirical study and a sensitivity analysis. In the empirical study, we adjusted the rewiring probability and the degree of connectivity of the consumer-agent network and the shape parameter of individual purchase time distributions appropriate for the Korean netbook market. We tested four rewiring probabilities (0.01, 0.0.5, 0.1, and 0.25) and five degrees of connectivity (4, 6, 8, 10, and 20) for the consumer-agent network. We also evaluated four shape parameters (0.01, 0.1, 1, and 10) for the shifted Gompertz distribution that generated four different individual purchase time distributions. The total number of parameter combinations was 80. For each combination, 100 simulation runs were replicated so that a performance measure at the level of the 95% confidence interval was obtained by Chebyshev's theorem (Shannon 1975). The performance measure used in the empirical study was the market share path of each product. The market share of a product at a time was calculated as its cumulative sales volume divided by the total sales volume at a given time, and its market share path is simply the market share over time. In the sensitivity analysis, we controlled the three parameters (the degree of connectivity, the rewiring probability, and the shape parameter) to observe the changes in the market share paths of the three products. The means and the variances of the market share paths were used as metrics for the analysis.
- 4.5
- In this experiment, we did not consider "no product adoption" for two reasons. First, the respondents of the questionnaire survey were willing to buy a new product, and they had used products with similar functions. Second, we compared our simulation result with the real market share paths based on the sales volumes of only three products. The market share of a product is defined as the proportion of the sales volume of the product to the total sales volume of similar products in market. Buying no product or a product other than the three studied products was previously excluded from the real market share paths. Therefore, we did not include an option for "no purchase".
Notation
The terms below are used frequently in the following sections:- T: the entire sales interval
- R: the number of simulation replications
- yij(·): the simulated market share path of product i over T, generated by the jth replication
- zi(·): the real market share path of product i over T
Empirical study
- 5.1
- We defined the distance between two paths in comparison (i.e., the simulated market share path of a product and the corresponding real market share path) as the Euclidian distance evaluated by the dynamic time warping (DTW) technique (Sakoe and Chiba 1978). This technique is often applied to measure two time-series patterns of different lengths and possibly with different time scales. We used this technique because the time lines between the real market share path (in weeks) and the simulation result (in simulation time steps) are different. The distance (disti) between the simulated market share paths (yij(·)) and the real market share path (zi(·)) of product i in R replications is defined by equation (9), in which the function DTW(a, b) gives the difference between two sequences a and b as a Euclidian distance:
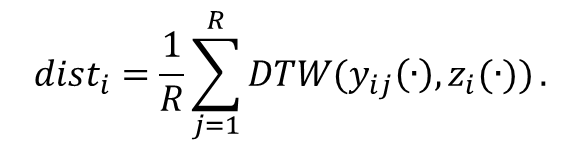
(9) - 5.2
- Because there is more than one product, we define the aggregated distance (dist) of m products by equation (10):
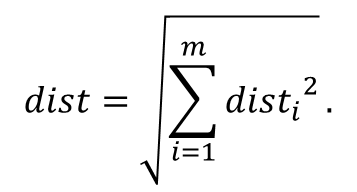
(10) 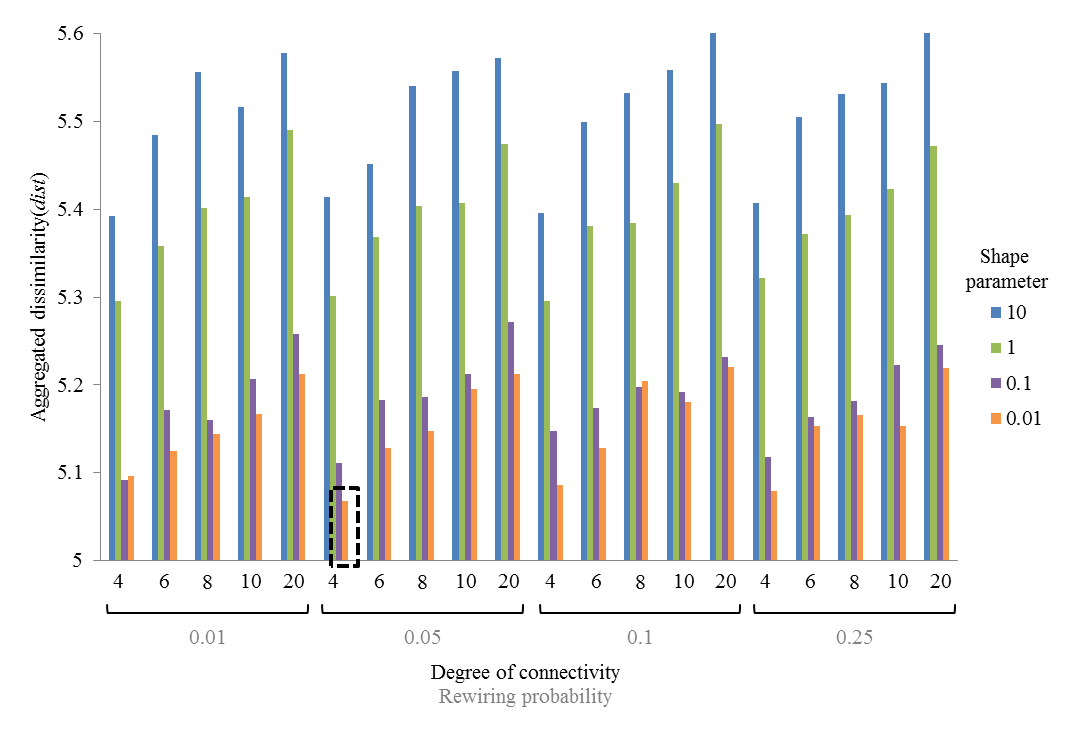
Figure 4. Euclidian distances between simulation-generated and real market share paths - 5.3
- Figure 4 summarises our results, depicting the distances between the simulation-generated market share paths and the real market share paths of the three netbooks in Korea. In this figure, a small aggregated distance indicates high similarity. The result most similar to the real data occurred when the shape parameter of the purchase time distribution was 0.01. The figure also shows that our simulation result becomes similar to the actual netbook diffusion in Korea when the shape parameter is smaller. This result implies that Korean netbook buyers are likely to purchase netbooks early as fashionable and trendy products. Demand for high-tech products, e.g., netbooks, notebooks, and smart phones, is volatile (Wu et al. 2005), and the products experience considerable up-front expenditure followed by rapid obsolescence (Pangburn and Sundaresan 2009). For example, the sales volume of every new model of iPad or iPhone was very high at the beginning of product launch. We may extend our inference that consumers' rapid purchases at the beginning of product release entice firms to provide new products with short life cycles.
- 5.4
- The diffusion of netbooks in the Korean market can be explained by two structural features of a social network: the rewiring probability and the degree of connectivity. In Figure 4, the result most similar to the real data was found when the rewiring probability was 0.05 and the degree of connectivity was 4. This finding indicates that the social network of Korean netbook consumers is a regular network, and each consumer has a small number of neighbours. That is, the social network is logically well organised but sparse. Because a small-world network is defined with a rewiring probability ranging between 0.01 and 0.1, the rewiring probability of the Korean netbook consumer network (0.05) appears to be high. However, the degree of connectivity of the Korean netbook consumer network (4) is low. This value implies that, in Korea, netbooks are likely to diffuse not by reinforcement from many local sources (Centola and Macy 2007; Centola 2010) but rather by simple contact with the help of shortcuts (Granovetter 1973). That is, a network with many small clusters represents the social network of Korean netbook consumers.
- 5.5
- Figure 5 illustrates the real market share paths and the market share paths simulated with a scale parameter of 0.4, a shape parameter of 0.01, a rewiring probability of 0.05, and a degree of connectivity of 4. In this figure, the real market share paths after t = 3 in Figure 5 (a) and the simulated market share paths after t = 0 in Figure 5 (b) are similar in terms of relative dominance. However, we can observe that the difference in market share paths from t = 0 to t = 3 and the difference in the market share paths of Product 1 and Product 2 after t = 3. In the simulation, we may have lost some factors that control market share paths. We suspect two factors are missed:
- Coercive synchronisation of product release times: we have aligned the release times of the three products to start diffusion at the same time. We have truncated the data of the first two weeks of two products that were released two weeks before the other one. We may have lost social influence happened in the two weeks. This may lead to the result of the difference in the market share paths from t = 0 to t = 3.
- No external shock from the market: we may have missed external shocks that happen unevenly in real life. The external shocks could be marketing strategies (e.g., price discount and promotion) and changes in the experts' opinions. The absence of the external shocks may cause the difference in the market share paths of Product 1 and Product 2 after t = 3.
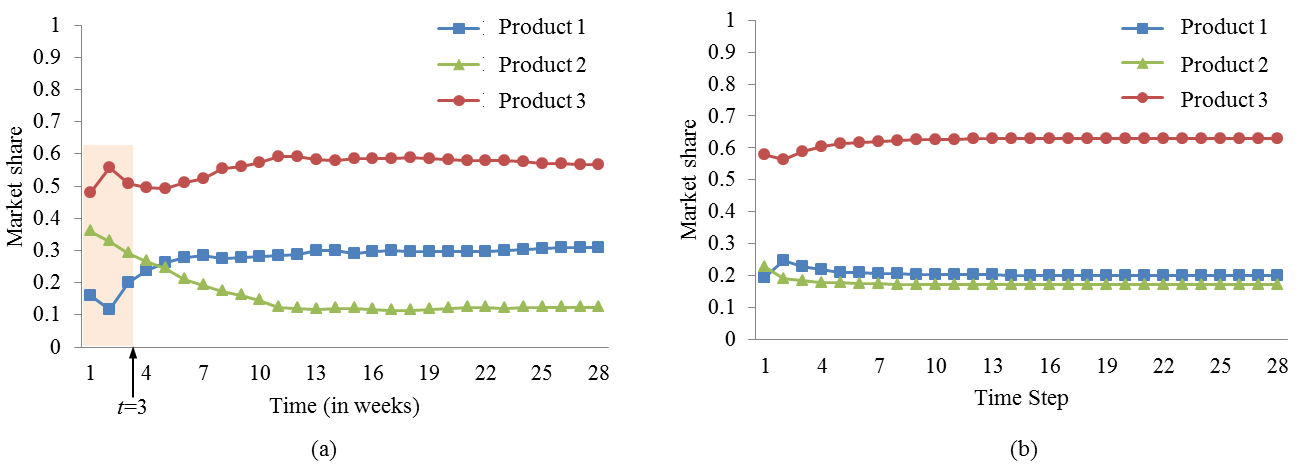
Figure 5. Market share paths: (a) real ones and (b) simulation results with a scale parameter of 0.4, a shape parameter of 0.01, a rewiring probability of 0.05, and a degree of connectivity of 4
Sensitivity analysis
- 6.1
- Based on the experts' evaluations of the product attributes in Table 2, we find that Product 2 is inferior to both Product 1 and Product 3. The evaluations of Product 1 and Product 3 are the same with respect to every product attribute except for battery life and weight. Product 3 surpasses Product 1 in battery life, with a difference of three linguistic levels. However, Product 1 beats Product 3 in weight by a difference of one level. Product 3 is thus judged to be slightly better than Product 1 in the overall evaluation, but they are competitive.
- 6.2
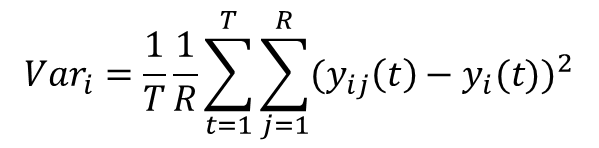
- In this situation, we analysed the local network effect caused by neighbours, the global network effect caused by shortcuts among consumers, and the purchase time effect (i.e., the effect caused by different individual purchase time distributions). Here, we used two metrics for the analysis: the mean market share path and the market share variance. First, we define the mean market share path of product i by equation (11):
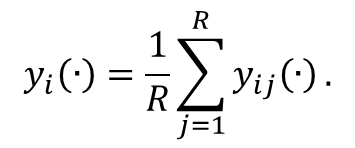
(11) This equation yields the mean of R simulation replications and represents the expectation for the market share of a product over time. With this metric, we can compare one market share path with another and thereby deduce the magnitude of the network effect. Second, we define the market share variance of product i generated from R replications by equation (12), representing the uncertainty in forecasting market share:
(12) The local network effect: A sensitivity analysis on the degree of connectivity of social network
- 6.3
- We analysed the local network effect by running our model with different degrees of connectivity (0, 4, 6, 8, 10, and 20). We fixed the other parameters to the same values as the estimated condition found in the previous experiment. That is, the rewiring probability and the shape parameter were set at 0.05 and 0.01, respectively.
- 6.4
- Figure 6 confirms that the degree of connectivity greatly affects the diffusion of products. The difference between the mean market share path of a product without a network effect (i.e., when the degree of connectivity = 0) and that of a product with a positive degree of connectivity reveals the magnitude of the local network effect. When there was no network effect, consumer-agents arrived at mutually different evaluations of the three products by filtering the experts' opinions in Table 2 based on their own weights. As a result, the products gained different but stable market shares. However, as the degree of connectivity increased, the market share of minor products such as Product 1 and Product 2 fell, but that of major products such as Product 3 rose.
- 6.5
- Based on our judgement that Product 3 is superior to the others in almost all attributes (Table 2), the local network effect appears to enable a major product to claim a superior market position but relegates a minor product to an inferior position. This observation suggests that the rise of Product 3 to take the largest market share resulted not only from its higher quality but also from network effects promoting consumer-agents to buy Product 3 more quickly. Exactly the same explanation is offered by Tellis et al. (2009): "Consequently, the entire market settles on the better products more quickly and at a higher level than it would have in the absence of network effects".
- 6.6
- The major product (Product 3) had the advantage of gaining market share from the local network effect—its market share was abruptly increased at the beginning of product diffusion. We suggest that the local network effect ultimately biased the evaluations of many consumer-agents towards the experts' opinions for two reasons. First, at the start of product diffusion, consumer-agents had the experts' opinions as a reference for their evaluations. Even when their weights were initially different, Product 3 became the most favourable product among the consumer-agents because the experts rated Product 3 as the best in their overall evaluation of product attributes. Second, there was insufficient time for the consumer-agents to share the information that Product 1 was also a competitive product because the individual product purchase time distribution resembles an exponential distribution. Consequently, if we define reliable knowledge as the experts' opinions, then the reliable knowledge propagated by the local network effect within the social network seemed to lead the consumer-agents to the major product.
- 6.7
- Although the minor products (Product 1 and 2) lost market share due to the local network effect, there remained some market share for these products. This phenomenon indicates that the local network effect may encroach on the market share of the minor product but that there still are some people locked into the minor product. We know that the structure of the social network of Korean netbook consumers has many small clusters due to the large rewiring probability and small degree of connectivity. Additionally, we surmise that the network effect may occur only in the early stage of product diffusion because the shape of the individual purchase time distribution resembles an exponential distribution. According to our findings on the social network structure and the purchase time of Korean netbook consumers, we can state that some clusters may not have sufficient time and information to shift their purchase decisions to buy products other than the best products as initially evaluated by the consumers themselves.
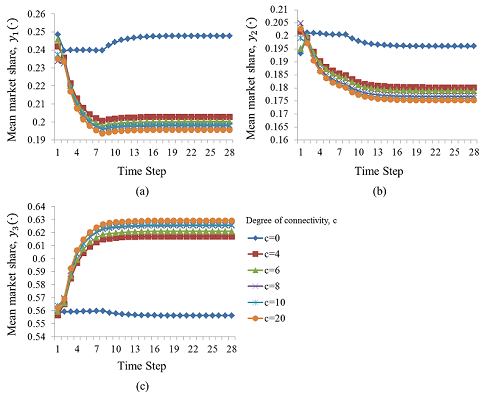
Figure 6. The means of the market share paths with respect to changes in the degree of connectivity: (a) Product 1, (b) Product 2, and (c) Product 3 - 6.8
- Our discovery is that the local network effect diminishes diversity in purchasing and promotes standardisation in purchasing when consumers tend to buy products early after launch, as is the case for fashionable products. However, when the consumers' social network consists of many small clusters characterised by a high rewiring probability and a low degree of connectivity, quick product purchase tendencies decrease the local network effect and leave some market share for the minor products.
- 6.9
- Our results also show that an increase in the degree of connectivity did not increase the magnitude of the local network effect critically. The degree of connectivity refers to the number of communication channels and the number of neighbours influencing product-purchasing decisions. We can easily confirm that the ranks of the product ratings by the experts are straightforward in Table 2; thus, consistent (or reliable) information on product evaluation may flow through the social network even when few neighbours share this information. Therefore, the initial evaluation of products by the experts is the most decisive factor when consumers buy products early.
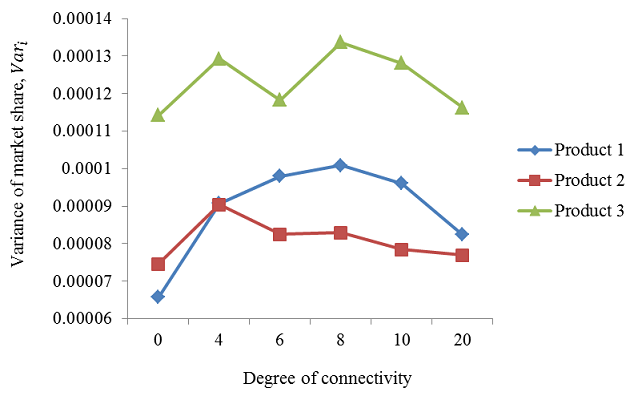
Figure 7. Variances of the market shares with respect to changes in the degree of connectivity - 6.10
- Figure 7 illustrates the market share variances of the three products with respect to the degree of connectivity. Market share variance is important to a firm because uncertainty therein is directly related to the risk of investment in a new product. We observed that the major product (Product 3) had a greater variance compared with the minor products (Product 1 and Product 2). Figure 6 shows that the mean market share path of Product 3 rises as the others fall, indicating that the evaluation of Product 3 diffused well compared with the evaluations of the other products, and the number of consumers who considered buying Product 3 increased. Thus, the chance of Product 3 to diffuse rose due to the diffusion of the product evaluation, but this increased chance also increased the variance of the market share path of this product.
- 6.11
- We also observed that the market share variances of the three products approach the variances generated with no network effect as the degree of connectivity increases. Consumers tend to buy a product by using their own evaluations of the products when there is no local network effect. However, as the degree of connectivity increases, consumers are influenced by neighbours, and it becomes more likely that a consumer will choose one of the three products. Thus, the variance increases. However, after a certain point, the variance becomes smaller, and it appears that it approaches the variance when there is no network effect. We can explain this phenomenon as the result of an averaging effect. With a small number of neighbours, a consumer's purchase may be biased towards those neighbours' tastes. However, when the number of neighbours is sufficiently large, the consumer will be exposed to almost all the opinions of other people. This situation may lead the consumer to obtain a somewhat less-biased evaluation from neighbours by averaging all their opinions. Although we do not know what product each consumer purchases, we can conclude that as the degree of connectivity increases, the uncertainty in achieving the mean market share paths of the three products returns to the point at which where there is no network effect.
- 6.12
- When the individual purchase time distribution resembles a normal distribution, consumer-agents then have sufficient time to consider purchasing a product, and the degree of connectivity will affect the magnitude of the local network effect crucially, and the market share paths of the products should display various patterns. If this similarity holds true, this implies that a firm desiring to increase the market shares of their products should invest constantly in social networking service marketing and provide consumers with more communication channels with their friends.
The global network effect: A sensitivity analysis on the rewiring probability of a social network
- 6.13
- As discussed above, the rewiring probability determines the number of shortcuts among consumer-agents. As the number of shortcuts increases, it is evident that information flows well throughout the clusters of the social network of consumers. Thus, we varied the rewiring probability and observed the global network effect. The degree of connectivity and the shape parameter were fixed at 4 and 0.01, respectively.
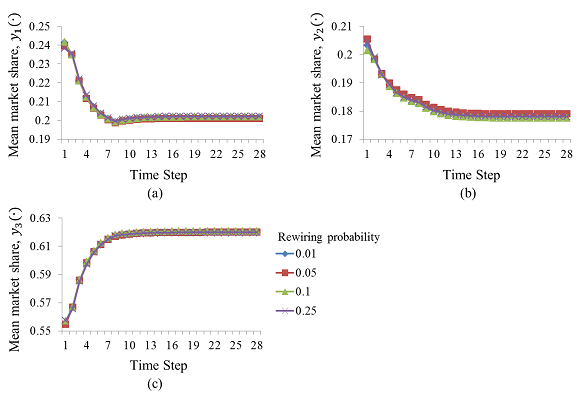
Figure 8. The mean market shares with respect to changes in the rewiring probability: (a) Product 1, (b) Product 2, and (c) Product 3 - 6.14
- Figure 8 presents the mean market share paths of the three products when we changed the rewiring probability by 0.01, 0.05, 0.1, and 0.25, illustrating that the mean market share path remains almost the same regardless of the rewiring probability. We suspect that the rapid purchases of consumers did not cause a strong global network effect. Additionally, it is known that the number of shortcuts between distant consumers is proportional to the number of local neighbours (i.e., the degree of connectivity) because each shortcut is made by disconnecting a local link and rewiring the link to a distant consumer. Because the number of local neighbours in this social network (4) was small, the absolute number of shortcuts generated even when the rewiring probability was at the maximum value of 0.25 may not have been sufficient to create a significant global network effect. Thus, the global network effect would be influenced not only by the rewiring probability but also by the degree of connectivity. Based on the analysis of the results, we surmise that the global network effect may increase with the rewiring probability when the individual purchase time distribution resembles a distribution and the degree of connectivity is high.
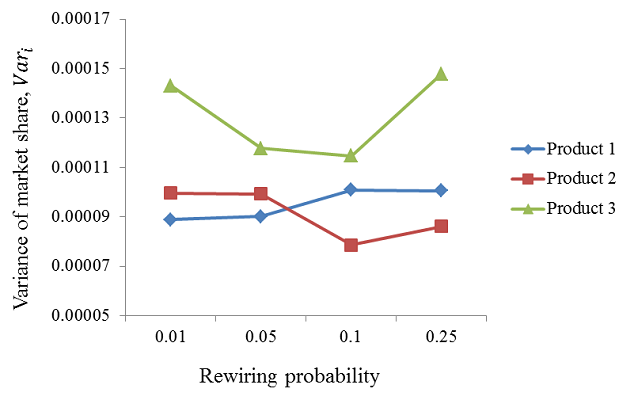
Figure 9. Variances of the market share paths with respect to changes in the rewiring probability - 6.15
- However, in Figure 9, a difference in the market share variances of the three products can be observed. This figure demonstrates that the variance of Product 3 is greater than those of the other products. For the major product, Product 3, the variance becomes smaller when the rewiring probability is 0.05 or 0.1 compared with 0.01 or 0.25, meaning that a rewiring probability that is too small or too large may increase the uncertainty in reaching the mean market share path of the major product. This finding stands in contrast to the previous sensitivity analysis revealing that a too-small or too-large connectivity reduces the uncertainty.
- 6.16
- For conditions under which consumers have a small number of neighbours and are rapid purchasers, a moderate number of shortcuts (neither too few nor too many) should provide the producer of a high-quality product (e.g., Product 3) with a greater chance to achieve the mean market share for the product. From the perspective of social network services, it is thus undesirable for a firm that produces a high-quality netbook to provide online communication spaces that enable Korean netbook consumers to transfer product information with too many new acquaintances because this connectivity could cause the social network of Korean netbook consumers to cluster sufficiently to increase the uncertainty in achieving the mean market share.
The purchase time effect: A sensitivity analysis on the shape parameter of individual purchase time distribution
- 6.17
- The previous two experiments examined a sensitivity analysis for the social network; we now examine purchase time. Figure 10 illustrates the mean market share paths of the three products with respect to changes in the shape parameter of the individual purchase time distribution. We varied the shape parameter, setting it at 0.01, 0.1, 1, or 10. However, we fixed the degree of connectivity at 0.01 and the rewiring probability at 0.05. As illustrated in Figure 2, the larger shape parameter causes a shift of peak in the individual purchase time distribution. For example, when the shape parameter is 10, the individual purchase time distribution resembles a normal distribution, and its peak is formed at Time Step 8 in the simulation.
- 6.18
- Figure 10 shows that a shape parameter greater than 1 results in different market share patterns for the three products. As the shape parameter was increased from 0.01 to 1, the market share paths of Product 1 and Product 2 fell slightly, whereas the market share path of Product 3 rose. When the shape parameter became greater than 1, the market share path of Product 1 fell initially and rose again at Time Step 8. Under the same conditions, Product 2 lost more market share after Time Step 8 (i.e., Product 2 lost 8%), and Product 3 lost less market share (approximately 1%).
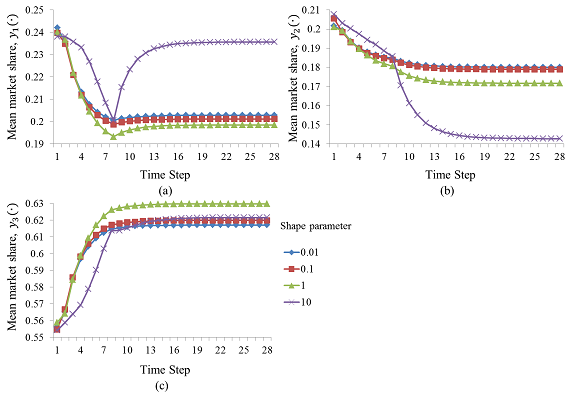
Figure 10. The mean market share paths with respect to changes in the shape parameter: (a) Product 1, (b) Product 2, and (c) Product 3 - 6.19
- It appears that Product 1 stole the market shares of Product 2 and Product 3 after Time Step 8, when the shape parameter was greater than 1. The single time distribution with the shape parameter greater than 1 represents a decreasing number of early adopters; potential consumers have more time to consider their product choices, and local and global network effects may have time to influence the potential sales. Hence, the market share gain of Product 1 indicates that purchase time effects helped consumers favour Product 1 instead of Product 2. Here, the worst product (Product 2) lost more market share than under the exponential-like individual purchase time distribution. Table 2 reports that Product 1 and Product 3 have similar evaluations for each product attribute, but there are differences in battery life and weight. The experts evaluated the battery life of Product 1 as "poor" but that of Product 3 as "very good". They also evaluated the weight of Product 1 as "very good" but that of Product 3 as "good". Because Table 3 tells us that battery life is not as important as weight, we may conclude that some consumers received information that Product 1 is better than Product 3 with respect to the more important product attribute of weight as time progressed and that the spread of this information affected the market share of Product 1, causing it to rise again when the shape parameter was 10.
- 6.20
- Figure 11 illustrates that the uncertainty in reaching the mean market share paths rises abruptly when the shape parameter is 10. The variances of Product 1 and Product 2 are approximately 0.000095 when the shape parameter is less than 1, and the variance of Product 3 is approximately 0.00013. However, the variances rise abruptly when the shape parameter is 10. The variances of Product 1 and 2 are 0.0002, and the variance of Product 3 is 0.00026. This pattern suggests a greater certainty of reaching the expected market share paths when the shape parameter is sufficiently small (i.e., smaller than 1). This metric is important to a firm because uncertainty is directly related to risk. However, the producer of Product 1 would prefer an individual purchase time distribution similar to a normal distribution, even when the uncertainty is high and there is a chance of earning a market share that is less than the expected share. This preference arises because the market share of the product is higher when an individual purchase time distribution follows a normal distribution than when the individual purchase time distribution follows an exponential distribution.
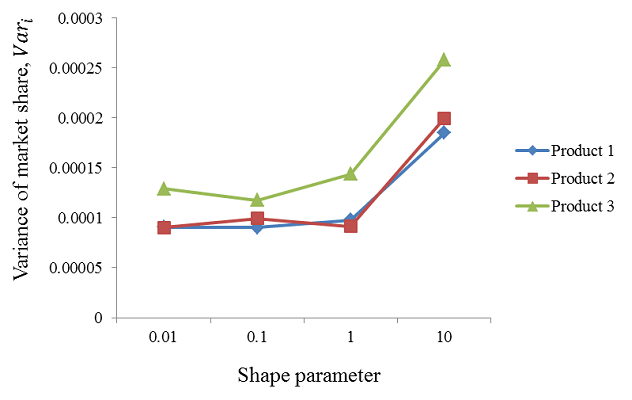
Figure 11. Variances of the market share paths with respect to changes in the shape parameter - 6.21
- Figures 10 and 11 reveal several marketing implications. The best and the worst products take advantage of an exponential-like individual purchase time distribution, but the second-best product does not benefit from this distribution. Thus, when a firm produces a product that earns the largest market share among competing products, the firm has an advantageous position, but the firm would still prefer people to purchase its product early. For a firm that produces the second-best product such as Product 1 (i.e., a firm produces a high-quality product but fails to become the first in the market), the firm should give people enough time to consider its product and let the network effect help the firm disseminate good information on its product even though the firm may lose certainty in achieving its mean market share. When the individual purchase time distribution of consumers resembles a normal distribution, the firms that produce low-quality products, such as Product 2, may need to sell out their products early.
Conclusions
- 7.1
- In this study, we proposed an agent-based simulation model to predict the brand-level diffusion of new products in a market. To test the performance of the model, we applied the model to the diffusion of netbook products competing in the online market in Korea. We focused on the individual purchase time distribution and social network structure that influence consumers' product choices. Social influence is transferred via local and global network effects on each product attribute, both from experts and previous adopters. The local network effect represents the network effect caused by the degree of connectivity (i.e., the number of neighbours), whereas the global network effect is the network effect attributed to the rewiring probability (i.e., the determinant of the number of shortcuts). Consumers collect information on product attributes through these network effects. Each consumer then applies his/her own weights for product attributes to choose the product with maximum utility. We model this product choice process using a fuzzy multi-attribute utility model. Finally, we add individual product purchase time distributions (i.e., the time when a consumer considers buying a product) to the model. With this complete model, we then simulate the product diffusion dynamics.
- 7.2
- We conducted an empirical study to estimate the individual purchase time distribution and the social network structure of Korean netbook consumers by estimating the shape parameter of the distribution and the degree of connectivity and the rewiring probability of the social network. We used dynamic time warping to calculate the aggregated distance between the actual market share paths and the market share paths generated by the simulation. We observed that the real-world individual purchase time distribution is similar to an exponential distribution (i.e., the shape parameter is 0.01), and the social network has a small number of neighbours but a larger number of shortcuts (i.e., the rewiring probability is 0.05, and the degree of connectivity is 5). This observation means that the Korean netbook consumer is likely to buy a product early; it also means that the Korean netbook consumer has a small number of communication channels through which to share information on products but easy to access other, distant consumers.
- 7.3
- We suspect that constant external shocks and the lack of a coercive synchronisation of product releases will necessitate upgrading our model. First, we assumed that every consumer-agent refers to the experts' opinions at the beginning of product diffusion. We may have neglected several external shocks (e.g., marketing strategies such as price discounts and promotions, changes in the experts' opinions, and operational problems) that occur unevenly in real life. Second, we aligned products' release times in the simulation so that the diffusion of the products began simultaneously. In particular, we truncated the two weeks of existing market shares for Products 1 and 2, which were released two weeks before Product 3. As a result, we may have lost the network effect on Product 1 and 2 accumulated during these two weeks.
- 7.4
- We varied the degree of connectivity, the rewiring probability, and the shape parameter to perform a sensitivity analysis. As the degree of connectivity was increased, the local network effect increased. However, the marginal effect was the greatest when the local network effect first arose (i.e., when the degree of connectivity was increased from 0 to 4). Our result shows that the local network effect increases the market share of the major product (Product 1) but reduces the market share of minor products (Products 1 and 2). This result informs us that consumers tend to follow the majority, but there are some consumers who are locked into minor products. The variances of the market share paths tell us that the uncertainty in achieving the mean market share paths is concave with respect to the degree of connectivity. The global network effect is similar regardless of the value of the rewiring probability. The initial evaluation of products is biased towards the experts' opinions, and the purchase times of Korean netbook consumers are early; thus, the global network effect has little time to influence these consumers. Finally, as the shape parameter of the individual purchase time distribution was increased up to a value of 1, the market share of the major product (Product 3) rose, but that of the minor products fell. However, as the shape of the distribution changed into a normal-like distribution, the purchase time effect was able to shed new light on Product 1 (i.e., the second-best product), and the market share of this product rose again after the fall. A minor product (in particular, the worst-evaluated product, Product 2) is benefitted as the individual purchase time distribution changes from a normal distribution shape to an exponential distribution shape, when a major product is negatively affected.
- 7.5
- In future work, we plan to include the following issues:
- It is necessary to conduct an analysis of variance on the degree of connectivity, the rewiring probability, and the shape parameter of the individual purchase time distribution to determine the interaction effects on the market share path.
- We may optimise our simulation model to better reflect the actual Korean netbook market shares by observing appropriate external shock events occurring in real life. This consideration will lead us to upgrade our model to predict the Korean netbook market share more precisely.
- Our simulation model assumes that all consumer-agents have willingness to buy products from the beginning of simulation. However, it may be necessary for our model to reflect a situation that some consumer-agents start to have willingness to buy products and accept product evaluation information from neighbours in the middle of simulation.
- In this study, we listed several threshold models and their shortcomings. However, a comparative study is required to determine the conditions under which each model is applicable.
- Producers may desire to know the conditions under which their products can claim additional market share. We aim to develop an optimised strategy that generates the best design for product attributes to maximise the market share of the producer.
Pseudocode
-
Function main
    Foreach rewiring probability
        Foreach degree of connectivity
            Foreach replication
                setup
                simulate
End

Function setup
    setup-individual-product-purchase-distribution
    make-consumers
    setup-globals
    assign-agent-attribute
    make-init-neighbors
    rewire-neighbors
    renew-links
End

Function setup-individual-product-purchase-distribution
    Foreach consumer agent
        Assign values to parameters (i.e., η=0.01, 0.1, 1, 10 and b=0.4) to initialise individual product purchase distribution
        Assign product purchase time from individual product purchase distribution
End

Function make-consumers
    Create some given number of consumers
End

Function setup-globals
    Initialise decision matrix of every consumer agent
    Assign 0 to time step
    Assign 0 to adopter number for each product
    Assign expert's opinion on products' attributes in linguistic form
    Assign crisp numbers to expert's linguistic opinion
    Assign crisp numbers to consumer's linguistic weights on product attributes
    Assign the probability of consumer's sensitivity to social influence in linguistic form
End

Function assign-agent-attribute
    Foreach consumer agent
        Initialise and assign consumer weights on product attributes, purchase time, sensitivity to social influence
End

Function make-init-neighbors
    Foreach consumer agent
        Assign neighbors as many as the degree of connectivity
End

Function rewire-neighbors
    Foreach consumer agent
        Connect to its own neighbors
    Rewire the connections in probability of rewiring probability
End

Function renew-links
    Foreach consumer agent
        if the number of connections is NOT equal to the degree of connectivity
            Add/Delete connections until the number of connections is equal to the degree of connectivity
End

Function simulate
    init-product-adopt-count
    make-consumer-weighted-decision-matrix
    init-early-adopter
    get-socio-decision-matrix
    get-alternatives-mnl
End

Function init-product-adopt-count
    Initialise adoption count for each product
End

Function make-consumer-weighted-decision-matrix
    Foreach consumer agent
        Retrieve expert's opinion
        Convert expert's opinion on product attributes into crisp numbers using triangular fuzzy number
        Retrieve consumer's weights on product attributes
        Convert consumer's weight on product attributes into crisp numbers using triangular fuzzy number
        Foreach product attribute
            Induce consumer's value on a product attribute by multiplying expert's opinion by consumer's weight on the product attribute
            Update the ideal product attributes in best case and the ideal product attributes in the worst case
End

Function init-early-adopter
    Assign early adopters among consumer agents
    Foreach early adopter
        Buy a product according to multi-nomial logit model
End

Function get-socio-decision-matrix
    Foreach consumer agent with no product purchase
        Retrieve all the neighbors' decision matrix and average them
        Reassign decision matrix by (1 - sensitivity to social influence) * my decision matrix + (sensitivity to social influence * the averaged decision matrix of all the neighbors
End

Function get-alternatives-mnl
    Foreach consumer agent with no product purchase, whose purchase time is equal to or more than the current time step
        Buy a product according to multi-nomial logit model
End
Acknowledgements
- This research was supported by the Basic Science Research Program through the National Research Foundation of Korea (NRF) funded by the Ministry of Education, Science and Technology (2010-0009267).
References
-
ALKEMADE, F., & Castaldi, C. (2005). Strategies for the Diffusion of Innovations on Social Networks. Computational Economics, 25(1), 3-23. [doi:10.1007/s10614-005-6245-1]
BEMMAOR, A. C. (1994). Modeling the diffusion of new durable goods: word-of-mouth effect versus consumer heterogeneity (with comments by F.M. Bass and V. Mahajan). In: Laurent, G., Lilien, G. L., Pras, B., & Management, E. I. f. A. S. i., Research Traditions in Marketing (Eds.) (pp.201-229). Kluwer Academic.
BEMMAOR, A. C., & Lee, J. (2002). The Impact of Heterogeneity and Ill-Conditioning on Diffusion Model Parameter Estimates. Marketing Science, 21(2), 209-220. [doi:10.1287/mksc.21.2.209.151]
CENTOLA, D., & Macy, M. (2007). Complex Contagions and the Weakness of Long Ties. American Journal of Sociology, 113(3), 702-734. [doi:10.1086/521848]
CENTOLA, D. (2010). The spread of behavior in an online social network experiment. Science, 329, 1194-1197. [doi:10.1126/science.1185231]
DELRE, S., Jager, W., & Janssen, M. (2007a). Diffusion dynamics in small-world networks with heterogeneous consumers. Computational & Mathematical Organization Theory, 13(2), 185-202. [doi:10.1007/s10588-006-9007-2]
DELRE, S. A., Jager, W., Bijmolt, T. H. A., & Janssen, M. A. (2007b). Targeting and timing promotional activities: An agent-based model for the takeoff of new products. Journal of Business Research, 60(8), 826-835. [doi:10.1016/j.jbusres.2007.02.002]
DENG, H., & Yeh, C.-H. (2006). Simulation-based evaluation of defuzzification-based approaches to fuzzy multiattribute decision making, IEEE Transactions on Systems, Man and Cybernetics, Part A: Systems and Humans, 36(5), 968-977. [doi:10.1109/TSMCA.2006.878988]
GOLDENBERG, J., & Efroni, S. (2001). Using cellular automata modeling of the emergence of innovations. Technological Forecasting and Social Change, 68(3), 293-308. [doi:10.1016/S0040-1625(00)00095-0]
GOLDENBERG, J., Libai, B., & Muller, E. (2001). Talk of the Network: A Complex Systems Look at the Underlying Process of Word-of-Mouth. Marketing Letters, 12(3), 211-223. [doi:10.1023/A:1011122126881]
GRANOVETTER, M. (1973). The strength of weak ties. American Journal of Sociology, 78(6), 1360-1380. [doi:10.1086/225469]
GRANOVETTER, M. (1978). Threshold models of collective behavior. American Journal of Sociology, 83(6), 1420-1443. [doi:10.1086/226707]
GUNTHER, M., Stummer, C., Wakolbinger, LM., & Wildpaner, M. (2011). An agent-based simulation approach for the new product diffusion of a novel biomass fuel. Journal of the Operational Research Society, 62, 12-20. [doi:10.1057/jors.2009.170]
GUSEO, R., & Guidolin, M. (2009). Modelling a dynamic market potential: A class of automata networks for diffusion of innovations. Technological Forecasting and Social Change, 76(6), 806-820. [doi:10.1016/j.techfore.2008.10.005]
HONG, T-P., & Lee, C-Y. (1996). Induction of fuzzy rules and membership functions from training examples. Fuzzy Sets and Systems, 84, 33 -47. [doi:10.1016/0165-0114(95)00305-3]
JANSSEN, M. A., & Jager, W. (2001). Fashions, habits and changing preferences: Simulation of psychological factors affecting market dynamics. Journal of Economic Psychology, 22(6), 745-772. [doi:10.1016/S0167-4870(01)00063-0]
JANSSEN, M. A., & Jager, W. (2003). Simulating Market Dynamics: Interactions between Consumer Psychology and Social Networks. Artificial Life, 9(4), 343-356. [doi:10.1162/106454603322694807]
KIM, S., Lee, K., Cho, J. K., & Kim, C. O. (2011). Agent-based diffusion model for an automobile market with fuzzy TOPSIS-based product adoption process. Expert Systems with Applications, 38(6), 7270-7276. [doi:10.1016/j.eswa.2010.12.024]
MOLDOVAN, S., & Goldenberg, J. (2004). Cellular automata modeling of resistance to innovations: Effects and solutions. Technological Forecasting and Social Change, 71(5), 425-442. [doi:10.1016/S0040-1625(03)00026-X]
PANGBURN, M.S., & Sundaresan, S. (2009). Capacity decisions for high-tech products with obsolescence. European Journal of Operational Research, 197, 102-111. [doi:10.1016/j.ejor.2008.05.026]
ROGERS, E.M. (2003). The Diffusion of innovations, (Fifth Eds.) (First Ed., 1962), New York: Free Press.
SAKOE, H., & Chiba, S. (1978). Dynamic programming algorithm optimization for spoken word recognition. Acoustics, Speech and Signal Processing, IEEE Transactions on, 26(1), 43-49. [doi:10.1109/TASSP.1978.1163055]
SCHWARZ, N., & Ernst, A. (2009). Agent-based modeling of the diffusion of environmental innovations - An empirical approach. Technological Forecasting and Social Change, 76(4), 497-511. [doi:10.1016/j.techfore.2008.03.024]
SHANNON, R. E. (1975). Systems simulation: the art and science: Prentice-Hall.
TELLIS, G.J., Yin, E., & Niraj, R. (2009). Does quality win? Network effects versus quality in high-tech markets. Journal of Marketing Research, 46(2), 135-149. [doi:10.1509/jmkr.46.2.135]
TRAIN, K. (2009). Discrete choice methods with simulation (2nd ed.). Cambridge ; New York: Cambridge University Press. [doi:10.1017/CBO9780511805271]
WANG, W.-J., & Luoh, L. (2000). Simple computation for the defuzzifications of center of sum and center of gravity. Journal of Intelligent Fuzzy Systems, 9(1-2), 53-59.
WATTS, D. J., & Strogatz, S. H. (1998). Collective dynamics of `small-world' networks. Nature, 393(6684), 440-442. [doi:10.1038/30918]
WU, S.D., Erkoc, M., & Karabuk, S. (2005). Managing capacity in the high-tech industry: a review of literature. The Engineering Economist, 50, 125-158. [doi:10.1080/00137910590949887]
YEH, C.-H., & Kuo, Y.-L. (2003). Evaluating passenger services of Asia-Pacific international airports. Transportation Research Part E, 39, 35-48. [doi:10.1016/S1366-5545(02)00017-0]
ZIMMERMANN, H. J. (2001). Fuzzy set theory--and its applications (4th eds.). Dordrecht ; Boston: Kluwer Academic Publishers. [doi:10.1007/978-94-010-0646-0]