
 Abstract
- Meadows and Cliff (2012) failed to replicate the results of Deffuant et al. (2002) and concluded that our paper was wrong. In this note, we show that the conclusions of Meadows and Cliff are due to a wrong computation of indicator y, which was not fully specified in our 2002 paper. In particular, Meadows and Cliff compute indicator y before model convergence whereas this indicator should be computed after model convergence.
- Keywords:
- Opinion Dynamics, Social Simulation, Agents Based Model
- 1.1
- Meadows and Cliff (2012) failed to replicate the results of Deffuant et al. (2002) and concluded that our paper was wrong. In fact experience shows that such discrepancies are more often due to missing specifications of the model than programming errors, as reported in Axelrod (1997). In this note, we show that the conclusions of Meadows and Cliff are due to a wrong computation of indicator y, which was not fully specified in our 2002 paper. In particular, Meadows and Cliff compute indicator y before model convergence whereas this indicator should be computed after model convergence (namely when all the agent opinions are completely stabilized).
- 1.2
- We ran the Meadows Java code with its default parameters and we reproduced their results of average y, on figure 1 (same as the right panel of figure 12 in their paper).
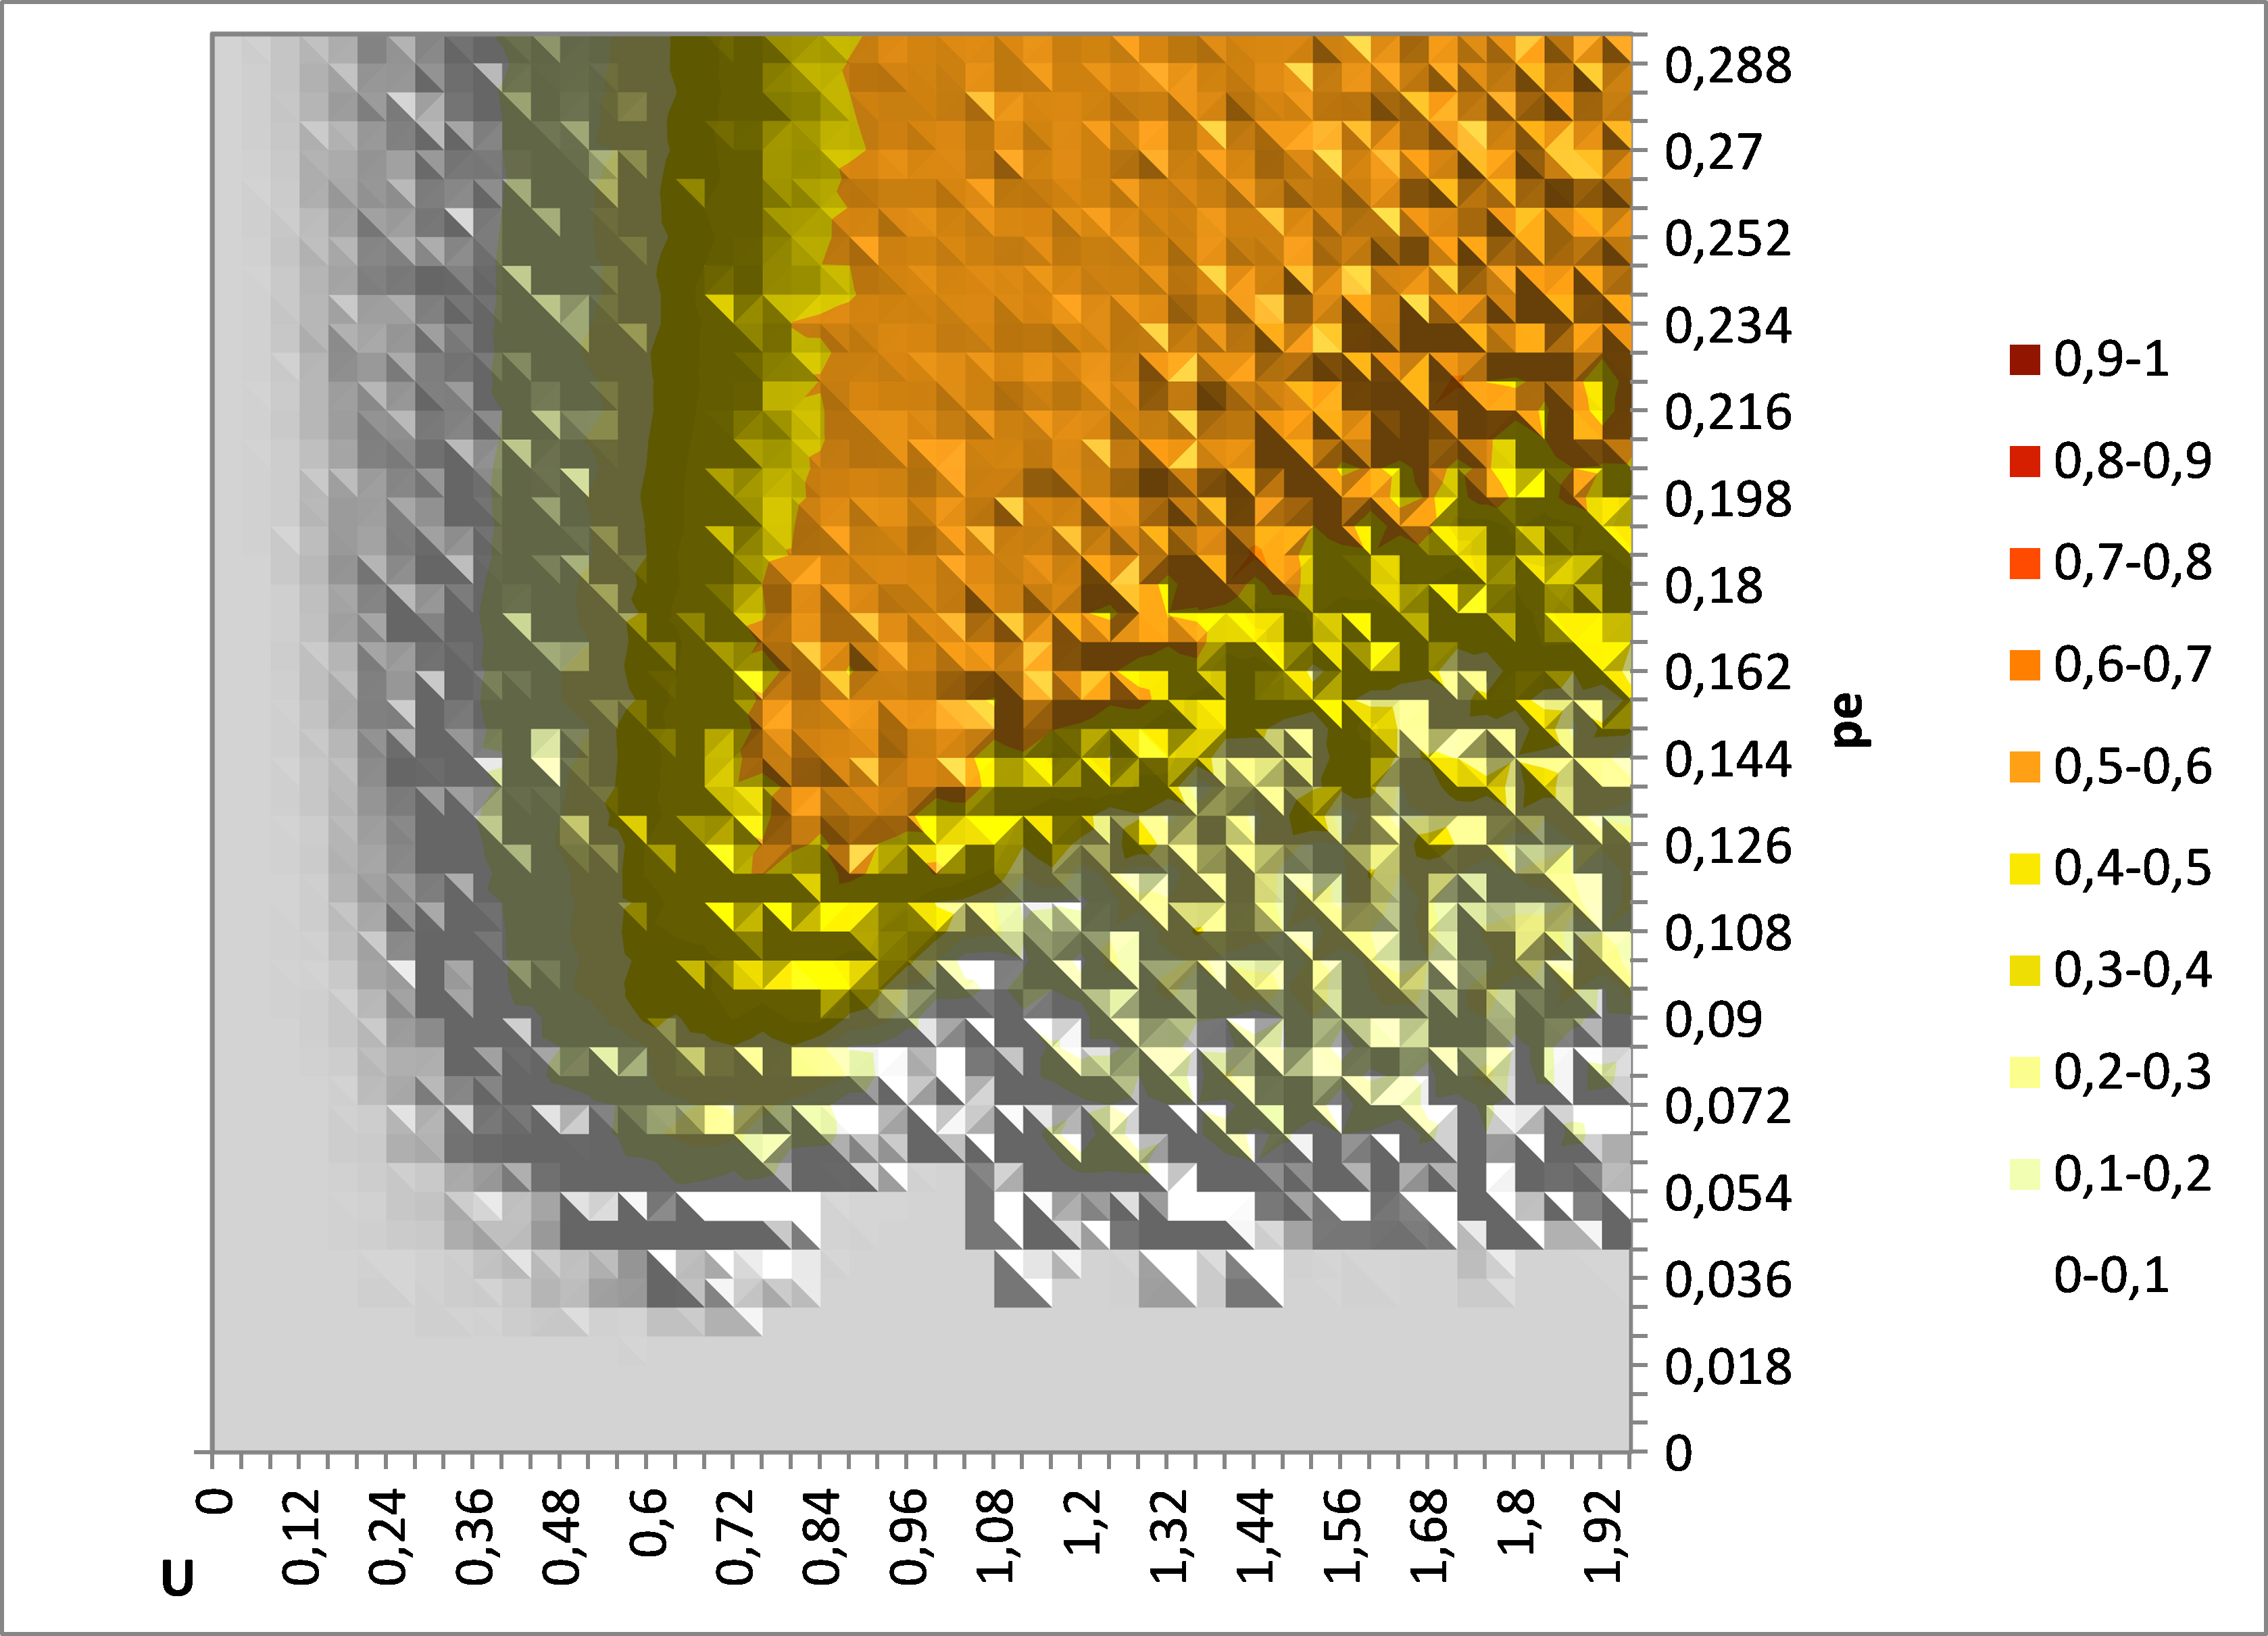
Figure 1. Reproduction of Meadows and Cliff result of average y (over 50 replicates) with Meadows Java program. N = 200, μ = 0.2. This result is the same as the one of figure 12 in Meadows and Cliff's paper, right panel. - 1.3
- From these results (Figure 1 above and right panel of figure 12 in their paper), it appears that in the zone of small pe and large U, the average value of y is close to 0, whereas in the previously published results about this model, the indicator is close to 1 for these values of parameters (see left panel of figure 12 in their paper). Meadows and Cliff conclude there is no single extreme convergence for these parameters values.
- 1.4
- However, when running the model with their own program for pe = 0.03, U = 1.4, and all the default parameters except a larger number of iterations (750 * N iterations instead of 200 * N), we get almost always graphs such as the one shown on Figure 2.
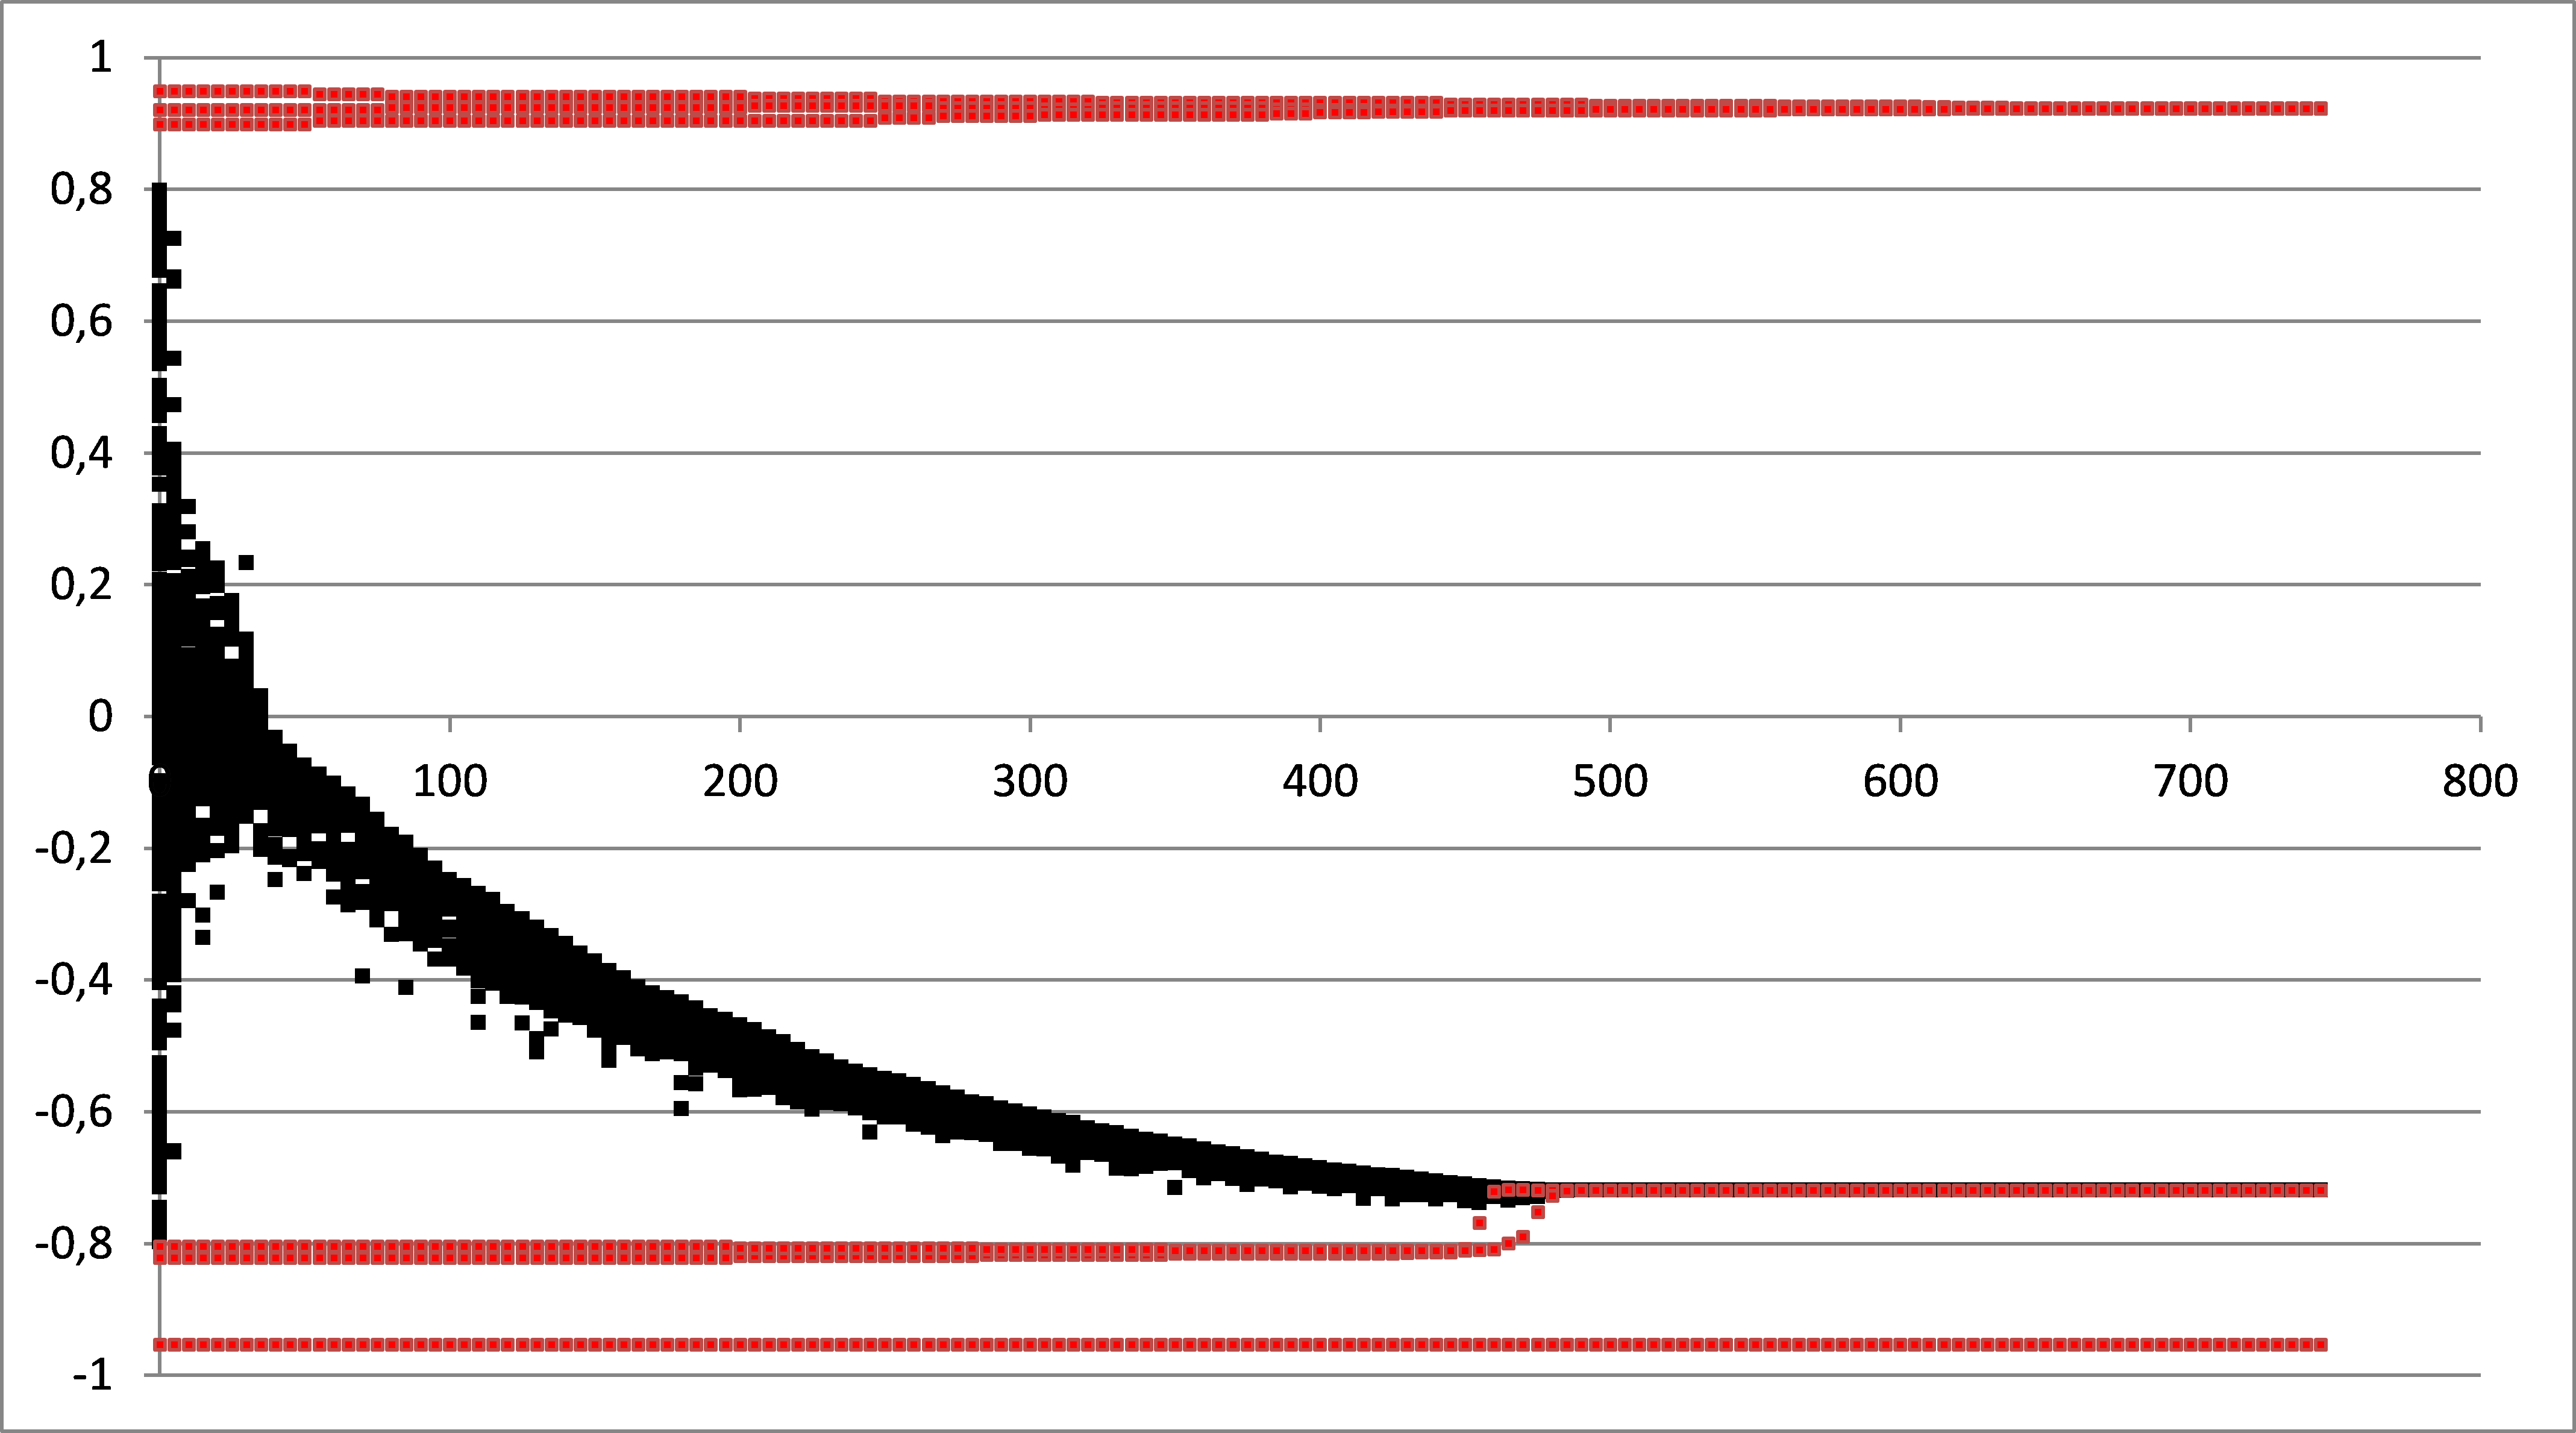
Figure 2. Example of run done with Meadows program for pe = 0.03 and U = 1.4. The x axis is the number of N pair iterations. The y axis is the opinion of the agents. The other parameters are the default ones (N = 200, μ = 0.2), except the number of pair iterations which is 150 000 (750 * N) instead of 40 000 (200 * N). The initial extremists are figured in red. - 1.5
- The example of figure 2 is clearly a single extreme convergence, in the sense of a pattern showing a strong symmetry breaking, leading to an average opinion with a significant absolute value (whereas the average opinion is initially close to 0). It perfectly fits the standard behavior of the model that we described in Deffuant et al. (2002) and in Deffuant (2006). The interpretation that Meadows and Cliff make of their results at this point is therefore wrong.
- 1.6
- From our analysis of the Meadows Java program, there are two reasons for this error:
- Meadows program computes y at iteration 200 (40000 pair iterations for 200 agents). It is obvious on the run of figure 2 that at iteration 200, the model has not converged yet: the agents are not yet extremists, the value of indicator y is thus 0. There are possibilities to be sure that the convergence is reached in this model, but in our 2002 paper, we simply identified a number of iterations that guarantees the convergence from the observation of a large set of simulation examples.
- A second small adjustment is necessary to get the results of our paper of 2002. On figure 2, one can notice that, even at convergence, many agents opinions are above the extremism threshold (-0.8). Hence taking -0.8 as the threshold for extremism is not adequate. One should rather take -0.7. In general, the threshold for defining the new extremists should be a bit smaller (in absolute value) than the one used to define the initial extremists.
- 1.7
- We did not describe these details in our paper of 2002, which explains why Meadows and Cliff did not implement the computation of indicator y correctly. However, we believe that observing figure 2 leads to conclude that these adjustments are necessary. Moreover, in Deffuant (2006), we study the model with a better definition of the initial extremists (having an opinion of +1 or -1) and we describe an algorithm for classifying the convergence patterns in details.
- 1.8
- Once the above adjustments are made in Meadows program (240 000 pair iterations, i.e. 1200 *N, instead of 40 000, i.e. 200 * N, and the definition of new extremists with a threshold lower of 0.1, in absolute value, than the threshold for initial extremists, see appendix for details) this program yields the results presented on figure 3, which are in very good accordance with our results of 2002 and 2006: we observe that the single extreme convergence is very frequent (often more than 80% of the simulations) for low values of pe and large values of U.
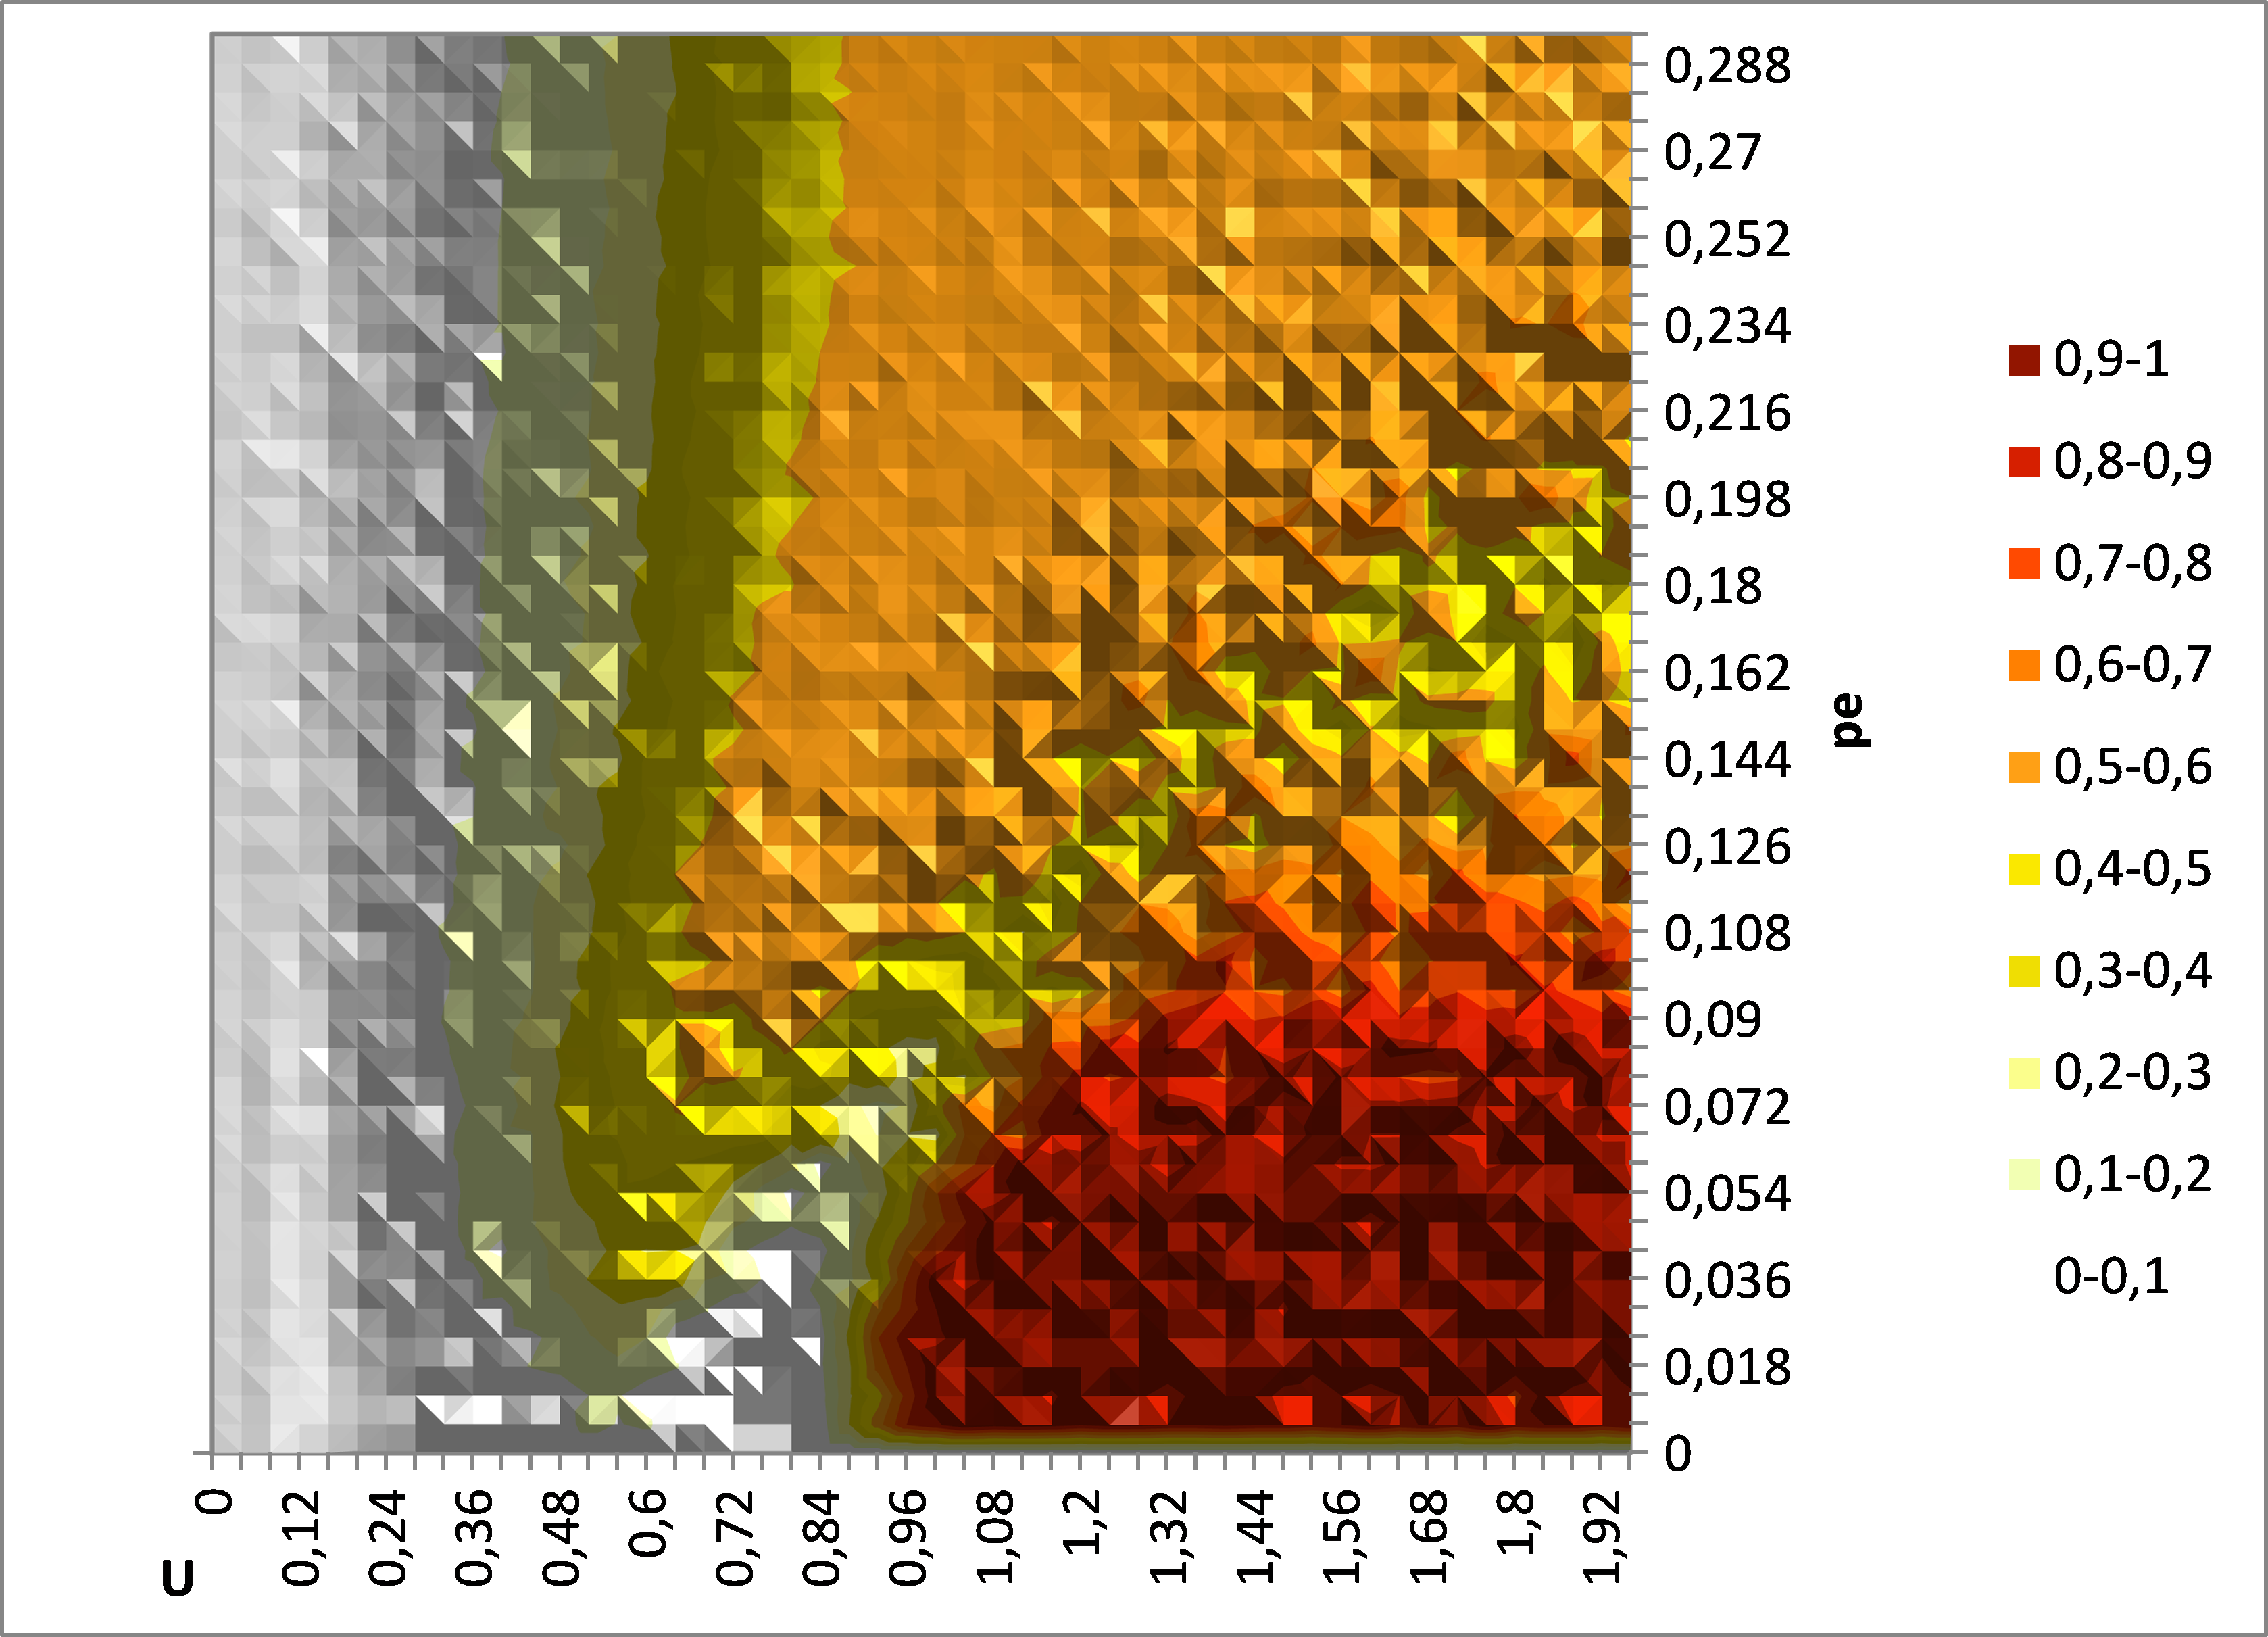
Figure 3. Map of average indicator y (over 50 replicates) given by Meadows java program with y measured at 1200 * N pair iterations and threshold for new extremists (in absolute value) lower of 0.1 than the threshold for initial extremists. N = 200, μ = 0.2 as in figure 1. These results are very similar to those of our 2002 and 2006 papers (see left panel of figure 12 in Meadows and Cliff paper). - 1.9
- In paragraph 5, Meadows and Cliff study the average of y for simulations with an increasing number of agents N (up to N = 1000). They conclude from their results (section 5.3) that "the noise effects decrease as does the initial population instability (as shown by the vast area where y is consistently very close to 0)." This conclusion is wrong for the same technical reason. When the number of agents increases, the convergence to the single extreme is slower, but it still takes place consistently in the same region of the parameter space (small proportion of extremists and large initial uncertainty of moderate agents). This can be checked on figure 4, representing the map of average y, measured after 4000*N pair interactions, for N = 1000 agents.
- 1.10
- For the readers interested in the model, we would like to mention that in Deffuant and Weisbuch (2008) we propose a qualitative mathematical study of single extreme convergence, using evolving probability distributions which approximate the model with an infinite number of agents. In particular, this paper shows why a low proportion of extremists favours the single extreme convergence. This paper gives also strong evidence that the single extreme convergence takes place with any large number of agents.
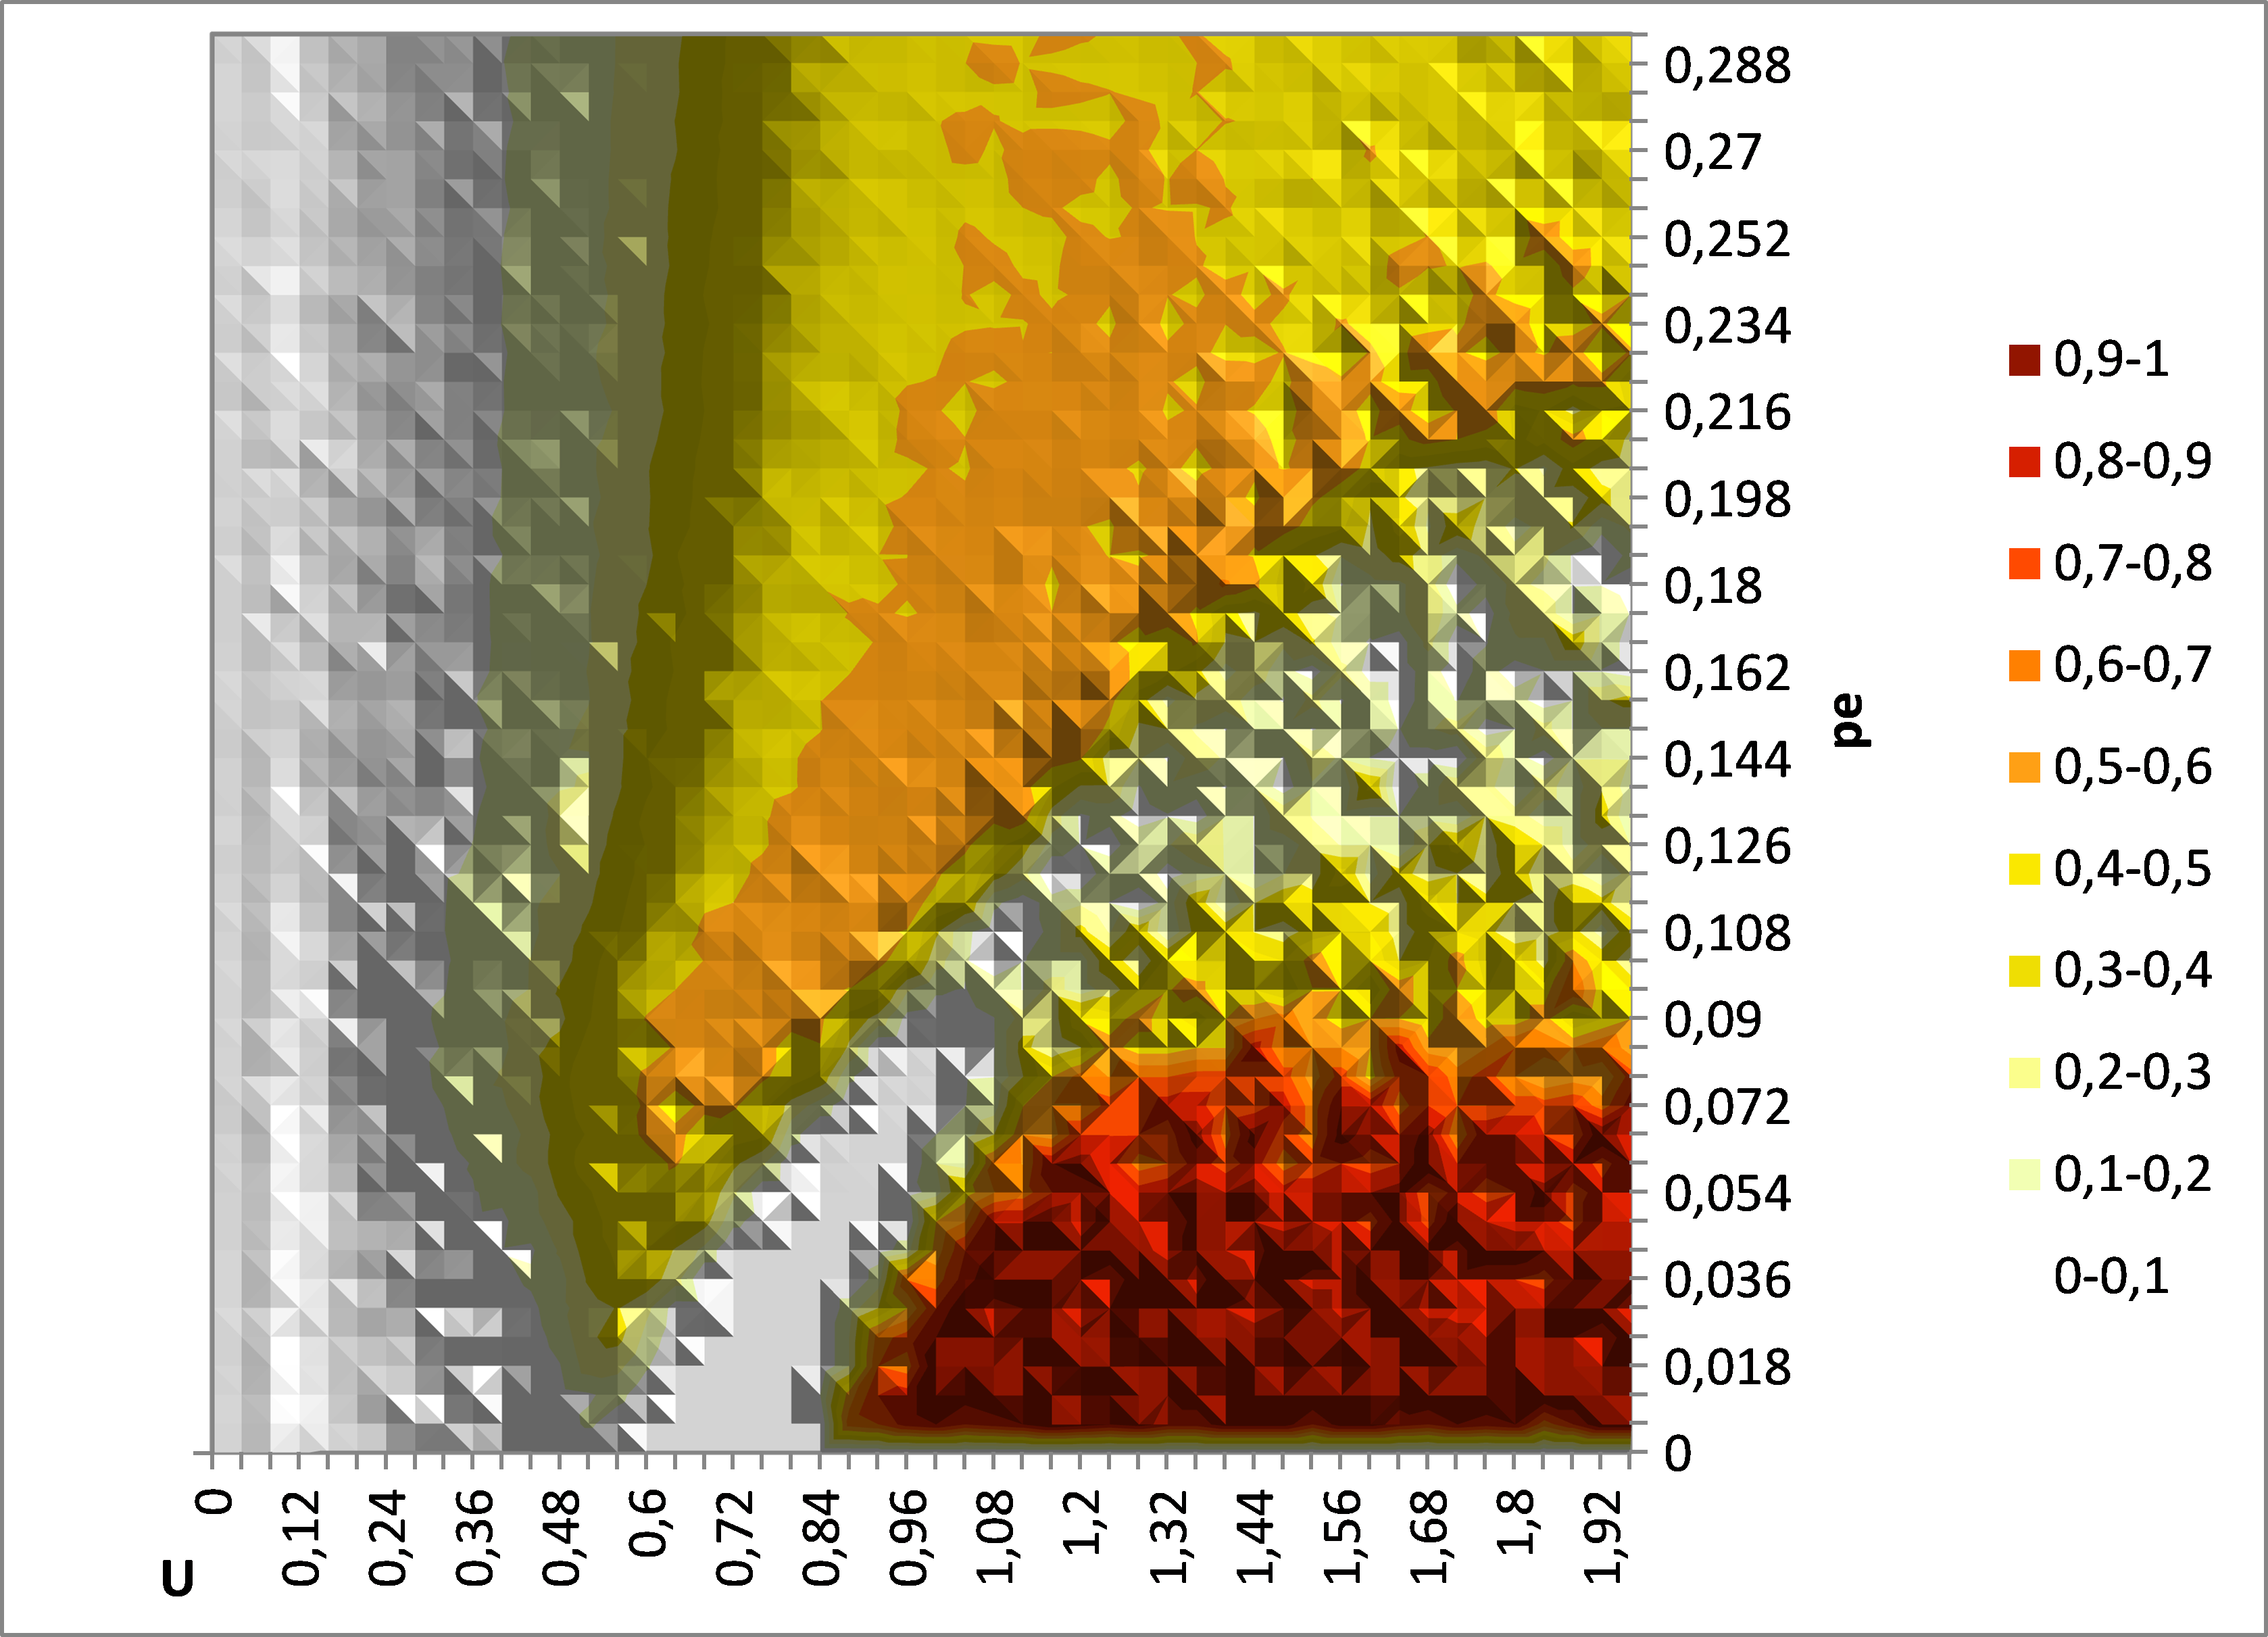
Figure 4. Map of average indicator y (over 20 replicates) given by Meadows java program for N = 1000 with y measured after 4000 * N pair iterations and threshold for new extremists (in absolute value) lower of 0.1 than the threshold for initial extremists. μ = 0.2. The single extreme convergence is still significantly present.
Appendix: changes in the java code of Meadow and Cliff leading to the correct results
- A.1
- In this appendix, we specify the changes that we made in the java source code given in appendix of Meadows and Cliff's paper, and that lead to the correct results so that anyone can replicate them.
Change 1: number of pair iterations put to 240 000 instead of 40 000:
public static final int INTERACTIONS = 240000; // instead of 40000
Change 2: in the computation of y, change thresholds for extremism (added code in red):
	if (agent[i].getOpinion() > EXTREMIST_OPINION_BOUNDARY-0.1)
                    newPositiveExtremists++;
        if (agent[i].getOpinion() < -EXTREMIST_OPINION_BOUNDARY+0.1)
                    newNegativeExtremists++
- A.2
- For running Meadows program with large number of pair interactions especially in the case of 1000 agents, we removed the memory of each opinion that was implemented in Agent.java class.
References
-
AXELROD, R. (1997). The complexity of cooperation (Appendix A). Princeton University Press.
DEFFUANT, G., Amblard, F., Weisbuch, G. and Faure, T. (2002). How can extremism prevail? A study based on the relative agreement interaction model. Journal of Artificial Societies and Social Simulation , 5(4): 1 https://www.jasss.org/5/4/1.html.
DEFFUANT, G. (2006). Comparing Extremism Propagation Patterns in Continuous Opinion Models. Journal of Artificial Societies and Social Simulation , 9(3):8 https://www.jasss.org/9/3/8.html.
DEFFUANT, G. and Weisbuch, G. (2008). Probability Distribution Dynamics Explaining AgentModel Convergence to Extremism. In B. Edmonds, C. Hernandez & K. G. Troitzsch (Eds.), Social Simulation: Technologies, Advances and New Discoveries (pp.43-60). Idea group Inc. publishing.
MEADOWS, Michael and Cliff, Dave (2012) 'Reexamining the Relative Agreement Model of Opinion Dynamics' Journal of Artificial Societies and Social Simulation 15 (4) 4 https://www.jasss.org/15/4/4.html.