
 Abstract
- This paper presents a computer based simulation model which analyses the dynamics of public perceptions of risk using Bovine Spongiform Encephalopathy (BSE) ('mad cow disease') in the UK as a case study. The model is based upon a theoretically-derived understanding of the concept of perception of risk, and employs Cultural Theory and the archetypes it identifies as distinctive forms of social organization and cultural bias in the formation of perceptions. Cultural Theory is used as a theoretical lens for understanding the different interpretations of the risk associated with BSE/nvCJD, the subsequent risk amplification by the media, and the effect of trust and reliance in science and government in their construction. The analysis helps achieve a better understanding of the dynamics of public perceptions of risk, and it is therefore of interest both for academics and policy makers. In particular, the model allows exploring the influence that the occurrence of risk-related events, their media coverage, and trust in government responses has in the process by which people construct their risk perceptions.
- Keywords:
- Risk Perceptions, Cultural Theory, Simulation Modeling, BSE
Introduction
- 1.1
- Bovine Spongiform Encephalopathy (BSE), commonly known as 'mad cow disease' was, arguably, the major risk issue of the past several decades in the UK. The prion agent responsible for BSE is now understood to have jumped the species barrier and to have resulted in a fatal condition in humans who were exposed to the infectious agent through handling diseased cattle or eating contaminated animal products. This condition is known as new-variant Creutzfeld Jacob Disease (nvCJD). BSE/nvCJD has been extensively studied by natural scientists, and the whole episode was thoroughly reviewed by the Phillips Enquiry, which published a substantial report on BSE in 2000 (Phillips 2000). Social scientists have also taken a keen interest in the BSE saga (van Zwanenburg and Millstone 2005; Miller 1999; Seguin 2000; Wynne 1996). This paper presents a computer-based social simulation model (Gilbert and Troitzsch 1999; Hanneman and Patrick 1997; Klüver et al. 2003) to analyse the formation of public perceptions of risk using the BSE episode as a case study. The model provides a quantitative operationalization of the multi-dimensional concept of risk perception, and of the relevant variables and relationships that influence its emergence and maintenance over time. Section 2 provides a justification of a social simulation modeling approach to the issue of understanding the dynamics of risk perceptions. The subsequent sections of the paper provide a description of the variables and structure of the model along with an outline of the main conceptual hypotheses we have drawn upon in building it. Section 4 analyses the dynamics of public perceptions of risk based on the results of selected simulations. Section 5 presents comparisons and potential correspondence between available empirical data and the model's simulated trajectories. The paper ends with conclusions and future lines of research.
Rationale for Using Social Simulation Modeling
- 2.1
- Simulation modeling has recently become a major analytical tool for the study of dynamic systems in a wide range of disciplines including the social sciences. A substantial number of researchers, concerned with both abstract theorizing and empirical estimation, have adopted this formal methodology as an alternative to other more traditional analytical methods, which are considered unable to provide satisfactory approaches for analyzing complex dynamics systems. In a complex setting, mathematical analysis is generally limited in its ability to derive the system's dynamic characteristics, and simulation modeling is one response to complexity (Hanneman and Patrick 1997; Nuno et al. 2005).
- 2.2
- In this work we apply simulation modeling as a tool for theory building and development (Gilbert and Troitzsch 1999; Klüver et al. 2003; Ulrich and Troitzsch 2005; Smith and Conrey 2007), for the case of theoretical approaches to the formation of risk perceptions. The application of this methodology for theory development implies the transformation of specific theoretical approaches to social dynamics into a formal model. This requires a number of explicit choices about levels of analysis, dynamic aspects to focus on, and the classification of relevant parameters. By variation of these parameters within different scenarios it is possible to investigate if the main elements of the theory (which is sometimes under-expressed in formal terms) can be reproduced (Hanneman and Patrick 1997). In particular, simulation modeling permits two key theory developments: rigorous testing, refinement, and extension of existing theories that (given their complexity) have proven difficult to formulate and evaluate using standard statistical and mathematical tools; and a deeper understanding of fundamental mechanisms that underpin the dynamics of the phenomenon that the theory is attempting to explain.
- 2.3
- The transformation of the (usually informal) theory into a formal model demands an operationalisation and a higher level of precision of the key premises and statements of the theory (Klüver et al. 2003); this may give new insights into the original theory. The representation of a theory in informal language can hide inaccuracies and vagueness that become manifest only with the construction of a formal model (Holland and Miller 1991).
- 2.4
- As indicated, in this work we apply simulation modeling as a tool for theory development in understanding the formation of risk perceptions. In particular, our model is a tool for the theoretical elaboration and integration of existing approaches, and is aimed at operationalising/formalizing some of the most relevant theoretical concepts that currently exist in the literature of risk perceptions. The model provides a conceptualisation and quantitative operationalisation of the dynamics of risk perception underpinned by a solid theoretical framework based on well-established theories and a user-friendly analytical tool that can be employed as a template to run simulations for many different theoretical scenarios.
- 2.5
- Our focus on theory building comes at a cost, however, in particular related to the validation of the model against empirical data. Validation of models of complex systems is problematic and despite numerous contributions on the subject, a common protocol for the design and validation of simulation models has not yet emerged (Matteo et al. 2006; Fagiolo et al. 2007; Pyka and Fagiolo 2007; Safarzyńska et al. 2010). This is partly due to the fact that there are usually no, or very little, data available for the empirical validation and the calibration of the model. [1] Once a model has been built, the outputs can be used to test the implications of the theory, rather than depict 'reality'. However, if the model has been constructed well, it allows researchers to gain a more complete understanding of the theory's limitations and implications. In short, observation, insight, and prior work give rise to a tentative theory that is stated quite formally and specifically in a model; and the model is used as a way of investigating (logically deducing) the implications of the theory across a range of scenarios (Hanneman and Patrick 1997). The transformation of an original theory into a model may show that the theory needs to be enlarged and corrected. In many cases, the theory needs not only higher levels of precision but also extension at critical points. Clearly, if a theory can be transformed into a formal model only by changing its key premise, it is likely that the original theory had little explanatory power (ibid, p.10). With these advantages and limitations in mind, we turn now to describing a dynamical systems model of risk perceptions.
Description of the model
- 3.1
- Constructing a model of the public perceptions of risk requires the adoption of a position vis-à-vis the vast literature on the origins and maintenance of risk perceptions. The positions range from social constructionism through critical realist to positivist approaches. Here we have employed Cultural Theory (CT) as developed by Douglas (1982), Douglas (1992), Douglas and Wildavsky (1982), Thompson et al. (1990), Schwarz and Thompson (1990), Gross and Rayner (1985), and Rayner and Cantor (1987) amongst others. Risk perception is defined in this work as "the subjective assessment of the probability of a specified type of accident happening and how concerned we are with the consequences" (Sjoberg et al. 2004, p. 8).[2]
- 3.2
- Since we employ 'mad cow disease' in the UK as a case study and Cultural Theory as a theoretical framework, we have termed our model COWCULT. In our view, CT constitutes a viable theoretical lens for understanding different interpretations of risk and has already been used successfully in previous simulation exercises, e.g. in modeling public perceptions of climate change risks (Janssen 2002; Janssen and de Vries 1998). Cultural theory is a form of 'constrained relativism', that is, it accepts the existence of more than one interpretation of the 'same' evidence (including that from science), but does not entertain belief in a multiplicity of interpretations specific to each new context. The way that evidence is arranged, selected and used by groups of individuals to justify a position in CT is limited to four basic archetypes: hierarchy (H), individualism (I), egalitarianism (E) and fatalism (F) which we have collectively termed Cultural Theory Archetypes (CTAs). The theory, however, also accounts for dynamic changes between different CTAs.
- 3.3
- This paper is not the place to defend CT or to enter a lengthy digression into its selection here. There are also several different interpretations of CT, especially the extent to which perceptions and beliefs are closely or loosely related to the social context. Mary Douglas regarded the social context and perceptions as being closely entwined, to the extent that she was skeptical of their divorce. Many other writers in the tradition have allowed for their partial separation, however, and it is this strand of the theory that we adopt here. A summary of the world views of the four CTAs is presented below.
- Individualism puts emphasis upon the individual person as the appropriate unit of analysis and regards those individuals as inherently self-seeking and atomistic. Individualists are subject to minimal proscriptions and prescriptions and believe in the operation of the 'invisible-hand'; the pursuit of self-interest within self-organizing networks (markets) is believed to maximize social welfare. Individualism favours de-regulation, the freedom to take risks and to innovate and the preferred learning style is trial-and-error. Nature is regarded as benign and forgiving, able to recover from disturbances and disruptions.
- Egalitarianism is communitarian, maintaining belief in equality and the right and responsibility of every member to contribute to decision making. Humans are regarded as being essentially caring and sharing (until corrupted by coercive and inegalitarian institutions: markets and hierarchies). Nature is perceived as being fragile, intricately interconnected and ephemeral -readily perturbed by anthropogenic influences. The 'precautionary principle' is the favored heuristic for making decisions under uncertainty.
- Hierarchy is collective but embraces structure and stratification—and often elaborate sets of prescriptions and proscriptions by which to distinguish roles and hold people and organizations to account. Humans are malleable: often deeply flawed but redeemable by firm, long-lasting and trustworthy institutions. Nature is perceived as being stable until pushed beyond discoverable limits—perverse (where poorly understood and managed) but tolerant (where the limits are revealed (a role for certified experts) and acted-upon (the domain of technocrats)). Expert- and science-based assessment and judgment in the context of statutory regulation is the preferred decision-making style.
- Fatalism is a world of proscriptions and prescriptions but without a sense of agency or influence. Humans are perceived as being fickle and untrustworthy. Fairness, in consequence, is an unrealistic aspiration and there is no possibility of effecting change for the better. Nature is regarded as being capricious and random—there is no discernible pattern in how it responds to anthropogenic perturbations. The fatalist's world (unlike those of the other three CTAs) is one in which learning is impossible. 'Why bother?' therefore, is the rational management response.
- 3.4
- COWCULT, as a social simulation model, allows for the perception and construction of risk differently according to the internal logic and predilections of each specific CTA. The CTAs do not refer to individual perceptions, but rather to social tendencies or proclivities which emerge from reinforcing worldviews and social experience and context; hence the use of the term 'archetypes'. While primarily based upon the theoretical assumptions of CT, COWCULT also draws upon psychometric and sociological theories of risk, risk amplification and trust. The model incorporates and formalizes the hypotheses postulated by these theories with the aim of contributing to the development of a more-inclusive theoretical approach for the analysis of risk perceptions. The model is a system dynamics model built using the software package Stella Version 7.[3] The process by which risk perceptions develop and change is complex and not universally or reliably reducible to a small number of determinants. The literature suggests that many factors influence perceptions, both positively and negatively, and that these factors are frequently interacting with one another. As a result, the formation and evolution of risk perceptions is a suitable challenge for simulation modeling.
- 3.5
- Our main objective is the construction of a robust simulation model which allows the testing out of the internal conceptual validity of the aforementioned theories of risks. We employ CT as a theoretical lens for understanding the different interpretations that cultural archetypes (individuals or collections of individuals) make of the risks they face. According to CT, agents or individuals interpret events in a different manner depending on the cultural group or archetype to which they ascribe, lean or belong.
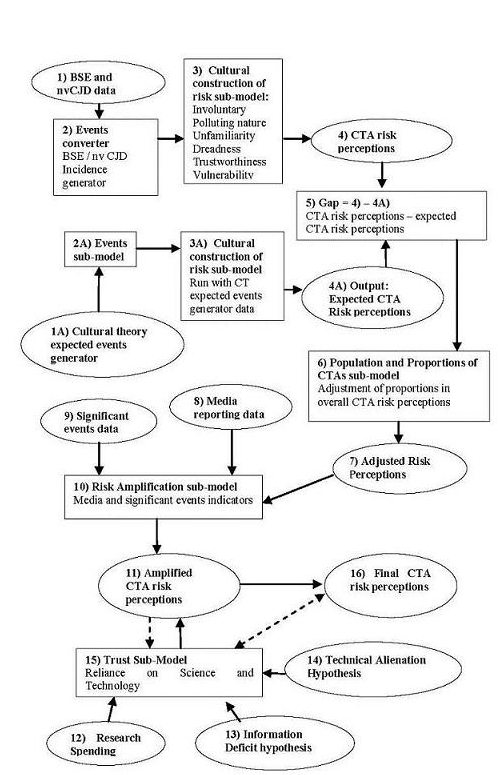
Figure 1. Outline of the model - 3.6
- The model is composed by the following four sub-models—see Figure 1 for an overview of its general structure, and the steps we have followed in its construction:
- The Cultural Construction of Risk Sub-Model (Steps 1 to 4)
- The Theory of Surprise Sub-Model: The Dynamics of Shifts between different Cultural Archetypes (Steps 1A to 4A, and 4 to 7)
- The Risk Amplification Sub-Model (Steps 7 to 10)
- The Trust-Reliance Sub-Model (Steps 11 to 15)
The Cultural Construction of Risk Sub-Model
- 3.7
- The Cultural Construction of Risk sub-model operationalises the way in which different Cultural Theory Archetypes (CTAs) construct their perceptions of risk when they face the occurrence of BSE related events. The model considers two types of events: the number of cases of BSE, and the number of human deaths from nvCJD. We have employed actual empirical data as the inputs to the variables BSE/nvCJD which calculates the accumulated number of cases of BSE (Bovine events empirical) and of human deaths from nvCJD (Human deaths empirical) on a weekly basis over the time period July 1988 to March 2004 (see Figure 2 for the Individualist CTA). Since the interpretation that each of the four CTAs makes of the accumulation of BSE and nvCJD events over time is different, their influence on the construction of risk perceptions will also differ for each CTA. In order to account for this effect, the model assigns different weights to the same number of accumulated events for each CTA. These weights (BSE and nvCJD multipliers in Figure 2) represent the first filter 'applied' by adherents (agents or individuals) to different CTAs and therefore make different interpretations of the same evidence or facts.[4]
- 3.8
- For instance, in the case of the egalitarians, the weight given to the number of accumulated BSE related events is the strongest (the BSE multipliers takes a high value) since we have assumed that the death of animals is considered by the egalitarians as a very significant event (relative to its significance to the other CTAs). Individualists, on the other hand, tend to value human life above all else, and so their weighting of nvCJD deaths is the highest of all CTAs. Fatalists and hierarchists have been assigned multipliers whose values are somewhere in between. The next step in developing the Cultural Construction of Risk Sub-Model (Step 3 in Figure 1) has been to establish the key dimensions of the issues that affect the construction of perceived risks by individuals. Drawing from the risk literature, in particular from the psychometric and sociological approaches (Adams 1995; Krimsky and Golding 1992), the model incorporates seven dimensions of risk perceptions. These are perceptions of: involuntariness (Slovic 2000), polluting nature (Douglas 1966), unfamiliarity (Slovic 2000), dreadness (Slovic 2000), trustworthiness (Wynne 1987), vulnerability (Slovic 2000), and perceptions of fairness (Rayner and Cantor 1987).
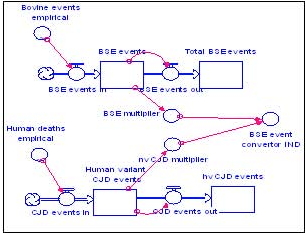
Figure 2. BSE/nvCDJ accumulated events for the Individualist CTA - 3.9
- The perceptions of risk associated with the accumulated number of BSE related events (represented by the BSE event convertor) are defined by the variables Risk perceptions convertor for each CTA. These are scaled variables which take values between 0 and 100 reflecting the different strengths or level of risk perceived by each CTA: the value 0 represents the case in which individuals perceive the sustained occurrence of actual BSE related events as not entailing any risk, and the value 100 represents the case in which they perceive that this accumulation of events involves a highly significant risk.[5] In order to account for the multifaceted nature of the perceptions of risk, the Risk perceptions convertor for each CTA is calculated as a function of the seven dimensions listed above (see Figure 3 for the case of the Individualist CTA). In particular, perceptions of risk are computed as a weighted linear combination of the variables representing the key risk dimensions. The values assigned to the weights differ for every CTA according to the relative importance each CTA places on each dimension when constructing their perception of risk: each dimension contributes to a greater or a lesser extent to the increase (or maintenance) of the perceptions depending on the specific characteristics of each CTA. (Table 1 provides an explanation of the way the weightings for the different CTAs have been defined).
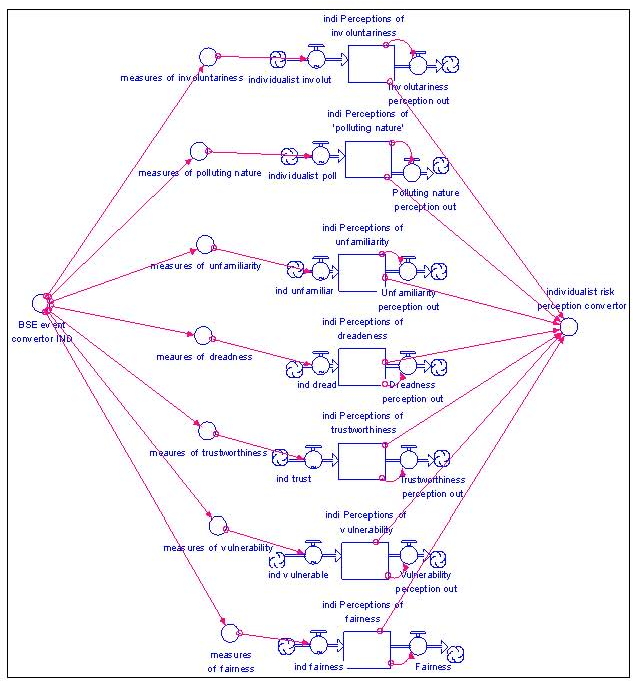
Figure 3. The Cultural Construction of Risk Sub-model for the Individualist CTA Table 1: Weightings of the seven dimensions of risk for each CTA Cultural Theory Archetypes Individualists Egalitarians Hierarchists Fatalists Rationale for Weightings Individualists rely upon their own sense of trust in others, hence weight for trustworthiness is high.
Individualists believe that equality of opportunity is vital, hence fairness is also highly weighted.Egalitarians have a strong concern about potential risks and hence tend to regard all the 7 variables as important. They rate dreadness slightly more since for them nature is ephemeral, and hence quite unstable. Fairness is also a very important variable. Hierarchists allocate weightings fairly evenly across the 7 variables, reflecting their preference for inclusion of many dimensions in decision making. Trust is an important attribute in this archetype along with reducing vulnerability and increasing equality. Fatalists will be most concerned about fairness—they think that they are always on the receiving end of risks. They also regard themselves as vulnerable to risks being imposed upon them. Of less importance to fatalists are involuntariness (rarely able to make it otherwise), trust (low in any case) and polluting nature. Involuntariness All decisions are ultimately voluntary provided that deliberate falsehoods are not purveyed. Government and industry cannot be trusted. In reality most decisions are involuntary. Provided reliable and easy-to-understand information is provided, decisions are voluntary. Many decisions are in reality involuntary, but it is difficult to say in advance which ones! Weighting 0.5 1 0.6 0.5 Polluting Nature Where there is clear empirical evidence of genetic transfer between species, then there is the potential for polluting nature. But potential is not the same as 'realised'. We should assess genetic pollution in theoretical terms. A potential risk should be assumed to become a realised risk due to unexpected contingencies. There is no single answer as the risk of genetic pollution depends upon the donor, host and the vector, as well as the specific environmental conditions. A case-by-case analysis and expert judgment is required, probably through an expert committee. There is a general preference for 'eering' on the side of caution. Science is unlikely to be able to tell us what is and what is not polluting. It's probably more a case of 'find out and see'. There will almost certainly be some genetic pollution, with adverse effects to human health, though. Weighting 1 1 0.6 0.2 Unfamiliarity The diseases are variations on well known conditions (e.g. scrapie). The meat rendering processes are a modification of known processes. We should see BSE and hvCJD as only different in degree from those other established diseases. BSE and hvCJD are both qualitatively different diseases and infective agents from any previous known.
They are per se, highly unfamiliar and should be assessed and regulated as such.These are qualitatively different conditions from those previously experienced and should be assessed and regulated as such. However, at the beginning, it was not possible to be sure of the qualitative difference in character of the conditions. It is easy to be clear in hindsight! Risk is, by its nature, about unfamiliarity and uncertainty ... so to try and 'tame' risk is a fundamentally mistaken notion. But that doesn't mean that all risks are 'bad', just that you can't readily sort out the good and bad. Weighting 0.6 0.5 0.5 0.7 Dreadness A lot of exaggeration has been going on, e.g. concerning the thousands who might die from hvCJD. It's not very likely to happen. A 'moral panic' has emerged. This is a highly dreaded set of diseases and conditions—for good reasons. Things could be really bad according to the high projections of deaths—which estimates are just as valid as other lower estimates. A sense of proportion about the risks must be kept- whilst recognising the existence of some pretty scary possibilities which are only at present not realised. Is the number who might die from hvCJD in the tens to hundreds range or in the tens to hundreds of thousands range? Things could be really bad, but we don't really know. There may be a lot of scaremongering going on so until the deaths start mounting up perhaps the best course of action is to be stoic and 'wait and see' what unfolds. Weighting 0.4 1.25 0.5 1.7 Trustworthiness of Government Institutions In the end, risk is a subjective experience so it is always better to trust yourself. You can decide for yourself who you do and don't believe. Government regulators end up like the 'nanny state' and overly conservative, even if well meaning. Governments are generally captured by dominant economic interests—in this case the meat industry, agriculture, etc. Only with the utmost scrutiny and transparency can government agencies be made to be trustworthy. The record of BSE demonstrates a high level of capture, which had to be reigned in following the scale of the disaster which unfolded. A proper risk assessment and regulatory control system are absolutely essential to trustworthiness. This was initially absent but was created to a very high standard as the crisis developed. It's impossible to know who to trust in advance since the actual incidence of risk cannot be accurately determined in advance. However, the government did seem to be particularly lacking in the earlier stages of the BSE crisis—there is not really much reason for trusting governments any more now. Weighting 2.15 1 1.8 0.3 Vulnerability Vulnerability is ultimately a subjective experience—it should be left to the individual to decide on their own 'comfort level'. We all have the ability to use information to assess whether we wish to take a risk or not given our own subjective vulnerability. There are highly vulnerable groups when it comes to BSE. This is a result of the uneven distribution of information, education and engagement. Some groups cannot afford to change their eating behaviours or are unable to do so for socio-cultural reasons. One of the functions of government is to look after the vulnerable in society...There are reasons why differences in vulnerability occur and we should respond to these differences through education, information campaigns, selective marketing, etc. Vulnerability occurs but it can hit any one any time—almost like a random process. So, it's a bit like being hit by lightening—it's not very nice if it happens to you but there is not much you can do to prepare yourself for it. In that sense we're all vulnerable whether we feel it or not. Weighting 0.2 1 1.5 1.8 Fairness The focus is on the fairness of opportunity, not of outcome. Initially government information was so poor that only those scientifically educated might have questioned the advice—so it was not fair. We should focus upon the fairness of outcome, not of opportunity. As explained above, there were qualitative differences in vulnerability which resulted in reduction in fairness. Some unfairness is an inevitable consequence of difference in society. Initially poor information might have disadvantaged some groups in society more than other to begin with however. This disparity was subsequently corrected. Unfairness is just a feature of daily life—there is no point in treating unfairness about BSE any differently from other types of unfairness and no reason to imagine that regulatory changes will really make eventual outcomes any more fair. Weighting 2.15 1.25 1.5 1.8 - 3.10
- While precise numbers are used in these weightings, they are merely illustrative, based upon our own judgment, and are not founded upon empirical data. Other weightings would of course be chosen by others; the model outputs are a demonstration of the method, not as yet the output from a calibrated model. It is easy for the model-user to change the weightings, however, and empirical data could be collected on the appropriate weightings to use through a survey, focus groups or interviews. This is one necessary next-step in the model development process.
- 3.11
- The values of the parameters and weights in the model have been assigned as the result of the verification of the model or its 'internal validation' by performing a sensitivity analysis. Verifying a model entails testing that the dynamic processes it represents behave as expected. This verification process is often referred to as internal validation (or inner validity). Verification serves the purpose of generating a model of sufficient quality and completeness and of minimizing errors, oversights, bugs and mistakes in its implementation (Macal 2005). To verify or achieve inner validity in a model is harder than it might seem (Longley et al. 2009). One way of doing this is through sensitivity analysis. Sensitivity analysis is the study of how the variation in the output of the model can be apportioned, qualitatively or quantitatively, to different sources of variation in the input of the model. Or in other words, it is a technique for systematically changing the values of the parameters in a model to determine the effects of such changes (Saltelli et al. 2004). In this way, theoretical hypotheses about the model's output can be tested under a range of different input parameter settings. Usually the model is examined under several cases including extreme situations in which the outcomes are 'easily' predictable. If the theory is well formulated and conceptually coherent these hypotheses should yield expected results from the model, since they are based on the conceptual model design (Longley et al. 2009).
- 3.12
- The variables representing the dimensions of risk perceptions are again scaled variables which grow in value (from 0 to 100) as the number of accumulated BSE related events (as previously defined) increases over certain thresholds. These thresholds also take different values for each CTA to account for the fact that each dimension will contribute to an increase of the perceptions of risk only when the accumulated number of BSE events reaches a certain (significant) magnitude—which will be different for each CTA. For example, the threshold corresponding to the vulnerability variable in the Individualist CTA is set at a much higher level than for the other CTAs. The Individualsist perception of vulnerability will only increase to any great extent when a very significant number of BSE related events take place over a sustained period of time.
The Theory of Surprise Sub-Model: The Dynamics of Shifts between different CTAs
- 3.13
- In order to take into account the dynamic aspects of Cultural Theory (CT) the model incorporates both population growth and changes in the population structure/composition, i.e. the possibility that individuals move between different CTAs as a result of a change in their world views (Thompson et al. 1990; Janssen 1998). The Theory of Surprise within CT provides an explanation of the way in which the change in the composition of the population takes place. In CT surprise occurs in a CTA when the expectations of its adherents are thwarted. The greater expectations are thwarted and the longer the period of time over which this happens, then the greater the level of surprise. Surprise for a particular agent can be broadly defined as the difference between what he/she expects and what actually occurs. The occurrence of overwhelming evidence which an individual perceives as contradicting the particular view he/she holds of a certain issue, would come as a surprise and challenge her/his initial opinion. That individual would, as a consequence, decide that their view is in fact wrong, and therefore change it. If the magnitude of the surprise is large and sustained enough in a CTA, there will be an exodus of followers of this CTA towards a different one which appears better able to explain 'the facts'. In addition, CT posits that if evidence is perceived as being 'worse' than anticipated/expected, then there should be a shift from more risk-taking to more risk-averse CTAs—from Individualist to Egalitarian for instance.
- 3.14
- We have operationalised the Theory of Surprise into COWCULT as follows (see figs. 4 and 5). For each CTA we have distinguished between perceived anticipated risk -defined by the variable risk perception expected, and 'actual' perceived risk—the risk perceptions output calculated by the model.[6] Expected perceptions of risks have been defined as the trajectory of actual BSE/nvCJD events (BSE events convertor) delayed by a time period starting in July 1988 and modified accordingly to each CTA. Differences between expected and perceived risks are computed by the variable Gap convertor which represents the magnitude of the 'surprise' for each CTA. Changes from one CTA to another will occur—in the fashion explained above—only when the value of accumulated differences (gaps) over time is high enough—over a certain threshold—and over a period of time long enough to challenge current views or perceptions. The thresholds over which dynamic movements among different CTAs are produced are defined in the model through the Gap threshold variables, whose values will again depend on the specific characteristics of each CTA.
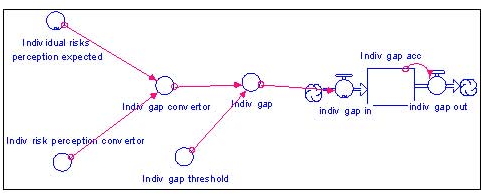
Figure 4. The Theory of Surprise Sub-Model for the Individualist CTA - 3.15
- The computation of the variables and dynamic relationships described above yield the time trajectories of the perceptions of risk associated to BSE for each CTA incorporating both population growth and changes in the composition of the population ('CTA risk perceptions' in Figure 1).
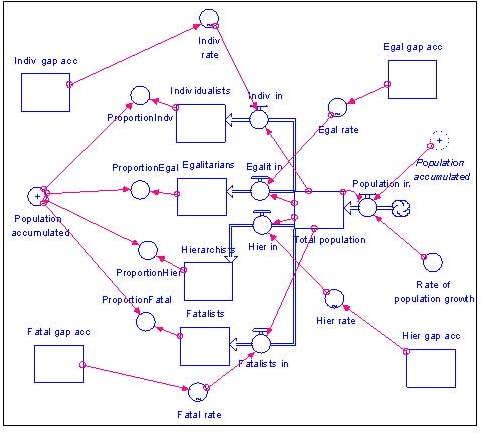
Figure 5. Dynamic Cultural Theory Archetypes The Risk Amplification Sub-Model
- 3.16
- The Risk Amplification Sub-Model operationalises social amplification effects on the perception of risks previously calculated by the sub-models outlined above. The social amplification of risk is a well known and described phenomenon in the literature—see for instance (Pidgeon et al. 2003; Kasperson 1996; Kasperson and Kasperson 1996; Breakwell and Barnett 2001). Our model considers two types of risk amplification: through the effect of the media, and through the influence of other types of social interaction/communication.
- 3.17
- To operationalise the effect of the media we employed records of news articles mentioning BSE in the 815 week period between 1st July 1988 and March 31st 2004. We have developed our own data record using the electronic data base Infotrac. From the start of 1996 to March 2004, we considered articles with mentions of BSE and nvCJD on a weekly basis from the following newspapers: Daily Telegraph, Guardian, Times, Financial Times, Independent, Observer, Sunday Times and Sunday Telegraph, i.e. all the quality broadsheet newspapers in the UK. For the 1988-1995 period we have used the time series provided by Miller's (1999) study. All relevant articles have been classified into three categories—based upon the headline and first few sentences of each article: 'Likely to heighten risk perceptions', 'Likely to dampen risk perceptions', and 'Effect Unknown'. These have been computed in the model through the variables media reports amplifying and media reports dampening (see Figure 6). The 1996-2004 record shows an approximately 80/20% split between the 'heightening' and 'dampening' effects, and the 'unknowns' have been allocated to the 'heightening' or 'dampening' category on a 70/30 % basis. The 80/20% split has also been applied to the 1988-1995 media record. The accumulated number of news articles over time is computed in the model for each CTA by the variables Media reports effect (see Figure 6). For quantifying the amplifying net effect that the accumulation of media events has on the perceptions of risks we have considered that their influence remains in the memory of individuals during a certain period of time which will differ for each CTA. We have assumed that the Individualists and Fatalists remember media coverage for two weeks only (i.e. they have a shorter term memory of events), whilst Hierarchists and Egalitarians remember media coverage for four and eight weeks respectively. The magnitude of the net effect of the media on perceptions (the value of the Media amplifier indicator, in Figure 6) is also different for each CTA. For the Individualist CTA, high media coverage (i.e. a considerable accumulation of news articles over time) reinforces perceptions of risk only moderately since Individualists, although open to the direction of popular opinion, tend to be suspicious of information from the media and prefer to rely upon their own evidence and experience. Hierarchists have the highest overall level of amplification: hierarchical institutions take seriously how they are presented in public (as witnessed by government attempts to 'spin' the media, etc.) hence their perceptions of risks will be highly influenced by media coverage. The magnitude of the amplification is quite responsive to reductions in media coverage but levels-off at higher levels due to a saturation effect. Egalitarians will tend to be somewhat more wary of the media than Hierarchists, whilst for the Fatalists risk perceptions are not reinforced in a continuous and/or coherent way since they generally have an ambiguous response to increases in media coverage.
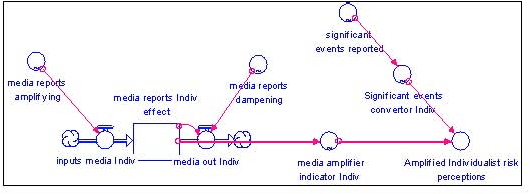
Figure 6. The Amplification of Risk Sub-model for the Individualist CTA - 3.18
- As we have indicated, the social amplification of perceived risk can take place not only via the media but through other forms of social communication and interaction such as the official public communication of new scientific discoveries, and/or the communication of facts in the social networks within which individuals interact. There is no single empirical data base on this type of social effect available to us in the way that there is for the media record. Thus, in order to quantify this effect, we have used significant announcements and happenings in the BSE/nvCJD story on a year by year basis as a proxy variable (Significant events reported variable in Figure 6). In particular, we have consulted publications and reviews of BSE/nvCJD in each year, and assigned them a level of significance depending on the extent to which we consider that these events have led to a degree of risk amplification (Penningon 2000).
- 3.19
- The computation of the variables and dynamic relationships described above yield the time trajectories of the perceptions of risk associated with BSE for each CTA incorporating the amplifying effects derived from media coverage and the communication of significant related events ('Amplified CTA risk perceptions' in Figure 1).
The Reliance-Trust Sub-Model: The Information Deficit and Technical Alienation Hypotheses
- 3.20
- The Reliance-Trust Sub-Model operationalises the influence that the level of trust/distrust that different CTAs have regarding government evaluations of risk—including the use of the scientific and technological foundations of these assessments- has in the formation of risk perceptions. The motivation behind this sub-model arises from a debate in the sociology of science for policy literature that has been on-going for 15 years or so (Irwin and Michael 2003; Adams and Thompson 2002). The starting point for the debate is the so-called 'Information Deficit' model of public (mis)understanding of science. This model maintains that peoples 'over-reaction' or distrust of public presentations of science and technical risks is a consequence of a lack of proper information. Hence, it is assumed that providing authoritative information to 'fill in the gaps' or to correct falsehoods will diminish risk perceptions. The information deficit model is itself premised upon a misunderstanding of public understanding and, to some extent, of the character of scientific knowledge itself (Irwin and Wynne 1996). As Wynne (1996) points out, people might well have very legitimate reasons for distrusting public presentations of science and risks, and that this is fundamentally not to do with lack of information or factual inaccuracies upon their part.
- 3.21
- In this line of thought, Wynne has proposed an alternative to the information deficit model regarding the influence of more scientific information upon the public's perceptions which is diametrically the opposite in its assumptions (Wynne 1987; Otway and Wynne 1989). According to this alternative approach, which we have termed the 'Technical alienation' hypothesis, governments faced with a skeptical 'misinformed', distrusting public will proceed to try and convince the latter through provision of ever more scientific and technical information, believing that the public will eventually be 'won-over' by the sheer weight of irrefutable scientific argumentation placed before them. Yet, the more that scientific and technical information is provided, the greater is the tendency of the public to become 'alienated' from such technical discourses, and to distrust formal risk assessments even more. In other words, rather than alleviating and reducing concerns about risks, in Wynne's view, provision of more technical information actually increases distrust in the process of risk assessment, and hence reinforces people perceptions of risk.
- 3.22
- The 'information deficit' hypothesis reflects the way that Hierarchists typically think about risk and uncertainty while the 'technical alienation' hypothesis, on the other hand, reflects the way that Egalitarians typically think about risk and uncertainty. However, COWCULT includes the two types of effects in every CTA since in our view both hypotheses may have a degree of validity during certain periods of time and situations. In particular, we have assumed that the information deficit hypothesis will operate in a CTA in those situations in which the level of trust in government and science is relatively high, while the technical alienation hypothesis will operate in those periods characterised by a low level of trust, or when there is a high level of distrust in the government and scientific institutions on the part of a CTA.
- 3.23
- The 'information deficit' hypothesis is operationalised in the model as a negative feedback in the dynamics of the perceptions of risk (see Figure 7). We start with the assumption that perceptions of risk have an influence on the level of trust/distrust that each CTA has in government pronouncements, systems and institutions and that the higher the perceptions of risks, the higher the level of distrust will be. This seems to us a reasonable assumption since in general the government tends to be blamed for the occurrence of risks, and, after all, it is assumed that government should take responsibility for controlling and managing risks to the public. An increase in the level of public risk perceptions at a given time will trigger actions on the part of the government which in general will be driven by its reliance on available scientific and technological (S&T) information. [7] These actions are aimed at increasing the amount of S&T information given to the public in the next time period in an attempt to reduce their perceptions of risk. Under the operation of the information deficit hypothesis this increase in S&T information subsequently will cause a reduction in people's initial distrust, and thus a dampening in the initially increased perceptions of risk. This effect is computed in the model through the variable trust damp effect (see Figure 7). The 'technical alienation' hypothesis is operationalized in the model as a positive feedback in the dynamics of the perception of risk. In this case, government actions aimed at increasing public S&T information as a response to increases in the level of risk perceptions have an opposite effect causing an increase in people's initial distrust, and giving rise to a reinforcement or amplification in the perceptions of risk. This effect is computed in the model through the variable trust amplif effect (see Figure 7).
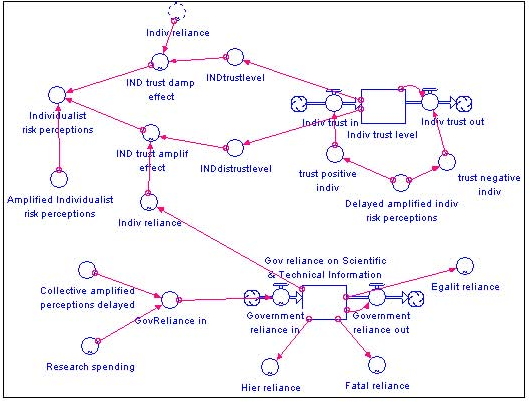
Figure 7. The Trust-Reliance Sub-model for the Individualist CTA - 3.24
- The computation of the variables and dynamic relationships described above yield the time trajectories of the perceptions of risk associated with BSE for each CTA, or more specifically for each representative individual (or agent) belonging to a particular CTA. Each of these trajectories—'Final CTA risk perceptions' in Figure 1—incorporates the amplifying/dampening effects caused by the media/reported events, as well as the amplifying/dampening effects due to the different levels of distrust/trust that the public has in government pronouncements, systems and institutions. The contribution of each CTA as a whole (i.e. that of all the individuals in it) to the constructed collective perceptions of risk is calculated by multiplying the level of risk perceptions of each representative individual by the proportion of individuals in the population that belong to that CTA.[8] The perceptions of risk for the whole UK population—Collective final risk perceptions- are calculated as the sum of the four CTAs contributions to risk. These constitute the final aggregated output of the model.
Simulation results and discussion
- 4.1
- The simulated dynamic trajectories of risk perceptions constitute predictions on the basis of theories of risk perceptions. These theories, as formalized by the model, will need empirical validation once the appropriate data on perceptions of risk are available. Empirical validation (or calibration) normally requires the gathering of data on the dynamic processes that the simulation model aims to represent: does the simulation match relevant real-world data?
- 4.2
- In general, the level of anticipated correspondence between model outputs and empirical data depends to a great extent on the purpose of the model—and hence on the model specification and structure as dictated by the theories and hypotheses employed in its construction. Generally, in the modeling of complex social processes, such as the formation of risk perceptions, the richness of the theoretical approaches required to adequately formalize dynamic processes makes a simple approach to empirical validation extremely difficult. As already noted, establishing the internal validity of a model (its logic and consistency) is of paramount importance. Before calibrating a model, it is first necessary to check its inner validity or to verify it. During the verification step, that the model produces outputs which behave as postulated by the theory is checked. The simulation results of the COWCULT model allows us to explore the dynamics of the perceptions of risks of BSE in the UK based upon the hypothesized cultural archetypes deduced from Cultural Theory. The simulations have been run for a period of approximately 16 years (1988-2004). We have employed the following data inputs for the simulations runs: number of BSE incidents, number of deaths from nvCJD, amount of public money spent on R&D, number of media articles on a weekly basis, and significant events reported on a yearly basis. Their time series are shown in Figures 8 and 9. As time trajectory 2 (black line) in Figure 8 shows, the number of BSE events increased rapidly from 1988 to 1993 to decay gradually in the following years of the simulation period. The number of nvCJD deaths (white line in Figure 8) [9] increased around late 1995, and as in the case of BSE events, tailed off afterwards continuing in this fashion until 2004. The number of media reports is represented in Figure 9 with the time trajectory 1 in white corresponding to the number of reports including the media dampening effect calculated as previously explained; and time trajectory 2 in pink corresponding to the number of reports including the media amplifying effect.[10]
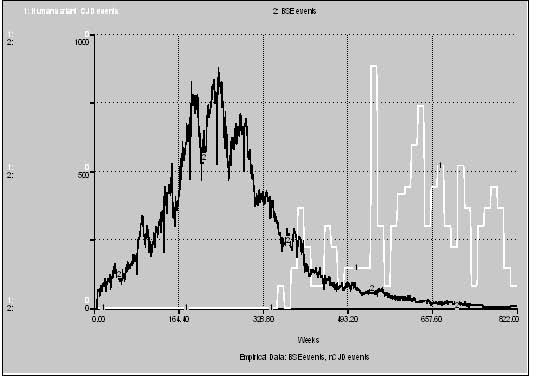
Figure 8. Empirical data on nCJD events and BSE events - 4.3
- The dynamics of these two variables show four distinctive peaks: in spring 1990 (the first BSE scare), in late 1995, in March 1996, and at the time that the Phillips enquiry reported in November 2000. The variability of the media record post 1996 is due to the availability of more detailed media records from that time onwards. The value of reported significant media events (series 1 in black color in Figure 9) reaches a peak in 1996 and then drops quite rapidly post 1997 due to the election of a new Labour Government, which, having been out power for 18 years, was regarded as not to blame for the BSE debacle. It is interesting to note that the increase in the number of amplifying media reports, and of significant events, occur predominately after the rapid growth in BSE cases. Except for the 1990 BSE scare in the media, it was not until the number of BSE events had started tumbling downwards that media interest resumed. The continued media coverage post March 1996, albeit at a lower level, suggests that human deaths from nvCJD constituted a highly important influence.
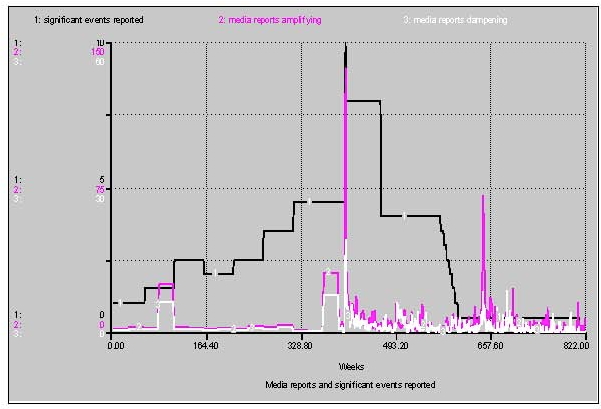
Figure 9. Media reports and significant events reported Figure 9 Media reports and significant events reported
- 4.4
- Simulations of the model show the following results on the dynamics of risk perceptions of BSE, and their associated amplification effects. The trajectories of risk perceptions for each of the CTAs considered in our study are portrayed in Figures 10-13. Figure 10 shows the simulation results for the Individualist CTA. Trajectory 1 in orange in this figure corresponds to the perceptions of risks associated exclusively with the occurrence of BSE events (i.e. without considering any amplifying or dampening effects from the media and communication of events, and/or trust reliance issues). As can be seen in the figure, initial risk perceptions for the individualist remain at a low level (with a maximum value of 22 on our scale of 0 to 100) and show little variation during the whole simulation period. Trajectory 2 in white illustrates the effect of adding risk amplification from media coverage and the occurrence of official announcements and significant events. This effect leads to a general increase in the perceptions of risk; however they still remain at a relatively low level (with maximum levels taking values now around 50). There are three noticeable peaks in the amplified trajectories in which perceptions are respectively three, four and seven times higher than their initial 'non-amplified' values.
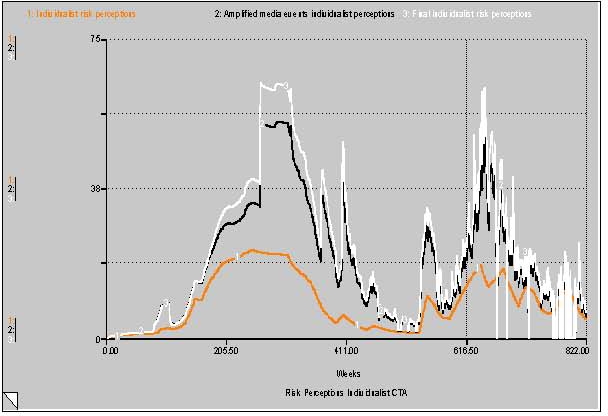
Figure 10. Perceptions of Risk for the Individualist CTA - 4.5
- These peaks are: (i) March 1996 due to the government announcement of a possible BSE—nvCJD link. The high value of risk perceptions during this time period is driven mostly by the influence of the media and the reporting/communication of significant events effect; (ii) late 1998 due to an increase in reported nvCJD cases though the level of media coverage does not change significantly (compare with Figure 8); and (iii) late 2000 with the release of the Phillips Enquiry. Lord Phillips' enquiry led to extensive media coverage mostly critical of the government's handling of the BSE affair. There were also at this time more nvCJD cases, which account for at least some of the magnitude of the amplification, and show the relatively higher importance that the individualist CTA gives to the occurrence of nvCJD cases in relation to other influences. The white trajectory labeled 3 in Figure 10 shows the final trajectory of risk perceptions for the Individualist CTA, i.e. the resultant perceptions after including the amplifying effect of distrust/trust in government and associated reliance on science. As the figure illustrates, the trust-reliance effect only gives rise to risk perceptions amplifications (there is no dampening effects in this CTA) which do not reach a significant magnitude throughout the simulation period—there is only one noticeable peak in its trajectory at late 2000 after the release of the Phillips Enquiry. This shows the modest influence that the trustworthiness of government institutions and science has upon the risk perceptions formation of the Individualist CTA. For the individualist, risk is after all a subjective experience thus it is always better to trust oneself and decide what constitutes a risk and what does not. The low values of perceptions shown at the last stages of the simulation period are most likely due to the lack of related news or government action during those years in which media (and most likely people) lost interest in the issue, and at which time the crisis was perceived as 'under control' despite the fact that BSE and nvCJD cases were still occurring.
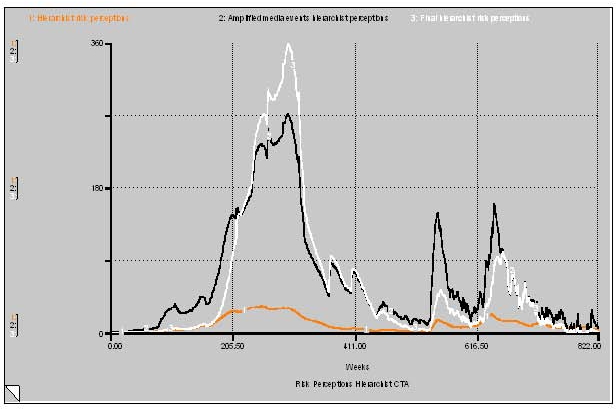
Figure 11. Perceptions of Risk for the Hierarchist CTA - 4.6
- The Hierarchist CTA shows higher general levels of risk perceptions than the Individualist reaching maximum values around 34 (see trajectory 1 in orange in Figure 11). The magnitude of the amplifying media effect is also greater in this CTA (black trajectory 2 in the same figure), and starts to influence perceptions in a significant way at a much earlier stage than for the Individualist. As the figure shows there are three peaks in the media effect amplified trajectories—during these periods, perceptions of risks are ten, and even sixteen, times higher than their initial non-amplified levels: (i) late 1992 to mid 1994 -a consequence of the social communication of significant events and (to a lesser extent) the media; (ii) the nvCJD cases increase peak (end of 1998 / early 1999); and (iii) the Phillips report peak in late 2000. The 1992 to 1994 amplification seems to be particularly pronounced for the Hierarchists because of the relatively higher importance that this CTA gives to the announcements of the occurrence of significant events in comparison with the other CTAs. The white line 3 in Figure 11 shows the final trajectory with the trust-reliance effect on amplified risk perceptions for the hierarchists. The dynamics of the trust-reliance amplification effect is particularly interesting for the Hierarchist CTA. Indeed, it is in this CTA in which the dynamic interaction of the positive and negative feedbacks—as explained in the previous sections—and its influence in the formation of risk perceptions, is more clearly appreciated. As can be seen in Figure 11, during the first stages of the simulation (years 1988- 1991), the dynamics are characterized by a decreasing perception of risk- final risk perceptions are below the previously amplified risk perceptions. This significant reduction is the result of the dampening effect derived from the operation of the deficit information hypothesis (negative feedback), the magnitude of which is in this case greater than that of the technical alienation hypothesis (positive feedback). During this period, the Hierarchists trust government reliance on science to deal with the situation despite the current state of affairs, i.e. high number of BSE and nvCJD cases and the media coverage. After this initial period, the dampening effect gets gradually reduced (with the consequent increase in the level of risk perceptions) as a result of an increase in the magnitude of the positive feedback which now is higher than the negative one, until around middle 1992 when the dampening effect disappears and is replaced by an amplifying effect which lasts until 1996. From middle 1992 to middle 1993 the magnitude of this amplifying effect is fairly small: its value is reduced since the level of trust in government responses is still high enough for the information deficit (negative feedback) to operate. As trust is reduced, and the number of BSE cases grows, the amplification gradually increases reaching high values (maximum) during the end of 1993 and 1994. It is in this period where the effect of the technical alienation hypothesis (reinforcing positive feedback) is at its strongest. From 1995 the amplification decreases (Hierarchists trust regrows as a result of government responses, and the information deficit hypothesis kicks-in once again) to give place to a modest dampening effect which will be maintained until the end of the simulation period, with the exception of two peaks in 1997/8 and 2001 in which the reduction in the level of risk perceptions is higher due to the election of a new Labour Government, and the release of the Phillips report. In summary, the significant dampening in the perceptions of risks of the Hierarchist CTA along with the reduction in initial amplifications during the aforementioned periods, are due to the relatively higher level of trust that the Hierarchist CTA has in the responses of science and government institutions. Indeed, according to the Hierarchist CTA, a proper risk assessment and regulatory control system are essential to trustworthiness, and although this was initially absent (during the first phases of the simulation), it was created by the institutional system to a high standard as the crisis developed.
- 4.7
- The risk perceptions for the Egalitarian CTA are shown in Figure 12. As the figure illustrates, without any amplification effects, the perceptions of risk of the egalitarians (line 1 in orange in the figure) are significantly stronger than those for the Individualist and Hierarchist CTAs, reaching much higher levels throughout the whole simulation period—a maximum value of 99 in our scale of 0-100. The magnitude of the amplifying media effect is quite significant in this CTA (black trajectory 2 in the same figure), being greater than the Individualist but lower than that of the Hierarchist CTA. (The perceptions of risks are five to ten times higher than their initial non-amplified levels). The emergence of a 'split' peak prior to the 1996 announcement reflects intensive media speculation on the BSE-CJD connection in late summer/autumn 1995. The split is also present for the Individualists, Hierarchists and Fatalists but is much more pronounced for the Egalitarians than for the other CTAs because of the strong amplifying influence of adverse media reports in the Egalitarian CTA. There is, furthermore, a slowing down of the influence of media reports upon the Egalitarians' risk perceptions at high levels, which explains why the split peaks are approximately equal in size. The relative size of the peaks for the Egalitarians is broadly similar to those for the Hierarchists, i.e. with the largest peak occurring during the build-up of BSE cases in 1992-4, followed by the 1996 announcement and then by the release of the Phillips report.
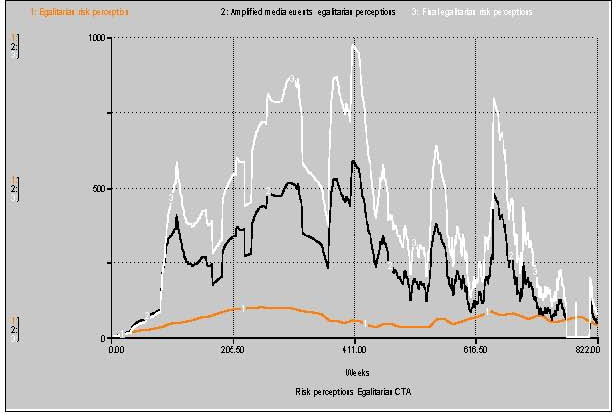
Figure 12. Perceptions of Risk for the Egalitarian CTA - 4.8
- The influence of the trust-reliance effect is highly significant for the Egalitarian CTA (white trajectory 3 in Figure 12) causing only amplification of risk perceptions during the whole simulation period. Again the magnitude of this amplification will vary depending on the values of the positive and negative feedbacks of trust and reliance on the perceptions of risk. As can be seen in the figure, the influence of the positive feedback in the dynamics of perceptions—the effect of the technical alienation hypothesis—is particularly strong, i.e. risk perceptions are significantly reinforced as a result of the growing distrust in government actions and responses characteristic of the Egalitarian CTA. Although the amplification arising from the trust-reliance effect occurs across the whole simulation period, its magnitude reaches fairly high values during the following four periods: the general build-up of BSE cases between 1992 and 1994; the March 1996 announcement; the increase in nvCJD cases in late 1998; and the release of the Phillips Report.
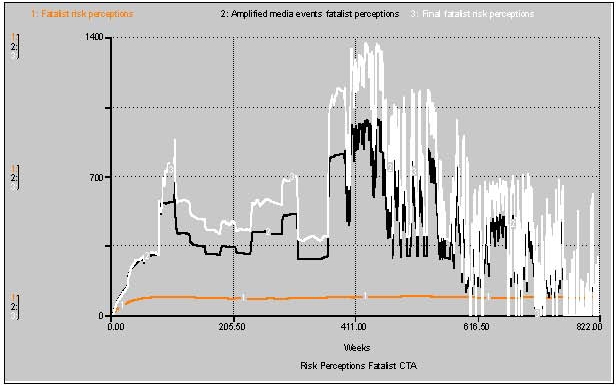
Figure 13. Perceptions of Risk for the Fatalist CTA - 4.9
- The perceptions of risk of the Fatalist CTA are illustrated in Figure 13. The level of risk perceptions for this CTA without any amplification effects (orange trajectory 1 in the figure) are significantly higher than those for the Individualist and Hierarchist CTAs keeping a fairly constant high magnitude over the simulation period (around 80) and reaching a maximum value of 94 in our scale of 0-100. The characteristics of the Fatalist CTA give rise to more random responses to events, and thus to a high variability in the magnitude of both the media and trust amplifying effects (see trajectories 2 and 3 in Figure 13). The Fatalist response shows a much less obvious pattern in comparison with the other three CTAs, although some of the peaks previously identified are discernible (e.g. autumn 1995, March 1996), and the level of risk perception also decreases towards the end of the simulation. In particular, compared to the other CTAs, the Fatalist CTA is relatively insensitive to the reduction in BSE cases and to changes in media coverage. The highly significant influence of the trust-reliance amplifying effect, on the other hand, is due to its general lack of trust in science and government actions.
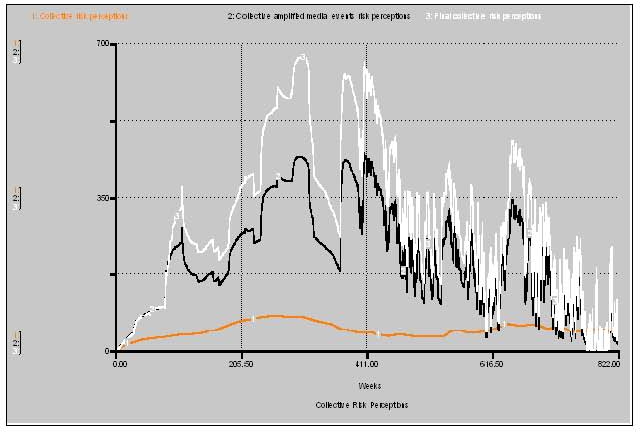
Figure 14. Collective Perceptions of Risk - 4.10
- As we have indicated in the previous section, we have assumed that the four CTAs represent the full range of, and balance between, the perceptions of risk for all the UK population, and so we have defined the collective perceptions of risk as the sum of the CTAs risk perceptions weighted by the proportion of individuals within the population belonging to each CTA. The trajectories of the collective perceptions of risk are shown in Figure 14. Changes in the composition of the population due to the movements of people between CTAs over time is illustrated in Figure 15 which shows the dynamics of the CTAs population proportions over the whole simulation period. As Figure 14 shows, collective perceptions of risk follow most closely those of the Egalitarian and Fatalist CTAs. In Figure 15, it can be observed that during the first stages of the simulation the proportion of Egalitarians and Fatalists increase rapidly: the accumulation of 'surprises', i.e. expectations not being fulfilled by the corresponding perceptions of risk, shifts adherents away from the Hierarchists and Individualists CTAs, whose proportions therefore decline (especially the Individualists). As the Individualists and Hierarchists adjust their expectations, their proportions begin to recover. Meanwhile, the proportions of the Egalitarians and Fatalists begin to decrease as the level of surprise experienced by adherents to Individualist and Hierarchist CTAs falls. With the onset of more nvCJD cases in 1997 onwards, the proportion of Individualists once again falls since this level was not expected by the Individualist CTA, though it was more or less as anticipated by the Hierarchists. There is a corresponding small increase once again in the proportions of Egalitarians and Fatalists, until the Individualists once again readjust their expectations and their proportion begins to recover.
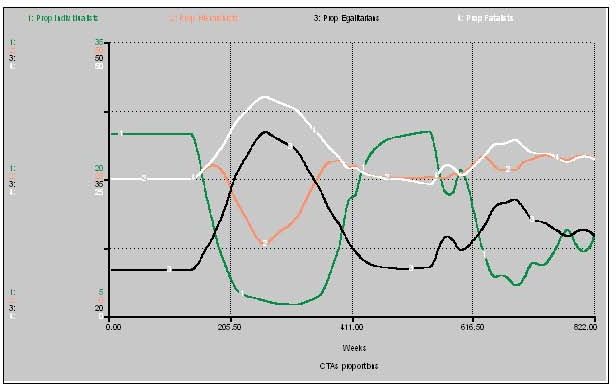
Figure 15. Time trajectories of CTAs proportions
Simulation results versus Empirical Data
- 5.1
- The COWCULT model has been partially verified, and a number of sensitivity analyses have been carried out in order to test its conceptual internal validity as well as the consistency and logic in the specification of all its relevant variables and relationships.[11] As we have already emphasized, while we have performed the internal validation of the model to check its theoretical robustness—a necessary and key step in any rigorous modeling exercise- we have encountered several obstacles for its empirical validation. First, we found surprisingly little empirical data on public perceptions of BSE, especially good long-term records. In their review of public perceptions on BSE in the UK, Breakwell and Barnett (2001) employ a survey from the Meat and Livestock Commission—see also FSA (2003)—providing data but only for the years 1990-1998. We have not found any survey data in which Cultural Theory has been employed to categorize data on risk perceptions. The gathering of adequate data which allow us to test the empirical validity of the model predictions in a systematic and robust way will constitute the next step and the subject of future work.
- 5.2
- A comparison of our results with Breakwell and Barnett's (2001) data shows some correspondence between empirical records and our simulated data on perceptions of risk (see Figure 16). In particular, both series account for a decline in risk perceptions between summer 1990 and summer 1991, a decrease in autumn 1994 to autumn 1995, an increase in perceptions of risk in spring 1996, and the subsequent decline after that year. The role of the government's announcement of March 1996 is clearly witnessed in all the three surveys carried out by Breakwell and Barnett (2001). There are also periods where there is little data correspondence. For instance, Breakwell and Barnett's survey results do not show the (largely BSE events driven) increase in risk perceptions between 1992 and 1994. According to our simulation there is also a decrease in perceptions in about late 1996-1997, driven by a lack of BSE events, whereas the survey shows only a slight decrease after that in 1998. [12]
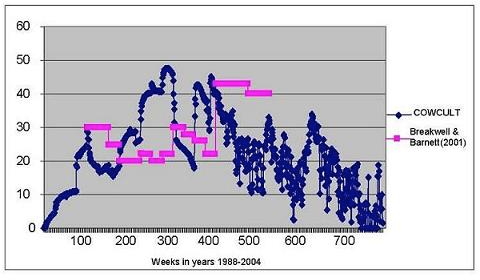
Figure 16. Collective perceptions of risk: COWCULT (2008) and Breakwell and Barnett (2001) - 5.3
- We are aware, as widely recognized in the literature, that 'perceptions' are not always consistently translated into 'behaviors', and that there is indeed considerable debate about the precise relationship between perception and behavior (Conner et al. 2003; Sparks and Shepherd 2002). Despite this, in order to establish additional data comparisons which contribute to testing (to some extent) the existence of a degree of empirical validity of our model, we have examined data on the (de-trended) reduction in the consumption of beef in the UK provided by Atkinson (1999). We have assumed the existence of a potential correspondence between periods of relatively high risk perceptions and low levels of beef consumption. Figure 17 shows our simulation results on collective risk perceptions along with data on beef consumption for the time period considered by Atkinson, i.e. 1988-1998. As the figure illustrates there is evidence of some data correspondence between high risk perceptions and low beef consumption—though in the 1992 to 1993 period consumption seems to remain fairly stable. There is a large reduction in beef consumption following the March 1996 announcement. This level of beef abstinence does not last for long, however, and beef consumption picks up again during 1996. This fact is supported by the reduction in risk perceptions shown in COWCULT as long as it is related to behavioral change and a resumption in beef consumption.
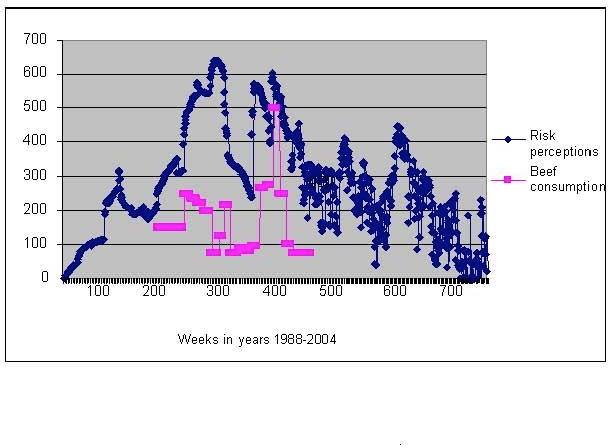
Figure 17. Collective perceptions of risk and beef consumption (Atkinson 1999) - 5.4
- We have also employed the inverse of the price of beef ('real beef producer prices') as a proxy indicator of the demand for beef (see Figure 18). Since increases in the demand for beef involve increase in prices, we have assumed a correspondence between low beef prices and high levels of perceptions of risk. Figure 18 shows areas of high correspondence between the two variables, e.g. from 1988- 1991, 1992-1993 and 1996-1997. Less satisfactory is the correspondence during parts of 1991-1992, parts of 1994 and 1997. The time series finishes in 1999, at which stage it is just beginning to show a recovery in beef prices. One might expect beef prices to respond rather sluggishly to changes in perceptions, and this might explain some of the difference between the COWCULT simulation and the beef price indicator. In conclusion, we have conducted a very partial testing of the COWCULT model against available empirical data sets and, while the results are reasonably satisfactory, more original empirical data collection is necessary.
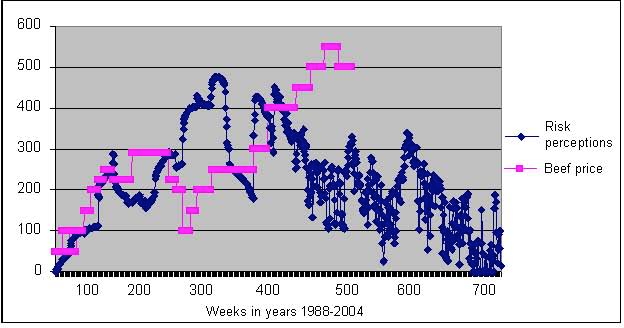
Figure 18. Collective perceptions of risk and beef prices (Atkinson 1999)
Conclusions
- 6.1
- In this paper we have presented a computer based simulation model of the dynamics of the perceptions of risk surrounding Bovine Spongiform Encephalopathy (BSE) and new variant Creutzfeld Jacob Disease (nvCJD) in the UK. From a theoretical viewpoint, simulations have been used to analyze the formation of risk perceptions, and the combined influence that the media and the trust that people have in government institutions has in triggering processes of risk amplification. The model has been built drawing on the main concepts and hypotheses of Cultural Theory, employing the categories it identifies (Hierarchy, Egalitarianism, Individualism and Fatalism) as distinctive forms of cultural bias in the formation of perceptions. As we have repeatedly argued throughout the study, the relationships and the variables used for the model specification are hypothetical and mainly theory based, since our main aim at this point of the research is the use of our model as a theory development and testing tool. COWCULT has required that we interpret the perceptions of relevant variables through the interpretative lenses of each Cultural Theory Archetype for their quantification and operationalization. On the other hand, the model equips users with a very general template that allows them to run simulations employing alternative values of the relevant parameters so as to explore the dynamics of risk perceptions for different 'cultural scenarios'. Alternative interpretations of different CTAs responses are possible: since the model is sufficiently transparent and easy to apply, any user with different interpretations of the responses of the defined CTAs could readily modify values and relationships to adapt them to their own interpretations. Since the software employed in building the model and running the simulations is very user friendly, values of the relevant variables and parameters can easily be modified. It is possible, for instance, to run simulations with different degrees of stationarity in the institutional environment, and to test if changes in government's behavior have the effect on the dynamics of risk that is as postulated by the relevant theories. From a theoretical point of view, the model provides a quantification and operationalisation of relevant hypotheses and theories in the context of the construction of risks (psychometric analyses, dynamic cultural theory, surprise theory, information deficit hypothesis, and technical alienation hypothesis) allowing both academics and policy makers to explore the implications of such theories and concepts in a very user friendly manner. For instance, it is possible to modify the magnitude of the different feedbacks (information deficit and technical alienation hypotheses) incorporated in the model and the way they interact in order to investigate the dynamics of risk perceptions for different government response scenarios. The model in general provides users with a template to explore the influence of the different variables and relationships driving the formation of risk perceptions, allowing an analysis of the way in which different hypothesis on media and social communication, and public trust and reliance affects their dampening or amplification. This versatility makes COWCULT a valuable tool to perform 'what if' analyses and thought experiments contributing to achieving a better understanding of the main factors driving public perceptions of risk, and the cause-effect relationships among the different parameters and variables involved. These, given the intrinsic complexity that characterises people's perceptions of risk, are not so easily detected and unravelled empirically. In this respect, the work provides a conceptualisation and quantitative operationalisation of the construction of risk perception; a solid theoretical framework based on well-established theories and a user-friendly analytical tool that can be employed to run simulations for academic and policy purposes.
- 6.2
- It has to be emphasised, however, that the work presented in this paper constitutes the initial steps along a long research trajectory. As the model is still in need of empirical validation, at this stage it should be considered an analytical device or generic template to carry out exploratory analyses and not as a predictive tool. Suitable data sets (not presently available) would be required in order to provide an improved confirmation of the model's behaviour, and to empirically validate the relationships and properties of the variables used for its specification. Whether it is feasible to collect all the data that would be necessary to specify the full set of relationships that are required is questionable. The lack of survey or interview data on perceptions of BSE risks using the categorisation of Cultural Theory constitutes a significant obstacle in the model validation. Even if data using CT categories could be collected now it would not be possible to do so retrospectively for the time period considered in our simulations, namely 1988 to 2004. We might, however, be able to create 'virtual laboratories' of respondents using the CT categories, e.g. assembling focus groups consisting of CTA representatives that would be able to provide judgments on the pattern of the key relationships. Such in depth group work might be supplemented by survey work. In the longer-term COWCULT could be expanded to look at other risk-issues which were concurrent at the same time as BSE. This would allow an analysis of the so-called 'risk thermostat' concept of Adams (1995) and help develop a more generic risk model framework that might be used by stakeholders to explore the possible occurrence of future risk perceptions arising from new technologies, accidents, threats and media scares.
Notes
-
1Calibration implies setting the structure of the model and its parameter values in such a way that its results are sufficiently close to empirical observations, with this sufficiency criterion depending on the purpose of the model. Calibration thus normally requires empirical data on the processes that the model is representing. These data can be acquired through surveys, statistical analysis of empirical data, experiments, questionnaires, etc. (Longley et al. 2009; Sargent 2003).
2This generally accepted definition implies that risk perceptions cannot be 'wrong', though they can be inaccurately measured. They may seem to be illogical or irrational but only from someone else's subjective viewpoint.
3An agent based model could have also been used. However, our analysis deliberately avoids reducing agency to individuals. Indeed, the CT tradition is critical of methodological individualism—the idea that the 'aggregation' of decisions by individuals can explain broad society-wide developments. We therefore construct our model based on what we called 'cultural archetypes' rather than to focus on the individual and build a micro-simulation upwards, and, following the sociological tradition of Émile Durkheim and Mary Douglas, set a group of agents belonging to the same cultural archetype as the unit of analysis.
4Throughout the paper, the terms agent or individuals—interpreting events in constructing their perceptions of risk—refer to an archetypal representative of each cultural bias, not a specific or 'real' individual.
5In simulation models of the behaviour of social agents or groups of agents, scaling is a common way of representing variables that are non-observable and therefore not easily measurable. Quantifying perceptions through scaled variables is also generally convenient to elaborate surveys for model validation purposes.
6It has to be noted that here we are comparing perceptions of risks associated with the occurrence of events (expected and actual as calculated by the model) which are culturally-shaped, since, according to CT and social constructionism in general, evidence is always interpreted differently by each CTA.
7For the sake of simplicity we have assumed that government reliance on S&T information increases as public research spending grows.
8As previously indicated, the model accounts for movements of individuals between CTAs so these proportions vary accordingly over time.
9Since the number of nvCDJ events is significantly lower than that of BSE cases, the values of the corresponding variable in the y axis of Figure 8 are represented in a different scale so that both series can be visually compared. For this reason in this scale from 0-1000 cases (which allows the representation of the highest number of cases for the BSE events variable) the values in the axis for nvCDJ events appear as close to 0.
10Again different scales have been used to represent the values of these three variables in order to allow the reader to compare their dynamics in a more user friendly visual manner. The values on the y axis however show the real numbers for each variable so that actual values can be clearly distinguished. This is the case in all figures presented to support our discussion of the simulation results of the model in the remaining of this section.
11These along with a software copy of the model and its program code can be provided by the authors under request.
12It is likely that part of the mismatch between our model results and these data is due to typical survey inadequacies. However it is not possible for us to assess to what extent this is the case.
References
-
ADAMS, J. (1995). Risk, London: UCL Press.
ADAMS, J. and THOMPSON, M. (2002). Taking Account of Societal Concerns About Risk: Framing the Problem, London: HSE Books.
ATKINSON, N. (1999). The impact of BSE on the UK economy, Ministry of Agriculture, Fisheries & Food, London. http://www.veterinaria.org/revistas/vetenfinf/bse/14Atkinson.html last accessed 28 June, 2004.
BREAKWELL G and BARNETT. J. (2001). The Impact of Social Amplification of Risk on Risk Communication, University of Surrey, contract 332/2001, London, HSE Books.
CONNER M, POVEY, R., SPARKS, P. JAMES, R. and SHEPHERD, R. (2003). Moderating role of attitude ambivalence within the theory of planned behaviour. British Journal of Social Psychology, 42, 75-94. [doi:10.1348/014466603763276135]
DOUGLAS, M. (1966). Purity and Danger, London: Routledge and Kegan Paul. [doi:10.4324/9780203361832]
DOUGLAS, M. (1982). Essays in the Sociology of Perception, London: Routledge and Kegan Paul.
DOUGLAS, M. (1992). Risk and Blame: Essays in Cultural Theory, London: Routledge. [doi:10.4324/9780203430866]
DOUGLAS, M. and WILDAVSKY, A. (1982). Risk and Culture, an Essay on the Selection of Technological and Environmental Dangers, Berkeley, CA: University of California Press.
FAGIOLO, G., WINDRUM P, and MONETA, A. (2007). A critical guide to empirical validation of agent-based economics models: methodologies procedures and open problems. Computational Economics, 30, 195-226. [doi:10.1007/s10614-007-9104-4]
FSA (2003). Public knowledge of BSE: debrief notes on qualitative research, Cragg Ross Dawson Ltd for COI Communications, on Behalf of the Food Standards Agency FSA. Available at: http://www.food.gov.uk/multimedia/pdfs/consumer_bse.pdf last accessed 1 May 2007.
GILBERT, N. and TROITZSCH, K. (1999). Simulation for the Social Scientist, Buckingham: Open University Press.
GROSS, J. and RAYNER, S. (1985). Measuring Culture: A Paradigm for the Analysis of Social Organisation, New York: Columbia University Press.
HANNEMAN, R. and PATRICK, S. (1997). On the uses of computer-assisted simulation modeling in the social sciences. Sociological Research Online, 2 (2), 5. Available at: http://www.socresonline.org.uk/2/2/5.html. [doi:10.5153/sro.108]
HOLLAND, J. and MILLER, J. (1991). Artificial Adaptive Agents in Economic Theory. American Economic Review, 81,365-70.
IRWIN, A. and MICHAEL, M. (2003). Science, Social Theory and Public Knowledge, Maidenhead,Open University Press.
IRWIN, A. and WYNNE, B. (1996). Misunderstanding Science? The Public Reconstruction of Science and Technology, Cambridge: Cambridge University Press. [doi:10.1017/CBO9780511563737]
JANSSEN, M. A. (1998). Modelling Global Change—The Art of Integrated Assessment Modelling, Cheltenham: Edward Elgar Publishers.
JANSSEN, M. A. (2002). A future of surprises. In Panarchy: Understanding Transformations in Human and Natural Systems, (eds) L. Gunderson, and C.S. Holling, pp. 241-260. Washington: Island Press.
JANSSEN, M. A. and DE VRIES, H. J. M. (1998). The battle of perspectives: a multi-agents model with adaptive responses to climate change. Ecological Economics, 26 (1), 43-65. [doi:10.1016/S0921-8009(97)00062-1]
KASPERSON, R. E. (1996). The social amplification of risk: progress in developing an integrative framework. In Social Theories of Risk, (eds). S Krimsky and D Golding, pp. 153-178, Westport, CT: Praeger.
KASPERSON, R. E. and KASPERSON J X. (1996). The social amplification and attenuation of risk. Annals of the American Academy of Political and Social Science, 545. [doi:10.1177/0002716296545001010]
KLÜVER, J., STOICA, C. SCHMIDT, J. (2003).Formal models, social theory and computer simulations: some methodical reflections. Journal of Artificial Societies & Social Simulation, 6 (2), 8. https://www.jasss.org/6/2/8.html.
KRIMSKY, S. and GOLDING D. (eds.) (1992). Social Theories of Risk, Westport, CT: Praeger.
LONGLEY, P.A., GOODCHILD, M.F., MAGUIRE, D.J., and DAVID, W.R. (2009). Geographic Information Systems and Sciences, 2nd Edition, John Wiley & Sons.
Lord PHILLIPS of Worth Matravers, Chairman, with BRIDGEMAN J and M FERGUSON-SMITH, (2000). The BSE Inquiry. Report, Evidence and Supporting Papers of the Inquiry into the Emergence and Identification of Bovine Spongiform Encephalopathy (BSE) and Variant Creutzfeldt-Jakob Disease (vCJD), London: The Stationary Office.
MACAL, C. (2005). Model verification and validation. In: Proceedings of the Workshop on Threat anticipation: social science methods and models, The University of Chicago and Argonne National Laboratory, April 7-9, 2005.
MATTEO R., LEOMBRUNI N.S., SONNESSA, M. (2006). A common protocol for agent-based social simulation. Journal of Artificial Societies and Social Simulation , 9(2), 15. https://www.jasss.org/9/1/15.html.
MILLER, D. (1999). Risk, science and policy: definitional issues, information management, the media and BSE. Social Science and Medicine, 49, 1239-1255. [doi:10.1016/S0277-9536(99)00163-X]
NUNO, D. , SIMÃO SICHMAN, D., and COELHO, H. (2005). The Logic of the Method of Agent-Based Simulation in the Social Sciences: Empirical and Intentional Adequacy of Computer Programs, Journal of Artificial Societies and Social Simulation, 8 (4), 2. https://www.jasss.org/8/4/2.html.
OTWAY H. and WYNNE, B. (1989). Risk communication: problem and paradox. Risk Analysis, 9 (2), 141-145. [doi:10.1111/j.1539-6924.1989.tb01232.x]
PYKA A. and FAGIOLO G. (2007). A methodology for Neo-Schumpeterian economics. In: Hanusch H, Pyka A (eds) The Elgar Companion to Neo-Schumpeterian economics. Edward Elgar, Cheltenham,( pp 467-492). [doi:10.4337/9781847207012.00037]
PIDGEON N, KASPERSON, R. and SLOVIC, P.(2003). The Social Amplification of Risk, Cambridge: Cambridge University Press. [doi:10.1017/CBO9780511550461]
RAYNER, S. and CANTOR, R. (1987). How fair is safe enough? The cultural approach to societal technology choice. Risk Analysis, 7, 3-9. [doi:10.1111/j.1539-6924.1987.tb00963.x]
SALTELLI, A., TARANTOLA, S., CAMPOLONGO, F., and RATTO, M. (2004). Sensitivity Analysis in Practice. A Guide to Assessing Scientific Models; John Wiley & Sons publishers, 2004.
SARGENT, R. G. (2003). Verification and Validation of Simualtion Models 2003 Winter Simulation Conference. Chick, S., P.J.Sanchez, D. Ferrin and D. J. Morrice, eds. (pp. 37-48).
SAFARZŃSKA, K. and VAN DEN BERGH, J. (2010). Evolutionary models in economics: a survey of methods and building blocks, Journal of Evolutionary Economics, 20, 329-373. [doi:10.1007/s00191-009-0153-9]
SCHWARZ, M. and THOMPSON, M. (1990). Divided We Stand: Redefining Politics, Technology and Social Choice, Hemel Hempstead: Harvester Wheatsheaf.
SEGUIN, E. (2000). The UK BSE crisis: strengths and weaknesses of existing conceptual approaches. Science and Public Policy, 27 (4), 293-301. [doi:10.3152/147154300781781931]
SLOVIC, P. (2000). The Perception of Risk, London: Earthscan.
SJOBERG, L, MOEN, B-E., RUNDMO, T. (2004). 'Explaining Risk Perception—An evaluation of the psychometric paradigm in risk perception research', Rotundo, No. 84, Norwegian University of Science and Technology, Trondheim, Norway. ISBN 82-7892-024-9.
SMITH, E. R., and CONREY, F. R. (2007). Agent-Based Modeling: A New Approach for Theory Building in Social Psychology, Personality and Social Psychology Review; 11, 87. [doi:10.1177/1088868306294789]
SPARKS, P. and SHEPHERD, R. (2002). The role of moral judgments within expectancy-value-based attitude-behavior models. Ethics and Behavior, 12, 299-321. [doi:10.1207/S15327019EB1204_01]
THOMPSON, M, ELLIS, R. and WILDAVSKY, A. (1990). Cultural Theory, Boulder, CO.: Westview Press.
ULRICH F. and TROITZSCH K.G., (2005). Epistemological Perspectives on Simulation, Journal of Artificial Societies and Social Simulation 8(4), 7. https://www.jasss.org/8/4/7.html.
VAN ZWANENBURG, P. and MILLSTONE, E. (2005). BSE: Risk, Science and Governance, Oxford: University of Oxford Press. [doi:10.1093/acprof:oso/9780198525813.001.0001]
WYNNE, B. (1994). Public understanding of science. In Handbook of Science and Technology Studies, (eds) S. Jasanoff et al. Thousand Oaks, CA.: Sage.
WYNNE, B. (1987). Risk Management and Hazardous Waste: Implementation and the Dialectics of Credibility, Berlin: Springer-Verlag. [doi:10.1007/978-3-642-83197-3]
WYNNE, B. (1996). Patronising Joe Public. Times Higher Education Supplement, 12th April.