
 Abstract
- Although the majority of researchers interested in ABM increasingly agree that the most natural way to program their models is to adopt OO practices, UML diagrams are still largely absent from their publications. In the last 15 years, the use of UML has risen constantly, to the point where UML has become the de facto standard for graphical visualization of software development. UML and its 13 diagrams has many universally accepted virtues. Most importantly, UML provides a level of abstraction higher than that offered by OO programming languages (Java, C++, Python, .Net ...). This abstraction layer encourages researchers to spend more time on modeling rather than on programming. This paper initially presents the four most common UML diagrams - class, sequence, state and activity diagrams (based on my personal experience, these are the most useful diagrams for ABM development). The most important features of these diagrams are discussed, and explanations based on conceptual pieces often found in ABM models are given of how best to use the diagrams. Subsequently, some very well known and classical ABM models such as the Schelling segregation model, the spatial evolutionary game, and a continuous double action free market are subjected to more detailed UML analysis.
- Keywords:
- Agent-Based Modeling, Object-Orientation Simulation, UML, Complex Systems
Introduction
- 1.1
- Although the majority of researchers interested in ABM increasingly agree that the most natural way to program their models is to adopt OO practices, UML diagrams are still most noticeable by their absence in ABM related publications. Software programmed in an OO way is easier to read and to understand, simpler to code. Thanks to OO's inherent modularity, OO coding is also easier to extend, maintain and adapt. OO computation simplifies the programming of complex reality by allowing the structure of the code to come closer to the way humans perceive this reality (the first OO language was called "SIMULA"). By contrast, non OO approaches are more constrained by the processor set of elementary instructions. The inherent OO practice of decoupling complex reality into simple software classes, both in vertical (class inheritance) and horizontal directions (class association) can be considered part of the time-honoured "Cartesian" tradition that has repeatedly proved its value when dealing with complex systems. It is easier to write ten blocks of one thousand lines of code than to write one single block of ten thousand lines.
- 1.2
- It is a commonly accepted truth that it is simpler and easier to program the "agents", the "physical sites" where their live, the "resources" they consume and the "buying or selling offers" they propose as various interacting objects. Representing them and their interrelations in a class diagram is, however, still not the norm. Miller and Page, in their 2007 introductory book of computational models of social life state: "For example, in OO software design, after many separate efforts, a standardized way for specifying designs known as UML has emerged. Perhaps UML, or some other variant, will become the lingua franca of agent-based object modeling" (Miller and Page 2007). However, their prophecy is yet to be fulfilled. This is strange, when we consider UML's status as the de facto graphical visualization standard for software development.
- 1.3
- UML proposes a set of well-defined and standardized diagrams (independent of any specific programming language or computer platform) to naturally describe and resolve problems on the basis of the high level concepts inherent to the formulation of the problem. The mere act of discovering and graphically representing the main actors in any given problem ("word", "agents", "behaviors", "resources", "physical or conceptual site") along with their mutual relations and interactions over time is by itself often enough to constitute serious progress towards the algorithmic solution of this problem. The focus of UML has always been on modeling and not programming. The software community is moving in this direction—away from programming (platform dependent) and towards modelling (platform independent). Reflecting this trend, more and more automatic code generation tools are appearing on the market.
- 1.4
- By providing an intuitive but still formal visual language, UML diagrams ease the development of the software at all stages of the process, from requirements analysis to the design of the global software architecture, the sequential tracing of some parts of the execution, and the final deployment of the global software project. Among its most important facets, UML provides a level of abstraction higher than that provided by OO programming languages (Java, C++, Python, .Net …). The evolution of software technology is a story of increasing levels of abstraction. The assembly language is one abstraction level higher than the set of elementary CPU instructions, and today many programming languages reside one level up from this assembly language ancestor. Interestingly enough, during the sixties and the seventies, there were two main reasons for the software engineers to provide users with the new high level programming languages. The first reason was the diversity of assembly languages (one for every type of CPU architecture) that complicated the daily work of these good old-fashioned programmers. They had to master far too many assembly instructions in order to adapt their code to different processors. The second reason was the simplification and the time saving allowed by the existence of compilers that could on average translate one high level programming language instruction into five assembly instructions. It is definitely much easier to write "a = b + c" than a succession of "load b", "load c", "add a, b, c", "store a"…
- 1.5
- Today, programmers find themselves in almost the same situation, albeit one abstraction level up. There are too many programming languages to deal with and the ongoing popularity wars existing among these languages are conducted more on the basis of faith than on any objective criteria. Every new language tries to find the optimal compromise between simplicity (of understanding and use) and compilation efficiency (mapping to diverse CPU architectures). However, the same two arguments that led to the software community abandoning assembly language still apply, and should lead to UML being crowned as the language of the new generation. Additionally, the rising complexity of modern software will benefit from the programming language transparency made possible by the use of UML. Automatic code generation out of UML in this sense has an analogous role to that of the compiler—one arrow of UML might be translated on average into five instructions of any programming language. To see the value of UML, just compare the examination of ten classes written in sequence in a Java source code listing to the examination of these same ten classes presented as a class diagram drawn on a large white board.
- 1.6
- Many indicators are pointing to UML as the natural next step up the abstraction ladder in the evolution of software development. Firstly, there is the ongoing multiplication of platforms that can reverse-engineer code from UML diagrams. Examples at different levels of sophistication include Rational Rose, Together, Omondo and Altova. All major development CASE tools, in whatever popular programming language, such as Visual Studio or Eclipse, offer facilities to synchronize the code production and draw associated UML diagrams. It is still an ongoing topic of debate just how far this synchronization should go. James Rumbaugh, one of the three original UML authors, criticizes the current evolution of UML while claiming in Biancuzzi and Warden (2009): "I think a lot of the recent work on UML has been misguided. It never was meant to be a programming language. Use it to get the strategy right and write the final program in a suitable programming language".
- 1.7
- We can draw an imaginary axis along which to settle the diverging positions regarding UML. At one end of this axis are programmers sketching some very simple and informal diagrams on a whiteboard, to gain perspective on their own code, to communicate what the code does, to document their production or to serve as a basis for discussion about coding strategies. Users at this end of the axis are occasional and light UML users, who will only use a maximum of 20% of UML's graphic symbols. The "agile programming" community can be counted among this class of users. Agile programmers insist on "delivering working software frequently, from a couple of weeks to a couple of months, with a preference to the shorter timescale" (taken from the Manifesto for Agile Software Development). While they are some of the strongest advocates of UML exploitation, agile programmers nevertheless discourage the use of UML code generation facilities. They deem these tools guilty of slowing down the production of simple and straightforward code (the mastering of UML development software CASE tools can demand a non negligible additional work load). Most agile programmers simply draw their UML diagrams by hand. While they keep writing a lot of code, they construe UML as a very punctual help to resolve a particular algorithmic difficulty, to communicate or document their software production. In their philosophy, UML should accelerate and not hamper the high pace of executables delivery.
- 1.8
- On the other end, there are more and more developers that regard UML as the next generation of programming language, and actually generate most of their code automatically through UML diagrams and code generation tools. They claim for instance that it is much easier and much less confusing to just draw an arrow than to express "inheritance" in this huge variety of very similar languages ("extends" in Java, ":public" in C++, ":" in C#, "()" in Python, "Inherits" in VB, etc.). Similar arguments hold for class association, and even for elementary procedural loop instructions that have many different forms of expression in different languages ("while", "do-while", "for", "foreach", …). The code produced on the basis of UML diagrams should be much better written (more respectful of clean coding practices existing in any given programming language) and above all much more homogeneous between different programmers.
- 1.9
- Our imaginary UML-usage axis can also accommodate the many intermediary users of UML, who rely on code generation for some aspects of their program (for instance the automatic generation of the "setters" and "getters" methods once an attribute has been added into a class diagram or the many methods to manage extensible lists once an "1 → 0..*" association has been set between two classes) and manually produce the rest of it. As a matter of fact, there is still no established best-practice as to how UML should be used to develop models and generate code. Indeed, there seem to be as many kinds of UML use (which diagram, in what order and how deep), as there are programmers.
- 1.10
- Nevertheless, if we accept that:
- UML is here to stay.
- There is one and only one UML. It is the only standardized modeling graphical language and as such benefits from the support of all the big computer and software companies that have integrated UML in their product (for instance, the schema of relational data bases follows the class diagram in the last versions of Oracle).
- It transcends any programming language and any computer platform and encourages the programmer to spend more time on modeling than on writing code.
- Its usage is constantly increasing among developers.
- It clearly helps to produce, communicate, document, and maintain OO code, the more complex the code the greater this help.
- 1.11
- It is impossible to even briefly give an overview of the hundred modeling symbols composing the 13 UML diagrams. Besides it is not at all necessary to explain all of them since a very limited amount should be useful for most of ABM researchers. A very light and didactical introduction to UML is the purpose of Fowler's book (2003) and the Web is saturated with UML tutorials. A deeper, more demanding, review of UML and Design Patterns (to be introduced later in this paper) is the object of Craig Larman's book (2004). In the next section, I'll limit myself to presenting in more detail the four UML diagrams that should (based on my personal experience as a developer) be the most useful for ABM development: class, sequence, state and activity diagrams. I'll briefly introduce their most important features and the standard ways of using them by relying on stereotypical pieces often found in ABM models. In the final section, I subject some well known standard ABM models such as the Schelling segregation model, the spatial evolutionary game and a continuous double auction free market to a more detailed UML analysis.
Class, sequence, state and activity diagrams
-
Class diagram
- 2.1
- The following class diagram depicts a model conceived in the same spirit as the very first and most elementary stupid models (Railsback et al. 2006; Isaac 2011). It comprises a world and a set of agents moving and consuming resources in this world. Before presenting the main features of the class diagram through this pedagogical example, it is important to clarify some assumptions. First of all, we assume a basic familiarity on the part of the reader with the main concepts and mechanisms of OO programming: classes, objects, messages, inheritance and polymorphism. We assume this familiarity, as our object of study is UML itself. Note, however, that in other contexts, UML could actually be a useful pedagogical vehicle for mastering OO concepts. Second, UML is a language not a methodology. Both the exact order of diagrams to be realized and the correct drawing of each diagram are not part of the language but rather the result of correct practice acquired through experience. As a matter of fact, the class diagram is the most convenient way to illustrate the classes and their relationships but does not constitute a method to establish which classes are necessary and how they should interrelate. As all OO developers are well aware, establishing classes and their interrelationships is more of an art than a science. It requires a lot of training, development experience, the knowledge of some good recipes (such as design patterns that will be discussed below). Often the best design will emerge from a consensus between many designers.
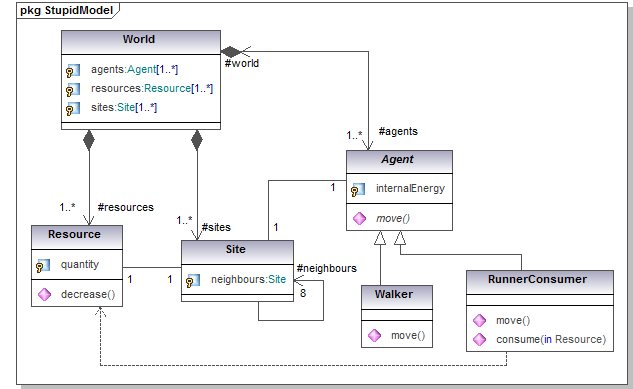
Figure 1. Class diagram of one stupid model - 2.2
- As illustrated in figure 1, the class diagram is essentially composed of the classes and the different types of relationships among them, such as association, composition and inheritance. The four main classes of the model are: World which includes all the main actors of the simulation, Site which is the physical site where the resource and the agents are located, Resource which can be consumed by some agents and Agent which move and consume the resources. Two subcategories of agents are additionally considered: Walker and RunnerConsumer. In OO, two classes are associated when objects of the first class need to run methods declared in the second class so as to exploit or modify the current state of instances of the second class. In our stupid model, many associations appear. For instance, there is a "1 - 1" association between Resource and Site since any single resource object is located on one and only one site object. A resource object can interrogate its associated site to determine its location (and what else it contains) while the site can interrogate its associated resource to assess how much of it (its quantity) still remains. A similar association exists between each agent and its site. For the agent to move, it needs to interrogate its site to determine which neighboring site is free of agents and available.
- 2.3
- An association can remain unidirectional (an arrow is then indicated at one end only) when messages between the two classes only flow in one direction. An association can contain a label at its ends. For instance #world is the name of the unique instance of the class World associated to each agent object. It could be the name of the attribute referring to the world object in the class Agent. On account of its homomorphism with reality, a large part of the class diagram remains comprehensible even for a non-programmer.
- 2.4
- A "1 - 8" directional auto-association characterizes the class Site, meaning that each site is directionally associated to its eight neighbors (here we consider a Moore type of neighborhood). Each site takes the responsibility to discover some non-occupied sites among the eight sites surrounding it, so as to inform its agent of a possible free location. In a class diagram, a black diamond indicates a stronger form of association called a "composition". A class is physically composed of another one, when the disappearance of the containing object entails the disappearance of its content. Whenever the first object leaves the computer main memory, the contained object automatically leaves it too. This is the case of the containing world object that takes the responsibility for creating all the objects driving the simulation. At the disappearance of this world object, all the resources, agents and sites, will be destroyed as well. This typically occurs at the end of the run.
- 2.5
- As an intermediary but still very useful kind of code generation, in many UML case tools, such as the Omondo plug-in on the most popular Java development platform Eclipse, a "1 - 0..*" relationship (either association or composition, meaning that any object of the first class is associated with an arbitrary number of objects of the other class) will result in the automatic generation of some ten methods, all dedicated to the management of extensible lists (add an object, remove an object, count the number of objects in the list, …). A "dependency" relationship such as the one existing between the RunnerConsumer agent and the Resource (and drawn as a dashed line) is a weaker form of association. An object has a dependency (drawn as an arrow from the dependent object to the object it depends on), when the object it depends on is a variable passed as parameter or a local variable of a method of the dependent object. In our example, the agent just consumes the resource by passing it as a parameter of its "consume" method. During a run, a single agent is not necessarily always associated with the same resource.
- 2.6
- Finally the Agent class gives birth to two subclasses through the inheritance type of relationship. A subclass is first and foremost an exact replica of the superclass (hence 'inheritance'), but is also allowed to have its own specific attributes, methods, or to redefine some methods already present in the superclass. Here the superclass Agent is indicated as abstract (everything declared "abstract" is written in italics), thus no agent object will ever be created out of it. The abstract "move" method is undefined at this hierarchical level. One needs to wait for the two subclasses Walker and RunnerConsumer to be declared in order to characterize the way agents move. The walkers will move more slowly, for example one site at every time step, while the runners will be able to jump over neighboring sites. When the world asks the agents to move, the right action is found and activated in a "polymorphic" manner i.e. at run time, depending which subclass of agent has been instantiated. RunnerConsumer objects are allowed an additional consumption behavior (as indicated also by the dependency relation with the "Resource" class). All these different behaviors, moving and consuming, affect the internal energy of the agent in appropriate ways, again depending on the agent type at run time.
- 2.7
- Many current initiatives in the software and Web communities are attempting to propose a universal ontology. These efforts usually distinguish between "static objects" and "processes" that describe how these objects change over time. A similar distinction can be made in ABM models. See, for example, the class diagram shown in figure 2 that separates the agents from the processes that affect them (these process are managed by the Behavior classes).
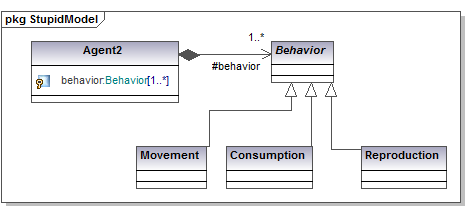
Figure 2. Behaviors adopted by the agents are kept separate from the agents - 2.8
- This separation is worthwhile as soon as individual behaviors become sufficiently complex to deserve a class of their own. As indicated in the figure, the agents can aggregate a series of behaviors (the composition link) whose schedule of execution is not at all deducible from this diagram (other UML diagrams might clarify this).
- 2.9
- The seminal "Gang of Four" Design Patterns (DP) book (Gamma et al. 1995) classifies, explains and implements 23 design patterns. Since its publication, the implementation of these software OO recipes has become one of the most thriving areas of software technology. (For a gentle introduction to the concepts, see Freeman et al. 2004). As explained in Wikipedia: "In software engineering, a design pattern is a general reusable solution to a commonly occurring problem within a given context in software design. A design pattern is not a finished design that can be transformed directly into code. It is a description or template for how to solve a problem that can be used in many different situations. Object-oriented design patterns typically show relationships and interactions between classes or objects, without specifying the final application classes or objects that are involved."
- 2.10
- Design patterns are not as easy to grasp as the basic principles of OO or the basic symbols composing UML. However, they more than justify the required earning effort. The mere act of framing any given problem in terms of design patterns forces a deeper understanding of the problem. Furthermore, the resulting mapping of the problem onto an OO architecture usually guarantees readability, flexibility and stability. In essence, the goal of most design patterns is to increase modularity and to preserve a large space of development variability by still avoiding to affect too much of the code by a local change. The best way to explain and illustrate design patterns is by drawing class or sequence diagrams.
- 2.11
- An example of a design pattern is the "bridge DP", whose goal is to enforce a clear separation between different motivations for the class specialization. For instance, the inheritance of the agents in figure 1 could be attached to the inheritance of the behaviors in figure 2, showing, if this is the case, that all sorts of agent can behave in all sorts of way. Another popular example is the "decorator DP" that separates fundamental characteristics of a class from a set of added functionalities (the decorators) which can vary from one object to another (for instance, at its birth an agent could be rich and smart, another just rich, a third rich, smart and healthy and so on). The decorator DP provides much more flexibility than simple subclassing. Functionality can be added or removed simply by adding or deleting wrappers around an object. Below, we will encounter the "state DP" when we consider the state-transition diagram and discover that polymorphism can always be considered as an instance of the "strategy DP".
Sequence diagram
- 2.12
- The second most common UML diagram for developers is the sequence diagram, which represents how objects interact and exchange messages over time. This diagram allows developers to trace the program while it executes and to follow the way objects interact in memory. This is another diagram of potentially great use to ABM researchers. Between the first and the second versions of UML, this diagram was considerably enriched so as to be better synchronized with the underlying code. To introduce this diagram, we will first show a sequence diagram in the UML 1 style. We will then show an updated version that uses the UML 2 specifications.
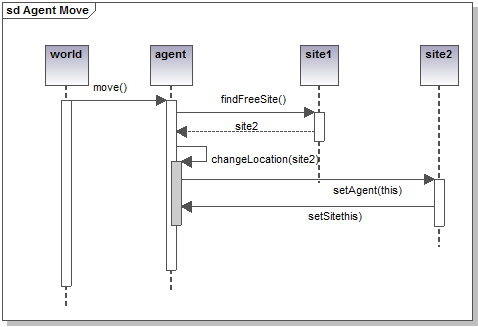
Figure 3. Sequence diagram representing the movement of one agent object - 2.13
- Figure 3 illustrates one simple sequence diagram explaining how the movement of one agent object is programmed. Everything departs from the world object that asks one specific agent to move (so "move()" should be a method in the class Agent). In order to move, the agent must first find a free neighboring site. To find a free neighbouring site, the agent queries its own site, through the execution of the "findFreeSite()" method present in the class Site. Its site (here labeled as site1) then acts so. The sequence diagram helps us to conceive the sequential steps and the execution logical flow of the program. Note, however, that in our example, we haven't shown that site1 should interrogate all the neighboring sites in turn to detect one that doesn't have an occupying agent. From this omission, we can observe that the sequence diagram (even more than the class diagram), can be used at various levels of detail and precision. As a first usage recommendation, one could say: "draw as much of the sequence diagram as is needed to help your programming, but no more".
- 2.14
- The "findFreeSite()" method returns a possible free site (in this case site2). Thus the agent executes its "changeLocation(site2)" method that will first make it the new occupying agent of site2 and successively make site2 its new location. Obviously, similarly to the class diagram, this ordering can be done in an infinity of different ways. The whole art of programming consists in producing effective code while maintaining simplicity and readability. Drawing a sequence diagram helps to evaluate different potential flows of execution and the successive responsibilities of each object. However (as we also saw for the class diagram), the sequence diagram will not automatically produce an optimal solution (assuming such a solution exists). The rectangles presented on the life line of all objects indicate the method duration and, ideally, but delicate to manually draw in practice, should be so as to make the synchronous messages embedded into each other.
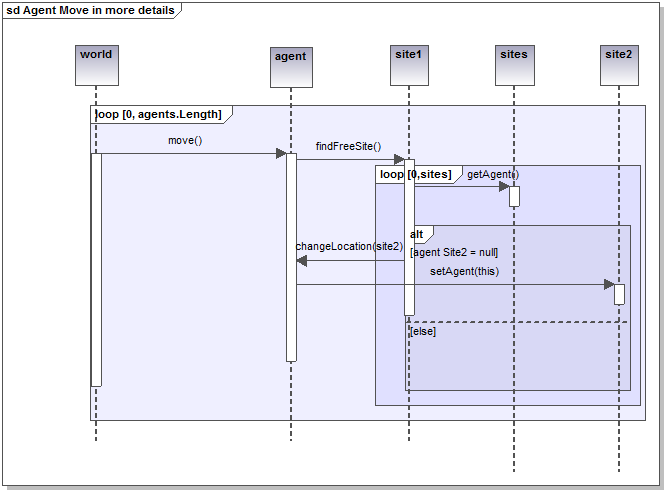
Figure 4. A sequence diagram again representing the movement of one agent, but with more procedural details - 2.15
- Figure 4 illustrates the recent enrichment of the sequence diagram in UML 2 and the new symbols that allow the programmer to indicate additional procedural details such as "loops" and "conditional instructions". This is made possible through the imbrications of specific frames (such as "loop" and "alt") in the diagram. In this more sophisticated version, the world object asks all agents to move in a sequential loop. The diagram does not include a level of detail that indicates whether the selection of the agents is done in a random or an ordered way. Once any agent receives the order to move, it asks all of its neighboring sites (in a second nested "loop" frame) to check whether or not they have an agent on site. In order to realize this conditional mechanism, an "alt" frame is used. In the positive case (indicated by [agent Site2 =null]), the agent will move to the free site (site2) and this selected site will be updated. Any programmer in any programming language will easily understand the extent to which this "improvement" makes the sequence diagram closer to the final code. Some CASE tools are capable of automatically generating this kind of sequence diagram from source code, representing the loops and conditional instructions in the code.
- 2.16
- The difference between UML 1 and UML 2 sequence diagrams highlight an ongoing debate in the UML community. Many authors (Fowler 2003; Biancuzzi and Warden 2009) criticize this recent trend to make UML closer to executable code, arguing that such a direction starts to negate the principles of abstraction—UML's core raison d'être. If the precise drawing of highly detailed sequence diagrams becomes more complicated than writing code (even pseudo-code), what is the benefit? A common standpoint is that use of UML should definitely not complicate a programmer's life but instead complement and facilitate programming tasks. This is indeed the argument put forward by the "agile programmers" who advocate light, restricted use of UML. While no programmer would debate the usefulness of the class diagram, even at a high level of details, the sequence diagram is much less utilized and is the subject of some skepticism. As a programmer of ABM, I still find it very useful to conceive the sequential unfolding of my code and the respective duty of each object over time but must admit that I never draw any of these frames, at least not by hand. They are just too intricate to draw and to understand. Consequently, I would still recommend the use of this diagram usage but in a very light way, whatever that means to you.
State diagram
- 2.17
- Figure 5 illustrates the state-transition diagram applied to a single agent object. In principle, this diagram follows the state-transitions of one complicated class of agent over its lifetime. In our simple example, our agent can find itself in only three elementary states that we have grouped into one composite state. Such a composite state is useful when a specific transition (for instance the dying transition as soon as the agent's internal energy goes below a minimum threshold) is equally applicable to all internal states of the composite group state. This diagram indicates all possible states an object can be in and all possible transitions (which can result from an event possibly based on some conditions) between these states. This diagram always starts from an initial state (the birth of the object, represented by a black disk), and ends at a final state (the death of the object, represented by a black disk inside a white disk). In our example, the agent can find itself in three possible states and the transitions between are based on conditions defined by "guards" (this is the UML name given to transition conditions). For instance, the agent switches from the "moving" state to the "consuming" state whenever a resource is present at its site and goes back to "moving" once its energy reaches a "max".
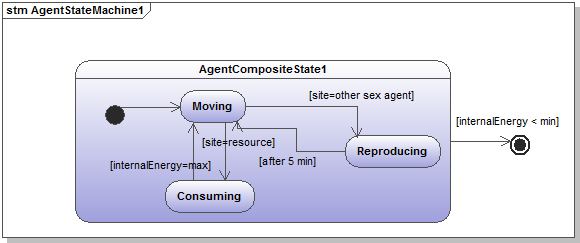
Figure 5. The UML state diagram showing the possible states the agent can be in and all possible transitions in between these states - 2.18
- In contrast to the class and sequence diagrams, no clear and unanimous proposal has emerged on ways to automatically map the state diagram into source code. If "class" and "message" have their obvious semantic counterpart in any OO programming language, this is no longer the case for "state" and "transition". Some software suites, like IBM Rational Rhapsody, use custom solutions to generate code from the state diagram. Alternatively, the state design pattern offers one possible way to automatically associate the preceding state diagram with the following class diagram shown in figure 6. In this sophisticated solution, each state is mapped onto a class responsible for the behavior of the agent while in that state. Each state is also responsible for taking care of the possible transitions occurring from that particular state.
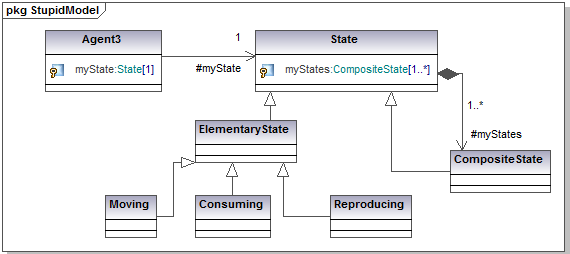
Figure 6. Applying the state design pattern to the preceding state transition diagram - 2.19
- This additional complexity is only meaningful when the behavior of the agent is sufficiently sophisticated and strongly dependent on its current state. This new holistic perception of the behavior of the agent in terms of "state" and "state transition" provides a convenient way to further modularize the model and the resulting code into behavioral blocks.
Activity diagram
- 2.20
- The activity diagram is best understood as a throwback to the more traditional procedural types of diagram (called "flow charts") that were heavily used in the past. Since the authors of UML did not want to lose any software practitioners, they made sure to incorporate a diagram called the "activity diagram" similar in spirit to these flow charts. Despite its antecedents, the activity diagram can still be of considerable help to programmers when dealing with the more procedural instructions flow related parts of their code. This diagram is often seen as an alternative to the state diagram, depending on the perception the developer has of his model. Is the dynamic of your objects better interpreted as a succession of states (such as a sequence of snapshots) or a succession of activities? One slight advantage of this diagram over the state diagram lies in its ability to cover the behaviors of collaborating elements (in some such cases it can also become an alternative to the sequence diagram).
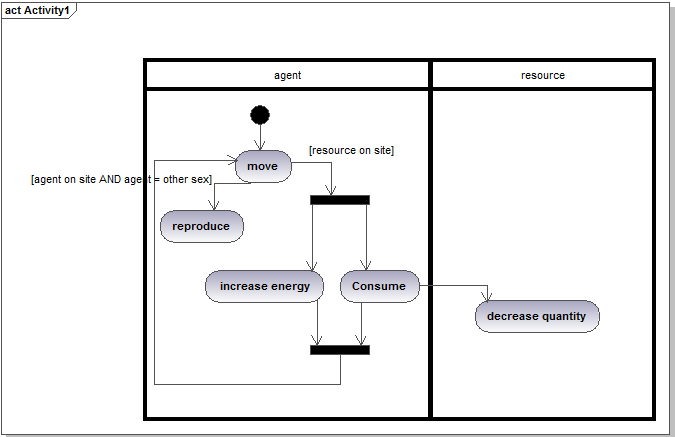
Figure 7. An activity diagram representing the same kind of situation as represented in the previous state diagram - 2.21
- Figure 7 shows the main symbols of the activity diagram for a situation very similar to that represented in the previous state diagram. It is easy to see the partition of the activities between the two actors—the agent and the resource. Another interesting addition of this diagram (also existing in the state transition diagram) is the two black bars representing the start and the end of concurrent activities. While the agent consumes, its internal energy grows. Here, no indication is given as to the relevant software technology that could achieve such concurrency (multithreading or the nesting of two loops being two possible options). Similarly to the state transition diagram, there is no obvious code generation mechanism that can be applied to this diagram. As with the application of the state design pattern, one can easily imagine modularization of code based on the activities detailed in the diagram.
- 2.22
- Some of the most popular UML books (e.g., Martin and Odell 1997) make few references to computers and software engineering. They present UML diagrams as a new standardized language to describe complex systems whatever final form this description will take: just a couple of drawings on a whiteboard or executable code. Their favorite examples are the internal structure and running of companies, the following up of a commercial order, urgency procedures or the description of human daily activities. Not surprisingly, in those books, the state and the activity diagrams are frequently used, without any suggestion as to how these descriptions could be transformed into code. Once again, this testifies to the multitude of ways in which UML can be understood and used: from helping to schematically describe complex systems, to helping to write communicate or document elegant OO code, up to the automated production of executable software. It really remains up to the user. The language is formal and precise, but use-methodology is unrestrained.
Some stereotypical ABM models analyzed in UML
- 3.1
- In the following, three very simple and very familiar ABMs will be briefly analyzed and refactorized in UML form: firstly, the Schelling's segregation model, secondly, a spatial evolutionary game opposing cooperators and defectors, and thirdly, a free market economy where buyers and sellers behave according to a continuous double auction market. The first two are written in Java and the last one in C#. Source code is available on request.
Schelling's segregation model
- 3.2
- This elementary model (Schelling 1978) has become a classic of the sociological literature. It surprisingly shows how even a weakly racist attitude can lead to a highly segregated society. The starting and final snapshots of the simulation are shown in figure 8.
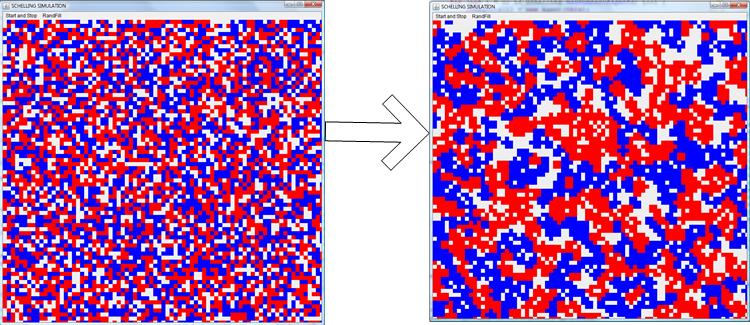
Figure 8. Schelling's segregation simulation: starting and the final snapshots - 3.3
- Each agent is located on one site and the board contains a small fraction of empty sites. The model uses a Moore neighborhood (each site has eight neighbors). At each time step, an agent moves (and occupies a free location picked randomly) if more than two of its neighbors are of different color. At the end of the simulation, clusters of very similar agents percolate through the board.
- 3.4
- The following class and sequence diagrams are truly self-explanatory.
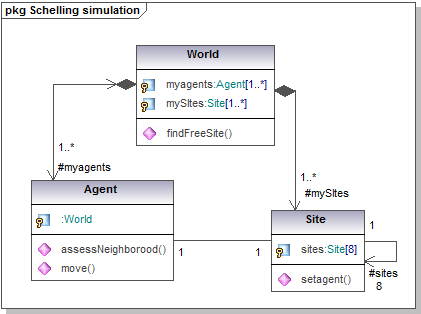
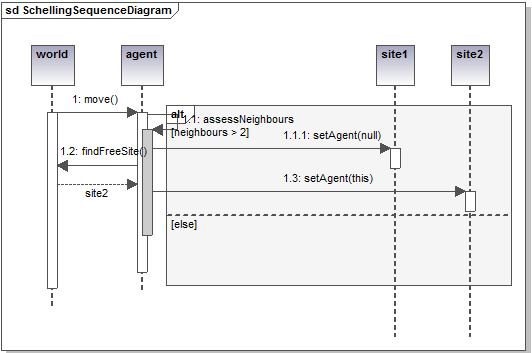
Figure 9. Schelling segregation simulation class and sequence diagrams Spatial evolutionary game
- 3.5
- In this simulation (Nowak et al. 1994), two types of agents compete to occupy the full board: cooperators and defectors. The agents don't move but change their type (cooperator or defector) over time by imitating their most successful neighbors. At each time step, all agents play a game with all their neighbors and cumulate their fitness according to the rules of the game. Once the game is over, each agent will reproduce and adopt as its new type (with a certain probability) the type of its fittest neighbor. In the case the agents play the famous prisoners dilemma game, and for certain value of the fitness gain, the cooperators can (surprisingly) spatially regroup themselves in order to survive the pressure of defectors (as illustrated in figure 10, where the cooperators are painted in blue and form islands of resistance against the yellow defectors).
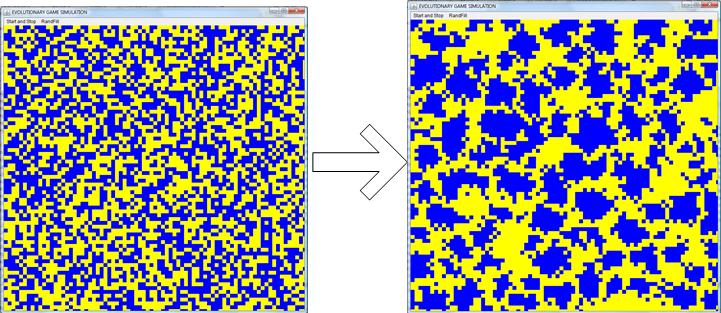
Figure 10. Evolutionary game simulation: the starting and the final boards - 3.6
- The following class and sequence diagrams try to capture as much as possible of the possible variations of this simulation. Basically each agent needs to accomplish two different types of behavior: the game they play with their neighbors and the way they reproduce or imitate the most successful of these neighbors. These two behaviors can be of different subclasses. For instance, many types of game are possible (chicken, prisoner dilemma, stag hunt, etc.) changing the way each agent's fitness is computed as an outcome of the game. Similarly, different ways to imitate their neighbors are feasible (e.g. stochastic choice, always imitate the most successful). This class diagram allows different types of game and reproduction strategies to coexist and to be easily changed and tested. The researcher can quite simply mix and test many variations on a theme. Inheritance allows adding new versions of these behaviors while taking profit of the existing ones.
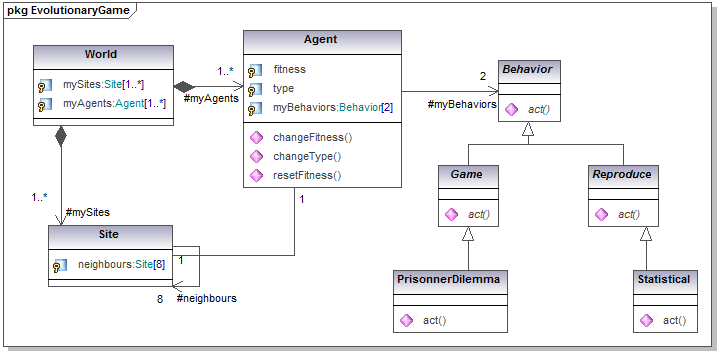
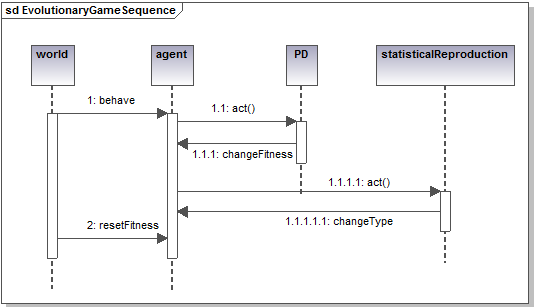
Figure 11. Spatial evolutionary game simulation class and sequence diagrams Continuous Double Auctioning vs Random Markets
- 3.7
- The final example is taken from a recent work of the author (Bersini and Van Zeebroek 2011). It questions the competitive free market as the most efficient way to maximize welfare and to equally allocate rare resources among economic agents. An object-oriented agent-based model tries to address this question. Agents which are alternatively producers, sellers, buyers and consumers participate in a market to increase their welfare. Two market models are compared: a competitive model based on a double auction market (also studied by Gode and Sunder 1993 and Fano and Pellizzari 2011) in which agents attempt to outbid each other in order to buy and sell products, and a random model in which products are allocated in a random manner. We compute and compare in both cases the money and utility generated within the markets as well as a Gini index that characterizes the degree of inequality in the allocation of these values among agents. The results of hundreds of simulations are analyzed. The results show that (as is well known) the competitive market creates more value overall but also show that (generally less accepted and much debated by economists) this value comes at the expense of a much greater inequality.
- 3.8
- Only the OO organization will be presented here. The interested reader is referred to the original paper for the motivations and results. The model implemented in C# maps elegantly to an object oriented model with the distinct responsibilities distributed through the different classes. These classes and their relationships can be seen in the simplified class diagram in figure 12 together with the state diagram associated to each agent.
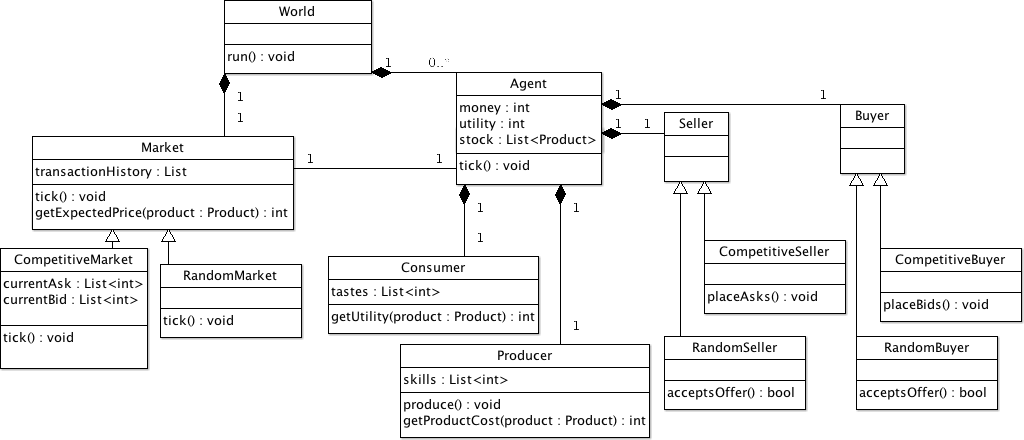
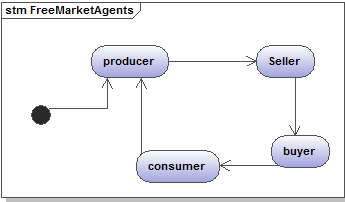
Figure 12. Class and state diagram of the free market economy model - 3.9
- The model's different components all live within a structure called the world. The world contains all the agents as well as the market. Each world has one market, either a competitive double-auction market or a random market, a series of agents and some world specific settings such as the initial endowment of the agents, the number of different products the agents can make and trade. A given number of products are bought and sold. The world is not limited in the number of units for each product, but each transaction concerns only one unit of the product. Each world corresponds to one simulation. Worlds always come in pairs with equal initial settings, but one modeling the competitive market and the other modeling the random market.
- 3.10
- The agents are the main actors of the model, they are the imaginary people who produce, consume and trade goods driving the model's markets. In agreement with the state transition diagram, each agent behaves alternatively according to its integrated Producer, Consumer, Buyer and Seller classes. So each agent plays the four roles in turn.
- 3.11
- The world moves forward through discrete time-steps. During a tick, an agent is given a chance to produce one item, after which the market will execute one transaction. As a result, one product unit is exchanged between the seller and the buyer agents. Once acquired, the buyer agent immediately consumes the product and increases its utility based on its 'taste' for the consumed product.
- 3.12
- As seen by the presence of inheritance in the class diagram, two kinds of markets are studied in the model: the competitive one which is a double auction market and the random/distributive one. This inheritance also applies to the buyers and sellers that can behave either competitively or randomly.
- 3.13
- In the competitive market, agents bid to buy and sell goods. During a succession of steps, the market repeatedly invites two randomly selected agents to place asks and bids on a product they want to sell or purchase. Buyers choose the product that maximizes their expected net utility given the latest competing offer and sellers choose the product that maximizes their expected net profit given the latest competing offer. For each product, the market remembers only the highest bid and the lowest ask made in the current tick. As soon as these two numbers match, the transaction is executed between the two winning agents for that specific product.
- 3.14
- In the random market, consumers are proposed a certain product to buy from a given producer. Provided that the taste of the agent for the proposed product is larger than the producer's cost (inverse of skill) for the given product and that the buyer is sufficiently endowed, the transaction is made and the price is randomly set by the market between these two bounds.
- 3.15
- Whatever the initial conditions we set in the model, the competitive market consistently and significantly produces more welfare at the aggregate level than the random market. However, it also leads to many more inequalities in the distribution of utility and money (hence wealth) than does the random market.
Conclusions
- 4.1
- Many reviews exist these days discussing and comparing different software platforms that ABM researchers can use to rapidly develop and test their models (Epstein 2007; Gilbert and Bankes 2002; Gilbert 2008; Robertson 2005). The content of this paper is orthogonal to these existing reviews since the use of UML remains valuable and defendable whichever platform or programming language is being used. If a researcher decides, for example, to use NetLogo (that essentially hides the OO modularization of the code) (Wilensky 1999; Izquierdo 2007) to produce his or her model, it would still be beneficial to present and document the code through some well conceived UML diagrams. Given a basic understanding of UML, these diagrams should still be easier to read and understand than the NetLogo or Python code (Isaac 2011).
- 4.2
- The underlying message of this paper is to propose the enrichment of any library of existing ABM models with UML diagrams that describe the main actors of the model and what these actors are supposed to do (how they progress in time, how they interact). The previous chapters of this paper give some indications on the way to fill this library with very useful diagrams. As such these diagrams could be construed as some form of entrance door to the final code, also available, whatever proximity or homeomorphism exists between these models and this code. Despite many controversies still existing about the role played by the UML diagrams with regard to the final code production, no competent developer would deny the positive impact these diagrams can provide at particular phases of development.
- 4.3
- The benefit brought by UML becomes more marked as models grow in complexity (reflected by the number of classes). If considering only the trivial pedagogical examples used in this paper, the reader could remain skeptical. Note, however, that UML has been advocated in other scientific fields such as biology, chemistry or physics (one can easily imagine the complexity of our current strategically important climate models, even if most of them are written in Fortran, not an OO language) (Bersini 1999, 2006, 2009; McEwan et al. 2011). The particular case for UML in biology for example, hinges on the fact that despite the longstanding tradition of complex software models in biology, there is very little reuse. Very few software models in biology have been used or run even after the source code has been made publicly available and the authors have published papers explaining the code. The exceptions to this rule consist largely of simple, highly abstract models, which in some cases have received further attention. However, the selection of these models can be attributed to their oversimplification, their pedagogical character and/or unexpected qualitative outcomes. Examples of such simplified models include simulations based on cellular automata.
- 4.4
- Once a model aims at getting beyond qualitative phenomena and tries to capture more refined biological knowledge, the resulting code almost inevitably becomes too complex to attract further researchers. The effort of understanding the software is not worth the benefits gained by running the code. The amount of new knowledge acquired by understanding and running the code does not deserve such cognitive work load or, if it is does, it is easier to rewrite the entire code from scratch. In previous papers, I have argued that theoretical biologists or chemists could gain a lot from the adoption of professional programming practices, rendering their software more readable, scalable and usable. Such adoption could end the current frustrating situation of "write once run only once". The use of UML could play an important role in this process. I have no doubt that economic or sociological software models will rapidly reach the level of complexity attained by their predecessors in other fields. Researchers in these fields are not so constrained (as it is usually the case in physics or chemistry) by the existence of legacy procedural software (that most researchers use as black boxes to plug in their software). As a result, it should be relatively easy for them to adopt well established software practices that the use of UML encourages and accompanies.
- 4.5
- This paper only focuses on four of the thirteen UML diagrams. This restriction is first due to some well known redundancies among the diagrams and expresses the author's preferences. Readers could decide differently and privilege other diagrams without changing the main purpose and mission of UML. A second reason for the restriction to four diagrams is the deliberate avoidance of some other important diagrams such as the "use case" diagram (that describes the functionality of the system from the viewpoint of the user) or the "component" and "deployment" diagrams that cover file organisation and processor architecture. While these diagrams play a key role when a software project has many users with different needs, presents a rich interface and requires a large software and hardware infrastructure, they should be of minor importance for most ABM modelling endeavours.
References
-
BERSINI, H. (1999) Design Patterns for an OO Chemistry. Proceedings of the 1999 European Conference on Artificial Life. MIT Press. pp. 389-398
BERSINI, H. (2006) Immune System Modeling: The OO Way. In Proceedings of ICARIS 2006. pp. 150-163 [doi:10.1007/11823940_12]
BERSINI, H. (2009) Object-Oriented Refactoring of Existing Immune Models. In Proceedings of ICARIS 2009. Springer Verlag. pp. 27-40 [doi:10.1007/978-3-642-03246-2_8]
BERSINI, H. and N. van Zeebroek (2011). Why should the economy be competitive? In Emergent Results in Artificial Economics. Osinga, Hofsede and Verwaart (eds). Springer Verlag, pp. 117-128.
BIANCUZZI, F. and S. Warden (2009). Masterminds of Programming. Conversations with the Creators of Major Programming Languages. O'Reilly.
EPSTEIN, J.M (2007) Generative social science: Studies in agent-based computational modeling. Princeton, NJ: Princeton University Press.
FANO, S. and P. Pellizzari (2011). Time-Dependent Trading Strategies in a Continous Double Action. In Emergent Results in Artificial Economics. Osinga, Hofsede and Verwaart (eds). Springer Verlag, pp. 165-176. [doi:10.1007/978-3-642-21108-9_14]
FOWLER, M. (2003). UML Distilled: A Brief Guide to the Standard Object Modeling Language (3rd Edition). Addison-Wesley Professional.
FREEMAN, Eric T; Elisabeth Robson, Bert Bates, Kathy Sierra (2004). Head First Design Patterns. O'Reilly Media.
ISAAC, G. A. (2011) The ABM Template Models: A Reformulation with Reference Implementations. Journal of Artificial Societies and Social Simulation 14 (2) 5. https://www.jasss.org/14/2/5.html
Gamma, Erich; Richard Helm, Ralph Johnson, and John Vlissides (1995). Design Patterns: Elements of Reusable Object-Oriented Software. Addison-Wesley. ISBN
GILBERT, N. (2008) Agent-based models. Sage Publications, Inc.
GILBERT, N. and S. Bankes (2002). Platforms and methods for agent-based modeling. PNAS, 99. (Suppl. 3) , pp. 7197-7198. [doi:10.1073/pnas.072079499]
GODE, D.K. and S. Sunder (1993) Allocative efficiency of markets with zero-intelligence traders: Market as a partial substitute for individual rationality. Journal of Political Economy, 101(1), 119-137. [doi:10.1086/261868]
IZQUIERDO, L.R. (2007) NetLogo 4.0 Quick Guide. http://luis.izqui.org/resources/NetLogo-4-0-QuickGuide.pdf
LARMAN, C. (2004) Applying UML and Patterns: An Introduction to Object-Oriented Analysis and Design and Iterative Development (3rd Edition). Prentice Hall.
MARTIN, J. and J.J. Odell (1997). Object-Oriented Methods: A Foundation, UML Edition (2nd Edition). Prentice Hall.
MCEWAN, C., Bersini, H, Klatzmann, D., Thomas-Vaslin, V. and A. Six (2011) A computational technique to scale mathematical models towards complex heterogeneous systems. In Proceedings of COSMOS ECAL 2011 Conference.
MILLER, J. and S. Page (2007). Complex Adaptive Systems: An Introduction to Computational Models of Social Life. Princeton University Press.
NOWAK, M., Bonhoeffer, S. and R. May (1994). Spatial games and the maintenance of cooperation. PNAS 91 (11), 48-77. [doi:10.1073/pnas.91.11.4877]
RAILSBACK, S.F., Lytinen, S.L. and S.K. Jackson (2006). Agent-based simulation platforms: Review and development recommendations. Simulation: Transactions of the Society for Modeling and Simulation International, 82(9), 609-623. [doi:10.1177/0037549706073695]
ROBERTSON D. A. (2005) Agent-Based Modeling Toolkits: NetLogo, RePast, and Swarm. Academy of Management Learning and Education 4, December 2005. pp. 525. [doi:10.5465/amle.2005.19086798]
SCHELLING, T.C. (1978). Micromotives and macrobehavior. New-York: Norton.
WILENSKY, U. (1999). NetLogo. Evanston, IL: Northwestern University, Center for Connected Learning and Computer-Based Modeling.