
 Abstract
- Pandemics can cause immense disruption and damage to communities and societies. Thus far, modeling of pandemics has focused on either large-scale differential equation models like the SIR and the SEIR models, or detailed micro-level simulations, which are harder to apply at a global scale. This paper introduces a hybrid model for pandemics that considers both global and local spread of infection. We hypothesize that the spread of an infectious disease between regions is significantly influenced by global traffic patterns and that the spread within a region is influenced by local conditions. Thus we model the spread of pandemics considering the connections between regions for the global spread of infection and population density based on the SEIR model for the local spread of infection. We validate our hybrid model by carrying out a simulation study for the spread of the SARS pandemic of 2002-2003 using available data on population, population density, and traffic networks between different regions. While it is well-known that international relationships and global traffic patterns significantly influence the spread of pandemics, our results show that integrating these factors into relatively simple models can greatly improve the results of modeling disease spread.
- Keywords:
- Data-Driven Simulation, Epidemiology, Network-Based Simulation, SARS
Introduction
- 1.1
-
Modeling of the spread of infectious disease typically falls into one of two categories. Analytically tractable models like the SEIR model are capable of capturing some globally important phenomena like the rate of spread of diseases using few parameters. However, they have a hard time reflecting differences in global spread due to local conditions. For example, it can be difficult to model different rates of spread in countries with different population densities and public health policies of variable strength and coordination. Network- or agent-based models are capable of reflecting details of individual conditions. However, modeling large-scale global disease-spread using such models often runs into methodological problems like overfitting because of the vast number of possible parameters.
- 1.2
-
This paper proposes a granular, network-based hybrid model of disease
spread in which individual regions are modeled as nodes in the
network, and the spread of disease within nodes is modeled
analytically (using a simplified derivative of the SEIR model) with
the help of demographic parameters like population density. The
properties of the network as a whole, like connectivity, are
determined using real data on traffic between regions. We demonstrate
the power of this approach by simulating the spread of SARS. One of
the key takeaways is that the level of granularity has a significant
effect on the success of network- or agent-based simulation
models. For example, we show that modeling China as an individual node
is unsuccessful, whereas breaking it up into constituent regions gives
an impressive match to real infection data on SARS.
- 1.3
-
One of the great advantages of our model is its parsimony: it contains relatively few tweakable parameters compared with general agent-based models. At the same time it is capable of reproducing the important broad flows of disease. However, it is important to remember that exact reproduction of historical data is not the end-goal. Exceptions that do not correspond to real data provide insight into specific local phenomena that influence the progression of a pandemic, such as the actual timing of the first infected case in a country.
Related Work
- 1.4
-
There is a vast literature on understanding the spread of disease using analytical and simulation models. In the next section we give a brief overview of the most common modeling methodologies, including differential equation models and simulation models, but here we discuss related research more generally. The most closely related to this work can be grouped into two categories. First, several researchers have simulated and analyzed the local spread of SARS in 2002-2003 (Huang et al 2004; Li et al 2004; Zhang et al 2005). In particular, Huang,
et al (2004)
reproduce the situations in Singapore, Taipei, and Toronto
individually, and compare with the actual transitions. This also
ties in to a significant existing literature on local modeling of
historical pandemics, like Influenza during the First World War
(e.g. Chowell et al 2006; Massad et al 2006). Other examples also abound: Jenvald, et al (2007) use a virtual city based on Linköping, Sweden, considering the number of schools, age distribution, and household type; Longini, et al (2005) model population and contact
processes based on Thailand census data, demographic information,
and social network data; Kelso and colleagues
model a real community in the southwest of Western Australia (Kelso et al 2009; Milne et al 2008).
- 1.5
-
The second category involves simulating global infection spread using international traffic data. For example, several papers use air travel data to estimate connectivity in a network (Ferguson et al 2006; Colizza et al 2007; Flahault et al 2006; Cooper et al 2006). However, these
authors typically simulate a hypothetical global pandemic, with a
focus on intervention policies; the focus of our research is to validate the simulation with real historical data.
- 1.6
-
Much existing research simulates infection in networks with reasonable properties, but not necessarily based on existing real-world data. For example, Bailey simulates epidemics in two dimensions, such as square grids (1965). Patel et al (2004) and Weycker et al (2004) consider hypothetical
populations of 10,000 persons, comprised of five communities of equal
size, containing schools and neighborhoods. Vespignani,
Pastor-Satorras, and co-authors simulate the spread of infectious
diseases on complex networks (Moreno et al 2002; Pastor-Satorras and Vespignani 2002; Pastor-Satorras and Vespignani 2001; Pastor-Satorras and Vespignani 2002 ; Pastor-Satorras and Vespignani 2001; Boguná et al 2003). Carrat et al (2006), Glass et al (2006), and Eubank (2002) also generate complex networks for simulation.
- 1.7
-
Another major theme of research has been on the effects of prevention and/or mitigation strategies. These typically compare a “base” simulation and an alternative simulation which considers some proposed strategy. For example, Longini, et al (2004) use stochastic epidemic simulations to investigate the effectiveness of targeted antiviral prophylaxis to contain influenza. Kelso et al (2009) simulate the effect of social isolation, such as school closure, individual isolation, workplace nonattendance, and reduction of contact. Carrat et al (2006) explore the impact of interventions, such as vaccination, treatment, quarantine, and closure of schools and workplaces. Germann et al (2006) simulate and compare the baseline and several combinations of mitigation methods. Patel et al (2004) use genetic algorithms to find optimal vaccination strategies. Weycker et al (2004) estimate the population-wide benefits
of routine vaccination of children.
The SARS Pandemic
- 1.8
-
The SARS pandemic of 2002 is a useful case study for our modeling methodology.
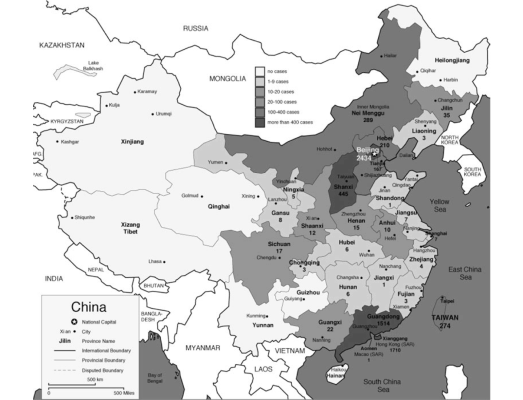
The pandemic spread to 29 countries/regions in 2002 and 2003. In total 8,096 people were infected and 774 people died as of December 31, 2003 (World Health Organization 2010). Figure 1 shows the spread of SARS as of April 8, 2003. In 20 of 29 countries/regions, 100% of total cases in the country were “imported” (as defined by WHO) from other countries (WHO Regional Office 2006).
Figure 1: SARS Map: Cumulative number of reported cases as of April 8, 2003 (World Health Organization 2010) 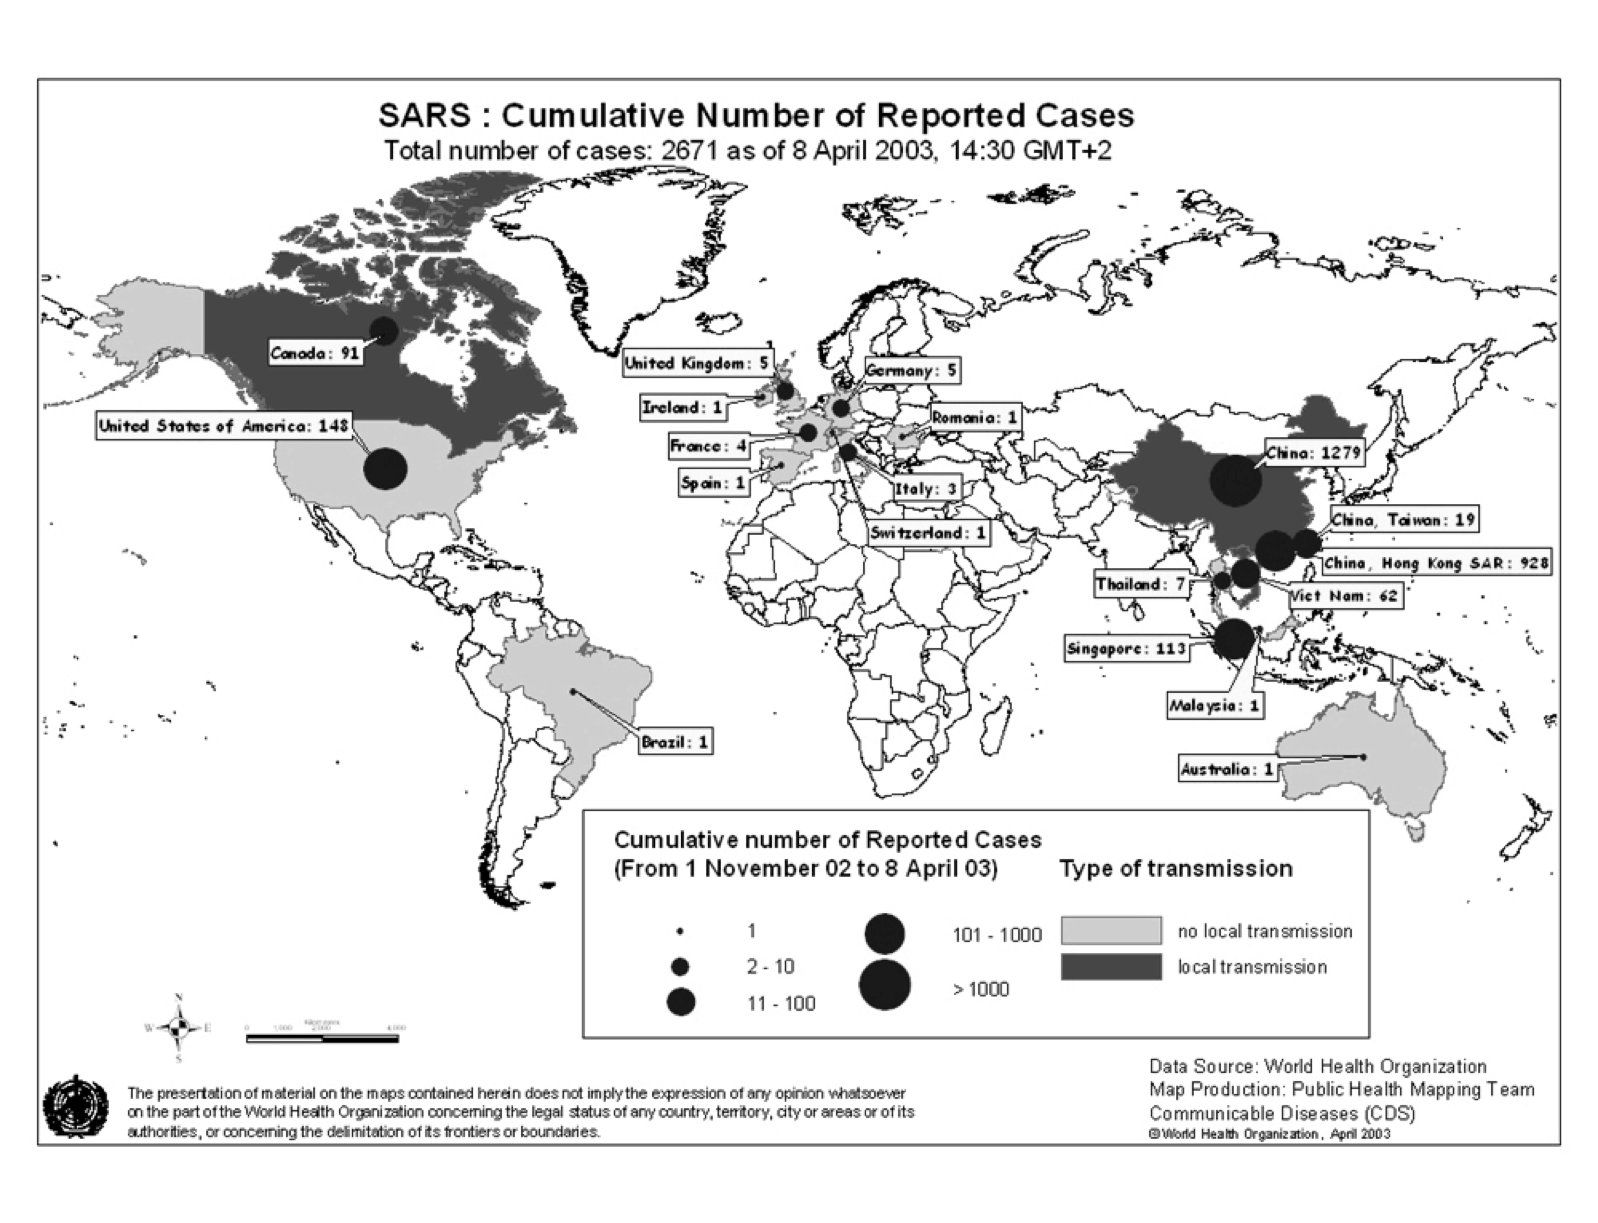
- 1.9
-
The SARS pandemic is a particularly useful case study because we have
high-fidelity data on the outbreak. First, the beginning and end of
the pandemic are clear. According to the WHO, the first case was a
male in his 40's in Guangdong, China, in November 2002. SARS started
substantially spreading from Hong Kong to other countries in February
2003, infecting 29 countries and regions by July 2003. After that,
there were no new cases except for one infection through a laboratory
accident. Second, the number of cases is clearly reported (and
relatively small). WHO reported the cumulative number of cases and the
number of new infected cases from March 17th to July 11th 2003 (World Health Organization 2010). Third,
the number of infected countries is clearly shown. 29
countries/regions reported SARS infection by the end of 2003 (World Health Organization 2010). Thus
we have good data on the progress of infection in different countries
and regions.
Modeling the Spread of Disease
- 2.1
-
We first introduce the main existing methodologies used for modeling
the spread of infectious disease before describing our approach in
detail.
Infectious Disease Models
SIR Model
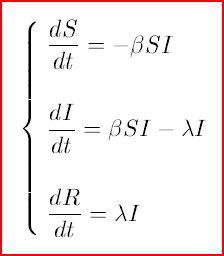
The classic SIR model, proposed by Kermack and McKendrick in 1927 (Capasso 1993), posits three classes of agents; Susceptible, Infectious, and Removed. Susceptible agents (hereafter denoted S ) are vulnerable to a disease and have the potential to be infected. Infectious agents (I ) are currently infected and have the risk of infecting S . Removed (R ) agents are removed from the system – they are either dead or have acquired immunity. - 2.2
-
Thus R-category agents
are not infected again (R
may also be called the Recovered category
when we assume those agents are not dead). When R
is not dead but has instead acquired immunity, the total population, (S + I + R
), is constant. The model assumes that agents in the set S
are sometimes infected by a contact in I
and change to R
at a constant rate. This yields the expressions below for the transition of populations of these three classes.
where β is the rate of infection from S to I and λ is the rate of recovery from I to R . λ is inversely proportion to the average infectious period, τ : λ = τ-1 . When β/λ > 1 , the infection spreads since the susceptible become infected faster than the infected agents recover. The basic reproduction number, R0 , is the average number of persons infected by a single infected person when the population has no immunity and no control against the infection (Yamamoto 2006). In the SIR differential equation model, the basic reproduction number is given by R0 = Nβ/λ . If one infected person infects more than one susceptible person (i.e., R0 > 1 ), secondary infection occurs and the infection spreads. On the other hand, if R0≤1 , the disease converges. Therefore R0 = 1 is a threshold for spread.SEIR Model
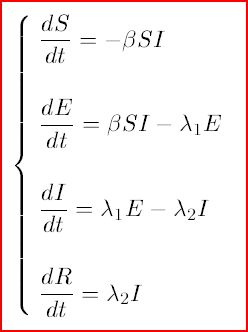
The SEIR model is a derivative of the SIR model. SIR does not consider the incubation period. Thus, when S is infected, it becomes I immediately and starts to infect other S (Wolfram Mathworld 2010). In the real world, there is some duration between the time that a person is infected and the time that he/she starts infecting others. The SEIR model denotes agents in the incubation period as belonging to class E (exposed) (Hethcote and Tudor 1980). The transition equation for the number of infected agents in the SIR model now works for the number of exposed agents, and the basic equations for the number of susceptible and recovered agents remain the same. A new equation has to be introduced for the number of infected agents that takes into account two different transitions: the transition from exposed to infected (increasing the number infected) and the transition from infected to recovered (decreasing the number infected). Now the transition equations become:
Network- and Agent-Based Models
- 2.3
-
Agent-based modeling provides an explicit, local method of understanding the spread of infection. It allows for fine-grained control over many aspects of the dynamic model of disease spread, including geographic factors and agent movements. For example,
Carley et al (2003) simulate the spread of anthrax and Epstein et al (2004) investigate the spread of smallpox with agent based models. Deguchi et al have developed an Agent Based simulation language called SOARS, Spot Oriented Agent Role Simulator (2006a; 2006b) for simulating the spread of disease considering modules such as human activities, opportunity for contact between people in a society, disease state, and intervention to control the spread.
- 2.4
-
Network-based models typically represent agents as nodes on graphs and allow the connectivity structure of the graph to determine the possible spread of disease.
For example, extending an SIR model to networks would involve allowing
a susceptible vertex S
to be infected by an infectious vertex I
only if S
is adjacent to I
. Network-based models are useful in that they can reflect social and economic networks.
People's behaviors and social contacts build the network and the infection route is on the network.
Our Approach
- 2.5
-
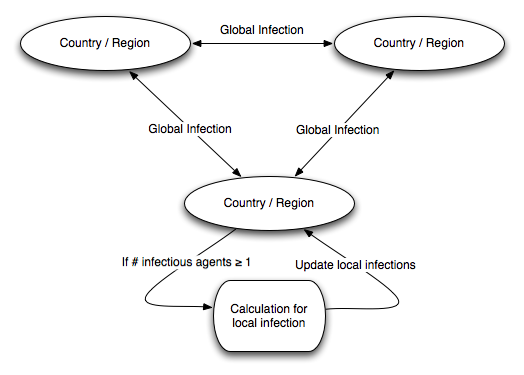
Our model uses local regions and interconnections between them.
There are three possibilities for a new infection in a region; (1)
infection from travelers from outside the region, (2) infection from
returning travelers, and (3) infection from local persons. We denote
infection types (1) and (2) as “global” infections and
type (3) as “local” infections. Figure 2 shows the basic structure of our
model. We note that while we are modeling stochastic spread of
infection, the model itself outputs deterministic results which can
be interpreted as a time series of the expected number of infections.
Global and Local Infections
- 2.6
- We assume that infection starts in a particular country or region and spreads from there. At each cycle, infections of all types can occur. Global infections (types 1 and 2) occur with frequencies that are dependent on the level of travel between regions, and local infections are mostly dependent on the population density of a region (details of the data used are below).
Our local model is based on the concept behind the SEIR model. We consider the same four types of agents in each region: Susceptible, Exposed, Infectious, and Removed. When an infection occurs, agents are considered exposed. The model proceeds in time cycles t
. The number of agents newly exposed in region i
at time t
through the global infection mechanism is modeled as
EGi(t) = ∑ j Ij(t)⋅Tij⋅PG*(t)
, where the sum is over other regions, Tij
is the sum of travelers from region i
to region j
and the number of travelers from region j
to region i
(since infection can occur through both arriving and returning travelers), and
PG*(t)
is a “global infection coefficient” at time t
, described below.
- 2.7
-
Local infection follows a similar process, so that the number of agents newly exposed through the local infection mechanism at any time t
is given by
ELi(t) = Si(t)⋅Ii(t)⋅PLi*(t)
where
PLi*(t)
is a “local infection coefficient” (similar to the global infection coefficient, both are described in detail below).
- 2.8
-
It is assumed that agents go from exposed to infectious according to some incubation period that is disease-specific, and, similarly, from infectious to removed according to some disease-specific recovery period. For the purposes of this paper, we set these to 10 for both incubation period and infectious period, but these parameters can of course be varied for modeling other diseases.
Infection probabilities
- 2.9
-
As awareness of a disease spreads, it is likely that heightened awareness and prevention measures start to reduce the spread of infection. We model this in our global and local infection coefficients, by introducing a term that dampens the coefficient over time. For global infection, we use
PG*(t) = PG - (DG⋅t)
where PG
is a basic global infection coefficient, held constant across regions, and DG
models the damping effect.
- 2.10
-
We use a similar equation for the local infection coefficient,
PLi*(t) = PLi - (DL⋅t)
. In this case, DL
is assumed constant across regions, but the basic local infection coefficient PLi
is region-specific, and linear in the
population density (assumed to be the main driver of local infection
rates):
PLi = ρi⋅C1 + C2
where ρi
is the population density of region i
.
- 2.11
-
It is worth noting that the original SEIR model gives a similar type of equation for newly exposed agents
E = β⋅S⋅I
, where β
is the infection rate. The main novelty here is the combination of modeling a declining infection rate, and treating each region separately.
Calibration With Data
- 3.1
-
There are several model parameters that need to be calibrated using real data. It is useful to consider some background information on the characteristics of SARS in this context.
Characteristics of SARS
- 3.2
- The SARS Coronavirus causes general infection with Viremia, especially severe pneumonia and intestine infection. It is transmitted primarily through droplet infection. Due to its resistance to dryness, it can also be transmitted through air. It is thought that the incubation period of SARS is usually 2-10 days and the average is 5 days (Okada and Tashiro 2003). In the pandemic of 2002-2003, most countries reported a median incubation period of 4-5 days, and a mean of 4-6 days. In the incubation period, it is unlikely an infected person will spread the disease through droplet infection. The infectious period is thought to be about two weeks, with its peak from the 7th-10th day after infection (Okada and Tashiro 2003). Transmission efficiency appears to be greatest from severely ill patients who are experiencing rapid clinical deterioration, usually during the second week of illness. Maximum virus excretion from the respiratory tract occurs on about day 10 of illness and then declines to 0% by day 23. There are no reports on transmission beyond 10 days of fever resolution (University of Hong Kong 2010). The death rate varies by age group (SARS affects older patients much more severely), but the overall death rate was about 9.6% in the 2002-2003 SARS pandemic, significantly higher than that of seasonal Influenzas. Another notable feature of SARS is that it is believed that “super-spreading” events, where a person infects many more than the average rate of infection, are a key component in its transmission. Our model does not deal explicitly with such levels of granularity, which may lead to some outlier predictions in areas where the law of large numbers does not take over. This is discussed further in Section 5.
Correlation between Pandemic and Traffic
- 3.3
- It is thought that the origin of SARS was Guangdong in China, and the
disease spread quickly from there to Hong Kong. Thus we consider
countries/regions which have strong relationships with China and Hong
Kong. At first we examine the numbers of travelers from China and Hong
Kong and consider the ten countries/regions where the number of
travelers to and from China and Hong Kong is the largest (see
Table 1), yielding a
total of 17 countries.
16 of these 17 countries/regions were infected by SARS. Since there
were 29 countries/regions in total with reported cases of SARS, half
of them are represented in this table. Besides these 16
countries/regions, there are 13 other countries infected by SARS;
Canada, France, India, Indonesia, Italy, Kuwait, New Zealand, Ireland,
Romania, South Africa, Spain, Sweden, Switzerland. We focus on these
30 countries/regions in our experiments. There are 8 countries/regions
which had local spread: China, Hong Kong, Taiwan, Canada, Singapore,
Vietnam, Philippines, and Mongolia. 7 of these 8 are included in
Table 1.
Table 1: Top 10 countries/regions in terms of number of travelers from/to China and Hong Kong in 2003 ((red: country with Local Infection, orange: country with only imported cases, white: country without local Infection or imported cases, Created based on (World Tourism Organization 2004a,World Tourism Organization 2004b)) To / From
China
To / From
Hong Kong
From / To
China
From / To
Hong Kong
Hong Kong
5,692,500
China
58,770,063
Hong Kong
58,770,063
China
5,692,500
Macao
1,431,294
Macao
1,218,648
Macao
18,757,267
Japan
563,300
Viet Nam
693,423
Thailand
649,920
Taiwan
2,731,897
United States
532,500
Russian Federation
679,608
Taiwan
287,312
Japan
2,254,800
Taiwan
407,100
Thailand
624,214
Japan
260,214
Korea, Republic of
1,945,484
United Kingdom
235,100
Singapore
568,510
Singapore
226,260
Russian Federation
1,380,650
Korea, Republic of
225,200
Korea, Republic of
513,236
Korea, Republic of
156,373
United States
822,511
Australia
196,900
Japan
448,782
Philippines
139,753
Philippines
457,725
Singapore
184,200
Malaysia
350,597
United Kingdom
131,000
Malaysia
430,137
Philippines
178,700
Germany
268,057
Australia
129,292
Mongolia
418,257
Macao
156,100
Correlation between Local Infection and Population Density
- 3.4
- We hypothesize that population density of an area is positively correlated with the local infection rate, because higher population densities lead to more frequent contact. We test this hypothesis using data from Chinese provinces, Hong Kong, and Taiwan, the most significant infected regions. Figure 3 shows how the number of infections in different Chinese provinces varied greatly at the peak of the infection (from (Nations Online Project 2010)), which makes it necessary to treat the individual regions separately. Since 97% of infections occur in 6 provinces, we use data from these 6. They are
Guangdong Province (the initial infected province), Beijing Municipality, Shanxi Province, Inner Mongolia Autonomous Region, Hebei Province, and Tianjin Municipality. Table 2 shows basic data on population and density for each of the provinces, Hong Kong, and Taiwan. Using these 6 provinces, Hong Kong, and Taiwan, we can reject the null hypothesis that there is no correlation between population density and infection rate at the 0.01
-level. Fitting C1 and C2 optimally is a
difficult problem because of the complex dependence of infection rates
on the multipliers. We manually tuned the parameters to provide a
reasonable fit to the infection data from very early on in the
infection cycle for different regions.
Table 2: Population, area, and population density in 6 provinces in mainland China, Hong Kong, and Taiwan (United Nations Population Division 2010a,United Nations Population Division 2010b,National Bureau of Statistics of China 2005) Population
Area (sq km)
Density (per sq km)
Beijing
17,422,637
16,801
1,037
Guangdong
83,079,300
177,900
467
Hebei
68,135,100
187,700
363
Hong Kong
6,708,940
1,108
6,055
Inner Mongolia
23,660,000
1,183,000
20
Shanxi
33,398,400
156,800
213
Taiwan
23,067,604
36,006
641
Tianjin
11,760,000
11,760
1,000
Passenger Traffic
- 3.5
-
Our initial simulations are focused on the 6 regions of China, Taiwan, and Hong Kong.
Table 3 shows the number of travelers among the three countries. However, it is difficult to estimate travel between the regions of China, or to allocate travelers from China to the other countries amongst the regions of China.
Table 3: Number of travelers between the three regions in 2003 (World Tourism Organization 2004a,World Tourism Organization 2004b) China
Hong Kong
Taiwan
China
-
5,692,500
N/A *1)
Hong Kong
58,770,063
-
287,312
Taiwan
2,731,897
407,100
-
In order to approximate this travel information, we use data on passenger land traffic and civil aviation in China in 2007. Table 4 shows the breakdown of total passenger traffic by type. We use land traffic data for the 6 provinces we are interested in, as shown in Table 5. We compute the share of each region in the total, where the total share is 100.
- 3.6
-
Then, based on Tables 4 and 5, we approximate the number of travelers between two regions by assuming that the share of a region is directly proportional to the number of travelers to the region. Also we assume that the share of passenger traffic by air is proportional to the share of passenger traffic by land.
Table 4: Total passenger traffic in China in 2007 (National Bureau of Statistics of China 2007) Railways
Highways
Waterways
Total of Land
Civil Aviation
Total
Passenger Traffic
135,670
2,050,680
22,835
2,209,185
18,576
2,227,761
Share in Total (%)
6.08997
92.0512
1.025
99.1662
0.83384
100
Table 5: Passenger traffic by region in China in 2007 (civil aviation traffic is not included, and we provide a detailed breakdown only for the six regions of interest) (National Bureau of Statistics of China 2007) Passengers (10,000 persons)
Share in National Total (%)
Beijing
16.189.990
0.7328
Tianjin
6,829.001
0.3091
Hebei
88,886.475
4.0235
Shanxi
43,866.023
1.9856
Inner Mongolia
38,677.933
1.7508
Guangdong
199,161.989
9.0152
Others
1,815,573.579
82.183
National Total
2,209,185
100
- 3.7
-
We estimate travel between the different regions of China, Hong Kong, and Taiwan by using the share of the airport of each region in China in the national total. Table 6 shows the number of passengers using the main airport in 6 regions of China and the share in the national total. We apportion the number of travelers between China and Hong Kong or Taiwan according to the share.
For example, the share of Beijing airport in the national total is 13.7859%. The number of travelers from China to Hong Kong is 5,692,500.
The number of travelers from Hong Kong to China is 58,770,063. Thus the total number of travelers between China and Hong Kong is 64,462,563.
The number of travelers between Beijing to Hong Kong is obtained as; 0.137859 ×
64,462,563 &asymp
8,886,700.
Table 6: Passengers passing through the main airport in 6 regions of China in 2007 (Civil Aviation Administration of China 2010) Passengers (10,000 persons)
Share in National Total (%)
Beijing
55,938,136
13.7859
Tianjin
4,637,299
1.1429
Hebei
1,043,688
0.2572
Shanxi
4,312,910
1.0629
Inner Mongolia
2,121,905
0.5229
Guangdong*
54,835,981
13.5143
Others
282,872,185
69.7139
National Total
405,762,104
100
*Including both Guangzhou airport and Shenzhen airport
Results
-
Results for China, Hong Kong, and Taiwan
- 4.1
-
For the preliminary experiment, we simulate with 6 regions in the
Chinese mainland, Hong Kong, and Taiwan. The number of susceptible
agents in each region/country is initially equal to the population
of each country. Table 7 shows
the summary for parameter values used in simulation. Note that these
parameters are in terms of simulation cycles, which do not exactly
correspond to real time. These simulation parameters were chosen to
provide a good fit to data from this initial simulation, but we
discuss below several inferences that can be made because many of
the parameters are constant, exploiting the granularity of the
model. Then, in the second part of this section, we use the same
parameters to extend the model to 30 countries/regions, which
provides a test for the parameters, allowing us to evaluate the
benefits and drawbacks in a validation setting.
Table 7: Parameter values in simulation Parameter
Value
Parameter
Value
PG
2.0 x 10⁻⁷
Densityi
See Table 2
Tij
See Table 8
DL
2.5 x 10⁻⁷
Run_cycle
100
Populationi
See Table 2
Incubation_period
10
C1
7.23 x 10⁻⁹
Infection_period
10
C2
7.69 x 10⁻⁶
PLi
Depends on Density, C1, and C2
DG
5.0 x 10 -9
- 4.2
-
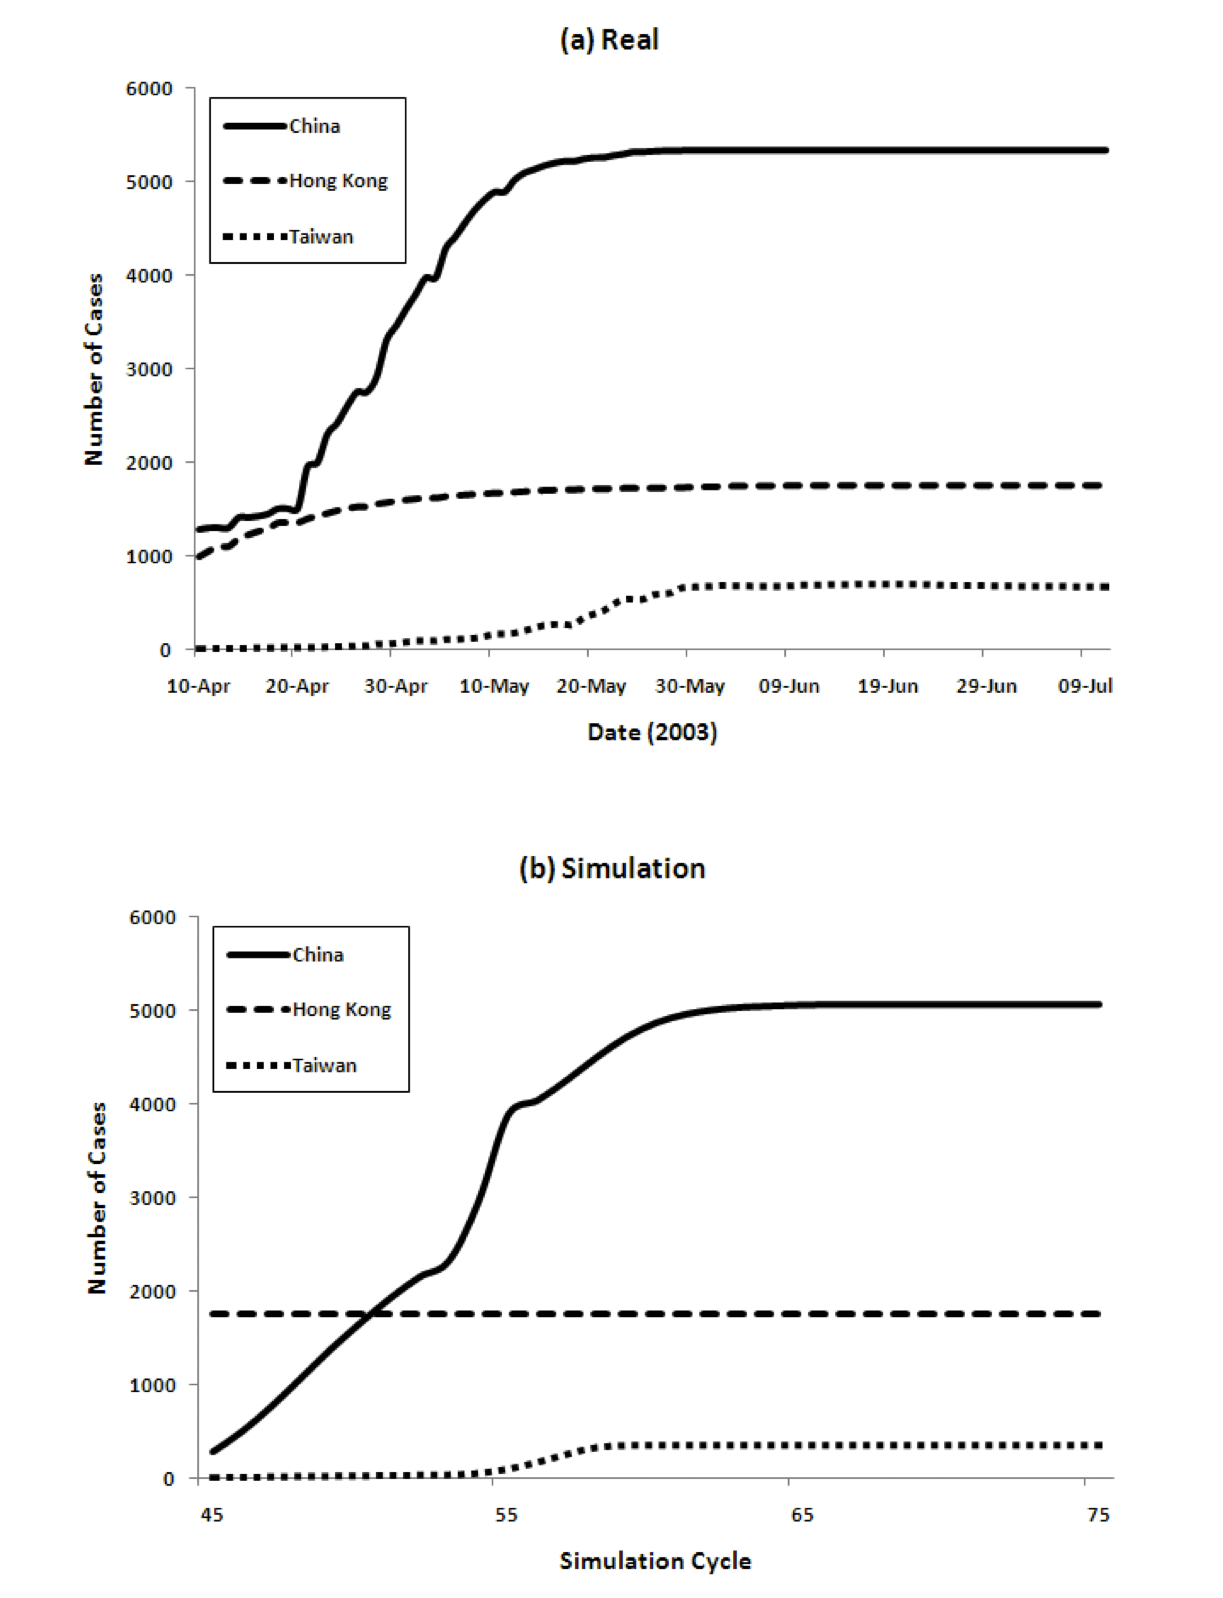
Figure 4 show the transition of the number of infected cases and the number of cumulative cases respectively, comparing real data and the results of our model. For the model we show data from time cycles 45 through 75. The results of China's 6 regions are summed up and the total is shown for China.
Figure 4: Three country model for dynamics of the spread of SARS (left) and the cumulative number of cases (right), comparing reality and model predictions 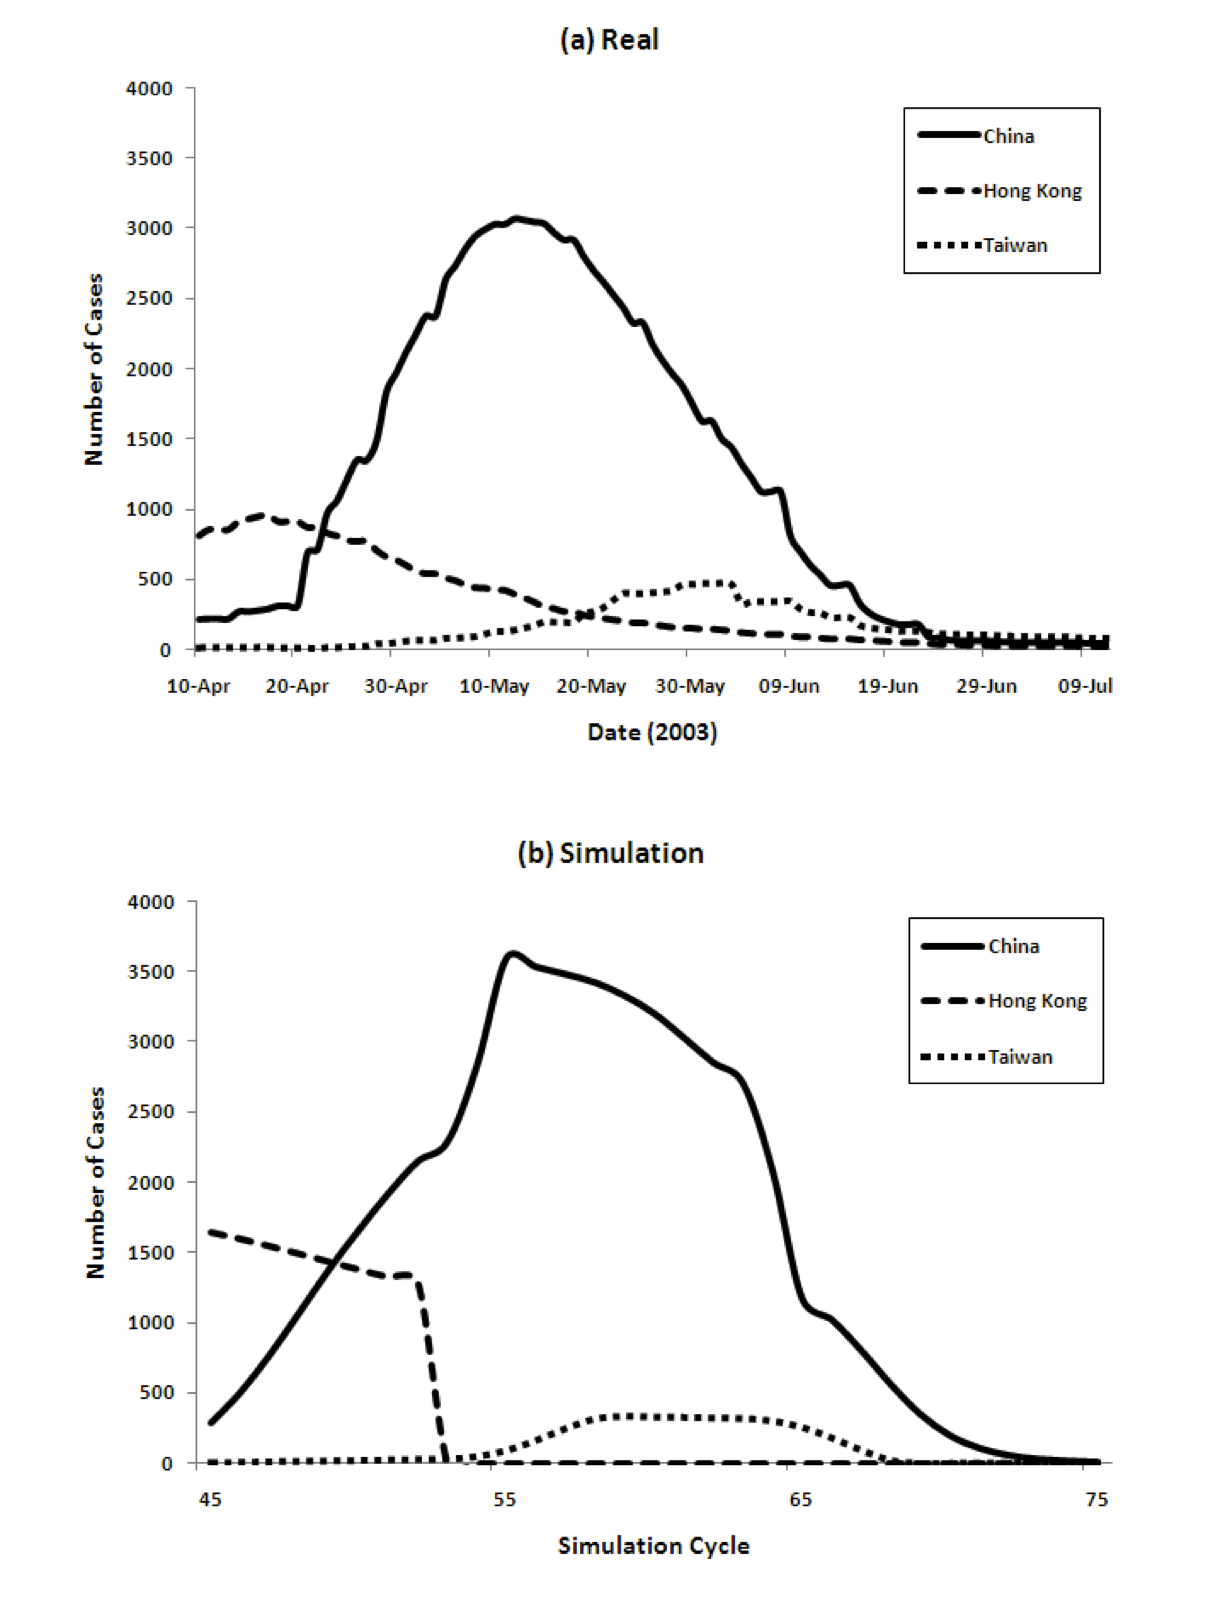
- 4.3
-
The figure shows that our model captures both the dynamics of the spread of SARS, as well as the total numbers, very well. The peaks come in order: Hong Kong, China, and Taiwan. The model achieves this without using any special parameters that vary in different countries.
Populations, densities, and travel data are all taken from the real world. The SARS epidemic started spreading from Hong Kong and immediately reached mainland China. The peak of Hong Kong comes earlier than that of China since the population density is higher. However, the curve decreases from some point because the percentage of susceptible agents in the population decreases and the percentage of Recovered agents increases. Then the number of Infectious agents decreases. After that, the number of infected agents in China increases. Because of its population, the number of infected agents at its peak in China is the largest among the three countries/regions. The peak in Taiwan is slightly delayed because of the time lag in the infection reaching Taiwan.
Region-wise Breakdown
- 4.4
-
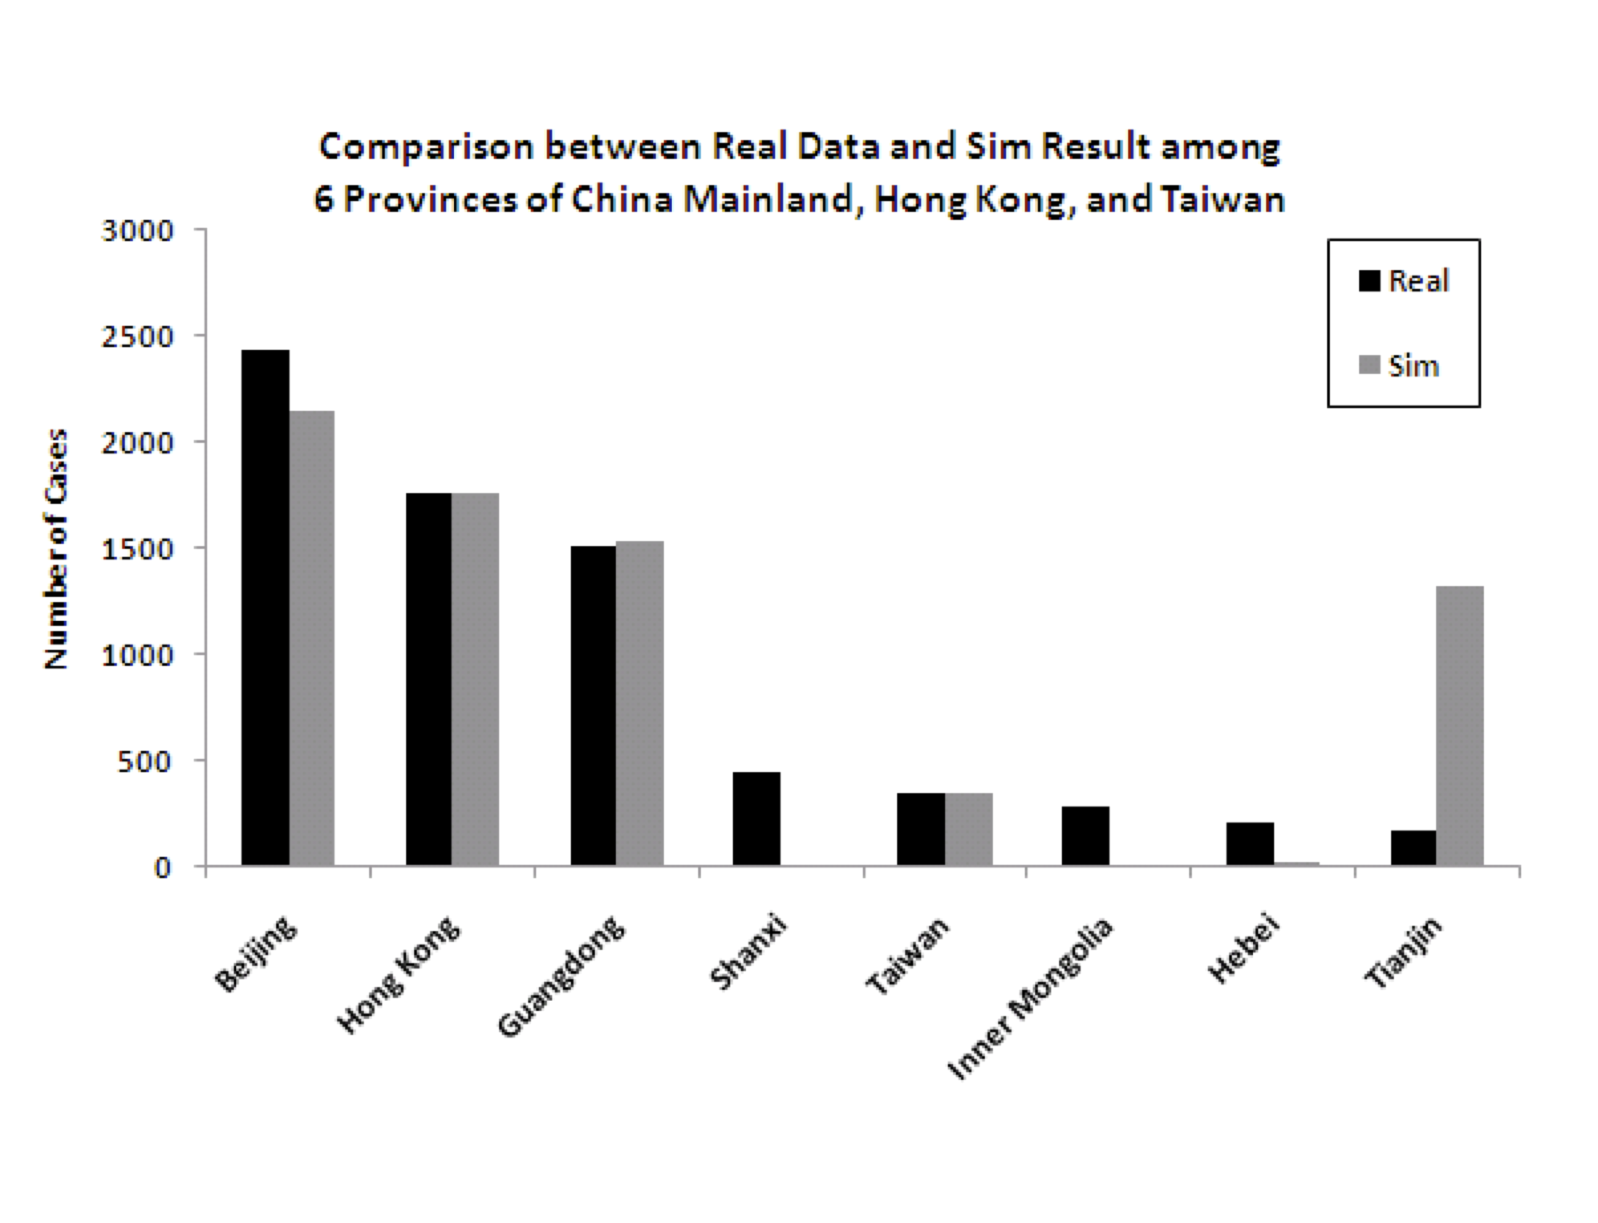
Figure 5 shows the
predicted (from the model) and actual number of cases for each of the
eight modeled regions. While the fit is good for several of the most
important (in terms of number of cases) regions, and therefore the
overall numbers are good, there are some discrepancies for some of the
regions that had relatively fewer cases. Specifically, the model
underpredicts the number of cases for some of the less densely
populated provinces of China (Shanxi, Inner Mongolia, and Hebei) and
overpredicts for one of the more densely populated regions
(Tianjin). There are idiosyncratic events associated with the spread
of any pandemic, so it is not entirely surprising that some of the
results do not match perfectly. The next section considers anomalies
in more detail, where some data is available. But it is important to
note that the level of granularity in modeling is very
important. Figure 6 shows the
difference in the model in two cases: one where the six infected
provinces in China are modeled independently, and one where the six
provinces are aggregated into one, using aggregated data on population
density, travel etc.
The figure clearly shows that the more granular model is a much better fit to the data.
Figure 6: Model predictions for total infection in China, Hong Kong and Taiwan when splitting the 6 infected provinces versus aggregating them into one for modeling 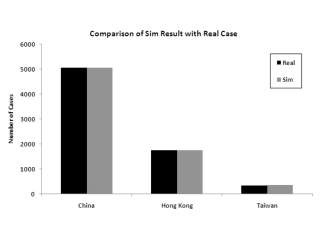
(a) Modeling the 6 provinces independently
(b) Modeling the 6 provinces as an aggregateModeling 30 Countries/Regions
- 4.5
-
As mentioned above, we use the parameters from the 8 region/country simulation to extend the model to 30 total countries (35 region/countries, since we continue to divide China into 6 regions). Again, we use real population, density, and international travel data from the 27 new countries (for Canada and Vietnam we use only Toronto and Hanoi, since only these regions had local spread cases (WHO Regional Office 2006)). Table 8 show the expected number of travelers between countries/regions.
We again apportion the number of travelers between each region in mainland China and other countries based on the share of each region.
Table 8: Expected number of travelers between countries/regions, 2004 (from (World Tourism Organization 2004a)(World Tourism Organization 2004b)) Origin Destination Beijing Tianjin Hebei Shanxi Inner Mongolia Guangdong Hong Kong Beijing 0 1,009,387 13,140,321 6,484,244 5,717,286 29,449,654 8,886,773 Tianjin 1,009,387 0 5,542,547 2,735,034 2,411,533 12,421,773 736,718 Hebei 13,140,321 5,542,547 0 35,604,996 31,393,629 161,708,110 165,808 Shanxi 6,484,244 2,735,034 35,604,996 0 15,491,550 79,796,745 685,183 Inner Mongolia 5,717,286 2,411,533 31,393,629 15,491,550 0 70,358,368 337,103 Guangdong 29,449,654 12,421,773 161,708,110 79,796,745 70,358,368 0 8,711,676 Hong Kong 8,886,773 736,718 165,808 685,183 337,103 8,711,676 0 Taiwan 376,618 31,222 7,027 29,038 14,286 369,197 694,412 Australia 58,114 4,818 1,084 4,481 2,204 56,969 326,192 Canada 42,295 3,506 789 3,261 1,604 41,462 233,432 France 127,391 10,561 2,377 9,822 4,832 124,881 64,800 Germany 67,562 5,601 1,261 5,209 2,563 66,231 88,100 India 33,121 2,746 618 2,554 1,256 32,468 114,770 Indonesia 37,595 3,117 701 2,899 1,426 36,855 205,328 Ireland, Republic of 1,746 145 33 135 66 1,712 0 Italy 26,404 2,189 493 2,036 1,002 25,884 571,866 Japan 372,714 30,898 6,954 28,737 14,138 365,371 823,514 Korea, Republic of 338,958 28,100 6,324 26,134 12,858 332,279 381,573 Kuwait 548 45 10 42 21 537 14 Macao 2,783,184 230,727 51,928 214,587 105,575 2,728,346 1,374,748 Malaysia 107,632 8,923 2,008 8,299 4,083 105,511 220,027 Mongolia 70,114 5,813 1,308 5,406 2,660 68,733 380 New Zealand 15,084 1,250 281 1,163 572 14,787 61,247 Philippines 67,519 5,597 1,260 5,206 2,561 66,188 318,453 Romania 2,345 194 44 181 89 2,299 0 Russian Federation 284,026 23,546 5,299 21,899 10,774 278,430 3,585 Singapore 130,496 10,818 2,435 10,061 4,950 127,924 410,460 South Africa 8,472 702 158 653 321 8,305 18,600 Spain 4,089 339 76 315 155 4,009 21,500 Sweden 6,899 572 129 532 262 6,763 0 Switzerland 11,890 986 222 917 451 11,655 45,642 Thailand 124,024 10,282 2,314 9,562 4,705 121,581 790,020 United Kingdom 49,123 4,072 917 3,787 1,863 48,155 366,100 United States 135,080 11,198 2,520 10,415 5,124 132,418 646,612 Vietnam 113,573 9,415 2,119 8,757 4,308 111,336 3,264
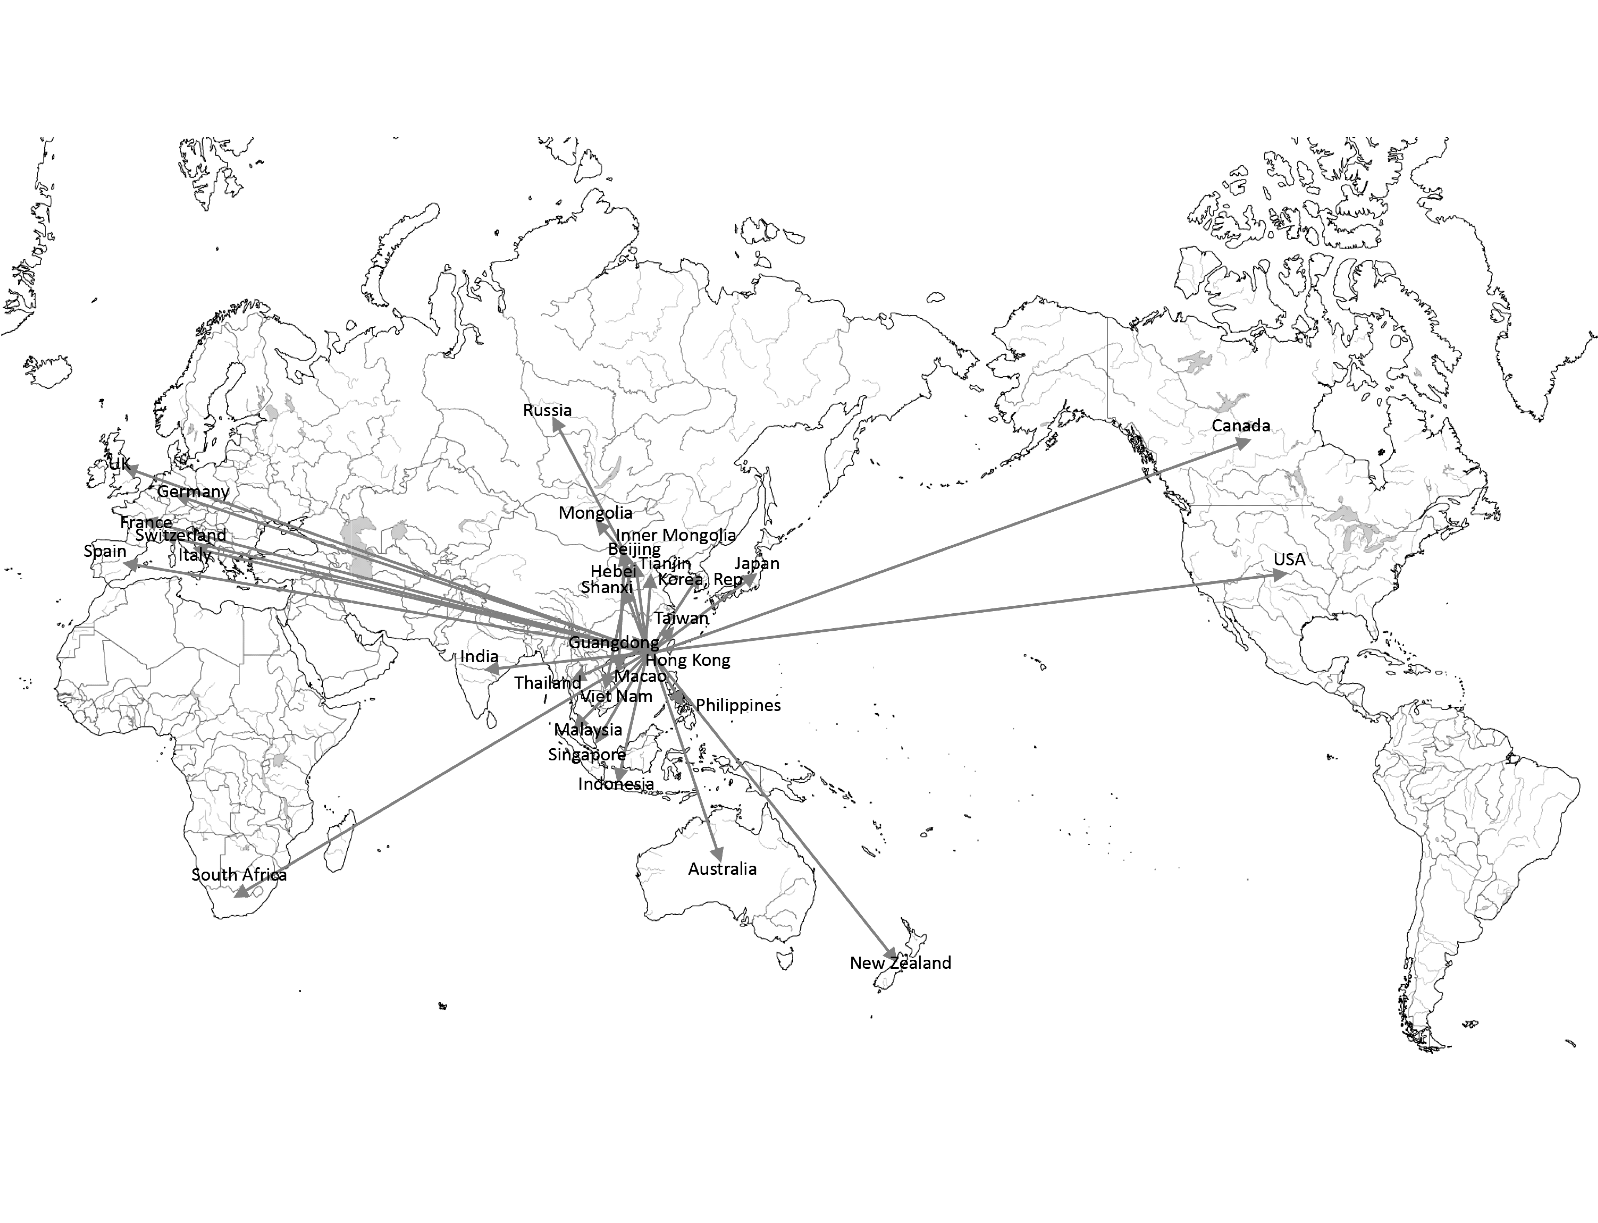
- 4.6
-
Figure 7 shows the infection route in our model. Most countries are infected from Hong Kong or Guangdong. Some countries are infected from other regions. For example, Vietnam, Mongolia, and Russia are infected from Beijing.
- 4.7
-
Figure 8 shows the comparison of the number of cumulative cases in simulation with real data. Especially for the significantly impacted countries, the number of cases corresponds well. In the real world, there were 8 countries/regions which had local spread. In the model, 18 countries/regions develop local spread. There are four true statistical outliers in the data in terms of number of cases predicted by the model versus number of cases experienced in reality. These are Singapore, Macao, Canada, and Japan.
Figure 8: Comparison of number of cumulative cases in 30 countries/regions ((a) Top 6 countries/regions, (b) 24 other countries/regions). Note the different Y axes. 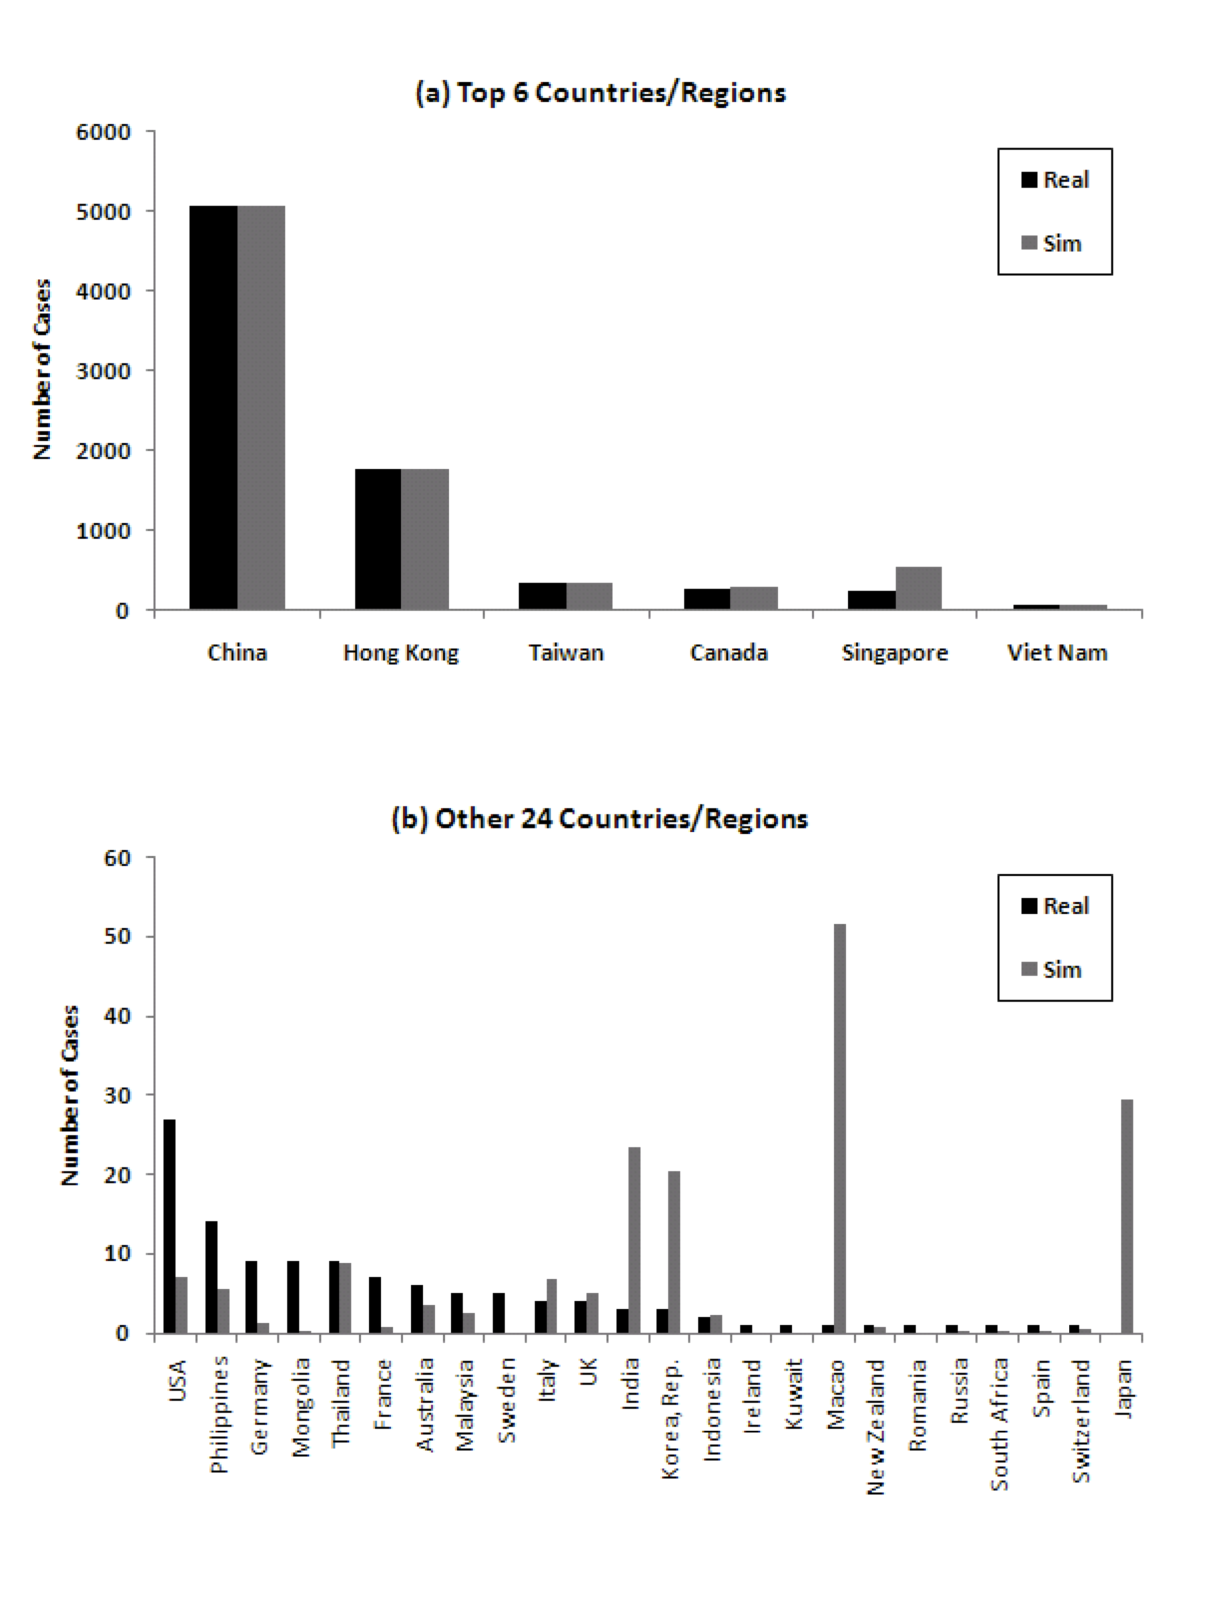
Discussion of anomalies
We hypothesize that the outliers in this case are related to the nature of the spread of SARS. An early, chance outbreak, in a country or region can lead to significantly more cases than expected. Similarly, if a country manages to avoid a case of SARS for longer than predicted by international travel data, heightened awareness and prevention strategies will lead to many fewer cases than expected. For SARS this factor may be particularly important, because there is considerable evidence that some people infected with SARS are “super spreaders” who may affect the trajectory of spread. While an infected person infects, on average, 1-3 people (Okada and Tashiro 2003), some infected people pass the virus to many other people (WHO Regional Office 2006). Although it is not clear what causes someone to become a super spreader, it is suspected that a person who has a chronic illness such as diabetes is more likely to be a super spreader (Okada and Tashiro 2003). The origin of SARS is a case in point. A physician became ill on February 15th 2003 after caring for patients who had developed a strange new form of pneumonia in Guangdong. He stayed at the Metropole Hotel in Hong Kong on February 21st. On March 4th, he died of what would later be called SARS. During his one-night stay at the Metropole Hotel, the SARS virus had passed to at least 15 other guests at the hotel. The virus then spread around the world, leading to outbreaks in other countries (WHO Regional Office 2006). - 4.8
-
In each of the outlier cases, where the model makes a significantly
different prediction than the actual trajectory of the pandemic, it
turns our that the first reported case happened at a different time
than would statistically be predicted by travel flows. While Macao,
Japan, and Republic of Korea have large numbers of travelers from/to
China and Hong Kong. these countries experienced much less infection
than predicted by the model. It turns out that each of these countries
experienced its first infection at a much later date than predicted,
as shown in Table 9. The Republic of
Korea first experienced an imported case on April 25th 2003 and Macao
on May 5th 2003. Japan was never infected. These countries imported
their first cases one or more months after Vietnam, Canada, Taiwan,
Singapore and the Philippines. Meanwhile, Canada, despite being less
strongly linked by travel to China and Hong Kong, was infected on
February 23rd, early in the pandemic (in fact, from the original
super-spread event at the Metropole Hotel).
Table 9: Infected countries/regions and the date of onset (red: country with local infection, orange: country with only imported cases) (WHO Regional Office 2006) Country
Date of onset: first probable case
Imported Cases
Total Cases
Percentage of Imported Cases
China
Nov 16 2002
NA
5327
NA
Hong Kong
Feb 15 2003
NA
1755
NA
Viet Nam
Feb 23
1
63
2
Canada
Feb 23
5
251
2
United States
Feb 24
27
27
100
Taiwan
Feb 25
21
346
6
Singapore
Feb 25
8
238
3
Philippines
Feb 25
7
14
50
Australia
Feb 26
6
6
100
Ireland, Republic of
Feb 27
1
1
100
United Kingdom
Mar 1
4
4
100
Germany
Mar 9
9
9
100
Switzerland
Mar 9
1
1
100
Thailand
Mar 11
9
9
100
Italy
Mar 12
4
4
100
Malaysia
Mar 14
5
5
100
Romania
Mar 19
1
1
100
France
Mar 21
7
7
100
Spain
Mar 26
1
1
100
Sweden
Mar 28
5
5
100
Mongolia
Mar 31
8
9
89
South Africa
April 3
1
1
100
Indonesia
April 6
2
2
100
Kuwait
April 9
1
1
100
New Zealand
April 20
1
1
100
Korea, Republic of
April 25
3
3
100
India
April 25
3
3
100
Macao
May 5
1
1
100
Russian Federation
May 5
1
1
100
- 4.9
-
To provide some more weight to this hypothesis, we ran the model, but this time using the actual time of first infection in the country rather than travel data. Other than that, the parameters of the simulation remained the same. Figure 9 shows that the cumulative number of cases from the model then correspond better to real data.
Figure 9: Comparison of number of cumulative cases in 30 countries/regions considering actual time of first infection ((a) Top 6 countries/regions, (b) 24 other countries/regions) 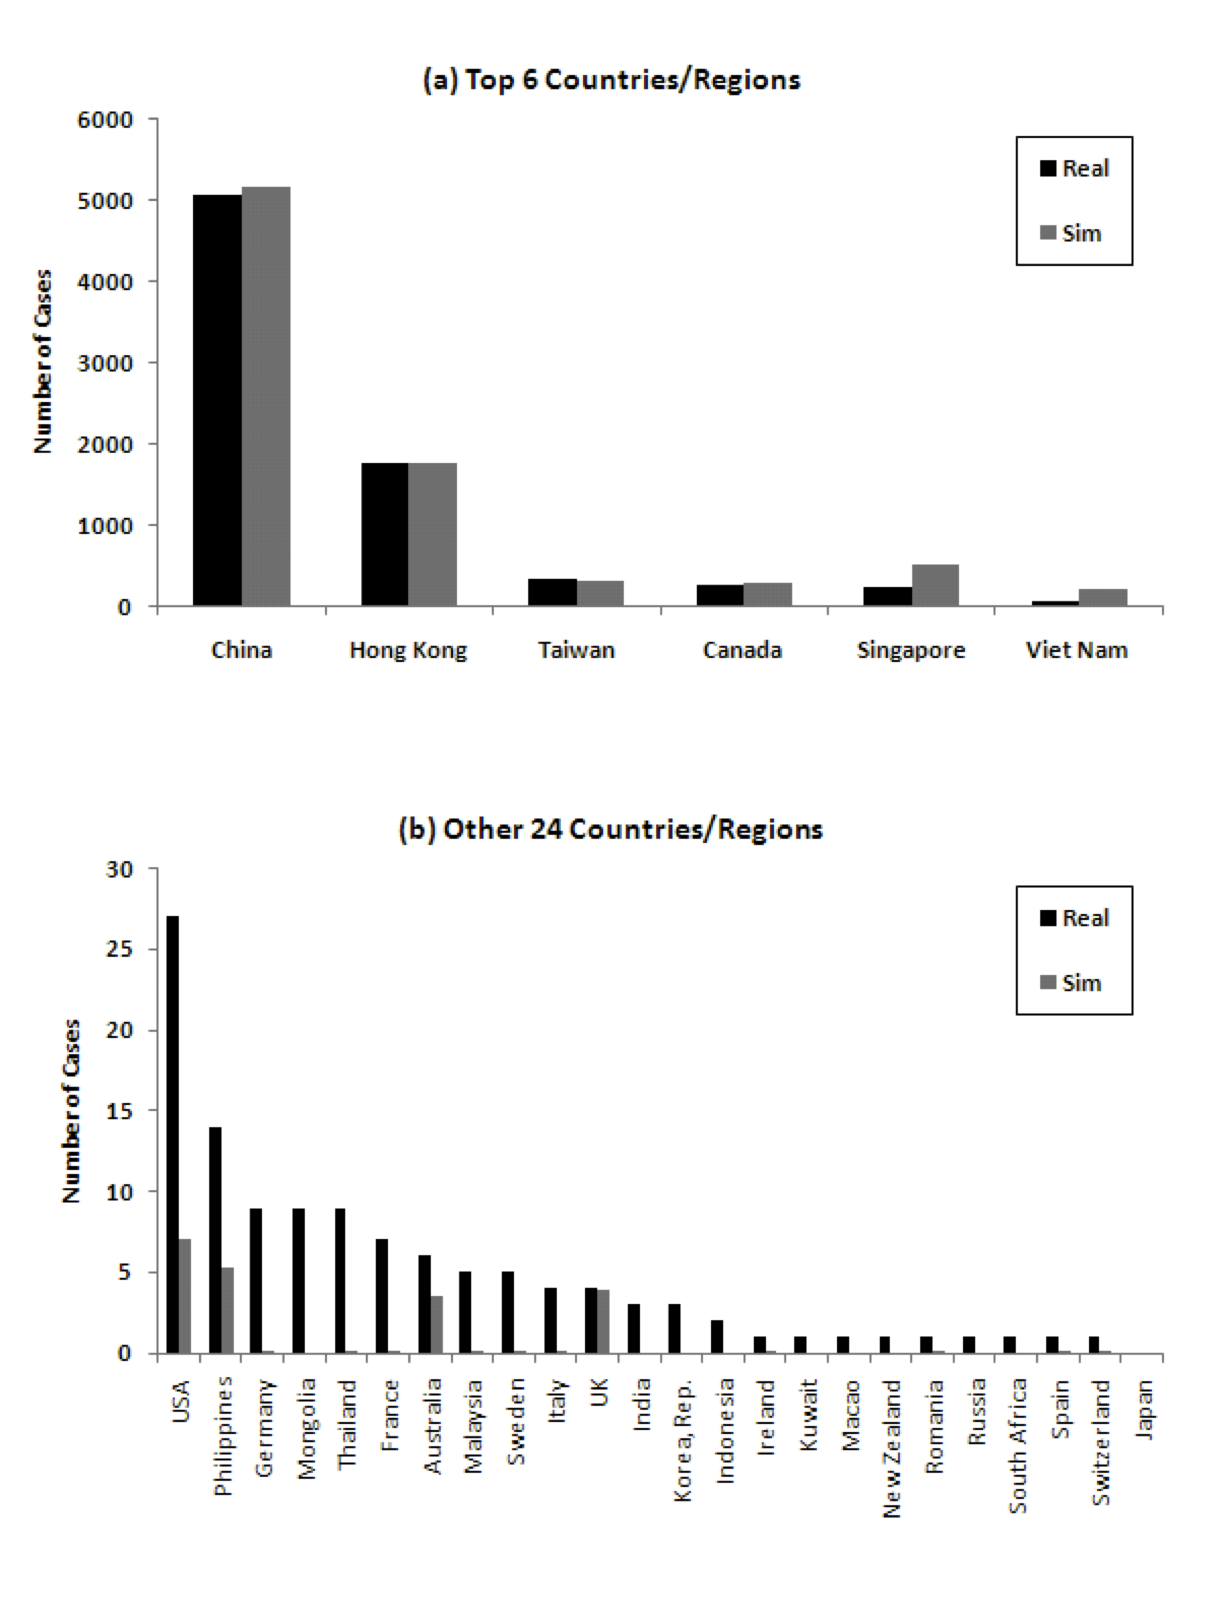
Local Considerations
- 4.10
-
Our model trades off adaptability to local conditions for a smaller number of parameters to fit. This can have several effects. Here we discuss two of them, and how they might affect the results. First, if we look at data from seasonal flu cases, we find that Canada typically has a large number of cases, and the United States has the largest number of influenza isolates (World Health Organization 2010). Both of these suggest that the local infection coefficient may be higher in Canada and the United States than other countries. Indeed, this could have been an additional factor in the surprisingly large number of Canadian cases. However, the United States was surprising, because, although it imported 27 cases, the infection did not spread locally. This may indicate that the quarantining and isolation measures employed worked effectively.
- 4.11
-
A second interesting point is that Singapore and Vietnam both report many fewer cases than predicted by the model. This may be partly explained by their lower propensity to spread infection, again as evidenced by seasonal flu data. There may also have been a significantly bigger push to hospitalize and keep patients confined, weakly evidenced by the fact that the proportion of those infected who were healthcare workers in these two countries (41% and 57% in Singapore and Vietnam respectively) was much higher than other countries (21%).
Discussion
- 5.1
- We have discussed a hybrid network and local model for the spread of pandemics, and applied it to the case of SARS. When parameters are calibrated to real data on populations, densities, and traffic, we show that the model reproduces many of the key dynamics of the spread of SARS in 2002 and 2003, while remaining parsimonious, and therefore useful for understanding the root causes of why pandemics spread in the way they do. Both the successes and the failures of the simple model provide insights into pandemic spread. For example, it is clear that it is important to model international traffic to understand the pathways of spread. At the same time, for any particular pandemic, individual idiosyncrasies can come into play. For example, the importance of super-spreaders in SARS is reflected in the fact that the time of first infection in a country plays a big role in how many people get infected. The other major takeaway from this work is that the level of granularity in the network structure of the model has a significant impact. For example, treating China as one large entity leads to poorer prediction, but at the same time specializing all the way down to cities would end up requiring too much data to accurately calibrate the model, without significantly improving the predictivity of the model.
- 5.2
-
Our model is quite general. It should be applicable without major
changes to many different countries or regions, and even to
different granularities of population centers, like cities. It
should also apply to epidemics with different properties than
SARS. We also believe that the idea of using hybrid network-based
simulation models has great potential in interventional settings,
because it is easy to experiment with how changing certain
parameters like traffic flow between different parts of the network,
affects the global outcomes for different types of epidemic phenomena.
Notes
- A Java framework for our simulation, along with instructions for how to use it, can be found at http://www.cs.rpi.edu/~moorthy/SARS-Program/.
Acknowledgements
- Yoneyama was supported by a fellowship from the Yamada Corporation. Das acknowledges support from the National Science Foundation under a CAREER award (IIS-0952918). We would like to thank the referees for useful comments.
References
-
BAILEY N.T.J. (1965) "The Simulation of Stochastic Epidemics in Two Dimensions". Proc. 5th Berkeley Symp. on Math. Statist. and Prob 4, 237–257.BOGUNÁ M., Pastor-Satorras R., and Vespignani A. (2003) "Absence of epidemic threshold in scale-free networks with degree correlations". Physical Review Letters 90(2):28701.[doi:10.1103/physrevlett.90.028701]CAPASSO V. (1993) Mathematical Structures of Epidemic Systems. Springer Verlag.CARLEY K., Fridsma D., Casman E., Altman N., Chang J., Kaminsky B., Nave D., and Yahja A. (2003) "BioWar: scalable multi-agent social and epidemiological simulation of bioterrorism events". NAACSOS conference proceedings 2003.CARRAT F., Luong J., Lao H., Sallé A.V., Lajaunie C., and Wackernagel H. (2006) "A small-world-like model for comparing interventions aimed at preventing and controlling influenza pandemics". BMC Medicine 4(1):26, 2006.[doi:10.1186/1741-7015-4-26]CHOWELL G., Ammon C.E., Hengartner N.W., and Hyman J.M. (2006) "Transmission dynamics of the great influenza pandemic of 1918 in Geneva, Switzerland: Assessing the effects of hypothetical interventions". Journal of Theoretical Biology 241(2):193–204.[doi:10.1016/j.jtbi.2005.11.026]CIVIL AVIATION ADMINISTRATION of China. http://www.caac.gov.cn/.COLIZZA V., Barrat A., Barthelemy M., Valleron A., and Vespignani A. (2007) "Modeling the worldwide spread of pandemic influenza: Baseline case and containment interventions". PLoS Medicine 4(1):95.[doi:10.1371/journal.pmed.0040013]COOPER B.S., Pitman R.J., Edmunds W.J., and Gay N.J. (2006) "Delaying the international spread of pandemic influenza". PLoS Med 3(6):e212.[doi:10.1371/journal.pmed.0030212]DEGUCHI H., Kanatani Y., Kaneda T., Koyama Y., Ichikawa M., and Tanuma H. (2006) "Anti Pandemic Simulation by SOARS". SICE-ICASE International Joint Conference 2006 pages 18–21.[doi:10.1109/sice.2006.315130]DEGUCHI H., Kanatani Y., Kaneda T., Koyama Y., Ichikawa M., and Tanuma H. (2006) "Simulation Design for Pandemic Protection". The First World Congress on Social Simulation Proceeding volume 1, pages 21–28, 2006.EPSTEIN J.M., Cummings D.A.T., and Chakravarty S. (2004) "Toward a Containment Strategy for Smallpox Bioterror: An Individual-Based Computational Approach". Brookings Inst ..EUBANK S. (2002) "Scalable, efficient epidemiological simulation". Proceedings of the 2002 ACM Symposium on Applied Computing page 145. ACM,.FERGUSON N.M., Cummings D.A.T., Fraser C., Cajka J.C., Cooley P.C., and Burke D.S. (2006) "Strategies for mitigating an influenza pandemic". Nature 442(7101):448–452.[doi:10.1038/nature04795]FLAHAULT A., Vergu E., Coudeville L., and Grais R.F. (2006) "Strategies for containing a global influenza pandemic". Vaccine 24(44-46):6751–6755.[doi:10.1016/j.vaccine.2006.05.079]GERMANN T.C., Kadau K., Longini I.M., and Macken C.A. (2006) "Mitigation strategies for pandemic influenza in the United States". Proceedings of the National Academy of Sciences 103:5935–5940.[doi:10.1073/pnas.0601266103]GLASS R.J., Glass L.M., Beyeler W.E., and Min H.J. (2006) "Targeted social distancing design for pandemic influenza". Emerg Infect Dis 12(11):1671–1681.[doi:10.3201/eid1211.060255]HETHCOTE H.W. and Tudor D.W. (1980) "Integral equation models for endemic infectious diseases". Journal of Mathematical Biology 9(1):37–47.[doi:10.1007/BF00276034]HUANG C.Y., Sun C.T., Hsieh J.L., and Lin H. (2004) "Simulating SARS: Small-world epidemiological modeling and public health policy assessments". Journal of Artificial Societies and Social Simulation 7(4), 2. https://www.jasss.org/7/4/2.htmlJENVALD J., Morin M., Timpka T., and Eriksson H. (2007) "Simulation as decision support in pandemic influenza preparedness and response". Proceedings ISCRAM2007 2007.KELSO J.K., Milne G.J., and Kelly H. (2009) "Simulation suggests that rapid activation of social distancing can arrest epidemic development due to a novel strain of influenza". BMC Public Health 9(1):117, 2009.[doi:10.1186/1471-2458-9-117]LI Y., Huang X., Yu I.T.S., Wong T.W., and Qian H. (2004) "Role of air distribution in SARS transmission during the largest nosocomial outbreak in Hong Kong". Indoor Air 15(2):83–95.LONGINI Jr I.M., Halloran M.E., Nizam A., and Yang Y. (2004) "Containing pandemic influenza with antiviral agents". American Journal of Epidemiology 159(7):623.[doi:10.1093/aje/kwh092]LONGINI Jr I.M., Nizam A., Xu S., Ungchusak K., Hanshaoworakul W., Cummings D.A.T., and Halloran M.E. (2005) "Containing pandemic influenza at the source". Science 309(5737):1083.[doi:10.1126/science.1115717]MASSAD E., Burattini M.N., Coutinho F.A.B., and Lopez L.F. (2006) "The 1918 influenza A epidemic in the city of Sao Paulo, Brazil". Medical hypotheses 68(2):442–445.[doi:10.1016/j.mehy.2006.07.041]MILNE G.J., Kelso J.K., Kelly H.A., Huband S.T., and McVernon J. (2008) "A small community model for the transmission of infectious diseases: comparison of school closure as an intervention in individual-based models of an influenza pandemic". PLoS One 3(12), 2008.[doi:10.1371/journal.pone.0004005]MORENO Y., Pastor-Satorras R., and Vespignani A. (2002) "Epidemic outbreaks in complex heterogeneous networks". The European Physical Journal B-Condensed Matter and Complex Systems 26(4):521–529, 2002.[doi:10.1140/epjb/e20020122]National Bureau of Statistics of China. (2005) "China Statistical Yearbook 2005". http://www.stats.gov.cn/.National Bureau of Statistics of China. (2007) "China Statistical Yearbook 2007". http://www.stats.gov.cn/.Nations Online Project. http://www.nationsonline.org/oneworld/china_sars_map.htm.OKADA H. and Tashiro M. (2003) "Fight against Infectious Diseases: Influenza and SARS". Iwanami-Shinsho.PASTOR-SATORRAS R. and Vespignani A. (2001) "Epidemic dynamics and endemic states in complex networks". Physical Review E 63(6):66117.[doi:10.1103/physreve.63.066117]PASTOR-SATORRAS R. and Vespignani A. (2001) "Epidemic spreading in scale-free networks". Physical Review Letters 86(14):3200–3203.[doi:10.1103/PhysRevLett.86.3200]PASTOR-SATORRAS R. and Vespignani A. (2002) "Epidemic dynamics in finite size scale-free networks". Physical Review E 65(3):35108, 2002.[doi:10.1103/physreve.65.035108]PASTOR-SATORRAS R. and Vespignani A. (2002)"Immunization of complex networks". Physical Review E 65(3):36104.[doi:10.1103/physreve.65.036104]PATEL R., Longini I.M., et al. (2004) "Finding optimal vaccination strategies for pandemic influenza using genetic algorithms". Journal of Theoretical Biology 234(2):201–212, 2005.[doi:10.1016/j.jtbi.2004.11.032]United Nations, Population Division. "World Population Prospects: Population Database". http://esa.un.org/wpp/unpp/panel_population.htm.United Nations, Statistics Division. "Demographic Yearbook System: Demographic Yearbook". http://unstats.un.org/unsd/demographic/products/dyb/dyb2.htm.University of Hong Kong. "Information on SARS". http://www.hku.hk/sars/medical-info/incubation.html.WEYCKER D., Edelsberg J., Halloran M.E., Longini I.M., et al. (2004) "Population-wide benefits of routine vaccination of children against influenza". Vaccine 23(10):1284–1293.[doi:10.1016/j.vaccine.2004.08.044]Wolfram Mathworld. "Kermack-McKendrick Model". http://mathworld.wolfram.com/Kermack-McKendrickModel.html.World Health Organization. "Global Health Atlas ". http://tinyurl.com/y8ojdhy.World Health Organization. "Cumulative Number of Reported Probable Cases of SARS". http://www.who.int/csr/sars/country/en/.World Health Organization. "Summary of Probable SARS Cases with Onset of Illness from 1 November 2002 to 31 July 2003". http://www.who.int/csr/sars/country/table2004_04_21/en/.World Health Organization. "SARS Map: Cumulative Number of Reported Cases". http://www.who.int/csr/sars/SARS2003_4_8.jpg.World Health Organization Regional Office Office for the Western Pacific. (2006) "SARS: How a Global Epidemic Was Stopped". WHO Regional Office for the Western Pacific 2006.World Tourism Organization. (2004) "Compendium of Tourism Statistics". 2004.World Tourism Organization. (2004) "Yearbook of Tourism Statistics". 2004.YAMAMOTO T. (2006) "Novel Influenza: The Day the World Trembles". Iwanami-Shinsho 2006.ZHANG J., Lou J., Ma Z., and Wu J. (2005) "A compartmental model for the analysis of SARS transmission patterns and outbreak control measures in China". Applied Mathematics and Computation 162(2):909–924. [doi:10.1016/j.amc.2003.12.131]