
 Abstract
- A computational model for the development of social relationships is described. The model implements agent strategies for social interaction based on Dunbar's Social Brain Hypothesis (SBH). A trust related process controls the formation and decay of relationships as a function of interaction frequency, the history of interaction, and the agents' strategies. A good fit the SBH predictions was found across a range of model parameter settings, which varied the waning rate of trust, defect/cooperation rates for agents, and linear/log functions for trust increase and decay. Social interaction strategies which favour interacting with existing strong ties or a time variant strategy produced more SBH conformant results than strategies favour more weaker relationships. The prospects for modeling the emergence of social relationships are discussed.
- Keywords:
- Social Agents, Social Modelling, Trust, Social Networks
Introduction
- 1.1
- Numerous computational models of social behaviour have been developed that focus on cooperation and the evolution of altruism (Nowak & Sigmund 2005, Janssen 2006); and on swarm intelligence and coordination in social behaviour (Bonabeau et al. 1999). However, models of the cognitive processes underlying social behaviour are less common. Social network models embed agents with limited causal theories for their behaviour, although these are usually encoded as rules, reasoning over agents' states and attributes (Gilbert & Triotzsch 2005). In this paper we extend the genre of social network models by investigating how a causal mechanism of trust can lead to the formation and maintenance of social relationships.
- 1.2
- The focus of this modelling is to explore the causal processes underlying Dunbar's Social Brain Hypothesis (Dunbar 1996, 1998), which is an evolutionary social psychological theory that proposes that humans form relationships with different levels of intensity from very best friends to close and then casual friends. Dunbar's theory rests on a cross-species comparison using behaviour and paleontological evidence to hypothesise how complex social structures of friendships arose in social mammals, primates and man (Dunbar 1993, 2008). It does not, however, give any current-day, cognitive account about why social structures emerge from human behaviour. This paper explores that gap.
- 1.3
- The Social Brain Hypothesis (SBH: Dunbar 1996, 1998) is an exemplar evolutionary psychology theory, since it synthesises evidence from the fossil record with studies of current human social behaviour within a primate-wide cognitive context (Dunbar 1993). Based on a general relationship for social group size and brain volume in primates, SBH predicts a typical group (or community) size for humans of 150 individuals (Dunbar 1996).
- 1.4
- Different intimacy levels emerge from the fact that social time is inevitably limited (Lu et al. 2009), creating a selection pressure that might favour individuals focusing their social interactions on a few more intense relationships at the expense of many, more diffuse ones. In humans, the innermost two layers have been identified as the support clique (Dunbar & Spoors 1995, Dunbar & Stiller 2007) and the sympathy group (Buys & Larson 1979, Dunbar & Stiller 2007), followed by an affinity group of 50 and an active network of 150 individuals. These groupings have been shown to represent natural disjunctions in both the level of intimacy between ego and alter and the frequency with which they interact (Hill & Dunbar 2003, Roberts et al. 2009).
- 1.5
- If the tenets of SBH are true, evolution should have produced a predisposition towards structuring human relationships in layers of decreasing intimacy. Furthermore, it must be acting through a cognitive mechanism that might generate such a distribution of relationships within an individual's lifetime. We argue that trust provides a suitable candidate mechanism, since trust in a cornerstone in friendships and the formation of relationships. Dunbar's Social Brain Hypothesis is a leading evolutionary psychological theory explaining the evolution of human social structure. The social layers of increasing intimacy hypothesis is also supported by the literature in the psychology of friendship (Hays 1989, Wellman et al 2006); however, no mechanism describing how such layers might arise has been proposed. Since trust has been implicated in development of cooperation and social relationships (Ostrom 2002), this motivated the social trust simulation reported in this paper.
- 1.6
- In this paper we explore the formation of trust in relationships as a candidate mechanism since trust has been acknowledged as a major influence on the strength of friendship (Hays 1985, Ostrom 2002, Oswald et al. 2004). The focus is on modelling the development of relationships in ego networks rather than complete social networks. First, a model of trust formation in relationships is proposed. This is then implemented in software to test the assumptions underlying the model and investigate the conditions under which trust might create relationships at different levels of intensity. The paper concludes with a discussion of the computational trust model as a mechanism for studying social relationship formation and regulation.
Trust as a Mechanism for Social Relationships
- 2.1
- Theories and studies of human friendship (Brown & Brown 2006, Hays 1985, Oswald et al. 2004) note the importance of reciprocity and the exchange of benevolent acts in building social relationships and, implicitly, trust. Empirical studies of friendship (Hays 1985, 1989, Oswald et al. 2004) point to the advantage of investing in fewer, more intimate relationships. When collaborations persist in groups, mutual trust will develop between individuals, leading to reliance on each other for help, emotional support and companionship (Baumeister & Leary 1995).
- 2.2
- McCabe (2002) argued that trust evolved to enhance collaboration through improved ability to assess trustworthiness and detect deceit in social interactions. Communication certainly increases cooperation and trust in social dilemma games (Cook & Cooper 2002, Ostrom 2002). As more evidence accrues through repeated interaction, trust may change from 'calculative mode' in which an individual's trustworthiness is assessed on limited evidence to relational trust based on social experience.
- 2.3
- Computer simulations of repeated prisoner's dilemma games have demonstrated that cooperative strategies will spread in populations when histories of interactions are accessible (Nowak & Sigmund 2005). Furthermore, Roberts and Renwick (2003) demonstrated in both experimental studies and computer simulations of indirect reciprocity that the reputation of actors based on histories of collaboration is important for relationship formation and encourages the spread of cooperative strategies. However simulations of cooperative behaviour do not account for the development of social relationships that apply across of range of interactions in extended time periods.
- 2.4
- We propose that trust not only facilitates collaboration but also underpins the formation and maintenance of social relationships. Trust may give rise to SBH relationship layers via an affect component that reinforces attachment in relationships. If individuals interact socially and collaborate over an extended period of time, the level of mutual trust should increase to the stage where emotion (i.e. pleasure in the alter's company) becomes more important than the rewards of collaboration. The interaction between trust and relationships is summarised in Figure 1, showing three hypothetical scenarios of trust formation for each SBH relationship type, assuming different distributions of social interaction. The upper line (strong ties) shows trust developing to a plateau as the law of diminishing returns applies. In Figure 1, crosses indicate non-cooperative behaviour by the alter agent, and strong ties are relatively immune to such events, modelling the intuition of forgiving the transgression of best friends. Trust between the focal agent and the alter agent is decreased by non-cooperative behaviour; however, this effect is modulated by a log function. The second line for medium ties does not reach the level of deep trust, hence trust is influenced more strongly by negative and positive interactions, as illustrated by the sine wave perturbations.
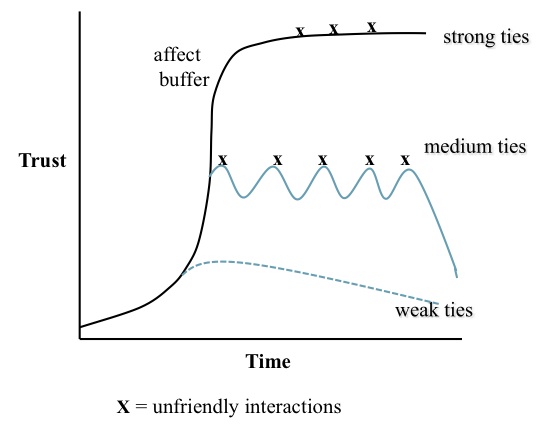
Figure 1. Development and decay of trust over time, illustrating strong, medium and weak tie scenarios with different rates of interaction and decay from neglect and/or non-cooperative responses - 2.5
- The strong ties trajectory assumes that many social interactions in a relatively short time period increases trust and intimacy. Intimate relationships pass through an affect threshold whereby relationship maintenance is governed by emotion/pleasure in the alter's company; hence, less cognitive resource needs to be devoted to relationship maintenance. These strong ties may be more resistant to non-cooperative responses, reflecting the intuition that best friends/partners are given the benefit of the doubt when interpreting non-cooperative responses. However, if non-cooperative events from the alter persist, or no cooperative interactions reinforce the relationship, even strong ties will decay.
- 2.6
- In the medium ties scenario, there are fewer cooperative interactions, or interactions are spread over a longer time period, hence trust develops at a lower level and does not reach the affect threshold. Medium ties will therefore be more susceptible to defect responses, illustrated by the sine wave time-course showing conflicting influences of cooperative and non-cooperative behaviour by the alter. As with strong ties, if interaction ceases or non-cooperative responses continue, the relationship will wane.
- 2.7
- Finally, weak ties assume a low level of interaction, and similar susceptibility to negative interactions; however, given the low level of trust the effect of lack of reinforcement or non-cooperative response is termination of the relationship.
- 2.8
- All relationships need positive interactions for maintenance, and we propose that the ties will show different time-dependent decay rates. Deep trust may be limited to a small number of individuals because of the high investment cost in relationship formation and, more importantly, the danger of diluting attention and devaluing trust. Devoting too much attention elsewhere would engender mistrust.
- 2.9
- If relationships do not pass the affect threshold into deep trust, they may, as a result, have a higher probability of decay. These medium tie relationships may be more susceptible to disruption and less stable; furthermore, if they are more fluid the chance of conflict between alters increases.
- 2.10
- The number and intimacy level of relationships should be governed by the distribution of interaction among alters and constraints on an individual's social time budget. More time has to be devoted to maintaining strong tie relationships to keep them proximal as well as committed, and this leaves a finite resource for other relationships. While medium and weak tie relationships can be maintained by lower interaction frequencies, over-dilution of social attention among alters runs the risk of losing trust by favouring others and exacerbating the cognitive load of social management. The relationship between interaction frequency and relationship strength has been established by Hays (1989) who compared close and casual friendships and found that close friendships showed more interactions during the week, and across a wider range of days, times and locations than casual friendships. Furthermore, the frequency of contact, both face to face and by electronic communication, has been correlated with rating of emotional closeness among friends (Wellman et al 2006, Rose & Serafica 1986); and when contact frequencies decreased due to separation, relationship closeness also declined (Roberts & Dunbar 2011b). Therefore there are reasonable grounds for proposing trust related to frequency of interaction as a process for relationship development.
Computer Model of Trust
- 3.1
- We implemented a computational model to articulate the theory as well as to create an experimental artefact that could be used to test some of the assumption and axioms within the trust model and its relationship to SBH. The model was based on computational simulation of cooperative interaction with trust reputation mechanisms (Nowak & Sigmund 2005).
- 3.2
- The main components of the model are:
- Agents who interact and form trusting relationships. Frequency of interaction is equated with strength of relationships and trust, following empirical observations (Rose & Serafica 1986, Roberts & Dunbar 2011b).
- Responding agents may choose to accept or reject an initiation, hence interactions may have positive or negative results.
- Trust accumulates for positive interactions, and is decreased by negative interactions.
- Agents have a memory of previous interactions with other agents.
- Agents have preference strategies for initiating social interaction according to the history of previous successful interaction.
- Increase in trust is controlled by smoothing algorithms to implement theory assertions that high-trust relationships exhibit different behaviour from low-trust relationships.
- Trust in relationships wanes over time at a slow rate independent of any interactions. This models the empirical observation that relationship strength declines unless it is maintained by social interaction (Roberts & Dunbar in press (b)), Wellman et al. 2001, 2006).
- 3.3
- Each agent within the population is assigned a turn, so there is an equal opportunity to interact. Initially the other agent is selected at random. However, once a history of interactions develops, the focal agent's choice of the other (or alter) agent is governed by a history-dependent response algorithm which selectively initiates interaction according to the agents' strategy.
- 3.4
- Trust accumulates from successive interactions between any two agents. The trust value is incremented by one unit for each cooperative interaction between A and B. Trust is an attribute of the relationship, which is a direct arc between any two agent nodes (A→B, B→A), so reciprocal trust can be modelled. Initially trust increases linearly in proportion to the number of cooperative interactions with the responding agent. However, to model the empirical observation that trust reaches an asymptote in human relationship when it switches from calculative to emotion mode (Ostrom 2002), a law of diminishing returns is implemented so that as trust in a relationship increases, a log ratio algorithm is applied; the rate of increase progressively decreases as the value of trust rises. Since the log algorithm applies to negative as well as positive interaction, high-trust relationships are relatively immune to defections. This models the intuition that people forgive alters' indiscretions in high-trust relationships.
- 3.5
- The formula for log trust increase (large increase when the trust value is small, and small increase when the trust value is large), uses four parameters:
- Max_trust
- Max_compression_ratio (MaxCR)
- Min_compression_ratio (MinCR) and
- Compression_interval (CI).
- 3.6
- MaxCR is the maximum trust increase when the trust value equals zero and MinCR is the minimum trust increase when the trust value equals max_trust. Compression_interval (CI) is the range on the trust scale used to modify trust increase. The compression_interval is defined as:
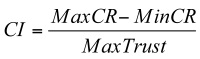
(1) - 3.7
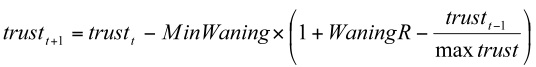
- Based on Equation (1), the trust increase at time (t+1) is defined as:
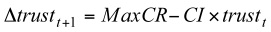
(2) And,
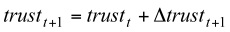
(3) - 3.8
- From Equation (2), we see the increase of trust Δtrustt+1 decreases with the value of current trust. By doing this, we realise a log trust increase.
- 3.9
- In our experiments, we set MaxCR=10, MinCR=0, and MaxTrust=100. This produces:
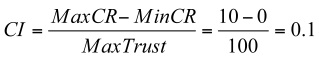
according to Equation (1).
Applying Equations (2) and (3), we have

(4) From Equation (4), we see, if trustt = 0, then Δtrustt+1 = 10 and trustt+1 = 10; if trust at time t has the maximum value, then trustt = 100, Δtrustt+1 = 0 and trustt+1 = 100.
Trust waning
- 3.10
- Empirical studies indicate that all relationships decay over time if the participants do not interact, although the rate of decay may vary according to the level of closeness (Roberts & Dunbar 2011b), Wellman et al. 2001, 2006). Hence trust in a relationship is assumed to require periodic maintenance but strong ties tend to persist longer even without reinforcing social interaction. Waning is inversely proportional to the strength of trust; thus, relationships with high strength will exhibit less waning than relationships with low strength. To ensure that all trust relationships exhibit some degree of waning, the waning equation incorporates a minimal decrease even for strong trust relationships:
- 3.11
- The log trust waning algorithm has two parameters, min_waning (MinWaning) and waning_rate (WaningR), which define the of Min_waning_cost as follows:

(5) - 3.12
- The formula for log waning is defined as:

(6.a) Equation (6.a) can be simplified to Equation (6.b):
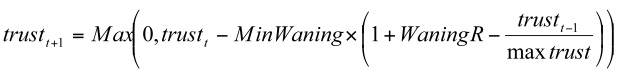
(6.b) - 3.13
- Trust cannot be a negative value, so we modify Equation (6.b) to (7)
(7) Agent strategies
- 3.14
- A probabilistic search function determines how the focal agent chooses a target agent for interaction according to the history of previous cooperative interactions. Four strategies were implemented to model different preferences in relationships formation; three are static with a constant bias is alter selection, while the fourth dynamic strategy changes during the simulation run. The alter selection strategies are:
- Strong ties preference: the history-dependent search function favours cooperating with alters with whom the agent has had more previous successful interactions. This encourages development of high-trust relationships or strong ties; however, since the function is stochastic, there is a low probability of initiating interaction with low-trust alters and strangers without a previous interaction history. As relationships develop the search function is progressively biased towards stronger ties.
- Medium ties: the search function is biased towards the mid-point in the relationship trust distribution.
- Weak ties: the search is biased towards the low trust/interaction frequency part of the distribution.
- Staged: in this dynamic strategy, the search bias is changed over time so the ego agent initially favours strong ties but progressively favours initiating proportionately more interactions with strangers and low-trust (weak tie) partners. This implements the behavioural predisposition manifest over an individual's lifetime, that strong ties are formed earlier in life, while weaker ties accumulate in later life and strong ties persist (Hays 1989).
- 3.15
- We consider the ith agent as the focal ego. The probability for the focal ego (ego i) meeting a new agent is
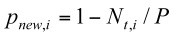
(8) where Nt,i is the number of ties at time t for the focal ego (ego i), and P the number of agents in the whole population.
- 3.16
- The probability of interacting with existing ties is
pexisting,i = Nt,i / P. (9) - 3.17
- Based on formulae (9), the actual probability of the focal ego (i) selecting an existing alter agent (j) is pexisting × pij , where pij is calculated according to the agent's strategy (a-d below).
- 3.18
- The function for all strategies first sorts all alters having ties with the focal ego (ego i) by trust in descending order. Total trust for the focal ego (ego i) is the sum of trust in its ties with other agents:

(10) where ti,j is the trust of the focal ego (ego i) with the alter agent with trust rank j and Nt,i is the number of ties (egos have ties with the focal ego) at time t. Then,
- The probability for strong ties preferred strategy for the alter with trust rank j is: pij = tij / Ti.
- The probability for weak ties preferred strategy for alter with trust rank j is: pij = tik / Ti, where the index k = Nt,i - j + 1.
- The probability for medium ties preferred strategy for the alter with trust rank j is pij = tij / Ti. if the alter is in the top half of the ranking (based on descending trust ordering), or pij = tik / Ti if the alter ego is on the bottom half part of the ranking
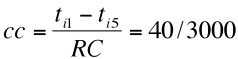
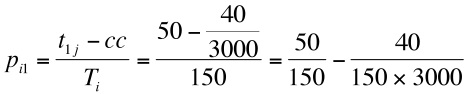
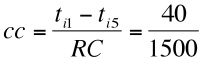
- The probability for stage strategy to meet the alter rank j is: pij - (tij - cc) /Ti, where the cycle count, cc = (tij - tik) / RC (with index k = Nti - j + 1), RC is the number of remaining cycles in the life time and cc modifies the probability of selecting alter j through RC cycles.

- 3.19
- Figure (2a) shows strong ties preferred strategy; the probability of selecting an alter is proportional to the relationship trust in total trust in all the egos relationships. Figure 2 (b) shows the weak ties strategy; where the probability of selecting an alter is proportional to trust value in the inverse rank order so if j = 2, Nt,i - j + 1 - 5 = 4; if j = 3, Nt,i - j + 1 - 5 = 3; and so on. The medium tie strategy applies weak ties strategy for the top 50% of alters (ranked by trust in descending order) and applies strong ties strategy for the bottom 50% alters.
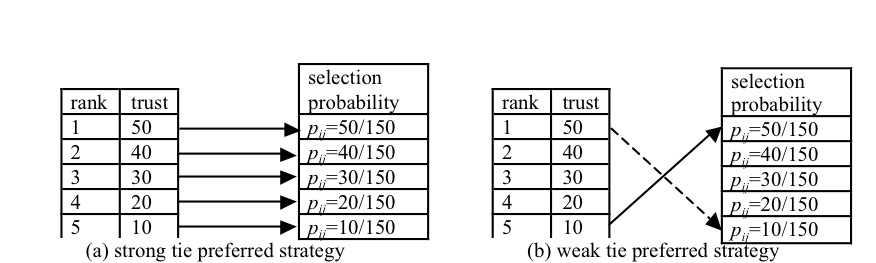
Figure 2. Ranking for strong and weak tie Alter selection strategies - 3.20
- The stage strategy works by applying the strong ties strategy in early cycles (in a model run) and then progressively applies a weak ties strategy in later cycles. So applying a strong strategy with 3000 cycles in a run, at the beginning when there are 3000 cycles left (RC) the probability for selecting the first ranked alter is:
and

- 3.21
- The second term for the right hand side is a very small value (0.8 x 10⁻⁷), so initially the probability of selecting this alter for stage strategy approximates to the probability of selecting this alter with a strong ties strategy (0.33). If we are approaching the end of a model run, when only one cycle remains,
then
and
- 3.22
- Hence at the end of run, the stage strategy probability for selecting the top rank alter is the same as the weak ties strategy (0.067). If we are in the middle of the run, with 1500 cycles remaining then
and
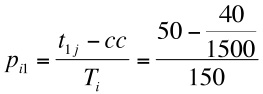
which is smaller than the probability early in the run and larger than the probability at the end of the run.
Model Control Process
- 3.23
- The top level algorithm for the model has two cycles. The first powers the simulation for the desired set of runs; in the simulations reported below this was set at 3000. The second cycle gives each focal agent a turn within a run and iterates according to the number of agents in the population.
Model-Control Initialise-model (N agents, strategies, run-cycles, parameters CR, W, D, FM) While Run-cycles Do For Agent (i) to N Do Select Focal Agent (i) {initially at random) If Forage-turn Then Increment Res by 1 {1} Else {Social-turn} Read Relationship History Search for Alter-agent {2} If Alter-response = Cooperate Then Increment Trust by (MaxCR-CI × Trust) {3} Else {Alter defects} Decrement Trust by (MaxCR-CI × Trust) Increment Defect by 1 End-If Decrement Trust by W {4} End-Do End-WhileNotes- The forage: social turn is set by the FM ratio parameter.
- Search depends on the agent strategy as described previously, so initially when there is no relationships history the search algorithm for all strategies selects a stranger at random. As relationship histories accrue the algorithm is chosen more selectively according to the agent's strategy.
- Trust compression is applied progressively as the relationship (i,j) increases. Initially there is no effect since there is no history.
- Waning is applied as described above, with the adjustment in equation 7 so the value does not become negative.
- The parameters Compression Rate for Trust, W for the Waning rate and D for % Defection rate on response can be changed between experimental runs.
- 3.24
- More details of the algorithms and source code can be found at http://www.openabm.org/. Searching using keyword 'trust' finds the model titled SBH trust model.
Simulation Experiments
- 3.25
- The experimental parameters (independent variables) in the computational model are:
- Defect rate = percentage of turns in which the respondent will not cooperate.
- Waning cost.
- Number of cycles in each model run.
- 3.26
- The model outputs (dependent variables) are:
- Trust between agents for each strategy.
- Frequency of relationships for each ego ranked by trust value.
- History of trust value change for any one relationship.
- Average number of relationships per ego, with trust divided into strong/medium and weak ties.
- 3.27
- Since the distribution of trust values was continuous rather than discrete, strong ties were counted as relationships in the upper tercile (33.3%) of the distribution, weak ties in the lower tercile and medium ties as relationships falling in between strong and weak. Since the frequency distributions of relationships by strength for each agent showed a power law curve, the tercile split produced a few agents in the upper third of the range of strength, a few more in the mid-range, while most agents fell within the tail of a J curve. This policy gave the rationale for dividing the continuous distribution into strong, medium and weak ties. The history of trust development for individual relationships was inspected to see if these conformed to the appropriate pattern predicted by the theory, i.e. for maximal trust the curve will asymptote; weak ties exhibit a shallow gradient with perturbations, and medium ties intermediate curves with more marked perturbations.
Results
-
Distribution of trust
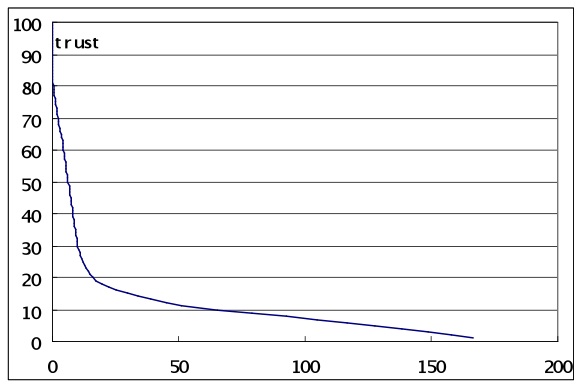
Figure 3. Frequencies of alter ranked by trust strength - 4.1
- A population of 300 agents produced power law distributions when the frequencies of trust for alters was ranked by strength. For agents with strong or stage strategy most simulations produced a power law (or J curve) distribution of ties, as illustrated in Figure 3. The distributions were skewed towards a few stronger relationships, with a mid-range showing high variation in trust values, then a long tail of low trust relationships with less variation.
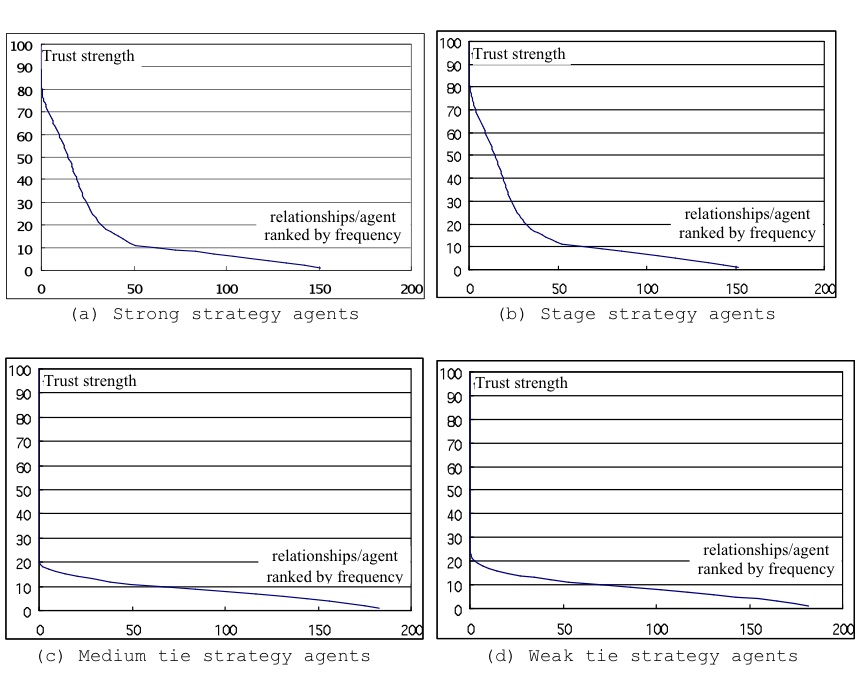
Figure 4. Average trust ranked by alters for egos grouped by preference strategies - 4.2
- As expected, medium- and weak-tie strategy agents produced flatter distributions with little variation between relationships at their preferred strength (see Figure 4), while the strong and stage strategy agents contributed more strong- and medium-tie relationships.
- 4.3
- When the time course of trust for relationship development was sampled for any one focal agent, taking alters in each tercile of the distribution, the patterns conformed to the predictions of the trust model illustrated in Figure 5. Trust in strong-tie relationships showed an asymptotic development, whereas medium and weak ties exhibited more perturbation and susceptibility to defections.
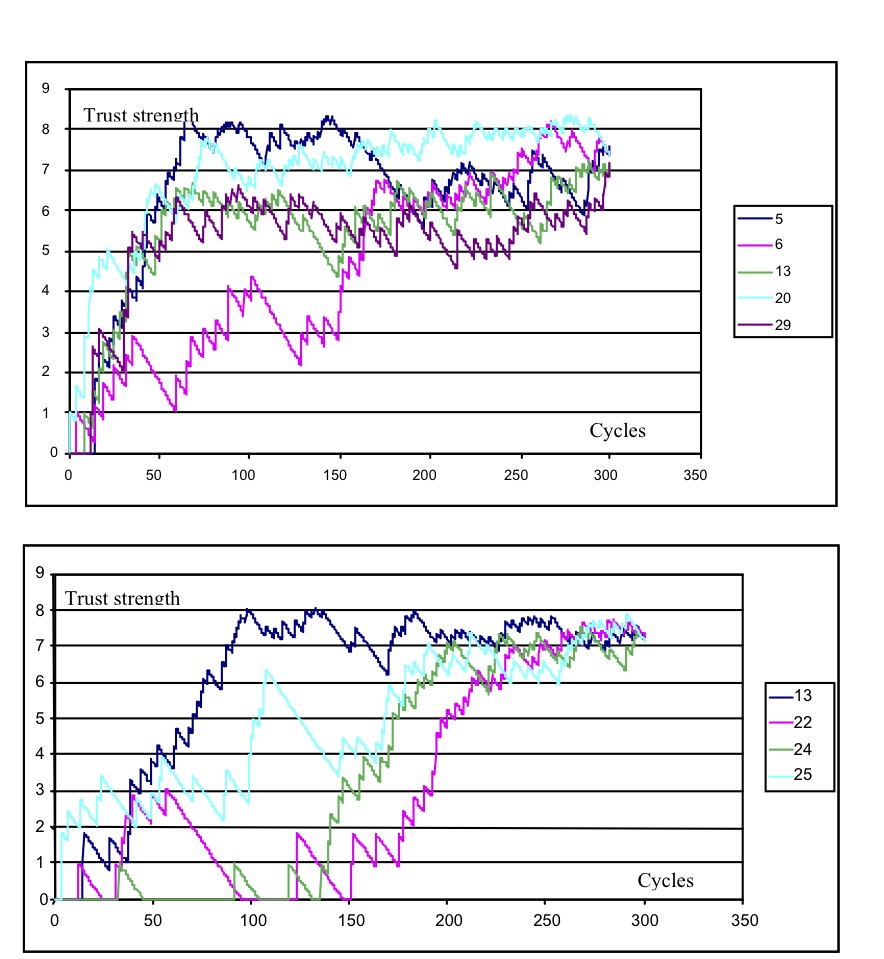
Figure 5. Time course of trust development of individual relationships for one focal agent- strong strategy: trust increase only (upper) and with 10% defect rate (lower) - 4.4
- In the trust increase-only model, all four alters rapidly become strong ties, although one alter shows slower progress. With defection added to the models, all alters become strong ties, although less rapidly. Alter 134 progresses towards the asymptote rapidly where the others remain in the weak- to medium-tie zone, until the progress towards the high-trust (> 60) zone where the rate of increase flattens as the log increase takes effect.
Log versus linear models
- 4.5
- A key assumption in the trust model is that the relationship between cooperative interaction frequencies and trust is logarithmic rather than linear. A similar assumption applies to waning, which makes high-trust relationships less susceptible to decline on one hand, and prevents exponential increase in trust on the other. We tested this assumption in a 2 × 2 experiment varying log/linear trust increase and waning, to assess the effect on average trust levels for strong, medium and weak relationships. Three thousand simulation cycles were executed with parameter ranges for linear increase and waning from 0.01 to 0.1; and log compression ratios from 1 to 10. A sample of the results for each simulation version is illustrated in Figure 6.
- 4.6
- Simulations with high interaction frequency:trust gain and low time:waning decrement settings all produced high-trust relationships approaching 300 per agent with N = 300 agent populations after 3000 cycles. Higher waning rates and lower trust-gain rates slowed the rate of increase but the trend towards maximal strong-tie relationships continued. Conversely, when the decrement rate was lower than the gain, not surprisingly many relationships that were formed were then extinguished, consequently the number of ties per ego and their strength decrease with high waning rates. Higher waning rates reduced the longevity and overall number of relationships.
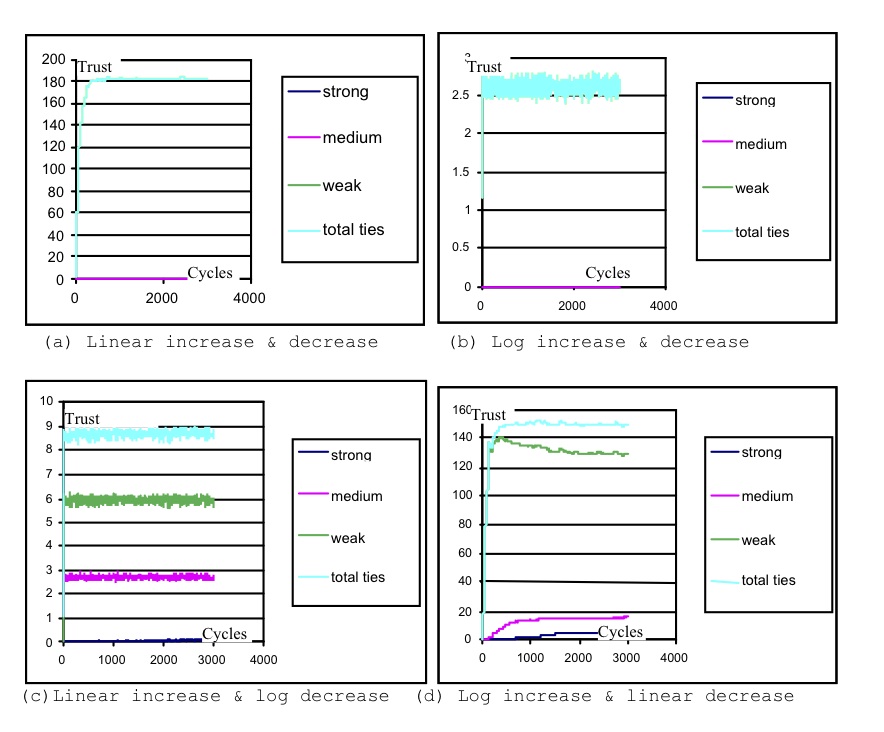
Figure 6. Sample simulation result for average (strong/medium/weak) ties per agent for each trust model version Linear increase and decrease
- 4.7
- Results from linear models depended on the gap between the increase gain and waning rates. When the increase rate was just high enough to overcome the waning rate the simulations produced many weak ties but no strong or medium ties, since many ties were initiated but waned before they could become strong. Increasing the difference between the trust gain and waning rate biased the result towards more strong ties, but the SBH layers never emerged at the tipping point between strong and weak ties. If the waning rate was increased while holding the trust gain rate low, few relationships persisted since they waned soon after they had been initiated. The linear model did not appear to produce a good fit for SBH predictions under a variety of parameter settings.
Log increase and decrease
- 4.8
- Simulations produced a low number of overall ties (2-3) with no strong or medium ties. Log increase did not favour the gain in trust; however, log waning rates were proportionately higher for weak ties, hence these tend to be extinguished and the simulation shows instability with oscillating numbers of weak ties.
Linear increase and log decrease
- 4.9
- This version produced about 8-9 ties overall with some differentiation of about 3 medium ties to 6 weak ties. Linear trust increase did not develop ties as quickly as the log version, while the log decrease effectively reduced all ties and especially any stronger ties that did develop; hence the number of relationships remained low.
Log increase and linear decrease
- 4.10
- This version produced the best results overall with numbers approximating to the SBH distribution of 130 weak ties, 14-16 medium ties and 5-6 strong ties. Therefore this model was adopted for further testing.
- 4.11
- The log increase/linear decrease gave the best fit with the SBH layers distribution when the waning rate was set at 0.08 with a maximum compression (MC) ratio = 10. Sensitivity analysis varying both parameters showed asymmetric effects. Increasing the MC ratio while holding the waning rate (WR) constant increased ties at all levels because the trust increment is greater earlier in relationship development. Conversely, increasing the waning rate while holding the MC ratio constant reduced ties at all levels. Doubling both the WR and MC ratios produced slightly fewer strong ties (3-4) and slightly more medium ties (18-20), because the MC ratio has proportionately less effect at higher levels of trust. Halving WR and MC ratios also produced slightly more strong and medium ties, as well as reducing weak ties. The lower MC ratio reduced the trust increment so fewer relationships survived at all levels.
- 4.12
- The log/linear model produced SBH distributions with an upper limit of circa 150 overall ties per ego within a range of population sizes from 200 to 500. The simulation shows that the number of overall relationships appears to be a function of agents' partner preference strategy, and the trust increase/waning model.
Effect of defections
- 4.13
- We used a population of 300 in this simulation. The log increase/linear decrease model was tested under a range of defect rates. The stage strategy was resistant to high defect rates, showing little decline in numbers of relationships until the defect rate was > 10%; see Figure 7.
- 4.14
- Two impacts of defection were tested to investigate the effect on the trustor (initiating agent) and 'mutual suspicion' when both parties become less trusting of each other:
- Asymmetric: (trustor only) if B defects then only A's trust in B is reduced
- Symmetric: if B defects then the relationship in both directions (A-B, B-A) is reduced, if a positive reciprocal value exists.
- 4.15
- With the asymmetric model, defect rates of up to 10% had no effect on the overall average number of ties per ego for all strategies; rates above 10% progressively reduced the number of strong and medium ties for the strong and stage strategies, with a small decrease in overall (weak ties) for weak and medium strategies.
- 4.16
- The symmetric model produced a stronger but similar effect although at a lower rate of defects, 5-10%, as may be expected since both relationships are decremented.
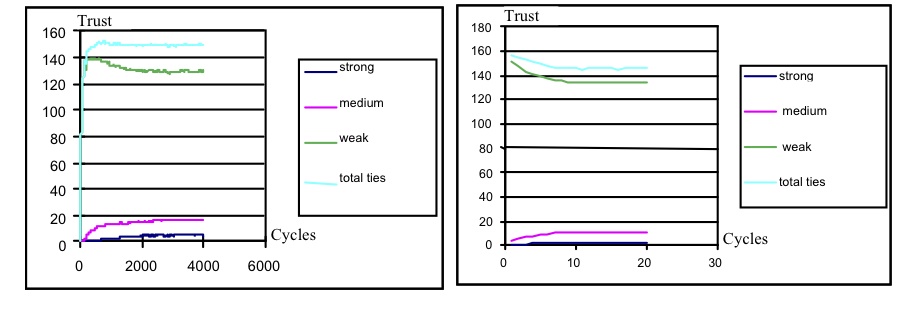
Figure 7. Effect of 5% and 10% defection rates on average-tie frequencies for the stage strategy agents - 4.17
- Higher defection rates progressively reduced the number of strong and medium ties which decline to zero with a rate higher than 10%, so strong ties can not develop since high frequencies of defection prevent the development of trust. In conclusion, the trust-SBH model appears to be robust in the presence of modest defection rates up to 5%, although higher rates prevent sufficient strong and medium ties developing. The results from 50 runs (each with 3000 cycles) are shown in Table 1.
Table 1: Means and SD of relationship frequencies by agent strategy with and without defections after 50 runs Strategy Defect Strong ties Medium ties Weak ties All ties Mean SD Mean SD Mean SD Mean SD Strong preferred 0 5.58 0.14 17.38 0.26 128.65 0.52 151.61 0.51 0.05 4.13 0.14 15.48 0.24 130.80 0.67 150.41 0.57 0.1 3.16 0.13 13.84 0.24 132.22 0.51 149.22 0.45 Stage preferred 0 5.57 0.13 17.40 0.24 128.66 0.45 151.63 0.43 0.05 4.15 0.13 15.40 0.25 130.73 0.56 150.28 0.49 0.1 3.18 0.10 13.77 0.19 131.99 0.56 148.94 0.54 - 4.18
- Overall the trust model with log increase and linear waning gave the best fit for predicted SBH distribution of relationships with parameters set for a low waning rate of 0.08. The trust model produced the desired distributions over a variety of waning rates and log increase ratios, within 10-15% of the optimal settings, showing it was reasonably robust. The model also tolerated uncooperative behaviour or defections at low rates with minimal perturbation, although higher rates did prevent formation of strong relationships.
Adding kin to the model
- 4.19
- In Dunbar's model, relationships may be either friends (non-kin) or related alters (kin). SBH does not predict how many kin will be present in each relationship layer; instead, it appears that kin and non-kin may substitute for each other at each level as if they compete for a set number of slots in the best friends (5-6), and close friends (15) layers (Dunbar & Spoors 1995, Roberts et al. 2009, Roberts & Dunbar (2011a)). To investigate this aspect of SBH, kin were introduced into the simulation as pre-set strong ties by assigning them high-trust values before the simulation began.
- 4.20
- Adding up to five kin did not affect the SBH distribution: the kin relationships just substituted for the emergence of strong ties. Even if kin ties were seeded at a lower level of trust equivalent to medium ties, the same result was observed. The strong kin ties were preserved by preferential treatment by the waning function, irrespective of the focal agent's strategy. Their existence at the onset of the simulation biased the probability distribution of the staged and strong-ties strategies to favour reinforcing kin ties rather than forming new strong ties; hence the simulation model follows empirical evidence that kin appear to substitute for best friends within inner SBH layers. If more than 5 kin were introduced, the number of strong ties increased marginally to 6-7 and this was partially sensitive to the number of initial strong kin ties; however, numbers did not increase much beyond 8-9 strong ties, indicating that the model self-limits too many strong relationships even if more kin are available.
Discussion and Conclusions
- 5.1
- The model produced insight into plausible behavioural processes by which the distribution of relationships predicted by Dunbar's SBH theory might arise. The agent strategies implicit in Dunbar's theory, favouring fewer stronger ties, and the stage developmental strategy that favoured stronger earlier and more weaker ties later, produced the predicted relationship intimacy distributions. The trust model produced the expected SBH distributions of relationship layers, including the appropriate proportions of weak ties, although further work will be necessary to investigate competition between the different strategies. The log/linear trust model produced the predicted distribution over a range of defect/waning rate settings, demonstrating it to be a robust and plausible mechanism by which a genetically based behaviour predisposition, to favour fewer strong relationships over many weaker, can produce observed distributions of social relationship intimacies.
Properties of the model
- 5.2
- The contribution of the model we presented in this paper is to provide a software simulation tool for the exploration of social relationships. The tool provides a causal account for the development of trust, assuming frequency of interaction is correlated with development of more intense relationships. Different relationships between interaction frequency and development of relationships intensity were explored, demonstrating that the log increase, linear decrease was the only model which produced results concordant with observed frequencies of social relationships. The model was robust when modest frequencies of defections or uncooperative behaviour were introduced, although higher rates of defection prevented formation of stronger relationships.
- 5.3
- While trust is the main focus of the model, it has the following more general properties which can be applied to modelling social phenomena:
- Relationship values accrue from interactions between agents. Interactions occur for all agents by a round robin scheduling selection.
- Selection of alter agents can be biased from random to favouring alters with more frequent interaction histories. The selection algorithm can be parameterised towards different areas in the frequency distribution of prior interactions for the focal agent.
- The relationship between relationship values and interactions can be either linear or log with parameters to set the rate of change.
- A global parameter decreases all relationship values at a rate determined by the selected linear/log algorithm.
- Global parameters control the ratio of cooperative/non-cooperative responses (defections) by agents.
- Outputs are: the time course of relationship value changes over the simulation run; relationships per ego ranked by value; the same aggregated for the whole agent population; and the number of relationships per ego (and for all egos) in tercile categories of the distribution.
Sociological Assumptions
- 5.4
- Development of social relationships depends on the frequency of cooperative social interactions; also, relationships which are not maintained by interactions tend to wane. These assumptions are based on observations in the human friendship literature (Baumeister & Leary 1995, Hays 1989, Oswald et al. 2004). Trust and social relationships develop asymmetrically, reflecting the trustor rather than the trustee role (McCabe 2002, Wellman et al. 2001). Trust is assumed to increase from interaction frequencies by a log relationship which is based on the change posited from calculative to affective trust (Ostrom 2002), where trust increases to an asymptote of deep trust. Relationships with strong trust are less sensitive to the effect of defection and decline into mistrust. All relationships are assumed to wane at a small constant rate, hence some interaction is necessary to maintain relationships, following the observations of Roberts and Dunbar (2011b ).
- 5.5
- Agents favour interacting with familiar alters, and tend to favour more familiar over less familiar alters. This assumption is based on studies of interaction frequencies where people and primates selectively favour social interaction with a few close friends rather than spreading social interaction more equitably among the whole group. These effects appear to be replicated in online social relationships. The model assumed Dunbar's distribution of social relationships divided in discrete layers of strong, medium and weak ties. Similar layers and frequencies of close v. casual friends are reported in human societies. Even though these relationship layers suggest a discrete distribution of emotional closeness, empirical evidence tends towards continuous distributions of closeness in relationships (Hua & Wellman 2010, Hogan et al 2007). Our model follows that pattern, so the frequencies of relationship types are a consequence of dividing the trust-relationship intensity distribution into thirds.
Related research
- 5.6
- Trust models have been motivated by a wide variety of contexts; for example peer-to-peer networking systems in which various trust ranking schemes for agent selection are discussed (Yu et al. 2004), the development of trust in inter-organisation relationships (Kim 2009), e-commerce using individual and social reputations (Zacharia et al. 1999) or the biological evolution of cooperation (Boyd & Richerson 1988, Nowak & Sigmund 2005). The literature on computational modelling of trust is extensive (Sabater & Sierra 2005, Ramchurn et al. 2004); however, the majority of models have taken a game theoretical approach in which agents cooperate according to their reputations and history of interaction. Other more general concepts of trust in complex systems and a variety of decision making contexts are discussed by Sabater and Sierra (2005), while models of trust at the individual level (similar to our method) and social level (reputation based) are discussed by Ramchurn et al. (2004), who noted that most models are decision or game theoretic in nature rather than being based on cognitively plausible mechanisms. Jonker and Treur (1999) defined four levels of trust defining on conditions and provided trust evolution equations, however they did not report simulation results for their model of trust in relating to groups or social relationships.
- 5.7
- Agent-based models have simulated the evolution of trust from cooperation strategies (Boyd & Richerson 1988), with reputation mechanisms, such as indirect reciprocity (Mohtashemi & Mui 2003, Nowak & Sigmund 2005, Roberts & Renwick 2003) showing how cooperative strategies (e.g. Tit-for-tat or Raise the Stakes) spread in a population so long as the history of an agent's previous interaction is visible as a reputation. The effect of agent memory and reliability on cooperation was explored by Kanazawa (2007) demonstrating how trust emerges even with agents programmed with human-like constraints of memory limits and some errors in rational choice. This genre of agent modelling considers trust to emerge from strategic choices; in contrast, our trust model is based more closely on human cognition with the law of diminishing returns reflecting the role of emotion in human trust. Cognitive computational models of trust have been proposed by Castelfranchi and Falcone (2000), in which trust is governed by an agent's beliefs about other agents in the context of delegation choices. Their model did not include any mechanism based on psychological principles, and focused on trust-based decision making rather than the social connotations of trust that motivated our model. Our work extends psychologically based models of trust with a specific focus on social relationships, showing how a process of trust formation can account for observed structures of human social relationships.
Limitations and future developments
- 5.8
- Defections are currently modelled as a global parameter. This limitation hinders investigation into the effect of non-cooperative interaction on relationship trust. We plan to develop the trust model so defects can be introduced for specific relationships; furthermore, relationship histories will maintain memories of previous defections. This will facilitate modelling the onset of mistrust, which we hypothesise will follow an inverse log course, with initially little effect, then a steep decline into mistrust as the ego's patience with a defecting alter wears thin.
- 5.9
- Our model complements agent-based social network models (Hamill & Gilbert 2009) with an ego-centric view of social structures; Hamill and Gilbert's social circles provide a substrate for modelling connected social nets. A future development of our model is to create output comprising whole social network graphs annotated with relationship strengths, to investigate the social structures that emerge from the trust SBH model. The complete social network produced by our simulation was too dense to be analysed by inspection, so in future evaluations we will calculate social network metrics, such as centrality, and so we can compare our simulations with observations of real life social networks.
- 5.10
- The simulation could be extended from behaviour to an evolutionary model to investigate the fitness of different social strategies. This would involve adding fitness criteria such as wellbeing as a function of the number of strong ties relationship. Breeding and selection of agents according to their fitness could facilitate evaluation of agent strategies and demonstrate how Dunbar's model of social relationships might have evolved as a consequence of genetically based predispositions to form fewer strong social relationships.
Acknowledgements
- This research was supported by UK ESRC/EPSRC Cognitive Foresight Programme project TESS, developing Theory for Evolving Socio-technical Systems.
References
-
BAUMEISTER R.F. & Leary, M.R. (1995). The need to belong: Desire for interpersonal attachments as a fundamental human motivation. Psychological Bulletin, 117(3), 497-529. [doi:10.1037/0033-2909.117.3.497]
BONABEAU, E., Dorigo, M. & Theraulaz, G. (1999) Swarm intelligence: From natural to artificial systems. Santa Fe: Santa Fe Institute. Also available online at http://www.swarm.org/wiki/main_page.
BOYD, R. & Richerson, P.J. (1988) The evolution of reciprocity in sizeable groups. Journal of Theoretical Biology, 132, 337-356. [doi:10.1016/S0022-5193(88)80219-4]
BROWN, S.L. & Brown, R.M. (2006). Selective investment theory: Recasting the functional significance of close relationships. Psychological Inquiry, 17, 1-29. [doi:10.1207/s15327965pli1701_01]
BUYS, C.J. & Larson, K.L. (1979). Human sympathy groups. Psychology Reports 45, 547-553. [doi:10.2466/pr0.1979.45.2.547]
COOK, K.S. & Cooper, R.M. (2002). Experimental studies of cooperation, trust and social exchange. In E. Ostrom & J. Walker (Eds), Trust and reciprocity: Interdisciplinary lessons from experimental research, 209-244. New York: Russel Sage Foundation.
CASTELFRANCHI, C. & Falcone, R, (2000) Social trust: A cognitive approach. In Castelfranchi, C. & Tan, Y-H, (Eds), Trust and deception in virtual societies. Boston MA: Kluwer.
DUNBAR, R.I.M. (1993). Coevolution of neocortex size, group size and language in humans. Behavioral Brain Sciences, 16, 681-735. [doi:10.1017/S0140525X00032325]
DUNBAR, R.I.M. (1996). Determinants of group size in primates: A general model. In J. Maynard Smith, G. Runciman & R. Dunbar (Eds), Evolution of culture and language in primates and humans, pp. 33-57. London: Oxford University Press.
DUNBAR, R.I.M. (1998). The social brain hypothesis. Evolutionary Anthropology, 6, 178-190. [doi:10.1002/(SICI)1520-6505(1998)6:5<178::AID-EVAN5>3.0.CO;2-8]
DUNBAR, R.I.M. (2008). Mind the gap: or why humans aren't just great apes. Proceedings British Academy, 154, 403-423.
DUNBAR, R.I.M. & Spoors, M. (1995). Social networks, support cliques, and kinship. Human Nature, 6, 273-290. [doi:10.1007/BF02734142]
DUNBAR, R.I.M. & Stiller, J. (2007). Perspective-taking and social network size in humans. Social Networks, 29, 93-104. [doi:10.1016/j.socnet.2006.04.001]
GILBERT, N. & Triotzsch K.G. (2005). Simulation for the social scientist. Milton Keynes: Open University Press.
HAMILL, L. & Gilbert, N. (2009). Social circles: A simple structure for agent based social network models. Journal of Artificial Societies and Social Simulations, 12(2)3. https://www.jasss.org/12/2/3.html
HAYS, R.B. (1985). A longitudinal study of friendship development. Journal of Personality and Social Psychology, 48(4), 909-924. [doi:10.1037/0022-3514.48.4.909]
HAYS, R.B. (1989). The day-to-day functioning of close versus casual friendships. Journal of Social and Personal Relationships, 6, 21-37. [doi:10.1177/026540758900600102]
HILL, R.A. & Dunbar, R.I.M. (2003). Social network size in humans. Human Nature, 14, 53-72. [doi:10.1007/s12110-003-1016-y]
HOGAN, B., Carrasco, J., & Wellman, B (2007). Visualizing Personal Networks: Working with Participant-Aided Sociograms. Field Methods, 19(2), 116-144. [doi:10.1177/1525822X06298589]
HUA, W., & Wellman, B. (2010). Social Connectivity in America: Changes in Adult Friendship Network Size from 2002 to 2007. American Behavioral Scientist, 53(8), 1148-69 [doi:10.1177/0002764209356247]
JANSSEN M. (2006) Evolution of cooperation when feedback to reputation scores is voluntary. Journal of Artificial Societies and Social Simulation, 9(1)17 https://www.jasss.org/9/1/17.html
JONKER, C.M. & Treur, J. (1999). Formal analysis of models for the dynamics of trust based on experiences. In: F.J. Garijo, M. Boman (eds.), Multi-agent system engineering: Proceedings 9th European Workshop on Modelling Autonomous Agents in a Multi-Agent World, MAAMAW'99. (Lecture Notes in AI, 1647) pp. 221-232. Berlin: Springer Verlag. [doi:10.1007/3-540-48437-x_18]
KANAZAWA, Y. (2007). The promotion and evolution of cooperation through projection: Implications for social dilemmas and trust. Journal of Mathematical Sociology, 31(2), 187-204. [doi:10.1080/00222500601188502]
KIM W-S. (2009). Effects of trust on complex adaptive supply networks: An agent-based simulation study. JASSS, 13(3)4, https://www.jasss.org/12/3/4.html
LU, Y., Roberts, S., Lio, P., Dunbar, R.I.M. & Crowcroft, J. (2009). Size matters: Variation in personal network size, personality and effect on information transmission. In Proceedings, 2009 International Conference on Computational Science and Engineering. Vol. 4, pp. 188-193 .Los Alamitos: IEEE Computer Society Press. [doi:10.1109/CSE.2009.179]
MCCABE, K.A. (2002). A cognitive theory of reciprocal exchange. In E. Ostrom & J. Walker (Eds), Trust and reciprocity: Interdisciplinary lessons from experimental research, 147-169. New York: Russel Sage Foundation.
MOHTASHEMI, M. & Mui, L. (2003). Evolution of indirect reciprocity by social information: the role of trust and reputation in evolution of altruism. Journal of Theoretical Biology, 223(4), 523-531. [doi:10.1016/S0022-5193(03)00143-7]
NOWAK, M. & Sigmund, K. (2005). Evolution of indirect reciprocity, Nature, 437, 1291-1298. [doi:10.1038/nature04131]
OSTROM, E. (2002). Towards a behavioural theory linking trust, reciprocity and reputation. In E. Ostrom & J. Walker (Eds), Trust and reciprocity: Interdisciplinary lessons from experimental research, 19-79. New York: Russel Sage Foundation.
OSWALD, D.L, Clark, E.M. & Kelly, C.M. (2004). Friendship maintenance: An analysis of individual and dyad behaviours. Journal of Social and Clinical Psychology, 23(3), 413-441. [doi:10.1521/jscp.23.3.413.35460]
RAMCHURN, S.D., Huynh, T.D. & Jennings, N.R. (2004). Trust in multiagent systems. Knowledge Engineering Review, 19(1). 1-25. [doi:10.1017/S0269888904000116]
ROBERTS, G. & Renwick, J.S. (2003). The development of cooperative relationships: An experiment. Proceedings of the Royal Society, 270, 2279-2283. [doi:10.1098/rspb.2003.2491]
ROBERTS, S.B.G., Dunbar, R.I.M., Pollet, T. & Kuppens, T. (2009). Exploring variations in active network size: Constraints and ego characteristics. Social Networks, 31, 138-146. [doi:10.1016/j.socnet.2008.12.002]
ROBERTS, S., & Dunbar, R.I.M. (2011a). Communication in social networks: Effects of kinship, network size and emotional closeness, Journal of Personal Relationships, 18, 439-452. [doi:10.1111/j.1475-6811.2010.01310.x]
ROBERTS, S., and Dunbar, R.I.M. (2011b). The costs of family and friends: An 18-month longitudinal study of relationship maintenance and decay, Evolution and Human Behavior, 32, 186-197. [doi:10.1016/j.evolhumbehav.2010.08.005]
ROSE, S. & Serafica, F. (1986). Keeping and ending casual, close and best friendships. Journal of Social and Personal Relationships, 3(3), 275-288. [doi:10.1177/0265407586033002]
SABATER, J. & Sierra, C. (2005). Review on computational trust and reputation models. Artificial Intelligence Review, 24, 33-60. [doi:10.1007/s10462-004-0041-5]
WELLMAN, B., Haase, A.Q., Witte, J. & Hampton, K. (2001). Does the internet increase, decrease, or supplement social capital? American Behavioural Scientist, 45, 436-455. [doi:10.1177/00027640121957286]
WELLMAN, B., Hogan, B., Berg, K., Boase, J., Carrasco, J.A., Côté, R., Kayahara, J., Kennedy, T. & Tran, P. (2006). Connected lives: The project. In P.Purcell (Ed.) Networked neighborhoods. Berlin: Springer. [doi:10.1007/1-84628-601-8_8]
YU B., Singh, M.P. & Sycara, K.(2004), Developing trust in large-scale peer-to-peer systems, 2004 IEEE First Symposium on Multi-Agent Security and Survivability, 30-31, 1-10 Los Alamitos: IEEE Computer Society Press.
ZACHARIA, G., Moukas, A., Moukas, R. & Maes, P. (1999). Collaborative reputation mechanisms in electronic marketplaces. In Proceedings HICSS Hawaii International Conference on System Sciences. Hawaii: University of Hawaii. [doi:10.1109/hicss.1999.773057]