
 Abstract
- This paper presents an agent-based model of worker protest. Workers have varying degrees of grievance depending on the difference between their wage and the average of their neighbors. They protest with probabilities proportional to grievance, but are inhibited by the risk of being arrested—which is determined by the ratio of coercive agents to probable rebels in the local area. We explore the effect of similarity perception on the dynamics of collective behavior. If workers are surrounded by more in-group members, they are more risk-taking; if surrounded by more out-group members, more risk-averse. Individual interest and group membership jointly affect patterns of workers protest: rhythm, frequency, strength, and duration of protest outbreaks. Results indicate that when wages are more unequally distributed, the previous outburst tends to suppress the next one, protests occur more frequently, and they become more intensive and persistent. Group identification does not seriously influence the frequency of local uprisings. Both their strength and duration, however, are negatively affected by the ingroup-outgroup assessment. The overall findings are valid when workers distinguish 'us' from 'them' through simple binary categorization, as well as when they perceive degrees of similarity and difference from their neighbors.
- Keywords:
- Workers Protest, Tags, Group Identity, Trust, Netlogo
Introduction
- 1.1
- Marked increases in wage inequality and major layoffs due to corporate restructuring brought on by a financial crisis triggered a major outbreak of strikes and local protests in South Korea during 1996-97. Although the wave of protest was severe in industrial cities, it never reached its full potential due to lack of solidarity between native Korean and marginalized immigrant workers. Ultimately, coercive efforts by employers and the government were able to prevent the emergence of a synchronized worker action that spanned both spatial and ethnic diversity in the working class. The story is a familiar one; ethnic and cultural differences among workers are frequently a factor in limiting class solidarity and coordinated protest.
- 1.2
- In this paper, we extend a model of civil violence proposed by Epstein (2002) to examine effects of perceived 'in' and 'out' group membership identity on the shape of protest events. In our model, workers are motivated to protest by grievances based on wage inequality, but it is inhibited by the risk that coercive agents might arrest them. Variations and spatial distribution in grievance and coercion give rise to dynamic patterns of protest activity, but we add a new element. Workers have limited tolerance toward others who they see as different from themselves. They can read "other-ness" from observable 'markers,' to make a distinction between 'us' and 'them' (i.e. native and guest workers). Workers believe that perceived in-group members are more likely to support them, lessening the risk that they will be arrested if they protest. In a series of simulation experiments, we explore the consequences of this similarity-based risk calculus for various features of protest outbreaks over time: rhythms, frequency, intensity, and duration.
Theoretical Background
- 2.1
- Rational choice theory axiomatically states that individuals with (relatively) complete information behave in a rational manner to maximize calculable utility in terms of cost-benefit ratio. This individual-based utilitarian model has been widely implemented to explain collective behavior: an agent will participate in collective behavior if perceived benefits - perceived costs > threshold, and otherwise she will not. Granovetter (1978) defines an individual's threshold for joining a riot as the proportion of the group she would have to see join before she would do so. In other words, the threshold is the point where the perceived benefits to an individual of joining the riot exceed the perceived costs. Epstein (2002) models civil violence from this perspective, building on a long tradition of such work. Agents in Epstein's model are homogeneous in the sense that they have the same threshold level.
- 2.2
- The dynamics of collective behavior among heterogeneous agents is not the same as the dynamics among homogeneous ones (Oliver et al. 1985). There are two approaches to theorizing and modeling it. First, studies on the critical mass (Granovetter 1978; Oliver et al. 1985; Marwell et al. 1988; Brichoux and Johnson 2002) highlight roles of a small group of people who are different from the others in terms of interest, resources, and/or commitment. The main argument in Granovetter (1978) is that a small change in the distribution of thresholds in the population makes a dramatic difference in the dynamics of collective action (e.g. the bandwagon effect). As Marwell et al. (1988: 508) summarize it, "when groups are homogenous, everyone is interchangeable, and the collective action outcome is a simple function of how many people participate. In contrast, in a heterogeneous group, it matters who is organized as well as how many since one person may be willing and able to contribute much more than another." They prove mathematically and computationally that group heterogeneity and network centralization increase the overall probability that organizers find a critical mass who trigger and sustain mobilization. Brichoux and Johnson (2002) simulate protests by agents who perceive only what happens in their immediate surroundings and estimate the probability of success following a logistic curve. They demonstrate that a small number of activists who unconditionally join the on-going protest significantly promote mobilization through positive feedback even under unfavorable conditions for it. Individual differences in participation thresholds, however, is not the only kind of heterogeneity that matters for protest.
- 2.3
- The second approach to the effects of heterogeneity on protest critiques the absence of identities in the classical rational choice model of collective action. Perceived similarity between agents is seen as facilitating cooperation and solidarity in social dilemmas (e.g.Kramer and Brewer 1986; Kollock 1998). Social identification has been highlighted as a central mechanism to understanding other forms of collective action including protest among heterogeneous agents (Reicher 1984; Brewer and Silver 2000; Simon and Klandermans 2001). Practitioners of the constructionist approach emphasize the role of collective identity in social movements (Cohen 1985; Melucci 1988). This approach is in line with agent-based modeling of collective identity beyond instrumental rationality (e.g. Lustick 2000). Collective identity - which is more transient and more emergent rather than rooted in socio-cultural categories (Rohlinger and Snow 2003), however, is not our current focus. The present study is instead informed by social psychological research on group identity.
- 2.4
- People tend to make distinctions between 'us' and 'them' through 'categorization' (Tajfel 1974), a cognitive process of classifying stimuli on the basis of 'similarities' among them (Turner 1982). This is consistent with the idea of "tagging" (Holland 1996) as a pervasive mechanism in group processes. Human agents rely on heuristic cues such as ethnic and cultural markers (e.g. skin color, speech, manner) to identify themselves from others (Richerson and Boyd 2001). This labeling predicated on similarity perception among heterogeneous agents occurs more frequently in large-sized gatherings with strangers (i.e. workers from other workplaces in our model). Our study is interested in the issue of trust driven by categorical membership identity and its impact on individual interest. In our model, workers at risk from coercive agents consider not only the potential benefit of protest (determined by the difference between grievance and perceived cost) but also whether they are surrounded by a sufficient number of trustworthy fellows.
- 2.5
- We are concerned with the interplay between class and race. In our model, agents are heterogeneous in "class" in that they receive different incomes. This heterogeneity affects the individual propensity to protest by creating a sense of grievance based on individual relative deprivation. Underpaid workers are more likely to participate in collective behavior in our model. Agents are also heterogeneous in ethnic and cultural markers. As explained below, this heterogeneity affects participation because agents are more likely to trust others of their own kind. In our model, class and race are orthogonal. In real world cases, usually these factors are not, with a marginalized ethnic population systematically being paid less. In the split labor market theory (Bonacich 1972), for example, more highly paid native workers are forced to compete with guest workers who are more likely to remain as bystanders or strikebreakers (Brown and Boswell 1995). We instead adopt the assumption of the independence of class and race in order to better understand the dynamics of "race" or tag similarity in the absence of confounding correlations.
The Model [1]
- 3.1
- The current version of Netlogo (Wilensky 1999) is equipped with Model I in Epstein (2002) in the library - the rebellion model (Wilensky 2004). We use it as a starting point, and adopt its basic simulation approach under which agents are randomly selected without any particular schedules. In this way, we can avoid the execution order effect. 'Updating' is synchronous, as in Wilensky (2004), which means that the environment is updated for the next stage only after all agents have finished their actions at the current stage[2].
- 3.2
- Workers (analogous to Epstein's civilians) without leaders are located on a 20 x 20 torus with some open spaces. They know only what is going on in their immediate surroundings, as is in Epstein (2002) and Brichoux and Johnson (2002). In our model, an agent observes the behavior of neighboring fellows whose distance from her is less than or equal to six (Epstein used a distance of 7, on a 40x40 grid). The density of workers is fixed at 70%. The grid is also occupied by coercive agents who arrest actively protesting workers. As in Epstein (2002), coercive agents are randomly arranged across the space with a density of 4%.
- 3.3
- In Epstein (2002), both perceived hardship ( H) and perceived regime legitimacy ( L) determine grievance: G = H (1 - L), H ∼ U (0,1). L is fixed as a certain value in his model. Instead of H and L, we define each worker's grievance as a feeling of relative deprivation which motivates to consider joining a protest:
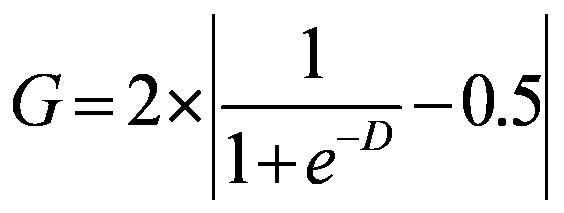
(1) where D is an ego's wage minus the local average within a certain radius (i.e. 6 patches in our experiment). Relative deprivation is expected to reach its maximum when the population is equally divided into a group of very rich people and a group of very poor people. However, we assume that feelings of relative deprivation stem from local comparisons in terms of reference group within which an individual confines her aspirations. An alternative approach to localized relative deprivation would be to define it as the difference between each agent's wage and that of the most highly paid agent in the neighborhood, but we prefer the difference between one's wage (i.e. achievement) and the local average (i.e. expectation). The exponential function indicates that grievance increases most rapidly with small deviations from 0, but less rapidly as the difference becomes bigger (Figure 1). Alternative functional forms would modify the dynamics of the model. Decreasing sensitivity with increasing distance, however, is commonly hypothesized in research on cognition and perception of social distance. The maximum of G is unity when D < 0. we regard grievance as asymmetric, with no motivation to protest resulting from "over-reward." that is, G = 0 as the minimum when D ≥ 0[3]. Wages are drawn randomly from a normal distribution N (0.5, 0.1672) multiplied by wage dispersion ( WD, hereafter). WD is fixed within a run, but varies across runs to explore the effects of levels of inequality. If WD = 1, wage ∼ N (0.5, 0.1672). Min(wage) = 0, and Max (wage) = 1; if WD = 2, wage ∼ N (1, 0.3342) since E (aX) = aE ( X), and Var (aX) = a2 Var ( X); and so on.
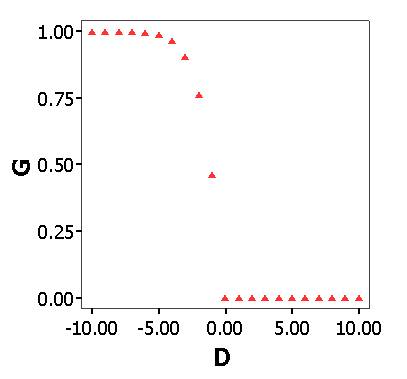
Figure 1. Grievance as a Function of the Difference between the Local Average and Agent's Wage - 3.4
- The grievance distribution in our model differs somewhat from that of Epstein. At a moderate level of inequality ( WD = 3), the average grievance in our model (0.0902) is not significantly different from that in Epstein's model (0.0958) when perceived hardship follows U (0,1) and perceived legitimacy is 0.82 (Table 1). In our model, the average level of grievance varies with wage dispersion; at WD = 2, it is lower (0.0654), and at WD = 4, it is higher (0.1236). Epstein's model (Left in Figure 2) does not produce any substantively meaningful pattern, whereas the distribution of grievance in our model (Right in Figure 2) indicates that a majority of agents are not highly discontent. Particularly at the levels of wage dispersion used in our experiments, the grievance distribution is characterized by a power-law.
Notes: N = 100. Two-tailed tests at α = 0.01.Table 1: Averages and Standard Deviations of Grievance in Epstein (2002) and Our Model Grievance Epstein (2002) Our Model Average 0.0902 0.0654 (WD = 2)
0.0958 (WD = 3)
0.1236 (WD = 4)Standard Deviation 0.0520 0.0946 (WD = 2)
0.0136 (WD = 3)
0.1738 (WD = 4)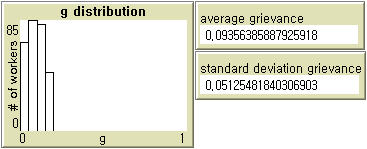
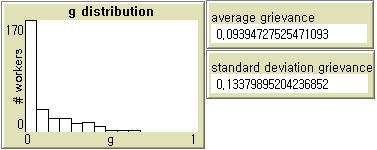
Figure 2. Grievance Distributions in Epstein (2002) and Our Model - 3.5
- Whether a worker protests or not is contingent on both grievance and a rational calculation of the net risk. The net risk, in turn, is determined by an exogenously fixed individual-level of risk-aversion and the estimated probability of being arrested. In our model, Net Risk ( NR) is equal to Risk Aversion ( R) multiplied by Estimated Arrest Probability ( P), as is in Epstein's model. But, R ∼ N (0.5, 0.1672), instead of R ∼ U (0,1) in his model. That is, we assume that a majority of workers have degrees of risk aversion close to its mean in the population, with a small number of outliers above or below the mean. As with Epstein's model, we calculate P by 1 - exp[-k( C/A) vision = 6]. Here, C/A is the number of cops ( C) over the number of active workers ( A). That is, the probability that a worker is arrested declines at an increasing rate as the ratio of workers protesting to coercive agents increases. Following Wilensky (2004), k = 2.3 is a constant set in 'startup' to ensure a reasonable value when there is only one cop and one agent within a certain vision; and we take the 'floor' of C/A - the largest integer less than or equal to C/A.
- 3.6
- Each agent has two traits, a tag t ∼ U (0,1) and a tolerance T ∼ N (0.5, 0.1672). We assume that tags and tolerance assigned to agents at the initial stage remain constant throughout experiments. Whether the difference between an ego and her alter is labeled as 'othering' is determined by the ego's degree of tolerance T to 'tag difference,' that is, | t ego -t alter |. For instance, if t ego = 0.6, t alter = 0.2, and T ego = 0.5, | 0.6 - 0.2 | < 0.5. Hence, the ego categorizes her neighbor as 'us.' For another example, if t ego = 0.9, t alter = 0.2, and T ego = 0.5, | 0.9 - 0.2 | > 0.5. Here, the ego regards her neighbor as 'them.' More generally, agent i perceives j as in-group only if | t i -t j | ≤ T i; and otherwise out-group.
- 3.7
- When there is no tag-based group identity, if | grievance - perceived risk | > threshold, workers become active; and otherwise they remain as bystanders. This default process reflects the classical model of rational choice. It is necessary but not sufficient for considering whether or not to participate in the on-going protest when heterogeneous workers should read signals of trustworthiness in a large-sized mobile assembly. Each agent must gauge whether group support is likely. If acting produces greater payoffs than not acting, but probability of support is 0, then the crowd member will not be active (Berk 1974). If tag-based distinction between us and them is manipulated, workers become active not only when the first condition (i.e. G - NR > threshold) is satisfied, and when the number of perceived in-group neighbors is more than or equal to the number of out-group members[4]. In this way, agents in our model independently assess the net risk and group support. We introduce the exogenous parameter to determine the degree of tag-based distinction. Whether a random integer number generated from the uniform distribution is bigger than a certain level of tag-based distinction, decision-making is purely rational (i.e. calculating the net risk) without assessing group support; and otherwise it depends on both tag-based risk perception and the net risk assessment.
- 3.8
- Agents can move around within their local neighborhood in Epstein (2002), unlike those in Brichoux and Johnson (2002). This makes his model more realistic and reasonable (See Chapter 4 "Dimension of Space and Time in Protest and Repression" of Francisco (2010)). At the beginning of each round of simulation, we allow workers who are not arrested, and cops, to move to any vacant patch within a distance of 6. Workers then become active if the difference between their grievance and their perceived net risk falls above a fixed threshold (0.1, as in Epstein's model). If active workers are arrested by cops, companies lay them off. They are able to go back to their fellows after a certain period of time. It is a random integer number between 0 and 29, as in Wilensky (2004) where the maximum layoff-term is fixed as 30. This random number approach is justifiable since employment flexibility varies from one workplace to another. Epstein (2002) assumes that jailed agents return to the population with previous levels of risk aversion and perceived hardship. In the same way, laid-off workers in our model return with the same values of wage, tag, tolerance, and risk aversion.
- 3.9
- Epstein (2002) observes punctuated equilibrium at a relatively high maximum jail term (e.g. 15, 30). He mentions the possibility that increasing the jail term would 'flatten' the distribution of waiting time between protests and raise its mean (Ibid: 7246), but the consequences of decreasing the jail term are not considered. If the maximum jail term is not sufficiently high, say 10, a strong local protest continues (Left in Figure 3). In this way, his model is very sensitive to its initial value. Our model does not entail such sensitivity (Right in Figure 3), but it is implied that global patterns of local outbursts in our model can be still affected by the maximum layoff term.
- 3.10
- Our model uses real number tags (e.g. Riolo et al. 2001). We argue that cognitive agents may scale the overall similarity to neighboring fellows. However, action can be based on binary distinction between 'us' from 'them', as in Schelling's original model of residential segregation (Schelling 1971; 1978). To examine the sensitivity of our approach, we construct another model in which each agent has binary tags, 1 or 0 denoting the presence or absence of a single trait (e.g. physical appearance). As above, tolerance levels are normally distributed. A direct comparison of simulation outcomes is not possible since the Schelling-type model is not nested in the proposed model, but it is still a critical task to test whether or not protest patterns are seriously contingent on the way of assessing group support. Results and their interpretation are offered in Appendix.
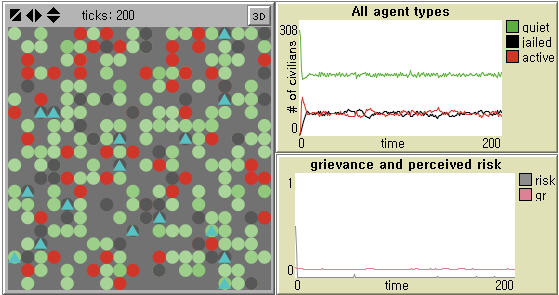
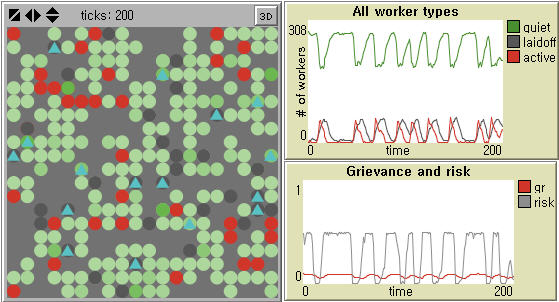
Figure 3. Sensitivity to Penalty for Protesters in Epstein (2002) and Our Model Notes: Population size = 400, Initial density of cops = 4%, Initial density of civilians (workers) = 70%, Vision = 6 patches, Threshold = 0.1, Movement = Yes, and Maximum jail (layoff) term = 10 are used in both models. Government legitimacy = 0.82 by default in Epstein (2002). Wage dispersion = 3 (See Table 1) and Tagging = 0 in our model for comparison.
Experimental Design and Measurement
- 4.1
- We present the factorial experimental design in Table 2. We mainly investigate the effects of the degree of inequality and group identification, and their interaction effects on the dynamics of worker protests when holding all other variables constant. For the reason in 3.9, we undertake the same set of experiments in Table 2 at the maximum jail term = 20 and 30.
Notes: Controlled parameters are: 1) Population size = 400 (20 x 20); 2) Initial density of cops = 4%; 3) Initial density of workers = 70%; 4) Vision = 6 patches; 5) Threshold = 0.1; and 6) Movement = Yes.Table 2: Experimental Design Experimental Groups (ID) Wage Dispersion (WD) Tag-based Distinction 1 2 0 2 4 0 3 2 20 4 4 20 5 2 40 6 4 40 7 2 60 8 4 60 9 2 80 10 4 80 11 2 100 12 4 100 - 4.2
- We explore two levels of wage dispersion. Given that WD = 3 produces the average grievance similar to that in Epstein's model (Table 1), WD = 2 and WD = 4 explore the consequences of narrower and wider wage inequalities, respectively. The range of tag-based labeling is from 0% through 100% in increments of 20. If it is 0%, workers calculate the net risk defined above without 'tagging.' If it is 100%, they always estimate not only the net risk but also the local ratio of trustworthy neighbors to the total number of neighbors. If it is x% (0 < x < 100), x% of workers, on the average for each round, gauge both the net risk and the trustworthiness of neighboring fellows. The rest simply assess the net risk.
- 4.3
- 100 replications are performed in each condition. Given two levels of wage dispersion x six levels of tag-based distinction x two levels of the maximum layoff term, the number of independent cases is 2,400 in total. Each simulation is run for 300 iterations.
- 4.4
- Protest patterns are of great interest in political sociology and the study of social movements (Olzak 1989; Oliver and Myers 2002; Francisco 2010). The distributions of protest rhythms may be exponential or scale-free. They may display regular cycles, varying degrees of autocorrelation, or various chaotic patterns. Tilly (1978) proposes to measure the magnitude of collective action by size (how many people participate in individual events), duration (how long they last), and frequency (how often they occur). In our paper, a protest event is defined when at least one worker is active without being arrested. An event ceases when the number of active workers falls to zero immediately after all rebels are laid off. Modifying Tilly (1978), we measure the following four outcome variables. First, event frequency is defined by how often there are uprisings (periods of protest activity separated by periods of the absence of protest). In Figure 4, for example, we see four protest events between the beginning of the simulation and the thirty-sixth iteration. Next, the protest strength is measured in two distinctive ways: maximum peak is the largest number of workers protesting at any point during the run. In Figure 4, it is 81, which comes from the number of active workers in the first peak; and average protest strength is the number of active workers per time step, that is, the total number of active workers divided by the total time steps. In Figure 4, average strength is 21.69 (i.e. the sum of 414, 1, 362, and 4 divided by 36 time steps). Lastly, average duration of protest is the sum of peak widths over the total time steps (e.g. 0.611 (= 22/36) in Figure 4).
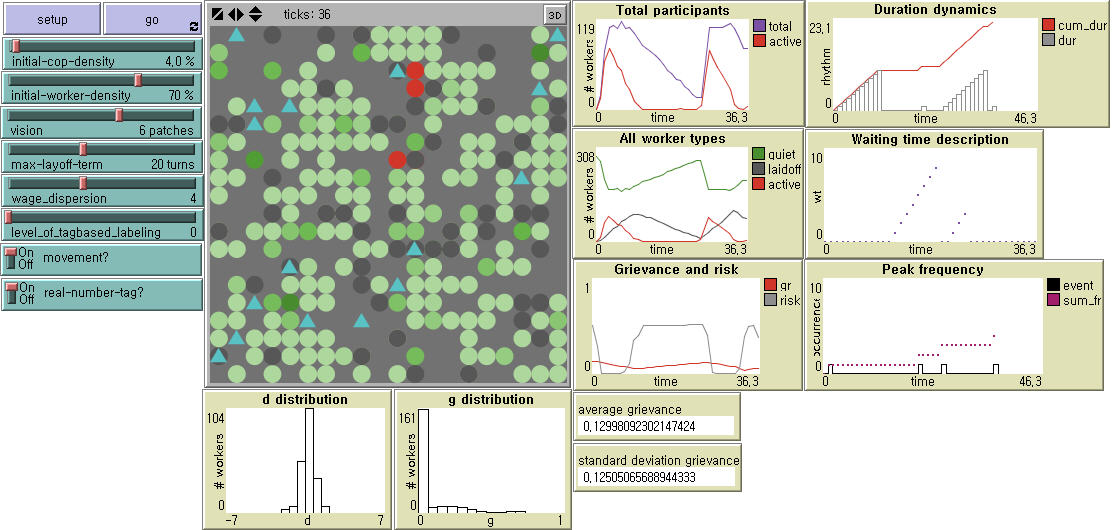
Figure 4. Model Interface Notes: Cops (Triangle); Workers (Circle) - Rebel (Red), Laid-off (Black), Bystanders (Green, with tone reflecting the strength of grievance).
Results
- 5.1
- The patterns of protest observed across the 2,400 runs of the model have a number of common features. The timing and levels of protest are ragged and chaotic. Patterns are not obviously characterized by regular trends or cycles in either the magnitude or timing of events. While the term used in the literature - 'protest cycles' - may seem to suggest regularity, our model does not produce simple patterns. The protest waves in Figure 5 are rather very similar to historical protest sequences (e.g. Figure 1 and 2 in Oliver and Myers (2002)). In almost all runs, the largest uprisings almost always occur at the beginning. The size of the initial protest event is generally larger when wage inequality is greater. The initial protest magnitude is less where workers are more discriminating against 'others.' Also, the overall number of active protesters tends to increase as workers are more likely to discount the benefit of group support.
- 5.2
- If protest events are independent of one another, the distribution of the counts of protests across replications with random starts should follow a Poisson distribution. If the occurrence of one event increases or decreases the likelihood of another, then the distribution of event counts across multiple trials will display over-dispersion (if one event makes another more likely) or under-dispersion (if the occurrence of one protest makes another less likely). We perform the Chi-square test[5] of the event frequency (α = .05). Notice that the equi-dispersion that the conditional mean of the outcome should be equal to its conditional variance is a necessary condition but not sufficient condition for the Poisson distribution. In our experiments, the occurrence of protests (Table 3) follows a Poisson distribution at Experimental ID = 1, 3, 5, and 9. The rest at WD = 2 are over-dispersed. The results never satisfy a Poisson distribution at WD = 4, regardless of the degree of tag-based perception of similarity. All distributions at WD = 4 are under-dispersed. Generally, events are not independent as the degree of wage inequality becomes high; the negative auto-correlation increases. This negative time dependence implies that the chance of protest diminishes with time. In other words, the previous outburst suppresses the next one.
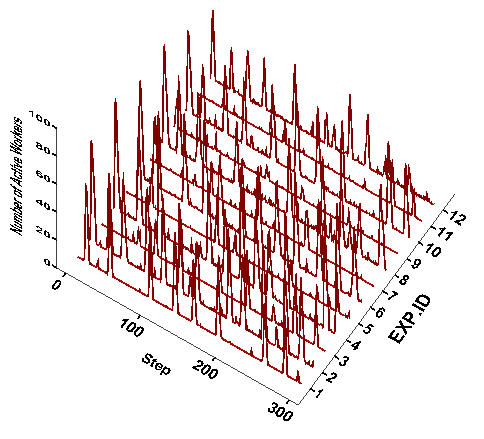
Figure 5. Protest Waves across Experimental Conditions in Table 2 Notes: A randomly selected case out of 100 replications at each experiment condition is displayed. The vertical axis represents the number of active workers.
Table 3: Chi-square Test of Fitting Peak Frequency to Poisson Distribution EXP. ID 1 2 3 4 5 6 7 8 9 10 11 12 Mean 26.94 46.44 24.76 47.54 25.69 48.23 25.60 48.12 25.58 49.77 25.43 49.04 Variance 32.18 30.84 36.97 29.99 34.90 30.54 43.77 45.10 36.80 44.95 38.75 41.81 Variance/Mean 1.19 0.66 1.49 0.63 1.36 0.63 1.71 0.94 1.44 0.90 1.52 0.85 - 5.3
- We present the summary of descriptive statistics of four outcome variables under investigation in Table 4. Across all of the experimental conditions (i.e. 2 x 6 x 2), there are an average of 37 protest events during 300 time steps. The largest protest, on the average, activates 50 workers; the average protest, however, is quite small (4 workers). On the average, protests are not long-lasting. The distribution of the average peak height is highly positively skewed. The distributions of the peak frequency and its average width particularly are less centered with thick tails.
Table 4: Descriptive Statistics of Outcome Variables N Min Max Mean Std.Dev Skewness Kurtosis Event frequency 2400 10 71 36.84 12.90 0.021 -1.28 Maximum peak 2400 5 95 50.18 19.02 -0.084 -0.93 Average protest strength 2400 0.13 14.80 4.08 3.22 0.82 -0.26 Average duration 2400 0.05 0.66 0.31 0.15 0.29 -1.32 Event Frequency
- 5.4
- We present the histograms of the number of protest events across experimental conditions in Figure 6. Protest is more likely to occur as the degree of wage dispersion becomes large, but we cannot tell at this stage of analysis whether or not it is less likely as workers increasingly make distinctions between in-group and out-group. Figure 6 also seems to suggest the possibility of the interaction effects between wage dispersion and tag-based perception of similarity on the protest frequency. To test all these effects, we use the negative binomial regression model[6] instead of the Poisson regression or the zero-inflated regression model because the average peak frequency is much less than its variance, and also the number of 0s is small in the total number of cases (N = 2,400).
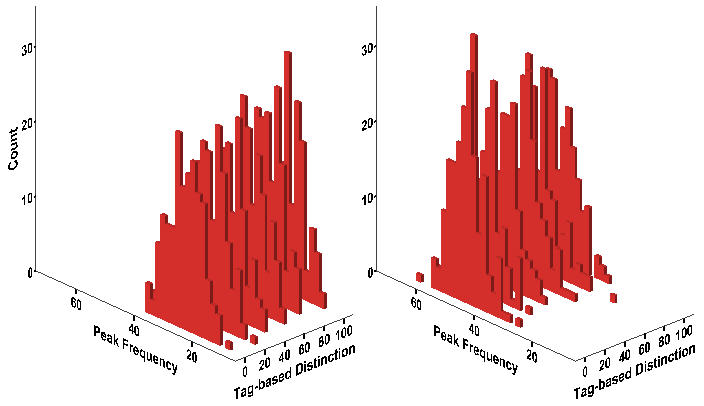
Figure 6. Histogram of Protest Event Frequency Notes: Wage Dispersion = 2 (Left); Wage Dispersion = 4 (Right)
- 5.5
- We use the dummy variables of tag-based perception since the relationship between group identification and event frequency is not necessarily linear. We include five dummy variables such as Tag1 (Tagging = 20%), Tag2 (40%), Tag3 (60%), Tag4 (80%), and Tag5 (100%) in the models where Tagging = 0% is the reference category. Therefore, we test deviations of the levels of tag-based discrimination from the intercept of no discrimination (which is similar to Epstein's model). Higher inequality ( WD = 4) is tested against lower inequality ( WD = 2). In Table 5, two models are specified: Model 1 with the main effects only and Model 2 with the interaction effects between wage dispersion and group support assessment. The incidence density ratio (IDR), as is in a family of logistic regression models, provides the substantive meaning of a regression coefficient b because it corresponds to the odds ratio. Also, (eb-1)*100 reflects the percent change in the expected peak frequency with a one-unit increase in an explanatory variable.
- 5.6
- First, the average peak frequency becomes approximately 90% higher when the degree of wage dispersion doubles. In contrast, it does not increase either sensitively or proportionally to an increase in tag-based group identification. The average increment is very small (about 2.7%), and it is statistically significant (p < .05) only when workers more than 80% estimate both the net risk and the trustworthiness of neighboring fellows in their local areas. We notice that the effect of tag-based perception does not remain significant after including the interaction terms in Model 2 (p < .05). Model 2 indicates that the effect of group support assessment depends on the degree of wage dispersion, given its significant interaction with the higher level of wage dispersion ( WD = 4). The tagging effect is rather negative at WD = 2 although it is not significant. In contrast, it is more than offset by high wage inequality, which leads to the positive net effect at WD = 4. Overall, the effect of group identification on the protest frequency is negligible compared to the effect of wage dispersion.
Notes: * p < .05 ** p < .01 (two-tailed tests). In terms of the global goodness-of-fit, at least one coefficient is not 0 in both models (p < .01 at df = 6 and df = 11, respectively) since the tests show the significant differences in the log likelihood between the baseline model with the intercept only and the full model.Table 5: Negative Binomial Regression of Peak Frequency on Inequality and Discrimination Model 1 Model 2 Variable b SE IDR b SE IDR Tagging = 20% -.00118 .0119 .999 -.0123 .0199 .988 Tagging = 40% .0210 .0118 1.021 -.00988 .0197 .990 Tagging = 60% .0182 .0118 1.018 -.0132 .0198 .987 Tagging = 80% .0400** .0117 1.041 -.0142 .0198 .986 Tagging = 100% .0283* .0118 1.029 -.0199 .0198 .980 WD = 4 .636** .00712 1.890 .582** .0174 1.790 20% x WD = 4 .0701** .0247 1.073 40% x WD = 4 .0478* .0245 1.049 60% x WD = 4 .0487* .0246 1.050 80% x WD = 4 .0835** .0245 1.087 100% x WD = 4 .0743** .0256 1.077 Intercept 3.221 3.256 Pseudo-R2 .182 .183 N 2,400 2,400 - 5.7
- We hereafter employ bootstrapped median regression analysis (Hamilton 2003) - sometimes called quantile regression or least absolute value regression instead of robust regression analysis of the conditional mean for the following three reasons[7]: the maximum peak's height, the average strength, and the average durability violate the assumption of normality, according to the Kolmogorov-Smirnov test; they do not satisfy the equal variance assumption, according to the Levene's test; and there are no influential outliers in the report of Cook's d statistics. Data are re-sampled with 100 repetitions. Consistent with the inferential statistical analysis above, we specify two models. Model 1 has only the main effects, while Model 2 includes the interaction effects. In Table 6 through 8, we include both the dummy variable of the maximum layoff term (i.e. the maximum layoff term = 20 is omitted) and the average risk as covariates. The average risk is the sum of rationally calculable Net Risk (NR) across the population of workers. There is no collinearity between the average risk and the level of tag-based perception.
Maximum Peak
- 5.8
- The texture of protest is determined not only by the frequency of events, but also by their severity. One index of this severity is the size of the largest event, or what we have called the maximum peak. In Figure 7, we present the distribution of the largest protest events across the experimental conditions. First, the maximum peak, on the average, is higher when the level of grievance due to wage disparity is high. It declines as workers are more likely to gauge not only the net risk but also group support by reading tags. Figure 7 also suggests the possibility of the interaction effects on the maximum peak height between wage dispersion and tag-based group identification.
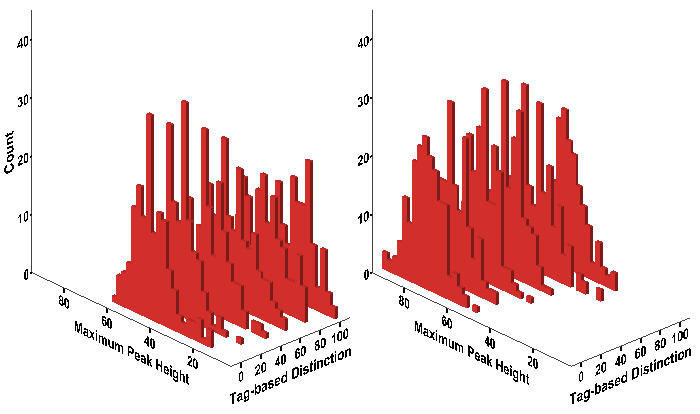
Figure 7. Histogram of Maximum Peak Height Notes:Wage Dispersion = 2 (Left); Wage Dispersion = 4 (Right)
- 5.9
- The regression results in Table 6 first indicate that the median height of the maximum peaks is significantly affected by wage inequality. The maximum strength of worker protest increases when the degree of relative deprivation due to wage disparity is high (p < .01). Also, it is positively and negatively affected by the maximum layoff term and the average perceived risk, respectively (p < .01 for both). It tends to decline significantly as workers are more likely to consider how many workers in their local areas are 'others' (p < .01). However, Model 2 in the right panel shows that the negative effect of tag-based group identification depends on the level of wage inequality. Its effect size significantly increases when workers feel more deprived (p < .01). We note that the interaction effects of tag-based discrimination at the levels of 20%, 40%, and 60% with wage dispersion are not statistically significant at α = .05.
Notes: * p < .05 ** p < .01 (two-tailed tests)Table 6: Median Regression of Maximum Peak on Inequality and Discrimination Model 1 Model 2 Variable b SE B SE Tagging = 20% -2.463** .733 -1.900** .684 Tagging = 40% -5.677** .579 -5.193** 1.128 Tagging = 60% -8.149** .732 -7.490** 1.292 Tagging = 80% -10.290** .688 -12.226** .978 Tagging = 100% -13.388** .902 -16.358** 1.389 WD = 4 18.696** .736 16.656** 1.107 Average Risk -202.269** 12.158 -216.432** 8.402 Max-layoff = 30 2.352** .471 3.175** .615 20% x WD = 4 -.119 1.106 40% x WD = 4 .143 1.485 60% x WD = 4 .198 1.698 80% x WD = 4 -3.989** 1.454 100% x WD = 4 -5.591** 1.578 Intercept 136.557 142.99 Pseudo-R2 .625 .629 N 2,400 2,400 Average Protest Strength
- 5.10
- An alternative approach to indexing the severity of protest is the average number of workers involved per event. The average protest strength (Figure 8) exhibits a similar pattern to that of the size of the largest event (Figure 7). We observe that the more wage inequality, the more the average number of protesters in events; and the more tag-based categorization, the smaller number of protesters on average. Once again, the effect of group identification on the average number of rebels seems to be contingent on the degree of wage inequity.
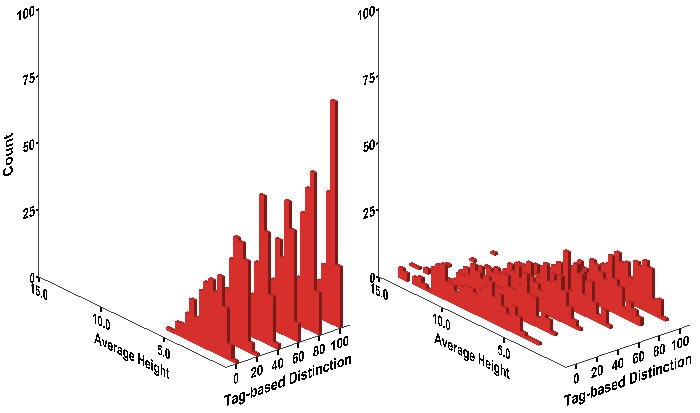
Figure 8. Histogram of Average Protest Strength Notes: Wage Dispersion = 2 (Left); Wage Dispersion = 4 (Right)
- 5.11
- To examine these effects, we perform bootstrapped median regression of the average strength of protest on the same set of variables in the previous analysis. The results in Table 7, consistent with the maximum peak, show that higher levels of inequality markedly increase the average number of protesters (p < .01). The average strength is negatively influenced not only by the average risk but also by the maximum layoff term (p < .01 for both). Worker's discrimination in trusting 'others' significantly reduces the average number of protest participants (p < .01). Lastly, there is also a significant interaction between wage disparity and group identification: the negative effect of discrimination on protest is magnified by higher levels of inequality. All interaction effects in Model 2 are statistically significant (p < .05).
Notes:* p < .05 ** p < .01 (two-tailed tests)Table 7: Median Regression of Protest Strength on Inequality and Discrimination Model 1 Model 2 Variable b SE b SE Tagging = 20% -.111 .0855 -.00268 .125 Tagging = 40% -.333** .0578 -.0515 .0826 Tagging = 60% -.339** .0634 -.0603 .111 Tagging = 80% -.587** .0730 -.247** .0993 Tagging = 100% -.687** .0743 -.231* .118 WD = 4 1.318** .0597 2.154** .0965 Average Risk -65.899** .812 -63.105** 1.177 Max-layoff = 30 -.338** .0382 -.350** .0396 20% x WD = 4 -.349* .151 40% x WD = 4 -.692** .136 60% x WD = 4 -.832** .129 80% x WD = 4 -.929** .133 100% x WD = 4 -1.216** .153 Intercept 33.240 31.660 Pseudo-R2 0.774 0.782 N 2,400 2,400 Average Protest Duration
- 5.12
- The distributions of the mean protest durations across the experimental conditions are shown in Figure 9. Under conditions of higher inequality (right panel), protests are longer, on the average, than under lower inequality (left panel). Regardless of the level of inequality, increased group identification among workers is clearly associated with less durable protests, but to a smaller extent than the protest strength. It seems that not only does tag-based discrimination influence protest duration, but that its effect varies according to the degree of wage disparity.
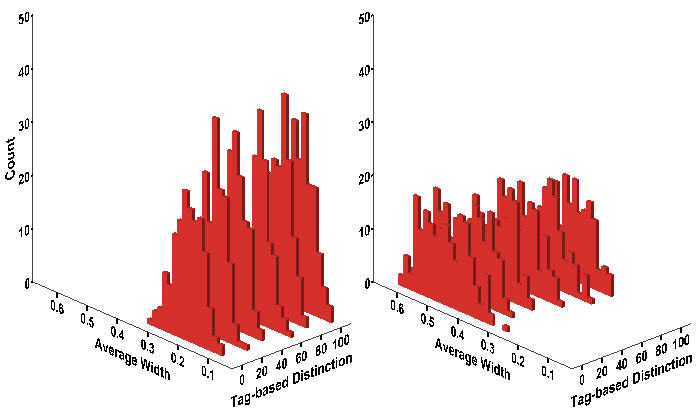
Figure 9. Histogram of Average Width Notes:Wage Dispersion = 2 (Left); Wage Dispersion = 4 (Right)
- 5.13
- The bootstrapped median regression analysis in Table 8 reveals that the more wage dispersion, the more durable worker protest. This positive effect is statistically significant (p < .01). Both the average perceived risk and the maximum layoff term decrease the average duration (p < .01). We find that the more tag-based discrimination, the shorter the duration of the typical protest, but its effect size is much smaller than on the protest intensity. Also, its negative effect is statistically significant only when more than 80% of workers gauge the possibility of support from in-group (p < .05). Protest becomes short-lived as workers are more likely to make distinctions between 'us' and 'them,' but this tendency slightly weakens at the higher level of inequality (p < .05 only at Tagging = 80%). Nonetheless, tag-based distinction significantly reduces the protest duration in terms of the net effect. When all workers assess group support in addition to the net risk, the protest duration is more likely to decrease at the higher level of inequality.
Notes:* p < .05 ** p < .01 (two-tailed tests)Table 8: Median Regression of Protest Duration on Inequality and Discrimination Model 1 Model 2 Variable b SE b SE Tagging = 20% -.0024 .00313 -.00494 .00466 Tagging = 40% -.00560 .00437 -.00657 .00473 Tagging = 60% -.00589 .00392 -.00854 .00473 Tagging = 80% -.0103* .00454 -.0182** .00418 Tagging = 100% -.0195** .00398 -.0216** .00574 WD = 4 .183** .00525 .179** .00482 Average Risk -1.622** .0681 -1.600** .0673 Max-layoff = 30 -.0362** .00255 -.0360** .00204 20% x WD = 4 .00694 .00830 40% x WD = 4 .000715 .00785 60% x WD = 4 .00534 .00714 80% x WD = 4 .0151* .00646 100% x WD = 4 -.00901 .00569 Intercept .967 .959 Pseudo-R2 .774 0.776 N 2,400 2,400
Discussion and Conclusions
- 6.1
- Research on collective behavior since Olson (1965) has been undertaken primarily in the game theoretical context of the social dilemma in the presence of the free-riding temptation (e.g. public goods game as an N-person Prisoner's Dilemma game in Hardin (1971)). The focal agent rationally calculates the expected payoff, which depends on whether or not she protests and also on how many of the others do so. By extending Schelling's idea of 'threshold,' Granovetter (1978) paves the way for the critical mass paradigm which highlights the importance of preference and resource heterogeneity (Oliver et al. 1985) and other factors such as network density and centralization (Marwell et al. 1988) in collective actions.
- 6.2
- In the present study, we instead extend Epstein's model (2002) of civil violence in a different context - workers protest. Workers have different degrees of grievance determined by the difference between their wage and the local average. They protest with probabilities in proportion to grievance, but are inhibited by the perceived risk of being arrested, which depends on the ratio of coercive agents to active fellows in the local area. Agents in our model estimate expected costs and benefits, but they are boundedly rational since they know only about their immediate surroundings (i.e. local vision rather than global vision). Instead of free-riders, we can observe agents show deceptive behavior, as in Epstein (2002), which is contingent on the ratio of cops to probable rebels. In these aspects, we are rather interested in crowd dynamics (e.g.Feinberg and Johnson 1988; 1990) in a broader sense, which is not embedded in the game-theoretic strategic interaction setting.
- 6.3
- Ethnic and racial divisions within the working classes are historically a common feature of many societies. In the post-colonial and globalizing world economy the labor forces of many nations have become more racially and ethnically diverse. The extent to which agents are able to cooperate across group boundaries becomes an ever more important variable in understanding patterns of labor relations and protest action. In order to theoretically examine the interplay between race and class in the dynamics of workers protest, we incorporate the idea of group identification through categorization (Tajfel 1974; Turner 1982) into the current model - people rely on ethnic and cultural markers (called 'tags') to distinguish in-group members from out-group ones (Richerson and Boyd 2001). Workers may want to consider not only the risk as above but also whether or not they are surrounded by tolerably similar fellows they believe to be trustworthy. We present two models. In the main model, workers scale the overall similarity to neighboring fellows. Following Schelling (1971; 1978), we assign binary tags in a single dimension (e.g. the presence or absence of a certain skin color) to them.
- 6.4
- Informed by research concerned with the temporal and spatial dimensions of protest events (Tilly 1978; Olzak 1989; Oliver and Myers 2002; Francisco 2010), we carefully investigate patterns of protest waves such as rhythms, frequency, strength, and duration. The current results indicate that the effects of categorical discrimination among aggrieved workers may be very consequential for various dimensions of protest waves. First, protest rhythms are spiked and ragged rather than cycles with regularity. As in Epstein (2002), long periods of relative stability are punctuated by globalized uprisings. How often the episode of protest emerges fits into a Poisson distribution when feelings of relative deprivation among workers are smaller and all workers fully assess group support. Otherwise, episodes of local uprisings are represented by recurrent events with negative time dependence. Overall, the protest frequency is influenced heavily by wage inequality and slightly by tag-based group identification. However, higher levels of discrimination among categorical populations result in lower volumes of protest, and that the negative effects on the maximum level of protest and its average are accentuated as the degree of grievance due to wage inequality increases. The resilience of protest in terms of duration after it is once synchronized weakens as workers are more likely to consider how many workers in their local area are "others." In general, greater inequality is associated with greater magnitudes of the key dimensions of protest waves such as strength and duration. Increased distinction among potential protesters reduces the magnitudes of those dimensions - and particularly so at a relatively high wage disparity. We confirm that the overall patterns from the proposed model hold true even if workers distinguish 'us' from 'them' through the simplest categorization, but the negative tagging effect on both the intensity of protest and its duration is significantly stronger due to lower levels of trust. In other words, protest events are significantly stronger and persistent when workers are able to make more fine-grained distinctions.
- 6.5
- We seek to identify the core dynamics of workers protest, but empirical validation of our model remains open for future research. We instead draw some considerable theoretical implications here. First, our model provides general features of protest, either civil unrest or workers riot, such as "tipping points" and "punctuated equilibrium," as in Epstein (2002). Second, as in civil violence where going active prematurely may allow the most aggrieved agents to be arrested before they can catalyze the wider rebellion (Epstein 2002: 7247), we suggest that it may be the case with workers protest: higher inequality more frequently generates protests leading to higher levels of arrests, but it retards further protests. Third, our experiments also indicate that group identity may be the key factor in collective behavior. Our study highlights the importance of trust-based coordination in local uprisings and their global synchronization (cf. the bandwagon effect).
- 6.6
- We have made a simplifying assumption that class inequality and race/ethnic inequality are orthogonal. A logical next step in extending our understanding of the interplay of race and class in the dynamics of protest is to build an alternative and more realistic model. Otherwise, an exogenous or endogenous spatial correlation between wage disparity and race/ethnic inequality would lead to different patterns of protest waves at the micro and macro level. The current model also can be advanced as follows: examining roles of 'leaders' who are distinctive from the masses of workers in the threshold level; enabling workers learn 'diversity' over time (instead of bringing laid-off workers with the same tolerance back to the population) under varying scenarios; introducing 'carrot' or wage flexibilization policies in addition to the 'stick' policy of laying off protesters; and allowing workers, instead of random movement, to move more toward tolerably similar fellows or to leave dissimilar ones.
Appendix
- 7.1
- Rhythms of workers protest in the Schelling-type model (Figure 10) are not significantly different from those in the proposed model (Figure 5). We apply the same test to the frequency distribution. First of all, the patterns of its over-dispersion and under-dispersion in the Schelling-type model (Table 9) are very similar to those in the proposed model (Table 3). All distributions at WD = 2 are over-dispersed, while most of distributions at WD = 4 are under-dispersed. As in the original model, the protest likelihood declines over time at WD = 4. Second, according to the Chi-square test at the same significance level (α =.05), the frequency distribution follows a Poisson distribution at Experimental ID = 1, 3, and 7. Protest events tend to be independent as wage inequality becomes low and workers become less subject to tag-based group identification. In contrast, protest events never satisfy a Poisson distribution at WD = 4, which is also consistent with the results from the original model.
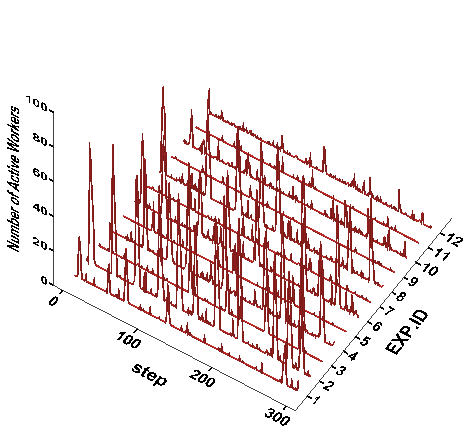
Figure 10. Protest Waves across Experimental Conditions in Table 2 Notes:A randomly selected case out of 100 replications at each experiment condition is displayed. The vertical axis represents the number of active workers.
Table 9: Chi-square Test of Fitting Peak Frequency to Poisson Distribution EXP. ID 1 2 3 4 5 6 7 8 9 10 11 12 Mean 25.86 46.13 26.18 47.87 25.19 50.79 23.84 52.93 22.41 54.58 18.17 47.15 Variance 31.81 32.50 31.92 36.13 41.42 47.45 34.20 56.28 42.01 58.24 28.33 60.40 Variance / Mean 1.23 0.70 1.22 0.75 1.64 0.93 1.43 1.06 1.87 1.07 1.56 1.28 - 7.2
- The distributions of four outcome variables from the Schelling-type model (Table 10) and the proposed model are quite similar (Table 4) except the following respects. First, the strength of the highest protest peak and the average protest strength are significantly weaker when workers assess group support through the simplest categorization. Second, the average duration is a bit shorter. Third, the maximum peak distribution is rather positively skewed. Fourth, the average strength distribution is more centered with thin tails.
Table 10: Descriptive Statistics of Outcome Variables N Min Max Mean Std.Dev Skewness Kurtosis Event frequency 2400 5 74 36.75 14.98 0.12 -1.21 Maximum peak 2400 2 94 33.18 22.80 0.52 -0.89 Average protest strength 2400 0.03 15.10 2.39 2.85 1.60 1.98 Average duration 2400 0.02 0.68 0.26 0.15 0.54 -0.83 - 7.3
- Hereafter, we focus only on the effect of tagging including its interaction effect with wage dispersion. Between two models, there are no significant differences in the effects (i.e. direction and strength) of wage inequality, the average risk, and the maximum layoff term on four dimensions of workers protest. Figure 11 suggests that the effect of tagging on the peak frequency and the interaction effect seem slightly stronger in the Schelling-type model than in the proposed model. Table 11 confirms that, first, the average increment in the peak frequency is almost doubled (from 2.7% to 4.8% in the left panel) although it is trivial. Another difference is that the tagging effect at WD = 2 remains significant in Model 2 when a 60% or greater number of workers distinguish in-group from out-group. Lastly, the positive net effect of tagging at WD = 4 is stronger at a moderate level of tagging (i.e. around 60%).
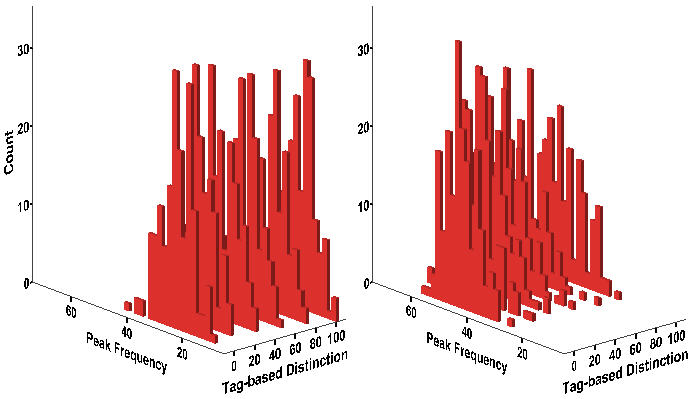
Figure 11. Histogram of Protest Event Frequency Notes: Wage Dispersion = 2 (Left); Wage Dispersion = 4 (Right). Equivalent to Figure 6.
Notes:* p < .05 ** p < .01 (two-tailed tests). Equivalent to Table 5. Shaded areas indicate differences in the statistical significance between two models.Table 11: Negative Binomial Regression of Peak Frequency on Inequality and Discrimination Model 1 Model 2 Variable b SE IDR b SE IDR Tagging = 20% .0273* .0136 1.028 .0121 .0208 1.012 Tagging = 40% .0490** .0136 1.050 -.0264 .0209 .974 Tagging = 60% .0554** .0135 1.057 -.0815** .0212 .922 Tagging = 80% .0547** .0136 1.056 -.143** .0215 .866 Tagging = 100% -.111** .0140 .895 -.353** .0227 .702 WD = 4 .749** .00817 2.115 .579** .0187 1.784 20% x WD = 4 .0249 .0263 1.025 40% x WD = 4 .123** .0263 1.131 60% x WD = 4 .219** .0264 1.244 80% x WD = 4 .312** .0266 1.366 100% x WD = 4 .375** .0279 1.455 Intercept 3.147 3.253 Pseudo-R2 .183 .198 N 2,400 2,400 - 7.4
- Figure 12 indicates that the tagging effect on the maximum protest strength may be stronger in the Schelling-type model and also that it depends on the degree of wage inequality. Table 12 reveals that the maximum strength significantly decreases as more workers assess support from in-group by reading observable binary markers. Especially when more than 60% of workers do so (cf. 80% in the original model), the negative effect of tagging increases at a relatively high wage disparity (p < .01).
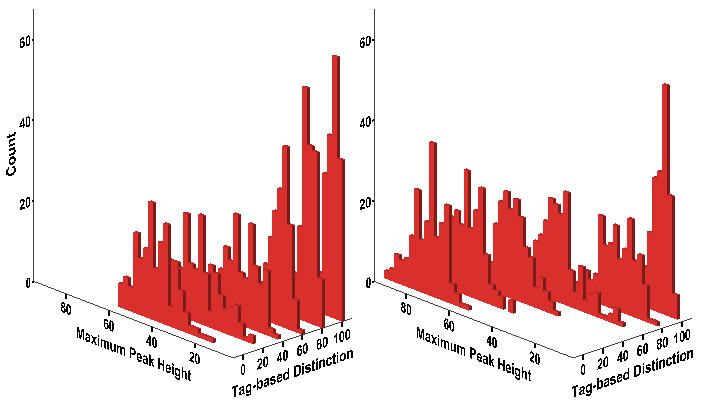
Figure 12. Histogram of Maximum Peak Height Notes:Wage Dispersion = 2 (Left); Wage Dispersion = 4 (Right). Equivalent to Figure 7.
Notes:* p < .05 ** p < .01 (two-tailed tests). Equivalent to Table 6. Shaded areas indicate differences in the statistical significance between two models.Table 12: Median Regression of Maximum Peak on Inequality and Discrimination Model 1 Model 2 Variable b SE B SE Tagging = 20% -6.079** .637 -7.048** 1.201 Tagging = 40% -13.192** .665 -17.121** .895 Tagging = 60% -19.919** .728 -25.810** .883 Tagging = 80% -27.443** .574 -29.703** .818 Tagging = 100% -32.746** .623 -31.527** .901 WD = 4 13.519** .458 20.328** 1.340 Average Risk -267.130** 8.184 -168.060** 11.306 Max-layoff = 30 1.423** .316 .669* .337 20% x WD = 4 .109 1.563 40% x WD = 4 3.149 1.628 60% x WD = 4 4.200** 1.324 80% x WD = 4 -7.252** 1.519 100% x WD = 4 -15.153** 1.198 Intercept 166.725 120.924 Pseudo-R2 .709 .741 N 2,400 2,400 - 7.5
- Consistent with the result from the original model, the average strength of protest is significantly affected by tag-based group identification (Figure 13). The results in Table 13 firstly show that it declines as more workers are subject to the ingroup-outgroup bias based on the simplest categorization. Tagging by relatively small numbers of workers is sufficiently enough to reduce the average number of protesters, which is not the case in the original model. We also find a significant interaction between the main two variables, that is, the negative effect of tagging strengthens when workers on the average feel more deprived.
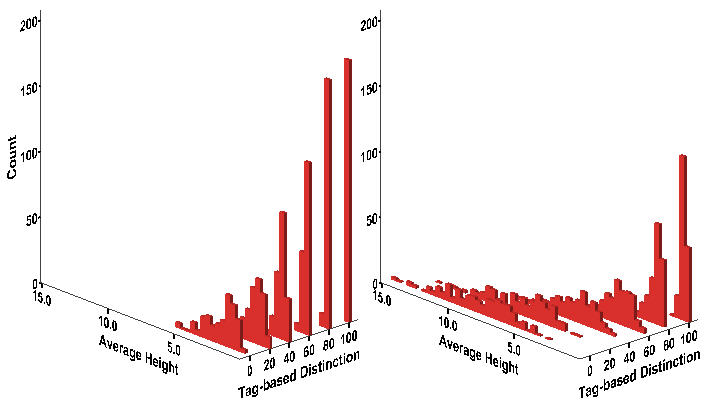
Figure 13. Histogram of Average Protest Strength Notes: Wage Dispersion = 2 (Left); Wage Dispersion = 4 (Right). Equivalent to Figure 8.
Notes:* p < .05 ** p < .01 (two-tailed tests). Equivalent to Table 7. Shaded areas indicate differences in the statistical significance between two models.Table 13: Median Regression of Protest Strength on Inequality and Discrimination Model 1 Model 2 Variable b SE b SE Tagging = 20% -.367** .0797 -.389** .108 Tagging = 40% -.831** .0773 -.694** .0819 Tagging = 60% -.888** .0863 -.758** .0696 Tagging = 80% -.948** .103 -.754** .0785 Tagging = 100% -1.042** .0928 -.812** .0703 WD = 4 .881** .0457 3.277** .165 Average Risk -62.376** 1.336 -42.955** 1.625 Max-layoff = 30 -.138** .0384 -.301** .0297 20% x WD = 4 -.644** .219 40% x WD = 4 -1.606** .176 60% x WD = 4 -2.294** .157 80% x WD = 4 -2.737** .177 100% x WD = 4 -2.995** .178 Intercept 31.761 22.330 Pseudo-R2 0.701 0.755 N 2,400 2,400 - 7.6
- A negative association between tag-based distinction and the average duration of protest is easily noticeable in Figure 14. Besides, its effect seems to be contingent on the value of wage dispersion. The median regression results in Table 14 show that the more tag-based discrimination, the shorter the duration of the typical protest. Also consistent with patterns from the original model, its effect size is significantly smaller than the protest strength, either its maximum or its average. The negative effect of tag-based distinction at WD = 4 somewhat dwindles at a broader range of tagging (from 40% to 80%), whereas it slightly increases when all workers are subject to tagging.
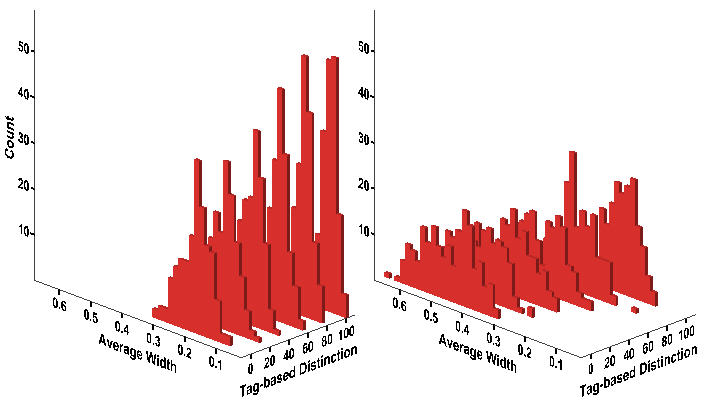
Figure 14. Histogram of Average Width Notes: Wage Dispersion = 2 (Left); Wage Dispersion = 4 (Right). Equivalent to Figure 9.
Notes:* p < .05 ** p < .01 (two-tailed tests). Equivalent to Table 8. Shaded areas indicate differences in the statistical significance between two models.Table 14: Median Regression of Protest Duration on Inequality and Discrimination Model 1 Model 2 Variable b SE b SE Tagging = 20% -.00498 .00394 -.0101* .00421 Tagging = 40% -.0171** .00454 -.0289** .00391 Tagging = 60% -.0280** .00401 -.0417** .00405 Tagging = 80% -.0442** .00441 -.0565** .00344 Tagging = 100% -.0865** .00449 -.0796** .00501 WD = 4 .189** .00269 .178** .00580 Average Risk -1.585** .0409 -1.545** .0575 Max-layoff = 30 -.0348** .00241 -.0340** .00195 20% x WD = 4 .00949 .00819 40% x WD = 4 .0310** .00422 60% x WD = 4 .0361** .00779 80% x WD = 4 .0278** .00708 100% x WD = 4 -.0261** .00713 Intercept .946 .932 Pseudo-R2 .739 0.748 N 2,400 2,400
Acknowledgements
- The authors are very thankful to three anonymous reviewers and Yoshimichi Sato for their great feedback on the earlier versions of this paper.
Notes
-
1 Our model applet and code are available at http://student.ucr.edu/~jkim081/simulation.htm and at OpenABM ( http://www.openabm.org).
2 We re-emphasize here that agents in our model are randomly selected at each stage, which is the same case with Granovetter (1978), where the bandwagon effect (or the so-called "herd instinct") can be more dramatic given a sequential order of interactions. One might address that the 'updating' is asynchronous in Epstein (2002) under which different agents could be exposed to different environments. As in Wilensky (2004), the main stage in our model consists of the first two parts. Since the second stage is simply that the layoff term for protested workers decreases by one per round, protest patterns are not significantly affected by the updating rule even if the maximum jail term is relatively small. The maximum term influences the protest dynamics for a different reason (See Section 3.9 and Figure 3).
3 One reviewer points out that agents may pursue fairness to resist inequitable outcomes as with the model by Fehr and Schmidt (1999): "Inequity aversion is self-centered if people do not care per se about inequity that exists among other people but are only interested in the fairness of their own material payoff relative to the payoff of others (Ibid: 819)." The avoidance of relative deprivation is associated with disadvantageous inequity aversion. We note that agents in our model do not tend to protest if they are in advantageous positions.
4 Our approach is different from incorporating group identity into models of the critical mass. For example, Granovetter (1978: 1429-30) addresses that most collective-behavior literature proceeds as if the groups discussed contained only people who are strangers to one another. He considers that an individual would be activated by estimating the proportion of participants with more (and less) weights given to friends (and strangers) when it is otherwise impossible. "Take a simple case, where the influence of friends is twice that of strangers, and assume that thresholds are given in terms of reaction to strangers. Consider an individual with threshold 50% in a crowd of 100, where 48 individuals have rioted and 52 have not. In the absence of social structure, such an individual would not be activated. But if he knows 20 people in this crowd of whom 15 have already joined the riot, then each friend is to be counted twice. Instead of "seeing" 48 rioters and 52 non-rioters, our subject "sees" [(15 x 2) + (33 x 1)] rioters and [(5 x 2) + (47 x 1)] non-rioters, leading him to form a ratio not of 48/100 but of 63/120 = .525. What we may then call the 'perceived proportion of rioters' in the previous time period now exceeds his threshold, and he will join (Granovetter 1978: 1429)."
5 There are two approaches to measuring the goodness of fit between the observed distribution and the theoretical distribution: the Chi-square test and the Kolmogorov-Smirnov test (KS test). The KS test has some advantages, but the range of its applicability is more limited. Also, its test significance is problematic especially when all parameters of the hypothesized distribution are not known (Law 2007).
6 Since count variables are often treated as if they are continuous, the linear regression model is applied to them although it makes estimates inefficient, inconsistent, or biased. The Poisson regression model is the most basic alternative. However, "either unobserved heterogeneity or positive contagion can generate over-dispersion (Hannan and Carroll 1992: 79)." The negative binomial regression model allows the variance to exceed the mean by incorporating an error term (i.e. unobserved heterogeneity) in the Poisson regression model (Long 1997). Given that the negative binomial regression model cannot handle another issue that the occurrence of an event affects the rate of subsequent occurrences, quasi-likelihood estimation can be an alternative approach to solve both autocorrelation and over-dispersion (Hannan and Carroll 1992).
7 It is not shown here, but analysis of covariance (ANCOVA) produces almost the same results. This approach is, however, inappropriate given the non-normality of outcome variables although it can handle covariates (i.e. the average risk) and interaction effects. One might suggest two nonparametric tests equivalent to one-way ANOVA: the Kruskal-Wallis test for between-subjects; and the Friedman's test for within-subjects (Field 2005). But, neither can model two factors. In other words, the nonparametric technique equivalent to two-way ANOVA with interaction effects has yet to be developed (Sawilowsky 1990). In the Kruskal-Wallis test, a single factor assumes to have 12 levels in Table 2 (i.e. 2 from wage dispersion and 6 from tag-based labeling) given that each independent case contributes to only one score. The results from the KW test and the post-hoc Mann-Whitney test are almost the same with those from bootstrapped median regression of Model 1 without either the average risk or the interaction terms such as Tagging = 20% x WD =4 through Tagging = 100% x WD = 4.
References
-
BERK, R A (1974) A Gaming Approach to Crowd Behavior. American Sociological Review 39(3), pp. 355-373. [doi:10.2307/2094295]
BONACICH, E (1972) A Theory of Ethnic Antagonism: The Split Labor Market. American Sociological Review 37, pp. 547-559. [doi:10.2307/2093450]
BREWER, M B and Silver M (2000) Group Distinctiveness, Social Identification and Collective Mobilization. In Stryker S, Owens T J and White R W (Eds.) Self, Identity, and Social Movements, Minneapolis: University of Minnesota Press. pp. 153-171.
BRICHOUX, D and Johnson P (2002) The Power of Commitment in Cooperative Social Action. Journal of Artificial Societies and Social Simulation 5(3) https://www.jasss.org/5/3/1.html.
BROWN C and Boswell T (1995) Strikebreaking or Solidarity in the Great Steel Strike of 1919: A Split Labor Market, Game-theoretic, and QCA Analysis. American Journal of Sociology 100(6), pp.1479-1519. [doi:10.1086/230669]
COHEN, J L (1985) Strategy or Identity: New Theoretical Paradigms and Contemporary Social Movements. Social Research 52, pp. 663-716.
EPSTEIN, J M (2002) Modeling Civil Violence: An Agent-based Computational Approach. Proceedings of the National Academy of Sciences of the United States of America 99(3), pp. 7243-7250. [doi:10.1073/pnas.092080199]
FEHR, E and Schmidt K M (1999) A Theory of Fairness, Competition, and Cooperation. Quarterly Journal of Economics 114, pp. 817-868. [doi:10.1162/003355399556151]
FEINBERG, W E and Johnson N R (1988) 'Outside Agitators' and Crowds: Results from a Computer Simulation Model. Social Forces 67. pp.398-423. [doi:10.1093/sf/67.2.398]
FEINBERG, W E and Johnson N R (1990) Radical Leaders, Moderate Followers: Effects of Alternative Strategies on Achieving Consensus for Action in Simulated Crowds. Journal of Mathematical Sociology 15(2), pp. 91-115. [doi:10.1080/0022250X.1990.9990063]
FIELD, A P (2005) Discovering Statistics Using SPSS. 2nd Edition. London: Sage Publications.
FRANCISCO, R A (2010) Collective Action Theory and Empirical Evidence. New York: Springer. [doi:10.1007/978-1-4419-1476-7]
GRANOVETTER, M (1978) Threshold Models of Collective Behavior. American Journal of Sociology 83, pp.1420-1443. [doi:10.1086/226707]
HAMILTON, L C (2003) Statistics with Stata: Updated for Version 8. Belmont, CA: Thomson/BrooksCole.
HANNAN, M and Carroll G (1992) Dynamics of Organizational Populations: Density, Legitimation, and Competition. Oxford: Oxford University Press.
HARDIN, R (1971) Collective Action as an Agreeable n-Prisoner's Dilemma. Behavioral Science 16, pp. 472-481. [doi:10.1002/bs.3830160507]
HOLLAND, J H (1996) Hidden Order: How Adaptation Builds Complexity. Reading, MA: Addison Wesley Publishing Company, Inc.
KOLLOCK P (1998) Transforming Social Dilemmas: Group Identity and Cooperation. In Danielson P (Ed.) Modeling Rational and Moral Agents, Oxford: Oxford University Press. pp. 186-210.
KRAMER R M and Brewer M B (1986) Social Group Identity and the Emergence of Cooperation
in Resource Conservation Dilemmas. In Wilke H A M, Messick D M and Rutte C (Eds.) Experimental Social Dilemmas, Frankfurt: Verlag Peter Lang. pp. 205-234.
LAW, A M (2007) Simulation Modeling and Analysis. 4th Edition. NY: McGraw-Hill.
LONG, S J (1997) Regression Models for Categorical and Limited Dependent Variables. Thousand Oaks: Sage Publications.
LUSTICK, I S (2000) Agent-based Modelling of Collective Identity: Testing Constructivist Theory. Journal of Artificial Societies and Social Simulation 3(1) http://www.soc.surrey.ac.uk/JASSS/3/1/1.html.
MARWELL, G, Oliver P E and Prahl R (1988) Social Networks and Collective Action: A Theory of the Critical Mass III. American Journal of Sociology 94(3), pp. 502-534. [doi:10.1086/229028]
MELUCCI, A (1988) Getting Involved: Identity and Mobilization in Social Movements. In Klandermans B, Kriesi H and Tarrow S (Eds.) From Structure to Action: Comparing Movement Participation across Cultures, Greenwich, CT: JAI. pp. 329-349.
OLIVER, P E, Marwell G and Teixeira R (1985) A Theory of the Critical Mass. I. Interdependence, Group Heterogeneity, and the Production of Collective Action. American Journal of Sociology 91(3), pp. 522-556. [doi:10.1086/228313]
OLIVER, P E and Myers D J (2002) The Coevolution of Social Movements. Mobilization: An International Journal 8(1), pp.1-24.
OLSON, M (1965) The Logic of Collective Action: Public Goods and the Theory of Group. Cambridge, MA: Harvard University Press.
OLZAK, S (1989) Analysis of Events in the Study of Collective Action. Annual Reviews in Sociology 15, pp.119-141. [doi:10.1146/annurev.so.15.080189.001003]
REICHER, S D (1984) The St. Paul's Riot: An Explanation of the Limits of Crowd Action in Terms of a Social Identity Model. European Journal of Social Psychology 14, pp. 1-21. [doi:10.1002/ejsp.2420140102]
RICHERSON P J and Boyd R (2001) The Evolution of Subjective Commitment to Groups: A Tribal Instincts Hypotheses. In Nesse R M (Ed.) Evolution and the Capacity for Commitment. New York: Russell Sage Foundation. pp. 186-220.
RIOLO, R L, Cohen M D and Axelrod R (2001) Evolution of Cooperation without Reciprocity. Nature 414, pp. 441-443. [doi:10.1038/35106555]
ROHLINGER, D A and Snow D A (2003) Social Psychological Perspectives on Crowds and Social Movements. In Delamater J (Ed.) Handbook of Social Psychology, New York: Kluwer Academic/ Plenum Publishers, pp. 503-528.
SAWILOWSKY, S S (1990) Nonparametric Tests of Interaction in Experimental Design. Review of Educational Research 60(1), pp. 91-126. [doi:10.3102/00346543060001091]
SCHELLING, T C (1971) Dynamic models of segregation. Journal of Mathematical Sociology 1, pp. 143-186. [doi:10.1080/0022250X.1971.9989794]
SCHELLING, T C (1978) Micromotives and Macrobehavior. New York: Norton.
SIMON, B and Klandermans B (2001) Towards a Social Psychological Analysis of Politicized Collective Identity: Conceptualization, Antecedents, and Consequences. American Psychologist 56, pp. 319-331. [doi:10.1037/0003-066X.56.4.319]
TAJFEL, H (1974) Social Identity and Intergroup Behavior. Social Science Information 13, pp.65-93. [doi:10.1177/053901847401300204]
TILLY, C (1978) From Mobilization to Revolution. MA: Addision-Wesley.
TURNER, J C (1982) Towards a Cognitive Redefinition of the Social Group. In Tajfel H (Ed.) Social Identity and Intergroup Relations, Cambridge: Cambridge University Press. pp.15-40.
WILENSKY, U (1999) NetLogo. Evanston, IL: Center for Connected Learning and Computer-Based Modeling. Northwestern University. http://ccl.northwestern.edu/netlogo/.
WILENSKY, U (2004) NetLogo Rebellion Model. Evanston, IL: Center for Connected Learning and Computer-Based Modeling, Northwestern University. http://ccl.northwestern.edu/netlogo/models/Rebellion.