
 Abstract
- Agent-based models of political party competition in a multidimensional policy space have been developed in order to reflect adaptive learning by party leaders with very limited information feedback. The key assumption is that two categories of actors continually make decisions: voters choose which party to support and party leaders offer citizens a certain policy package. After reviewing the arguments for using agent-based models, I elaborate two ways forward in the development of these models for political party competition. Firstly, theoretical progress is made in this article by taking the role of the mass media into account. In previous work it is implicitly assumed that all parties are equally visible for citizens, whereas I will start from the more realistic assumption that there is also competition for attention in the public sphere. With this addition, it is possible to address the question why new parties are seldom able to successfully compete with political actors already within the political system. Secondly, I argue that, if we really want to learn useful lessons from simulations, we should seek to empirically falsify models by confronting outcomes with real data. So far, most of the agent-based models of party competition have been an exclusively theoretical exercise. Therefore, I evaluate the empirical relevance of different simulations of Dutch party competition in the period from May 1998 until May 2002. Using independent data on party positions, I measure the extent to which simulations generate mean party sizes that resemble public opinion polls. The results demonstrate that it is feasible and realistic to simulate party competition in the Netherlands with agent-based models, even when a rather unstable period is investigated.
- Keywords:
- Agent-Based Model, Voting Behaviour, Mass Media, Empirical Validation
Introduction
- 1.1
- Political processes are usually characterized by stability, but occasionally crises occur that produce large-scale departures from the past (True et al. 2007). Sudden political changes pose difficulties for theories about voting behaviour. It is easy to explain stability, but the more interesting the outcome of an election, the less political scientists are able to give an explanation (Aarts 2005). In the Netherlands, in particular the dramatic May 2002 elections shook up the general picture of relative stability and caused a stream of publications. The incumbent government parties suffered an unprecedented defeat (Van Holsteyn and Irwin 2003) and the elections had a very high level of volatility, even in a European perspective (Mair 2008). The Christian Democrats experienced an unpredicted revival and the stunning breakthrough of the populist newcomer Pim Fortuyn broke records in Dutch political history. Although in 1994 the major coalition parties also suffered huge losses, this was not seen at all as a sign of an unhealthy or unstable democracy (Aarts and Thomassen 2008). De Vries and Van der Lubben (2005: 124) argue that the electoral revolt in 2002 is understandable from a punctuated equilibrium view on politics: a period of relative stability is now and then interrupted by a chaotic period of dramatic change. This article seeks to explain stability and changes in party support in the Netherlands in the period from May 1998 until May 2002.
- 1.2
- Although political party competition is an inherently dynamic system, mainstream models of party competition in political science usually treat party competition as a static phenomenon (Laver 2005; Laver and Schilperoord 2007). In contrast, a promising alternative methodology to deal with complex dynamics is agent-based modelling (ABM). ABM is a simulation technique, especially suited for the investigation of complex social systems with interacting (groups of) agents (Janssen and Ostrom 2006). Kollman et al. (1992, 1998) and Laver (2005) use ABM in order to reflect party competition as adaptive learning by party leaders in an evolving complex system and show that it is a very effective way to investigate the deployment of different strategies of different parties within a multi-dimensional policy space. This article contributes in two respects to the application of agent-based models in political science. Firstly, theoretical progress is made by taking the role of the mass media into account. In previous work it is implicitly assumed that all parties are equally visible for citizens, whereas I will start from the more realistic assumption that there is also competition between parties for gaining attention in the public sphere. With this addition, it is possible to address the question why it is relatively rare that new parties are able to successfully compete with political actors already within the political system. Secondly, I argue that, if we really want to learn useful lessons from agent-based models, we should seek to empirically falsify these models by confronting the outcomes of simulations with real data. To my knowledge, to date, except from the illuminating work of Laver (2005), most of the agent-based models of party competition have been an exclusively theoretical exercise. To give substance to this general argument, in part two of this article I will evaluate the empirical relevance of simulations of party competition in the Netherlands. Using independent data on party positions, I will measure the extent to which simulations generate mean party sizes, as well as time series fluctuations in these, that resemble public opinion polls and election outcomes.
ABM as a theoretical tool
- 1.3
- Complexity theory and agent-based modelling reflects growing awareness that the behaviour of human groups is sometimes highly complex, non-linear, path-dependent, and that collective rationality can arise without any intent on part of the individual agents (Macy and Willer 2002). Pioneers in this field showed how simple rules of individual behaviour explain phenomena such as the emergence of spatial segregation patterns (Schelling 1978) and the evolution of cooperation based on reciprocity (Axelrod 1984). ABM permits one to study how interactions between heterogeneous autonomous agents give rise to macro-level regularities, a characteristic which Epstein (1999) coins 'generative social science' (see also Cederman 2005). Complex system theory challenges the notion that by perfectly understanding the behaviour of each element of a system, we will understand the system as a whole. In situations in which people's behaviour or choices depend on the behaviour or the choices of other people, any simple summation to the aggregates is often misleading. Alternatively, this approach builds the model from 'the bottom-up', focussing on micro rules and seeking to understand the emergence of macro-behaviour (Axelrod 1997). Thus, we have to look at evolving interactions between individuals and their environment in what Miller and Page (2007: 10) call a "social ecosystem". Traditional tools that rely on reducing the system to its atomic elements fail to understand complex worlds as it is impossible to reduce the system without killing it: "the ability to collect and pin to a board all of the insects that live in the garden does little to lend insight into the ecosystem contained therein".
Modelling multi-party competition in a multidimensional space
- 1.4
- As complex interactions between agents, either persons, nation-states or political parties, are essential in political behaviour, agent-based simulation is also a promising method for analyzing political phenomena (for a recent review see De Marchi and Page 2008). The key assumption of models of political party competition is that two categories of actors continually make decisions: voters make the choice which party to support and party leaders offer citizens a certain policy package in order to attract support. With regard to party competition, there are good reasons to move from static spatial models to systematic application of computer simulations using ABMs (Fowler and Laver 2008; see also Miller and Page 2007: 78).
- Although mathematics and computation should be considered as complements rather than substitutes in the development of sound theory, computation-based models are a promising alternative in case of fundamental analytical intractability. Formal modelling usually proceeds by developing mathematical models derived from first principles. Unfortunately, the formal mathematical approach works best for static, homogenous and equilibrating worlds. The entire model has to be kept mathematically tractable and if we want to investigate more complex dynamic worlds, we need to pursue other modelling approaches. Computational models allow us to consider rich environments with greater fidelity than existing techniques permit, ultimately enlarging the set of questions that we can productively explore (Miller and Page 2007: 20).[1]
- Another important reason to shift from analytical to agent-based models is a reassessment of behavioural assumptions about agents: it is possible (though of course not necessary) to implement the hypothesis that agents use adaptive rationality rather than strategically forward-looking rationality (Bendor et al. 2003; Fowler and Laver 2008). Rational choice theorists assume that players choose the strategy with the highest expected utility, given their expectations about what the other players will do. Real people lack global information, infinite reasoning or calculation power and a consistent value-structure (Simon 1983); they are more likely to use trial-and-error behaviour - repeating satisfactory actions and avoiding unsatisfactory ones. Thus, in a complex landscapes like electoral competition, actors search for a satisfactory position, which might be far from optimal (Laver 2005). Evolution not necessarily leads to optimization and often lead to sub-optimal outcomes (Dennett 1995; Macy 1997).
- The third advantage of ABM is that it permits us to explore the inherently dynamic behaviour of a system. Social scientists have often recognized the importance of dynamic analysis (e.g. McAdam et al. 2001) but have been constrained by their tools. With the methodology of computation we are better able to model party competition as a system in continual motion: what political actors do at a certain point in time during the political process feeds back to affect the entire process at one time period later. With ABMs, we "analyze the dynamic processes of party competitions as they unfold, rather than just end-states or equilibria" (Kollman et al. 1998: 157). There is nothing particularly interesting about an equilibrium, which is simply a result, an outcome after something has settled down. Schelling (1978: 26) states that "unless one is particularly interested in how dust settles, one can simplify analysis by concentrating on what happens after the dust has settled".
The role of the mass media
- 1.5
- To date, models of party competition involve one important unrealistic restriction. Take, for example, the model of Laver (2005), where voters adapt their party support in the light of each new profile of party policy positions, and parties adapt to new configurations of voter support. In this process of endless search, it is not explained how and to what extent voters and parties are able to gather information of each others' position. Information should be a crucial aspect when investigating and modelling an election campaign as a dynamic process with co-evolving adaptive actors (De Marchi 1999), but surprisingly, the role of the media is not mentioned.
- 1.6
- Political parties have finite ability to publicly express their views and not all parties are in the equal position to communicate their issue positions in the public sphere. Journalists simply cannot convey all positions of all parties on all issues at any time. Political contention consists of a battle over media attention and information supply in the public sphere (Gamson and Wolfsfeld 1993; Kriesi 2001). The public sphere is a bounded space characterized by a high level of competition (Hilgartner and Bosk 1988). Just as protests that receive no media coverage at all are 'non-events' (Gamson and Wolfsfeld 1993), parties that do not become publicly visible may be considered 'non-parties'. Laver and Schilperoord (2007: 1716) assume that there is a set of parties 'below the radar' of mainstream party competition.
- 1.7
- The willingness of the electorate to undertake an extensive search for information about policy platforms is limited by costs (Downs 1957). De Marchi (1999) includes a constraint of the costs actors will make for acquiring information. Voters have a finite amount of attention they dedicate to political issues and must actively ignore most of the potential information that they encounter, given the inherent limits of information processing (see Simon 1983). Thus, I argue that voters do not necessarily have complete information about party positions. The electorate is unlikely to have full knowledge of all party platforms if this information is hardly presented in the mass media (Jenkins 1999). Gelman and King (1993) conclude that the news media have an important effect on the outcome of presidential elections by conveying candidates' positions on important issues. This 'enlightened preferences' hypothesis is also supported in Britain. Andersen et al. (2005) find that knowledge on party platforms varied according to the level of media attention and better informed voters were more likely to vote for a party that represented their own policy position.
- 1.8
- With this addition, it is possible to address the question why it is relatively rare that new parties are able to successfully compete with political actors already within the political system. The problem of new or marginal parties of being 'below the radar' is not (only) a result of lack of quality, but mostly a result of not gaining any attention. Especially insurgent parties are dependent on the news media for mobilizing popular support (Jenkins 1999). As a necessary condition for winning seats, a new party needs at least a minimal campaign budget and a minimal amount of publicity (Lucardie 2000). Apart from the ideological 'gaps in the market', the success of a new party will depend on the extent to which the newcomer is able to launch a successful promotion campaign. For example, Jenkins (1999) explains the breakthrough of the new Reform party in Canada by its opportunity to get a considerable share of the scarce media resources.
Empirically testing ABMs
- 1.9
- Although more recently an increasing number of scholars are confronting their models with empirical observations (Janssen and Ostrom 2006), most of the agent-based models have been exclusively theoretical exercises and highly abstract thought experiments (Boero and Squazzoni 2005). This implies that only a hypothesis is constructed, but not tested. For example, in a recent article on a tournament on political party strategies, Fowler and Laver (2008: 71) explicitly claim that "our task was not to create the most realistic possible model of party competition". Therefore, like in many other models, the empirical relevance and contribution is doubtful. Is the winning strategy (as generated by this tournament model) in line with observed patterns in real party competition? Do the failing party strategies really perform as bad in reality? The answer may be yes, and crucially, it may be no. It is precisely this latter possibility that qualifies the agent-based computational model as a scientific instrument (Epstein 1999). In line with the critical method (Popper 1973) I argue that an essential purpose of an empirical approach is to generate statements that are consistent with observed patterns. If we really want to learn useful lessons from agent-based models, we should seek to empirically falsify these models by confronting the outcomes of simulations with real data.[2] Therefore, I will evaluate the empirical relevance of different simulations of the party competition in the Netherlands and test the extent to which simulations generate an empirically adequate representation of what really happened.
 Building the model
-
The dependent variable: party support
- 2.1
- The explicandum party support not only entails the election results, but also the variations over time in support. Data on monthly levels of support for the various parties during the period from May 1998 until May 2002 are provided by the polling agency Interview-NSS. Party support is measured by the percentage of people that reported the intention to vote for the party when asked for their choice if parliamentary elections would be held the next day.
The independent variables: assumptions about the setting and the agents
Voter and party distribution in a two-dimensional space
- 2.2
- Two basic breeds of agents are created: voters and candidates. The first step in the simulation is to construct a spatial representation of the policy positions of parties and voters. What are the most realistic and relevant dimensions and how do Dutch parties score on each of these dimensions? I made three important decisions during the construction of the model[3].
- 2.3
- The first issue is whether I should stress the positions on various policy dimensions (a confrontational approach) or mainly focus on the relative importance of each dimension for each party (a saliency approach). The importance parties attach to policy dimensions can be quite distinct from the positions they take on these same dimensions (Benoit and Laver 2006). The Manifesto Research Group (Budge et al. 2001) believes that issues are mostly salient in nature, i.e. parties pay attention to some issues and neglect other, regardless of their positions on these issues. Each party is believed to have a set of issues that 'belong' to it and hence parties emphasize these issues, while rival issues are neglected (Pennings and Keman 2003). However, I will follow other scholars (e.g. Downs 1957; Kitschelt 1995), who argue that issues are generally confrontational and not valence in nature, i.e. parties take up a range of explicit positions at each issue, ranging from fully pro to fully con. Most people who analyze politics are very likely to talk sooner or later about the 'positions' of political actors (Benoit and Laver 2006: 5).
- 2.4
- Secondly, I decide to reduce Dutch politics to two dimensions. The first reason for doing this is that the model should be as parsimonious as possible. Secondly, the assumption of two dimensions seems theoretically sound; several scholars make the same assumption. The first one is the socio-economic divide that consists of promoting raising taxes to increase public services versus promoting cutting public services to cut taxes (Laver and Mair 1999). The second continuum reflects accepting immigration and promoting policies helping immigrants versus opposing immigration and policies helping immigrants. Citizens considered issues related to minorities and refugees as the most important problems facing the Netherlands since the early 1990s (Aarts and Thomassen 2008). I will further refer to the 'cultural dimension'. Using a socio-economic left-right dimension is quite common, whereas it is a lot harder to choose the appropriate second divide as there is considerable variety in the label and content of such a second dimension: libertarian-authoritarian (De Lange 2007), progressive-conservative (Pennings and Keman 2003), social liberalism (Benoit and Laver 2006) or communitarian (Pellikaan et al. 2003). Most of these dimensions include the politics of multiculturalism versus monoculturalism, but also tap other aspects like religious norms (Pennings and Keman 2003) or individual freedom and collective decision modes (De Lange 2007). I will follow Van Holsteyn et al. (2003: 83) who show (using principal components analysis) strong empirical support for the claim that the admittance of asylum seekers and assimilation of foreigners represent a different dimension (besides the traditional left-right dimension) among voters as well parties. I assume that a third religious-secular dimension (Van Holsteyn et al. 2003) plays no substantive role in Dutch politics in the years under investigation. Such an ethical dimension is only relevant to explain the marginal but stable electoral support for two small fundamentalist Christian parties (CU and SGP). Thus, I will exclude these parties from my analysis. These two parties are against marriage between homosexuals and the legalization of euthanasia, issues that are not contested by any other party, not even the Christian Democrats (Van Kersbergen 2008).
- 2.5
- The third decision is how to measure the position of Dutch parties on each of these dimensions. For an overview and comparison of measurement approaches of party positions, see Laver (2001) and Benoit and Laver (2006). The position of the parties on both dimension are derived from an expert judgement scores reported by Laver and Mair (1999). Table 1 presents the scores of the Dutch parties on these two dimensions in 1998. The lower the score on the socio-economic divide, the more a party supports state intervention and raising taxes to increase public services. Low scores on the cultural dimension indicates the party embraces a multicultural society and is against measures to restrict immigration.
Source: Laver and Mair (1999)Table 1: Scores of Dutch parties in 1998 on the economic and cultural dimension (expert-judgement scores). High scores indicate a greater emphasis on the market in socio-economic policy and stronger stance in favour of a monocultural society on the cultural dimension Multicultural vs. monocultural policy dimension Socio-economic policy dimension original score position
(z-score ×10)original score position
(z-score ×10)CDA Christian democratic party 10.50 -0.66 9.50 -0.30 D66 Progressive-liberal party 7.62 -5.83 10.92 2.49 GL Left-wing environmentalist party 2.73 -14.61 4.29 -10.54 PvdA Centre-left labour party 7.90 -5.33 8.44 -2.38 SP Socialist party 12.20 2.39 2.84 -13.40 VVD Conservative-liberal party 15.42 8.17 16.69 13.84 CD Extreme right party 19.70 15.85 14.88 10.28
Note: For the CD, the expert-score is taken from 1994 (Laver 1995) as no score was measured in 1998Voters
- 2.6
- First of all, my assumption is that citizens choose the ideologically most proximate party and all votes are what Van der Brug and Fennema call 'idealistic' (2003: 59). Thus, strategic choices in terms of party size and government formation are neglected. Also a directional model of party choice (Rabinowitz and MacDonald 1989) is not utilized here.[4] Voters calculate the distance each time period and change their party support immediately when another party is ideologically closer. Moreover, it is assumed that the salience of the dimensions is fixed and equal across the two dimensions. This means the distance on the x-axis is just as important as the distance on the y-axis. A third important assumption is that voter preferences are fixed. Although one could be tempted to explain the stunning political changes during the May 2002 election campaign in terms of sudden shifts in the attitudes of the electorate, this hypothesis has to be rejected (Van Holsteyn et al. 2003). This is in line with the communis opinio which holds that Pim Fortuyn finally expressed long suppressed feelings of discontent with multicultural policies. This hypothesis has ample empirical support: relevant attitudes on multiculturalism and immigration policy have been rather stable (e.g. Fennema and Van der Brug 2006), this also holds for the amount of support for ethnic discrimination since 1993 (Coenders et al. 2006). Panel data reveal that already a substantial pool of voters felt negative towards refugees in 1998 (Bélanger and Aarts 2006); the potential electoral success for newcomer LPF already existed for at least eight years (Adriaansen et al. 2005). Sniderman and Hagendoorn (2007) show that strains over Muslims and multiculturalism were apparent long before September 11 and thus not caused by this exogenous shock. Already since the early 1990s, about fifty per cent of the Dutch believe that western European and Muslim lifestyles do not fit well together (SCP 2003). Changes were due to new calculations voters had to make because of the addition of a new product in the electoral marketplace (Van Holsteyn et al. 2003). The Appendix provides more detailed support for the claim that the opinion of the Dutch on the admittance of asylum seekers and integration policy have not changed much by showing data from Statistics Netherlands (CBS 2006). Also on the economic dimension (reducing vs. increasing income differences) the distribution of the public opinion has been quite stable between 1994 and 2002 (Aarts and Thomassen 2008; Van Holsteyn and Irwin 2003).
- 2.7
- In the set-up of the simulation, 10,000 voters are created and randomly scattered in the policy space with a normal distribution around the mean party position in the policy space (x=0,y=0)[5] and a standard deviation of 8. Data of the Dutch Parliamentary Election Study 1998 empirically support the claim that scores of the electorate are normally distributed on both dimensions and not completely independent of each other (see Appendix). Following the latter finding, I impose the modest correlation as indicated by these data (Pearson's r = 0.32) between the voter scores on the x-axis and y-axis. Obviously, the voters' mean position does not necessarily coincide with the weighted mean party position. According to Van der Brug (2007), surveys show that in most West European countries, the majority of the population tends to be more on the left on the socio-economic dimension and to the right on the cultural dimension, compared with the average party orientations. This is also clearly the case in the Netherlands in 1998 (see again Appendix). I will develop my model in line with these findings, but also compare several alternative models in order to check for sensitivity of the parameter settings. More about this issue—the dependence of the outcomes to changes on initial conditions - will be dealt with in the results section. To get an idea of the final picture, Figure 1 shows the distribution of voters and parties in the two-dimensional policy field.
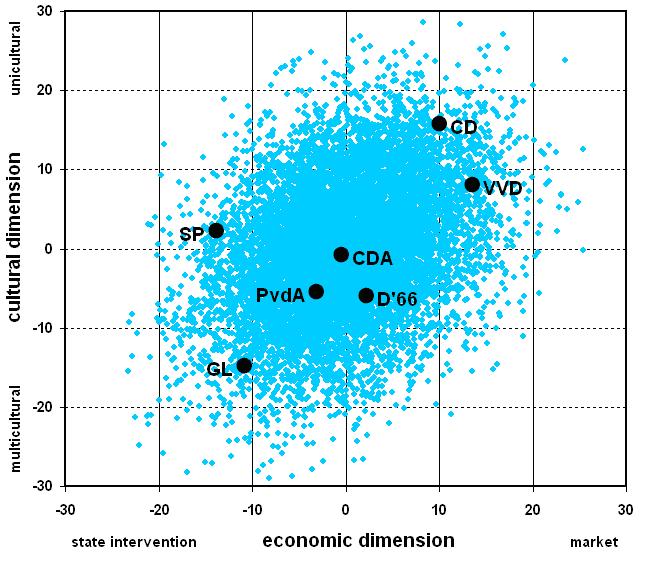
Figure 1. Dutch voters and parties in a two-dimensional space (1998). Immigration policy on y-axis and tax cuts vs. public spending on x-axis Adaptive behaviour of the political parties
- 2.8
- So far, I discussed stable assumptions of the model. Now, I will introduce two parameters that vary during the analysis, labelled 'behaviour of parties' and 'media distortion'. With regard to the behaviour of parties, agents face a dilemma, consisting of the struggle between 'power' and 'ideals'. Parties follow a 'vote-maximizing logic' (Kitschelt 1995) as they want to win elections, but at the same time they prefer to maintain their ideology. The main consequence of this optimization problem is that parties will stay close to their current position and only locally adapt (Kollman et al. 1998).
- 2.9
- Like Kollman et al. (1998), the assumption is that politicians see reactions of the public by polls. I will use three basic political party strategies elaborated and used by Laver (2005) and Fowler and Laver (2008) and adopt their labels 'Sticker', 'Aggregator' and 'Hunter'. A Sticker is a party that is never inclined to change its position. It represents an ideological party leader, who is only concerned with maintaining its policy position and does not seek to adapt its policy in order to increase support. Uncertainty can explain why choosing for a fixed 'ideology' is a natural option (Budge 1994). As the information that polls provide is not unequivocal, even if a party is gaining support it can not be completely sure about what actually influenced voting. An Aggregator sets its policy position every time at the mean position of all current party supporters on both dimensions. Thus, the label "democratic party" might be suited for this party, as it is responding to the preferences of its voters, although I should stress that in this case, the democratic principle refers to the voters, not exclusively to the members of the parties. A Hunter compares its amount of supporters with the amount it had the previous period and moves in the same direction if this move was followed by an increase in support. In case the previous move did not increase support, a Hunter turns around and makes a random move in the opposite direction (it chooses a random value between turning 90 and 270 degrees). I will assume that adaptive parties can only locally adapt (taking steps of 0.5 or 1.0 in the field) from their current position in order to exclude the very unrealistic option that party leaders can make quick and radical jumps and choose any position each run without any costs or consequences. Note that Hunters do not need to use global information on the policy space to allow them to find electorally more successful positions. I assume that a Hunter is 'greedy', i.e. constantly searching for more voters.
- 2.10
- My assumption about the situation in the Netherlands during the period under investigation is that the incumbent government parties were 'Stickers', in line with Kollman et al. (1998) who consider the incumbent party to be fixed while the challenging party is searching an electorally more successful platform. Pellikaan et al. (2007: 298) state that the Dutch political and ideological competition between the conservative Liberal (VVD), social democratic Labour Party (PvdA) and CDA was 'frozen' before 2002. Illustrative of Sticker behaviour is that party leader Kok (PvdA) simply appointed his successor (Andeweg and Irwin 2005). Although several dissatisfied party members of the PvdA and VVD proposed to copy Fortuyn's proposals and modify the electoral programmes after Fortuyn's successes in the local elections in March 2002 (Pellikaan et al. 2007), detailed reports show that neither Hans Dijkstal, the leader of the VVD (Schulte and Soetenhorst 2007), nor Ad Melkert, the PvdA leader (Monasch 2002) had the intention and willingness to move.
- 2.11
- The behaviour of all parties together will determine to what extent there are areas in which there are a considerable number of voters, but no existing parties to meet their political preferences. These voids in the competitive space offer an opportunity for new political parties that may enter the space to serve these neglected voters. The new party Liveable Netherlands (hereafter: LN), entering the arena in June 2001, declared to be a movement for renewal and states old politics to be 'bankrupt'. It is difficult to place LN in the political space as they deliberately started without a clearly defined policy position and only present a brief pamphlet with 25 topics. Van Praag (2003) characterized LN as an anti-establishment-party with a left-populist program, containing a mixture of progressive and more conservative points. It is remarkable that the party feared being associated with extreme right parties. The provisional issue list contains a strong stance against discrimination and racism, but also the proposal of not admitting more than 10,000 asylum seekers every year. As the position of the party wass (not) yet obvious in June 2001, I will give the party a central position, but with a tendency to the economic left (x = -1) and restrictive immigration policy (y= 1). The board of the party explicitly stated that the definite manifesto should be established by the members at the congress held in November 2001. This seems to fit the strategy of an 'Aggregator'. From November on, the manifesto should be considered as 'fixed'. The other newcomer during the election campaign is List Pim Fortuyn. Fortuyn was forced to step down as a party leader of LN in February 2002 after a notorious interview in which he called Islam a 'retarded culture', but founded his own party only two days later, which is, according to Krouwel (2003: 160), an example of a 'business-firm' party with a flexible ideological orientation and demand-oriented approach (Krouwel 2006), which fits the behaviour of a Hunter.
Media distortion
- 2.12
- In line with the 'enlightened preferences' hypothesis, it was argued that the electorate perceives less information on the issue position of a political actor if there is less attention devoted to this actor in the mass media. Thus, it is assumed that it is beneficial for political actors to follow the dictum 'any attention is better than no attention'. The degree of penetration in the population of information about the party's platform is operationalized by the relative amount of media attention for the party (as percentage of the total attention for political parties). Lack of attention (i.e. lack of knowledge about where parties stand) is labelled 'media distortion' and has an impact on the perceived ideological similarity between voter and party. This is done by distorting the perceived distance: the distance is correctly perceived by the voter (and left untouched) when parties get very much attention and conversely perceived as much larger when the amount of attention is small. Reed (2004) uses a similar procedure with a variable called 'voter's information level' which represents the purity of information the voter receives about his or her distance to the candidate's position. A complete lack of attention leads to a maximum distortion by multiplying the distance by 3. Thus, poorly visible agents are not able to fully mobilize its electoral potential. In contrast, parties with the most attention will attract all potential voters. Furthermore, I assume an effect of diminishing returns and thus a non-linear relationship: the more attention a party gets, the less a party will profit from a further increase in attention.[6] An increase from, for example, 0 to 1 % in media-visibility has more impact than an increase of, say, 25 to 26 % attention. The ceiling effect implemented means the higher the amount of attention for a party, the smaller the additional benefit of gaining more attention. The actual ceiling after which there is no distortion anymore is set at about 40%.
- 2.13
- The simulation thus implies that the more a voter is unaware of the position of a party, the higher the change he or she shifts to another party that is the ideologically nearest. Kleinnijenhuis and Fan (1999) found that such a 'proximity model' performs empirically better than pushing voters to the undecided category or spreading them proportionally over all other parties.[7] Admittedly, in case a party suffers from being hardly visible, it is not so obvious why the perceived distance not simply becomes unavailable -a missing value- or a random number, rather than being enlarged. However, the conducted procedure leaves some room for voters to have at least an idea about where a party stands because of other channels than mass media, like networks, personal communication and memory.
- 2.14
- Although the role of the mass media is implemented, its role in this simulation is limited only to an informative effect. Media only help parties by conveying their policy positions; persuasion effects on voters are neglected. One might argue that the assumption used in this article - the more publicity the better - is too simplistic and should be extended: apart from the distribution of attention, also the content of the news matters. Although news on the issue positions of parties is the focal point of political news, it might entail other types of coverage like support and criticism for parties or news on success and failure of political actors (Kleinnijenhuis et al. 2007). However, effects of negative reactions are not so obvious. A party might suffer by continuously being put into a 'bad light', but the condemnation and rejection of a party's message might also enhance diffusion of the message in the public sphere (Koopmans 2004).
Determining the fit
- 2.15
- To measure the extent to which simulations fit the opinion polls and election outcomes, I will calculate the mean absolute difference (MAD) between the simulated party sizes and 'real' party sizes. Laver (2005) uses this property of the data as well. Secondly, I will also use a measurement that is slightly different and similar to the calculation of a standard deviation: I square the absolute differences for each party and take the square root of its average (MAD2). Thus, larger deviations are amplified and more severely punish the fit. For both measures holds that a lower value indicates a better fit of the model. All presented scores are averages of simulations ran 1000 times. The box below presents the model run in a nutshell:
SET-UP:
Make the initial conditions (simulate the situation of May 1998)GO:
- Voters calculate distance to each party
- Distance is distorted by media attention
- Voters choose closest party
- Parties compare new and old amount of support and adapt (or not).
- The system evolves. Start again with (1).
Results
-
The elections in 1998. No serious opposition against the incumbent parties?
- 3.1
- Table 2 shows the Dutch parliamentary election results in 1998 and 2002 and Figure 2 presents time-series of opinion polls tracking changes in party support for the period in between these two snapshots. This Political Barometer shows that levels of support for the various parties is generally quite stable, but during the campaign for the 2002 elections this picture dramatically changes and the competition suddenly turns out not to become as dull as many expected beforehand.
* For 1998 the results of the two parties that formed the CU (GPV and RPF) are combinedTable 2: Parliamentary election results in the Netherlands in 1998 and 2002 May 1998 May 2002 % seats % seats CDA 18.4 29 27.9 43 CU* 3.3 5 2.5 4 D66 9.0 14 5.1 7 GL 7.3 11 7.0 10 LN - - 1.6 2 LPF - - 17.0 26 PvdA 29.0 45 15.1 23 SP 3.5 5 5.9 9 SGP 1.8 3 1.7 2 VVD 24.7 38 15.5 24 CD 0.6 0 - - Others 2.5 0 0.7 0 turnout 73.3 79.1 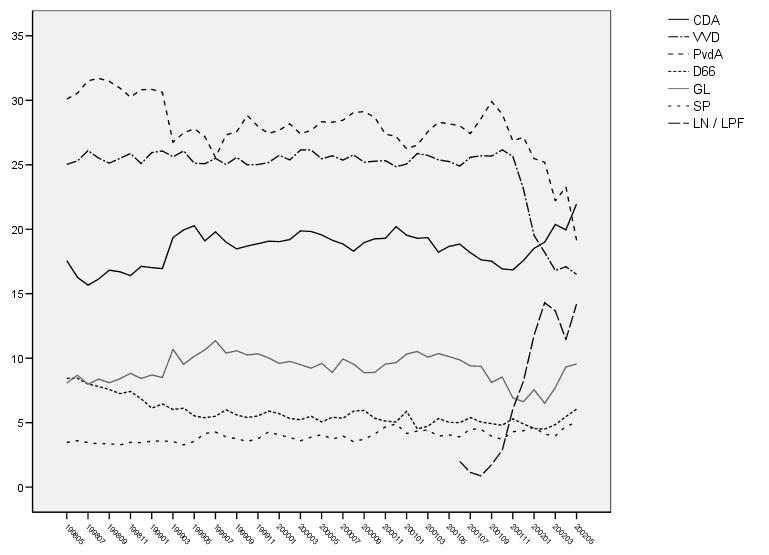
Figure 2. Monthly opinion poll time series of party support in the Netherlands (May 1998 - May 2002) Source: Interview-NSS
Note: Figure does not show all Dutch parties (CU, SGP, LN after February 2002) and therefore percentages do not sum up to 100% - 3.2
- I start to replicate the results of the elections in 1998 and analyse to what extent the simulation is able to predict these outcomes. Table 3 presents the election outcomes and, to give an idea how to interpret the MAD and MAD2 values, the third column shows the values of these fit-measures, based on the polls of NSS-Interview in the week before the election. The MAD and MAD2 are 1.29 and 1.47 percent respectively. The reported standard deviations indicate to what extent the MADs of the different runs tend to deviate from the average fit.
- 3.3
- Model A shows the basic model without imposing any restrictions because of mass media effects. The relatively poor fit of the model is caused by underrating the electoral strength of the Labour Party (PvdA) and conservative Liberal Party (VVD) and an overestimation the size of the Christian Democratic Party (CDA), Socialist Party (SP) and the right-wing extremists (CD). The simulated amount of support for the CDA is about 28 percent and, for the CD, about nine percent, whereas during the elections these parties did not succeed in gaining more than 19.9 and 0.7 percent of the vote respectively. One could perhaps argue that the right-wing Centre Democrats should not be considered as a serious option for voters because it was not perceived as a 'normal democratic party' (e.g. Fennema and Van der Brug 2006). Leaving out the CD indeed improves the results (model B in the Table). However, in this case the problem of overestimating the size of the Christian Democrats is still pressing. According to this spatial representation, the CDA should do electorally well and has a pivotal position in Dutch politics as this party is positioned near the mean position on immigration and also in the centre with regard to the economic dimension. It is remarkable that the CDA was excluded from the government again in 1998. Laver (1995: 18) states that, if this spatial picture is correct, a government without CDA is out of equilibrium and therefore "the purple coalition formed in 1994 should be relatively short-lived."
Notes: Elections and opinion poll percentages are corrected for the exclusion of CU and SGP. For original scores, see Table 2. CD polling percentage is the average estimation of the first three months of 1998Table 3: Simulated and real results for the parliamentary elections in May 1998 (party sizes in percentages, standard deviations are given in parentheses) Elections (6 May 1998) Polls
(2-5 May 1998)Model A Model B
(except CD)Model C
(with media)Model D
(x-1; y+1)CDA 19.9 21.7 28.4 (0.44) 30.0 (0.44) 18.8 (0.40) 19.5 (0.40) VVD 26.7 25.4 11.9 (0.32) 19.3 (0.38) 23.9 (0.43) 23.2 (0.44) PvdA 31.4 30.4 13.6 (0.36) 13.6 (0.35) 26.6 (0.43) 28.4 (0.45) D66 9.7 7.4 15.9 (0.36) 15.9 (0.37) 18.6 (0.39) 15.0 (0.35) GL 7.9 9.7 9.2 (0.29) 9.2 (0.29) 5.7 (0.21) 5.7 (0.24) SP 3.8 4.3 11.7 (0.32) 12.0 (0.32) 5.2 (0.23) 7.1 (0.27) CD 0.7 1.3 9.2 (0.29) - 1.2 (0.11) 1.2 (0.11) MAD 1.29 9.30 (0.12) 7.37 (0.14) 3.10 (0.12) 2.62 (0.12) MAD2 1.47 10.59 (0.14) 9.10 (0.15) 4.11 (0.16) 3.08 (0.15) - 3.4
- Table 4 shows the distribution of news coverage devoted to the parties during the election campaign in 1998. Kleinnijenhuis et al. (1998: 50) conclude that "opposition against the purple government was hardly taken seriously by journalists". Attention for the opposition parties is rather scarce. The figures support the claim that media attention matters for understanding the sizes of the parties, as the parties that should perform much better (according to the simulations solely based on ideological positions) are the ones that have a relatively small amount of media attention. For example, it is shown that the CDA was far from being the centre of attention in the public debate, although the party is ideologically positioned in the centre. Hans Janmaat, the leader of CD—another opposition party that gains far less support than expected—does not even appear on the top 30-list of most mentioned politicians, in contrast to 1994, when he occupied the 8th position (Kleinnijenhuis et al. 1995).
- 3.5
- Model C shows that including the distortion effects of the mass media significantly improves the results of the model. The social democrats now take over the position of largest party from the Christian democrats (models A and B).The only anomaly in the simulation is the considerable size of the D66. Furthermore, it is obvious that the party support for the right-wing Centre Democrats is decimated. This suggests that the strategy of 'hushing-up' the extreme-right is already sufficient to explain the meagre results of the CD as there is not much 'unexplained variance' left in this simulation for which additional hypotheses would be necessary, such as the presumed effects of organizational incompetence or lack of charisma of the party leader. The closer a party is positioned near another party in the arena, the larger the potential effects of 'distance-distortion'. The Labour Party (PvdA) and Christian Democrats (CDA) are positioned rather closely to each other, so particularly their vote shares estimations are more sensitive to different parameter settings.
Source: Kleinnijenhuis et al. (1998: 50)Table 4: Distribution of media attention during the election campaign of 1998 (percentages) CDA 8 VVD 29 PvdA 27 D66 26 GL 4 SP 1 CD 0 - 3.6
- Finally, in model D the assumption of a socio-economic left and socio-cultural right population is implemented. The improved fit supports Van der Brug's (2007) claim as the average voter orientation seems indeed significantly dissimilar from the (weighted) mean political party position. Systematically running all simulations with every possible combination of discrete values as the mean voter positions (not shown in Table) reveals that the Dutch population is positioned slightly left on the economic policy dimension (x -1) and support a more assimilationist approach to integration policies (y +1). The improvement in fit will partly be caused by the huge decrease in support for the left-liberal D66. Finally, I have also explored the sensitivity of the 0.32 correlation between the two dimensions (not shown in Table). Different correlations do hardly have any impact on the overall model fit. Only for one single party (SP), this relationship matters: the higher the correlation, the stronger the amount of support is diminished.
The period from 1998 until 2001: stable Dutch politics?
- 3.7
- The road to the May 2002 election outcome is divided into two episodes. I will analyse the period from May 1998 until May 2001 separately, as in June 2001 a new party, the party Liveable Netherlands, enters the arena. Table 5 presents the measures of fit of the simulations compared with the monthly opinion polls until May 2001. The average scores of the complete period are based on 10,000 runs of 37 months. At the start of each run, the values are of course similar to the scores I presented earlier in Table 3[8]. Additional information about the amount of support for each party (in May 2001) is provided in Table 6.
- 3.8
- Model A is a basic simulation with ideological parties and media-distortion. All party positions are fixed: agents stick to their policy position and small variations over time in party support should be considered as random variation about a mean party size. As no party adapts its position, this gives a rather dull picture as it does not produce any dynamics. To test the hypothesis of ideologically rigid behaviour of Dutch parties during this period, I ran several alternative models with different behavioural assumptions. In trying to reject this model, I will not show all possible alternative models (as distinguishing 7 parties and only 3 strategies would already yield 2187 possible variations) but only the ones that seem most plausible and realistic.
Table 5: Fit measures for simulated amounts of party support, May 1998 - June 2001 (standard deviations in parentheses) Model Party behaviour assumptions MAD MAD2 A All parties are Stickers (ideological) 3.84 (0.24) 4.57 (0.35) B All parties are Aggregators (except CD) 6.24 (1.23) 8.69 (1.73) C CDA, GL, SP are Aggregators (democratic) 5.22 (0.55) 6.94 (0.85) D CDA, GL, SP are Hunters 4.76 (1.14) 5.55 (1.40)
Note: Opinion poll percentages are corrected for the exclusion of CU and SGPTable 6: Simulated and real results for party support, 'end situation' in May 2001 (party sizes in percentages, standard deviations in parentheses) Polls
(9-31 May 2001)Model A Model B Model C Model D CDA 20.5 19.5 (0.40) 15.2 (0.41) 20.6 (0.51) 17.1 (6.34) VVD 27.7 24.4 (0.43) 25.4 (0.80) 17.0 (0.52) 23.9 (1.80) PvdA 30.9 28.3 (0.44) 23.7 (0.67) 29.8 (0.56) 30.7 (5.94) D66 5.5 15.0 (0.32) 27.0 (0.84) 19.3 (0.39) 15.7 (2.58) GL 11.1 5.7 (0.21) 4.8 (0.36) 6.6 (0.36) 5.8 (1.15) SP 4.4 7.1 (0.23) 3.8 (0.44) 6.7 (0.36) 6.9 (1.58) MAD 4.07 (0.12) 7.18 (0.27) 5.47 (0.17) 5.35 (1.23) MAD2 4.92 (0.13) 9.89 (0.36) 7.43 (0.20) 6.32 (1.54) - 3.9
- Model B assumes that all parties are Aggregators, which implies that all parties set their policy positions at the mean positions of their voters. The fit is worse (MAD2 = 8.69) in comparison with the first model, especially because D66 increases its party size considerably and CDA is worse off. Model C assumes that incumbent parties are fixed and the opposition parties continually seek to represent its supporters. This assumption seems to better reflect the party support during this period (MAD2 = 6.94), but is still significantly worse than the 'all Stickers' model. Especially the loss of support for the conservative liberal VVD is decreasing the fit. Perhaps opposition parties were more ambitious and actively tried to attract more voters. Model D shows the results for the 'greedy Hunter': When the previous move was followed by an increase in party support, the parties decides to move further in the same direction with one step and reverses and browses (also with a 1.0 step) when the last move did not increase support. This model has a significant better fit than the 'aggregator' models, but still cannot beat the 'ideological' model.[9]
- 3.10
- Interestingly, according to these simulations, opposition parties are not able to profit when they switch from Sticker to Hunter. Nor does being 'democratic' instead of 'ideological' increase support for the Socialist Party (SP) and Green-Left party (GL). Only the Christen-Democrats (CDA) achieves a slightly larger share of the vote when the opposition parties aggregate. It is worth to note that the 'opportunistic opposition' model D is far from robust. The range of predicted party sizes over similar 37-cycle runs is remarkably large as indicated by the standard deviations. While the estimated final party sizes only slightly differ from those of the model A, the final party position clearly gets more unpredictable in case of the 'blind' Hunter strategy. It contains a larger 'random component' and involves more risks, especially for the CDA (sd = 6.34). Thus, assuming a normal distribution, in 16 out of 100 runs they will score about at least 23 per cent, but likewise also at least 16 runs will yield a significant loss of at least 6 per cent of the vote.
- 3.11
- In sum, we have to conclude that all parties seemed to have stuck to their position, at least until 2001. Keep in mind that I have assumed that no changes occur in the mass media attention, which implies that journalists see no reason to change their focus and the ruling government parties, prominently visible during the election campaign in 1998, preserved their prominence.
The birth of Liveable Netherlands: a successful innovation?
- 3.12
- As explained earlier, the position of Liveable Netherlands was (not) yet clear in June 2001, so I will give the party a central position, but with a small tendency to the economic left (x = -1) and a restrictive immigration policy (y=1). The first opinion polls in June 2001 indicated that LN gained 2 percent of the votes, which is impressive for a newly founded party. In November 2001, the amount of support has risen to about 6 per cent. I assume the party is an Aggregator until the second party congress in November, which implies that the final position depends on what supporters the party initially starts with and thus where one places the party in the policy space in June 2001. Table 7 shows the effects of assuming alternative start policy positions on the potential party support and party position in November 2001 according to my model (ceteris paribus). These models are run without giving any media attention to the new party (distance distortion = 3). I have also shown the party position and amount of support in May 2002 in case LN would have continued to aggregate. It is shown that adapting to the voters' mean position causes a shift of the party position, especially on the y-axis. Interestingly, the Table shows that fixing the party position in November at the mean voter-position (the consequence is that the party stops being democratic) is an electorally sub-optimal outcome. A slightly larger 'niche' (of about 8 percent) is found elsewhere, around y = 9.9, which is a stronger mono-culturalist/anti-immigration position than the established party with the most critical stance on immigration (the VVD) in 1998 (y=8.2). Also models B (0)(0) and E (1)(1) show a considerable move upward on the y-axis to a more favourable position. According to Pellikaan (2004: 217), who presents party positions based on the coding of 20 items in the party manifestos, the final position of the LN and LPF is (0.1)(7.0) and (3.6)(15.9) respectively, which is a considerably higher score, but in line with the shift on the cultural dimension. A party that starts in the more crowded positions (0)(0), (-1)(-1) or (+1)(-1) gets sometimes stuck at its position and is 'redundant'. Some expect this to be the fate of the LN (Wansink 2004).
Table 7: Effects of the start position of Liveable Netherlands on party support (in percentages, standard deviations in parentheses) and position in Nov 2001 and May 2002 A B C D E June 2001 Position (x)(y) (-1.0)(+1.0) (0.0)(0.0) (-1.0)(-1.0) (+1.0)(-1.0) (+1.0)(+1.0) Support 1.56 (0.13) 0.25 (0.05) 0.28 (0.06) 0.76 (0.08) 1.99 (0.13) November 2001 Position (x)(y) (-2.2)(3.9) (0.5)(1.2) (-2.1)(-1.4) (2.6)(-0.9) (2.7)(3.7) Support 7.83 (0.40) 1.93 (0.34) 1.06 (0.17) 1.92 (0.24) 6.32 (0.27) May 2002 Position (x)(y) (-3.6)(9.9) (0.2)(8.0) (-5.7)(2.0) (4.9)(3.3) (-0.4)(8.8) Support 8.11 (0.32) 8.88 (0.39) 5.73 (0.86) 5.21 (0.36) 8.96 (0.29) The 2002 election campaign: the breakthrough of Fortuyn and re-birth of the CDA
- 3.13
- I will now move to a dynamic model (from June 2001 until the May 2002 elections) including the other parties. Table 8 present results the average fit of the simulations and Table 9 shows the simulated party sizes for the 'end situation' in May 2002. Again, I start as simple as possible in order to keep track of the effects of different parameters in the model. Model A is a basic model in which Liveable Netherlands does not get any media attention and the internal strife between Fortuyn and the board of LN is neglected.[10] In model B the split in the party is added and LPF makes its entrance into the political arena in February 2002. As just shown, setting the policy at the mean voter position means that the party should continue to modify its policy position. So far, the simulations have set the amount of media attention for both LN and LPF at zero. In spite of this severe disadvantage, Fortuyn is able to yield 7 percent of the votes (about 10 seats in parliament) while Liveable Netherlands gains 6.4 per cent. This outcome partly contradicts the notion that the success of the newcomers was just a 'hype' created by the media.
- 3.14
- In model C, it is easier for the Dutch electorate to take notice of LN after August 2001 (media = 1), in line with the idea that the party profited from a 'Fortuyn-effect' (Chorus and de Galan 2002) because of the involvement of a publicly well-known person. In order to keep the total amount of attention at 100 percent, I assume this is at the expense of the three purple government parties. The fit measures of the simulation become worse over time, which will be mainly due to the remarkably recovery of the Christian Democrats during the last months. With 17.9 % still the country's third biggest party in January 2002 (the PvdA and VVD gain 24.5 and 18.8 per cent respectively in that month)—in line with the simulations—the CDA wins an unexpected landslide victory (29.6%) in May 2002.
- 3.15
- Model C2 implements the assumption that Fortuyn is 'hunting' in order to attract as much support as possible, no matter what ideological platform that delivers. In line with the general findings of Laver (2005), Aggregating tend to do better at winning votes than Hunting. Remarkably, this alternative adaptation scenario, in which Fortuyn is not a 'democratic', but an 'opportunistic' party leader results in striking differences in the party position in May 2002. In general, an Aggregator delivers a much stronger anti-immigration view (y = 11.5) in comparison with a Hunter (y = 5.1). Guided by this strategy, the LPF is not inclined to shift on the cultural dimension (y-axis) after the split-up with LN.
Table 8: Fit measures for simulated amounts of party support, May 2001 - May 2002 (standard deviations in parentheses) and simulated end positions of LN and LPF Model Assumptions Position LN
Nov 2001Position LPF
May 2002MAD MAD2 A *Only LN (no split-up)
*LN = Aggregator (until Nov 2001) and becomes Sticker
*media = 0%(-2.2)(4.0) - 4.58 (1.60) 5.50 (1.57) B *LPF = Aggregator
*media LN & LPF = 0 %(-2.2)(4.0) (-3.7)(10.7) 4.11 (1.23) 5.15 (1.27) C *media LN = 1% (until Feb 2002) *media LPF = 1%
*LPF = Aggregator(-2.3)(5.1) (-3.5)(11.5) 4.17 (1.14) 5.20 (1.12) C2 *LPF = Hunter (-2.3)(5.1) (-2.1)(5.1) 4.32 (1.03) 5.41 (1.14) D *media LPF = 9% (from Feb 2002)
*LPF = Aggregator(-2.3)(5.1) (-2.0)(10.5) 3.90 (0.81) 5.03 (0.87) D2 *LPF = Hunter (-2.3)(5.1) (-2.2)(5.2) 4.46 (0.91) 5.70 (1.21)
Note: Election and opinion poll percentages are corrected for the exclusion of CU and SGPTable 9: Simulated and real results for party support, June 2001 - May 2002 (party sizes in percentages, standard deviations in parentheses) 2002 May Elections Polls May 2002 Model B Model C Model C2 Model D Model D2 CDA 29.6 23.2 12.4 (0.38) 13.2 (0.34) 11.5 (1.03) 13.3 (0.32) 9.7 (1.20) VVD 16.3 17.4 21.7 (0.40) 20.1 (0.45) 22.2 (1.04) 16.3 (0.41) 18.3 (1.13) PvdA 16.0 29.1 24.8 (0.44) 24.1 (0.43) 24.5 (0.92) 22.9 (0.43) 21.6 (0.61) D66 5.4 6.4 15.0 (0.36) 14.9 (0.38) 14.9 (0.41) 14.6 (0.34) 14.6 (0.30) GL 7.4 10.1 5.7 (0.25) 5.8 (0.24) 5.7 (0.27) 6.1 (0.26) 6.1 (0.25) SP 5.6 5.3 7.0 (0.26) 6.8 (0.25) 7.0 (0.36) 6.6 (0.24) 6.3 (0.41) LN 1.6 2.3 6.4 (0.31) 6.2 (0.26) 2.8 (1.62) 4.2 (0.23) 0.6 (0.54) LPF 18.0 15.0 7.1 (0.30) 8.8 (0.34) 11.4 (1.85) 16.0 (0.37) 22.9 (1.28) MAD 2.40 7.45 (0.11) 6.82 (0.13) 6.65 (0.56) 4.95 (0.12) 5.57 (0.34) MAD2 3.12 8.93 (0.13) 8.31 (0.14) 8.52 (0.54) 7.18 (0.13) 8.26 (0.43) - 3.16
- In the final models (D and D2) the outcome is shown when we implement a strong increase in media attention in February 2002, when Fortuyn is removed as LN leader after stating that Islam is a 'retarded culture' and starts his own party. I will set the amount of attention at 10 per cent from that moment on. Communication scholars showed that the average amount of 'issue news' for the LPF was 9.7 percent during the 2002 election campaign, and taking all sort of news into account, Fortuyn attracted no less than about 25 percent of all attention (Kleinnijenhuis et al. 2003). Not surprisingly, in the models the amount of support for LPF is boosted. This addition increases the average accuracy of the prediction of the opinion polls series (MAD = 3.90; MAD2 = 5.03). Model D is superior, both in terms of the average fit over the months (Table 8) and prediction of the election outcomes (Table 9). Although the greater size of the LPF is empirically more correctly, this increase is partially at the expense of the CDA. This second part of the prediction is clearly falsified by the sudden resurrection of the Christian Democrats just before the 2002 elections.
- 3.17
- Thus, all in all, with these simulations the election outcome in May 2002 is still rather difficult to grasp.[11] Nine days before the elections Fortuyn is assassinated by a left-wing environmental activist. Political campaigning was put aside by all parties after the murder.[12] We can only speculate on the precise impact of this event, but it seems likely that many of the supporters who realized that the party leader of the LPF was irreplaceable, suddenly shifted to the ideologically closest CDA, the only uncontroversial opposition party (Irwin and Van Holsteyn 2004). The evolution of the fit values over time shows a striking spike in the last period (in model D the average MAD = 4.62; MAD2 = 6.88). It should be noted that opinion polls from May 2 also predict the results of the electoral contest relatively poorly. These figures suggest that the assassination has indeed significantly boosted support for the CDA and severely damaged the PvdA and Green Left party. Particularly these later two parties were accused of having 'demonised' Fortuyn - and thus having instigated a harsh political climate in which such a murder could take place (Irwin and Van Holsteyn 2004).
- 3.18
- Like all random shocks, it would theoretically not be very useful to try to implement specific parameters to capture this rare event. Otherwise a model will be too specialized and detailed to fit any regularities except the particular regularities for which we have constructed it. For all attempts to explain empirical regularities, eventually, a certain amount of simplification is inevitable. Thus, the remarkable re-birth of the CDA seems partly a product of a random chance event and thus a matter of "sheer luck" (Van Kersbergen 2008).
- 3.19
- Nevertheless, to the extent that the recovery of the CDA was not correctly predicted by the simulation because relevant general explanations for fluctuations in electoral support were neglected - in other words: when part of the 'unexplained variance' is due to omitting important variables, rather than one random event in the last period - it can be theoretically useful to improve the model by adding or modifying parameters. The CDA had already become the biggest party in the May 2002 polls (23.3%), a couple of days before the murder. The assumption that a lot of media attention is by definition favourable is perhaps a good example of a parameter that can be adjusted in future research. That the three losers D66, VVD and PvdA are positioned in different parts of the political spectrum, but have in common that they formed the ruling coalition, suggest that not only the amount, but also the nature of the media coverage might have had a huge impact. Although the CDA did attract a relatively small amount of issue news attention (7.6%), it did not suffer from the widespread image of the country being 'in a mess' caused by the government parties (Kleinnijenhuis et al. 2003). Moreover, the CDA profited from a non-aggression contract with the LPF: the party leaders did not publicly attack each other during the campaign (Van Kersbergen 2008).
Conclusions and discussion
- 4.1
- In this article I have analysed political party competition using ABM, as introduced by Kollman, Miller and Page (1992; Kollman, Miller and Page 1998) and further elaborated by Laver (2005) and colleagues (Laver and Schilperoord 2007; Fowler and Laver 2008). The key assumption of these models is that two categories of actors continually make decisions: voters make the choice which party to support and party leaders offer voters a certain policy package in order to attract support. I have explained why ABM is a promising theoretical tool for the analysis of party competition as it offers three improvements in the construction of testable propositions about political phenomena. Firstly, ABM generates propositions about the mechanism at work responsible for generating outcomes on the macro-level. Secondly, the theory does not need to include unrealistic assumptions of fully rational forward-looking actors, but assumes adaptive rationality instead. Thirdly, this methodology gives more precise statements than words as ABM forces scholars to be explicit about their assumptions. Kollman et al. (2003: 8) state: "Computational models are a good middle ground between verbal theories that are flexible but have limited built-in checks on rigor and mathematical theories that are rigorous but demand extreme simplification for tractability". Concerning ABM models of party competition, I have argued that propositions explaining fluctuations in party support over time should take the role of the mass media into account. In previous work it is implicitly assumed that all parties are equally visible for citizens, whereas severe competition between parties for gaining attention in the public sphere seems far more realistic.
- 4.2
- As most of the agent-based models of party competition have been an exclusively theoretical exercise, the second part of this article was devoted to an empirical illustration by confronting the outcomes of simulations with real data. I believe that the relevance of this work extends beyond this particular case, as it can encourage other scholars to empirically test ABMs—thus making simulation work more valuable for a much wider academic public. For a broad range of related simulations, it could be fruitful to adopt a similar procedure for measuring the 'degree of fit'. Relevant empirical data, like longitudinal public opinion surveys and protest event data, have become increasingly easier accessible. In addition, the procedure used for modelling mass media effects and competition between groups might be applicable in similar settings, for example mobilisation of ethnic groups (Srblinovic et al. 2003), competition between social movements (Oliver and Myers 2003a) network and media effects on protest waves (Oliver and Myers 2003b), the dissemination of cultural diversity (Axelrod 1997) and extensions of Axelrod's model with media effects (González-Avella et al. 2007; Shibanai, Yasuno and Ishiguro 2001).
- 4.3
- The results demonstrate that it is feasible and realistic to simulate and test party competition with agent-based models. I measured the extent to which simulations generate mean party sizes, as well as time series fluctuations in these, that resemble public opinion polls and election outcomes from May 1998 until May 2002. It is shown that models with mass media assumptions yield significantly better results compared with simulations solely based on political party positions. Competition for electoral support does not only involve finding a favourable policy platform, one should also make sure that potential voters take notice of your policy position by publicly airing your views. Especially if we do not want to exclude small parties beforehand from our analysis or explain why attempts of political newcomers are rarely successful, models without the 'media factor' are clearly incomplete.
- 4.4
- However, the simulation has problems with tackling the last couple of turbulent months before the 2002 elections. Especially the elections outcome itself is difficult to grasp. Although the surge of the LPF is the most prominent phenomenon in virtually every account on the Dutch election campaign in 2002, the simulation has clearly more troubles with explaining the remarkable Christian Democratic phoenix and unprecedented defeat of the Labour party. 'Unexplained variance' is partly due to random events, like the assassination of Pim Fortuyn. When deviations between predicted and actual outcomes result from omitting important general explanations for fluctuations in electoral support from the model, it will be fruitful to improve the model by adding or modifying parameters.
- 4.5
- In general, the list of possible extensions of models of party competition is virtually unlimited. I have ignored, for example, assumptions about the loyalty of voters (they won't switch immediately to another party) or non-voting (voters will stay home in case of large ideological distances between the voter and all parties). Furthermore, one could add more policy dimensions or assume differences in the evaluation of the distances (voters might find the position on one axis more important than the distance on another axis). It was also already mentioned that future work could explore more sophisticated models concerning the role of the media by including not only the amount, but also the content of the news coverage.
- 4.6
- However, for all attempts to explain empirical regularities, one should keep in mind that eventually, for a model to be useful, a certain amount of simplification is inevitable. As Schelling (1978: 89) puts it: "models tend to be useful when they are simultaneously simple enough to fit a variety of behaviours and complex enough to fit behaviours that need the help of an explanatory model". If a model is too parsimonious, it may explain only very simple events, for which we may not need ABM. Alternatively, if the model is extensive and complicated, it may be too specialized to fit any events except the particular events for which we constructed it.
- 4.7
- Although this is not an easy task, future models should pursue to incorporate the dynamics of the media 'endogenously' in the model, in order to avoid a partially 'deus ex machina' style of explaining fluctuations in party support. In this article, I gave the parties different amounts of attention (based on independent data collected during the campaign), but instead we should try to implement media attention as a variable to be predicted by the model. For example, I have assigned more media attention to Fortuyn after his notorious interview with the Volkskrant, which leaves the question unsolved why the same statements a couple of months earlier in another newspaper Rotterdams Dagblad failed to provoke such an excessive amount of attention of other journalists. It also involves the question why political actors decide to react on a certain message of another competitor in the public sphere (thereby increasing its newsworthiness), whereas the multitude of other public claims are simply ignored.
- 4.8
- The consequence of modelling media as a 'dependent variable' is that the strategic behaviour of parties should get a wider meaning and could refer as well to competition for attention and support from journalists and 'gatekeepers', rather than electoral competition only (as in the model presented here). Communication research can provide more insight about so-called 'news values' (Galtung and Ruge 1965) that influence the decisions of journalists to assign much prominence to certain political actors, and far less to others. Faring well in opinion polls seems one important factor increasing prominence. Thus, modelling both 'party support' and 'media attention' endogenously would yield a self-reinforcing process in which increasing support raises the amount of mass media attention and in turn, more public visibility further boosts the opinion polls. Such a feedback mechanism, which was empirically demonstrated for the rise of Fortuyn (Koopmans and Muis 2009), explains why political relations that had been relatively stable can suddenly spiral out of equilibrium. When positive feedback processes enter a system, the dynamics of the competition is fundamentally altered, which can lead to 'large events' (Miller and Page 2007) or 'information cascades' (Watts 2003) as happens in fads, revolutions, riots or stock market crashes (Macy and Willer 2002; Biggs 2003). Positive feedback makes outcomes less predictable beforehand as self-reinforcing processes can be explosive, while self-correcting processes, by their nature, prevent dramatic changes (Baumgartner and Jones 2002).
- 4.9
- In line of the idea of demand and supply on an electoral market, the entree of Pim Fortuyn on the political stage turned out to be a successful innovation. What makes successful innovations so hard to understand and difficult to predict beforehand is that in many cases it has not only something to do with the individual characteristics or quality of the product, but also with the pattern of interactions. To be able to spread from a source to an adopter, an innovation needs a channel, a role that seems to be fulfilled to a large extent by the mass media nowadays.
Appendix. Assumptions about the electorate
- A.1
- This appendix provides more detailed empirical background for the assumptions made about the Dutch electorate. First of all, more support is presented for the claim that preferences on multiculturalism were rather stable. Table 10 indicates that public opinion on the cultural dimension has not changed much during the late nineties.
Source: CBS (2006)Table 10: The opinion of the Dutch population on the multicultural society (percentages, 1997-2002) 1997 1998 1999 2000 2001 2002 The influx of asylum seekers should... Be possible without restrictions 8 9 8 9 8 7 Be restricted 73 76 75 75 76 77 Be completely halted 19 15 17 16 17 16 Dutch ethnic minorities should... Be able to maintain their own culture 4 4 3 3 3 2 Be able to maintain their own culture to a large extent 7 8 7 7 6 5 Neither maintain their own culture, nor adapt to Dutch culture 35 35 36 34 34 32 Adapt to a large extent to Dutch culture 28 29 29 30 32 33 Adapt completely to Dutch culture 26 24 25 26 25 28 - A.2
- I use the Dutch Parliamentary Election Study of 1998 (Aarts et al. 1999b) to underpin empirically my assumption about the setup of the electorate. In this survey, two questions were included that tap the socio-economic divide. It is asked to what extent respondents think the differences in income should be reduced or increased (v0123, reverse coded) and to what extent the social benefits are too loo or too high (v0736), both on a 7-point scale. The lowest score (1) indicates the most leftist position: supporting smaller income differences and the social benefits are considered much too low. Two other items (v0130 and v0144) were used as an indictor for the mono-multicultural divide: 'The Netherlands should allow more asylum seekers to enter' (value 1) vs. 'The Netherlands should send back as many asylum seekers as possible' (value 7) and 'Foreigners should be able to live in the Netherlands while preserving all customs of their own culture (value 1) vs. 'Foreigners in the Netherlands should fully adjust themselves to the Dutch culture' (value 7).
- A.3
- The correlation between the socio-economic and cultural scale (the summed score on the two questions) is modest (Pearson's r = 0.32). The x and y expert judgment scores of the Dutch parties I used show a much stronger relationship (r = 0.61), but it should be noted that this calculation is based on only a few observations (n = 7). It is also checked to what extent the assumption of normally distributed voters is valid. Figure 3 depicts the frequency distributions for the answers on these four questions. Both skew and kurtosis values should be zero for a perfectly normally variable. As a conservative rule of thumb, values have to be in the range between -1 and +1. Table 11 below shows that the variables do not fail the normality test.
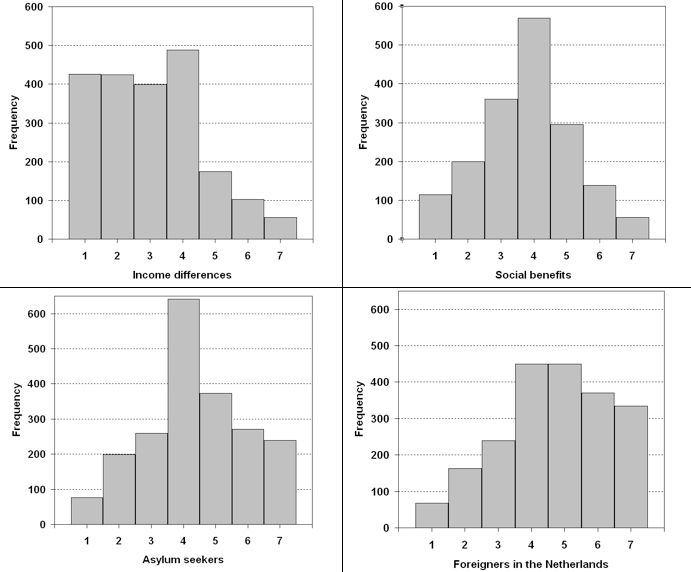
Figure 3. Frequency distributions for four items indicating the position of the Dutch population on the cultural and economic dimension
Source: Aarts et al. (1999b)Table 11: The position of the Dutch population on the cultural and economic dimension and perceived position of five parties (on a 1-7 scale). High scores indicate a greater emphasis on the market in socio-economic policy and stronger stance in favour of a monocultural society on the cultural dimension Respondent's position Party position according to respondent (Mean) Mean
(St. dev)Skewness
(SE S)Kurtosis
(SE K)CDA PvdA VVD D66 GL Total
5 partiesIncome differences 3.04
(1.57).462
(.054)-.442
(.108)3.74 2.51 5.26 3.48 2.29 3.61 Social benefits 3.79
(1.41).012
(.059)-.257
(.117)4.20 3.48 5.06 4.02 3.24 4.11 Asylum seekers 4.36
(1.57)-.067
(.054)-.570
(.108)3.80 3.22 5.41 3.79 2.95 3.99 Integration foreigners 4.69
(1.62)-.324
(.054)-.652
(.107)4.08 3.39 5.33 3.86 2.98 4.09 - A.4
- Finally, it is tested whether the assumption is correct that the Dutch voters are not zero-centred, but on average more on the left on the socio-economic dimension and to the right on the cultural dimension (compared with the average party position). See again Table 11. Respondents were asked to place political parties on the same four lines as described above. Unfortunately this is not asked for all parties, so it is not possible to construct a overall mean (weighted) party position. However, the data seem to support the assumption. Taken the average of the five parties (weighted to the vote share in the 1998 elections), the electorate generally perceives the political parties more on the economic right than average and also more multicultural. In addition, because the average party position does not include all parties, these scores are compared with the mean expert scores (again weighted) for these 5 parties (see Table 1), 2.40 and -1.41 on the economic and cultural dimension respectively, which implies that excluding the SP and CD pushes the mean party position, as can be expected, towards the economic right and towards a more multicultural stance.
Acknowledgements
- Earlier versions of this paper have been presented at the Annual Meeting of the Flemish and Dutch Political Science Associations, Berg en Dal 2008, and the Summer University course 2008 "Complex Systems and Social Simulations", Central European University, Budapest. I would like to thank Sarah de Lange, David Hollanders, Niklas Lampenius, Erik Johnston, Ruud Koopmans, Susanne Rebers, Fleur Thomése, Ralf Kaptijn and Jan Kleinnijenhuis for helpful comments and suggestions. Gaby Vullings (Interview/NSS) kindly provided data on public opinion support and Michael Laver was helpful by sending me his programming code.
Notes
-
1The trade-off of ABMs is the cost of having less exacting analytics. Formal models are more precise. As McElreath and Boyd (2007) put it: "There is comfort in vagueness, and formal theory allows for little comfort". But a hypothesis should not only be as precise as possible, but also give a best possible answer on a relevant question. Thus, I agree Miller and Page (2007: 71) that "analytic methods provide exact answers" but "good answers only make sense when we are asking good questions".
2This critique on a solely theoretical application of recent agent-based models is similar to the criticism on sharp-end rational-choice theorists, that despite its theoretical sophistication, rational choice theory has been of little empirical use and empirical applications in the field have been rather unimpressive (Green and Shapiro 1994).
3I used Netlogo version 4.0.2. The programming code for the entire model is available on the author's homepage.
4Voters in a directional model have preferences for one side or the other with regard to an issue. A middle position reflects neutrality, not a certain position (Rabinowitz and MacDonald 1989). In practice, this implies the possibility that actor X is located at exactly the same place as party A, but would still prefer party B as it is located further away from the centre. Moreover, it is necessary to add a parameter (the 'region of acceptability') to penalize extremism, otherwise a right-wing moderate, for example, would prefer to vote for an extreme right, rather than for a right-wing moderate party. Aarts et al. (1999a) showed that the directional model slightly outperforms the proximity model in predicting party evaluations in the Netherlands; however, their analysis is restricted to a selection of the four largest parties. In general, empirical support on which model best represents voting is ambiguous (see e.g. Blais et al. 2001).
5The mean position of the parties is weighted by the share of vote won by the party in the 1998 election.
6 The formula for media distortion is as follows: Distortion = 3 - ln (1 + √Media attention)
7In this case, the role of the media referred to effects of a party suffering from negative news, not from a shortage of attention.
8Minor differences are due the fact that the election results and first opinion poll after the elections slightly differ.
9 Less risky steps of 0.5 instead 1.0 make the results somewhat better (MAD = 4.1 and MAD2 = 4.8) but are still worse than the basic ideological model.
10 In model A, the 'real' party size of the LPF is used for the calculating of the fit after the split-up; LN is 'missing' so not affecting the MAD.
11 An alternative model in which it is assumed that the CDA becomes an Aggregator or Hunter, in line with the idea that the reason for electoral success was the replacement of the party leader by the more adaptive Jan-Peter Balkenende who more strongly mobilized dissatisfaction with the multicultural society (Van Kersbergen 2008), the party indeed slightly shifts on the y-axis. This model does not fare better as the move out of the centre supports the PvdA and D66 and severely harms Fortuyn.
12 Adjusting the simulation because of the fact that political campaigning was put aside after the assassination (by turning all media distortion off after that moment) is only significantly better when Liveable Netherlands is excluded (otherwise they become very large). The model fit for the election outcome is 4.40 and 5.34 (MAD and MAD2) and it is correctly estimated that the CDA is the winner (with about 22%).
References
-
AARTS K (2005) Dwarse kiezers. Enschede: Universiteit Twente.
AARTS K, MacDonald S E and Rabinowitz G (1999a) Issues and party competition in the Netherlands. Comparative Political Studies 32(1): 63-99 [doi:10.1177/0010414099032001003]
AARTS K, Van der Kolk H and Kamp M (1999b) Dutch Parliamentary Election Study, 1998 [Computer file]. Amsterdam: NIWI-Steinmetz Archive/Dutch Electoral Research Foundation (SKON).
AARTS K and Thomassen J (2008) Dutch voters and the changing party space 1989-2006. Acta Politica 43: 203-234. [doi:10.1057/ap.2008.6]
ADRIAANSEN M, Van der Brug W and Van Spanje J (2005) De kiezer op drift? In Brants K and Van Praag P (Eds), Politiek en media in verwarring. De verkiezingscampagnes in het lange jaar 2002. Amsterdam: Het Spinhuis. pp. 218-243.
ANDERSEN R, Tilley J and Heath A F (2005) Political knowledge and enlightened preferences: party choice through the electoral cycle. British Journal of Political Science 35: 285-302. [doi:10.1017/S0007123405000153]
ANDEWEG R B and Irwin G A (2005) Governance and politics of the Netherlands (second edition). Houndmills: Palgrave Macmillan.
AXELROD R (1984) The evolution of cooperation. New York: Basic Books.
AXELROD R (1997) The complexity of cooperation. Agent-based models of competition and collaboration. Princeton, New Jersey: Princeton University Press. [doi:10.1515/9781400822300]
BAUMGARTNER F R and Jones B D (2002) Positive and negative feedback in politics. In Baumgartner F R and Jones B D (Eds.), Policy dynamics. Chicago: University of Chicago Press. pp. 3-28.
BÉLANGER E and Aarts K (2006) Explaining the rise of the LPF. Issues, discontent, and the 2002 Dutch Election. Acta Politica 41: 4-20. [doi:10.1057/palgrave.ap.5500135]
BENDOR J, Diermeier D and Ting M (2003) A behavioral model of turnout. American Political Science Review 97(2): 261-280. [doi:10.1017/s0003055403000662]
BENOIT K and Laver M (2006) Party policy in modern democracies. London: Routledge.
BIGGS M (2003) Positive feedback in collective mobilization: the American strike wave of 1886. Theory and Society 32: 217-254 [doi:10.1023/A:1023905019461]
BLAIS A, Nadeau R, Gidengil E and Nevitte N (2001) The formation of party preferences: testing the proximity and directional models. European Journal of Political Research 40: 81-91. [doi:10.1111/1475-6765.00590]
BOERO R and Squazzoni F (2005) Does empirical embeddedness matter? Methodological issues on agent-based models for analytical social science. Journal of Artificial Societies and Social Simulation 8 (4) 6 https://www.jasss.org/8/4/6.html.
BUDGE I (1994) A new spatial theory of party competition: uncertainty, ideology and policy equilibria viewed comparatively and temporally. British Journal of Political Science 24(4): 443-467 [doi:10.1017/S0007123400006955]
BUDGE I, Klingemann H D, Volkens A, Bara J and Tanenbaum E (2001) Mapping policy preferences. Estimates for parties, electors, and governments 1945-1998. Oxford: Oxford University Press.
CBS (Statistics Netherlands) (2006) The opinion of the Dutch population on the multicultural society 1997-2002. Data retrieved 1-9-2006 from http://statline.cbs.nl
CEDERMAN L E (2005) Computational models of social forms: advancing generative process theory. American Journal of Sociology 110(4): 864-93 [doi:10.1086/426412]
CHORUS J and De Galan M (2002) In de ban van Fortuyn. Reconstructie van een politieke aardschok. Amsterdam: Mets & Schilt.
COENDERS M, Lubbers M and Scheepers P (2006) 'Het tolerante land' in historisch en in landenvergelijkend perspectief. In Van Tubergen F and Maas I (Eds.), Allochtonen in Nederland in internationaal perspectief. Amsterdam: Amsterdam University Press. pp. 89-110.
DE LANGE S (2007) A new winning formula? The programmatic appeal of the radical right. Party Politics 13(4): 411-435. [doi:10.1177/1354068807075943]
DE MARCHI S (1999) Adaptive models and electoral instability. Journal of Theoretical Politics 11(3): 393-419. [doi:10.1177/0951692899011003007]
DE MARCHI S and Page, S E (2008) Agent-based modeling. In Box-Steffensmeier J M, Brady, H E and Collier D (Eds.), The Oxford Handbook of Political Methodology. Oxford: Oxford University Press. pp.71-94. [doi:10.1093/oxfordhb/9780199286546.003.0004]
DE VRIES J and Van der Lubben S (2005) Een onderbroken evenwicht in de Nederlandse politiek. Paars II en de revolte van Fortuyn. Amsterdam: Van Gennep.
DENNETT D C (1995) Darwin's dangerous idea. Evolution and the meanings of life. New York: Simon & Schuster.
DOWNS A (1957) An economic theory of democracy. New York: Harper & Row.
EPSTEIN J M (1999) Agent-based computational models and generative social science. Complexity 4(5): 41-60. [doi:10.1002/(SICI)1099-0526(199905/06)4:5<41::AID-CPLX9>3.0.CO;2-F]
FENNEMA M and Van der Brug W (2006) Nederlandse anti-immigratie partijen in Europees perspectief. In Van Tubergen F and Maas I (Eds.), Allochtonen in Nederland in internationaal perspectief. Amsterdam: Amsterdam University Press. pp. 63-87.
FOWLER J H and Laver M (2008) A tournament of party decision rules. Journal of Conflict Resolution 52(1): 68-91. [doi:10.1177/0022002707308598]
GALTUNG J and Ruge M H (1965) The structure of foreign news. The presentation of the Congo, Cuba and Cyprus crises in four Norwegian newspapers. Journal of Peace Research 2: 64-91. [doi:10.1177/002234336500200104]
GAMSON W A and Wolfsfeld G (1993) Movements and media as interacting systems. Annals of the American Academy of Political Science 528: 114-125. [doi:10.1177/0002716293528001009]
GELMAN A and King G (1993) Why are American presidential election campaign polls so variable when votes are so predictable? British Journal of Political Science 23: 409-451. [doi:10.1017/S0007123400006682]
GONZÁLEZ-AVELLA J C, Cosenza M G, Klemm K, Eguíluz V M and San Miguel M (2007) Information feedback and mass media effects in cultural dynamics. Journal of Artificial Societies and Social Simulation 10 (3) 9 https://www.jasss.org/10/3/9.html.
GREEN D P and Shapiro I (1994) Pathologies of rational choice theory. A critique of applications in political science. New Haven: Yale University Press.
HILGARTNER S and Bosk C L (1988) The rise and fall of social problems: A public arenas model. American Journal of Sociology 94: 53-78. [doi:10.1086/228951]
IRWIN G A and Van Holsteyn J J M (2004) The 2002 and 2003 parliamentary elections in The Netherlands. Electoral Studies 23: 545-571. [doi:10.1016/j.electstud.2003.12.006]
JANSSEN M A and Ostrom E (2006) Empirically based, agent-based models. Ecology and Society 11(2) 37 http://www.ecologyandsociety.org/vol11/iss2/art37/.
JENKINS R W (1999) How much is too much? Media attention and popular support for an insurgent party. Political Communication 16: 429-445. [doi:10.1080/105846099198578]
KITSCHELT H (1995) The radical right in Western Europe. Ann Arbor: University of Michigan.
KLEINNIJENHUIS J and Fan D P (1999) Media coverage and the flow of voters in multiparty systems: the 1994 National Elections in Holland and Germany. International Journal of Public Opinion Research 11(3): 233-256. [doi:10.1093/ijpor/11.3.233]
KLEINNIJENHUIS J, Oegema D, De Ridder J A, and Bos H (1995) De democratie op drift. Een evaluatie van de verkiezingscampagne van 1994. Amsterdam: VU Uitgeverij.
KLEINNIJENHUIS J, Oegema D, De Ridder J A and Ruigrok P C (1998) Paarse polarisatie: De slag om de kiezer in de media. Alphen aan den Rijn: Samson.
KLEINNIJENHUIS J, Oegema D, De Ridder J A, Van Hoof A and Vliegenthart R (2003) De puinhopen in het nieuws. De rol van de media bij de Tweede-Kamerverkiezingen van 2002. Alphen aan den Rijn: Kluwer.
KLEINNIJENHUIS J, Van Hoof A, Oegema D and De Ridder J A (2007) A test of rivaling approaches to explain news effects: news on issue positions of parties, real-world developments, support and criticism, and success and failure. Journal of Communication 57: 366-384. [doi:10.1111/j.1460-2466.2007.00347.x]
KOLLMAN K, Miller J H and Page S E (1992) Adaptive parties in spatial elections. American Political Science Review 86(4): 929-937. [doi:10.2307/1964345]
KOLLMAN K, Miller J H and Page S E (1998) Political parties and electoral landscapes. British Journal of Political Science 28: 139-158. [doi:10.1017/S0007123498000131]
KOLLMAN K, Miller J H and Page S E (2003) Introduction In Kollman K, Miller J H and Page S E (Eds.), Computational models in political economy. Cambridge, Massachusetts: MIT Press.
KOOPMANS R (2004) Movements and media. Selection processes and evolutionary dynamics in the public sphere. Theory and Society 33: 367-391. [doi:10.1023/B:RYSO.0000038603.34963.de]
KOOPMANS R and Muis J C (2009) The rise of right-wing populist Pim Fortuyn in the Netherlands. A discursive opportunity approach. European Journal of Political Research 48: 642-664. [doi:10.1111/j.1475-6765.2009.00846.x]
KRIESI H (2001) Die rolle der Öffentlichkeit im politischen Entscheidungsprozess. Ein konzeptueller Rahmen für ein international vergeleichendes Forschungsprojekt. Discussion paper P01-701. Berlin: Wissenschaftszentrum Berlin für Sozialforschung (WZB).
KROUWEL A (2003) De gedaantewisseling van politieke partijen. Een theoretisch ontwikkelingsmodel. In Jaarboek Nederlandse Politieke Partijen 2003. Groningen: Documentatiecentrum Nederlandse Politieke Partijen. pp. 138-172
KROUWEL A (2006) Party Models. In Katz R S and Crotty W (Eds.), Handbook of Party Politics. London: Sage. pp.249-269. [doi:10.4135/9781848608047.n22]
LAVER M (1995) Party policy and cabinet portfolios in the Netherlands, 1994. Results from an expert survey. Acta Politica 30:3-28.
LAVER M (2005) Policy and the dynamics of political competition. American Political Science Review 99(2): 263-281. [doi:10.1017/s0003055405051646]
LAVER M (Ed.) (2001) Estimating the policy positions of political actors. London: Taylor & Francis.
LAVER M and Mair P (1999) Party policy and cabinet portfolios in the Netherlands, 1998. Results from an expert survey. Acta Politica 34: 49-66.
LAVER M and Schilperoord M (2007) Spatial models of political competition with endogenous political parties. Philosophical transactions of the Royal Society B 362: 1711-1721. [doi:10.1098/rstb.2007.2062]
LUCARDIE P (2000) Prophets, purifiers and prolocutors: towards a theory on the emergence of new parties. Party Politics 6(2): 175-185. [doi:10.1177/1354068800006002003]
MACY M (1997) Identity, interest and emergent rationality. An evolutionary synthesis. Rationality and Society 9: 427-448. [doi:10.1177/104346397009004003]
MACY M and Willer R (2002) From factors to actors: computational sociology and agent-based modeling. Annual Review of Sociology 28: 143-166. [doi:10.1146/annurev.soc.28.110601.141117]
MAIR P (2008) Electoral volatility and the Dutch party system. A comparative perspective Acta Politica 43: 235-253 [doi:10.1057/ap.2008.1]
MCADAM D, Tarrow S and Tilly C (2001) Dynamics of contention. New York: Cambridge University Press. [doi:10.1017/CBO9780511805431]
MCELREATH R and Boyd R (2007) Mathematical models of social evolution. A guide for the perplexed. Chicago: Chicago University Press. [doi:10.7208/chicago/9780226558288.001.0001]
MILLER J H and Page S E (2007) Complex adaptive systems. An introduction to computational models of social life. Princeton: Princeton University Press.
MONASCH J (2002) De strijd om de macht. Politieke campagnes, idealen en intriges. Amsterdam: Prometheus.
OLIVER P E and Myers D J (2003a) The coevolution of social movements. Mobilization 8(1): 1-12.
OLIVER P E and Myers D J (2003b) Networks, diffusion, and cycles of collective action. In Diani M and McAdam D (Eds.), Social movement analysis: the network perspective. Oxford: Oxford University Press. pp. 173-203. [doi:10.1093/0199251789.003.0008]
PELLIKAAN H (2004) Partijen in een politieke ruimte. In Jaarboek Documentatiecentrum Nederlandse politieke partijen 2002. Groningen: Documentatiecentrum Nederlandse Politieke Partijen. pp. 206-229.
PELLIKAAN H, De Lange S and Van der Meer T (2007) Fortuyn's legacy: party system change in the Netherlands. Comparative European Politics 5: 282-302. [doi:10.1057/palgrave.cep.6110097]
PELLIKAAN H, Van der Meer T and De Lange S (2003) The road from a depoliticized to a centrifugal democracy. Acta Politica: 38: 23-49. [doi:10.1057/palgrave.ap.5500002]
PENNINGS P and Keman H (2003) The Dutch parliamentary elections in 2002 and 2003: The rise and decline of the Fortuyn movement. Acta Politica 38: 51-68. [doi:10.1057/palgrave.ap.5500001]
POPPER K R (1973) Objective knowledge. An evolutionary approach. Oxford: Clarendon.
RABINOWITZ G and MacDonald S E (1989) A directional theory of issue voting. American Political Science Review 83(1): 93-121. [doi:10.2307/1956436]
REED M L (2004) Political modeling and election simulations. Dr. Dobb's Journal: Software tools for the professional programmer 29(10): 16-27.
SCHELLING T C (1978) Micromotives and macrobehavior. New York: Norton & Company.
SCHULTE A and Soetenhorst B (2007) Daadkracht en duidelijkheid. Vijf jaar crisis in de VVD. Amsterdam: Van Gennep.
SCP (Social and Cultural Planning Office of the Netherlands) (2003). Rapportage minderheden 2003. Onderwijs, arbeid en sociaal-culturele integratie. The Hague: SCP.
SHIBANAI Y, Yasuno S and Ishiguro I (2001) Effects of global information feedback on diversity: extensions to Axelrod's adaptive culture model. Journal of Conflict Resolution 45: 80-96. [doi:10.1177/0022002701045001004]
SIMON H A (1983) Reason in human affairs. Stanford: Stanford University Press.
SNIDERMAN P M and Hagendoorn L (2007) When ways of life collide. Multiculturalism and its discontents in the Netherlands. Princeton: Princeton University Press
SRBLINOVIC A, Penzar D, Rodik P and Kardov K (2003) An agent-based model of ethnic mobilisation. Journal of Artificial Societies and Social Simulation 6(1) 1 https://www.jasss.org/6/1/1.html
TRUE J L, Jones B D and Baumgartner F R (2007) Punctuated-equilibrium theory. Explaining stability and change in public policymaking. In Sabatier P A (Ed.) Theories of the policy process. Boulder: Westview Press. pp. 155-187.
VAN DER BRUG W (2007) Een crisis van de partijdemocratie? Amsterdam: Vossiuspers, Universiteit van Amsterdam.
VAN DER BRUG W and Fennema M (2003) Protest or mainstream? How the European anti-immigrant parties developed into two separate groups by 1999. European Journal of Political Research 42: 55-76. [doi:10.1111/1475-6765.00074]
VAN HOLSTEYN J J M and Irwin G A (2003) Never a dull moment: Pim Fortuyn and the Dutch parliamentary election of 2002. West European Politics 26(2): 41-66. [doi:10.1080/01402380512331341101]
VAN HOLSTEYN J J M, Irwin G A and Den Ridder J M (2003) In the eye of the beholder. The perception of the List Pim Fortuyn and the parliamentary elections of May 2002. Acta Politica 38: 69-87. [doi:10.1057/palgrave.ap.5500004]
VAN KERSBERGEN K (2008) The Christian Democratic Phoenix and modern unsecular politics. Party Politics 14(3): 259-279. [doi:10.1177/1354068807088446]
VAN PRAAG P (2003) The winners and losers in a turbulent political year. Acta Politica 38: 5-22. [doi:10.1057/palgrave.ap.5500003]
WANSINK H (2004) De erfenis van Fortuyn. De Nederlandse democratie na de opstand van de kiezers. Amsterdam: Meulenhoff.
WATTS D J (2003) Six degrees. The science of a connected age. New York: W.W. Norton & Company.