
 Abstract
- In this study, a static microsimulation model SOMA is used to optimize Finland's tax-benefit legislation to alleviate poverty or at least to reduce it significantly. The method is a classical optimization method using a greed optimization strategy. This means an iterative process, where only one poverty diminishing parameter is changed by 10% from its earlier value at each iteration. Expenses are also optimized to reduce inequality as measured by the Gini-coefficient. Revenues and expenses are balanced at every iteration. Certain parameters of social assistance were found to be the most effective in reducing poverty. However by raising substantially the basic unemployment benefit, basic pensions, housing benefits and study grants - leaving social assistance untouched - poverty was reduced by under 50 percent. This means that social assistance is still required to reduce poverty further. Costs are most effectively financed by raising capital income tax.
- Keywords:
- Inequality, Optimization, Poverty, Public Policy, Simulation Methodology, Tax-Benefit System
Introduction
- 1.1
- The reduction and eradication of poverty is one of the most common policy targets set by governments and citizens in various countries—irrespective of the country's level of development. Poverty refers to the existence of deficiencies that impede life. The means of achieving poverty reduction and eradication vary widely, depending on the nature of the deficiencies and the means of subsistence in each country.
- 1.2
- In Finland, poor relief takes the form of social assistance administered by the municipalities, although it is rather extensively regulated by national law. Nowadays social assistance is almost always a cash benefit. In addition, food (such as EU food aid) is still distributed by private associations and the church. Poor people, of course, also receive help from their relatives and friends.
- 1.3
- Minna van Gerven (2008) has written an excellent comparative study (dissertation) about social security legislation in three European countries, the United Kingdom, the Netherlands and Finland between 1980 and 2006. Her study represents the Finnish social security legislation in detail.
- 1.4
- Social assistance is a last-resort form of financial assistance available for those who are not able to make their living through work-related income or income transfers other than social assistance. In other words, people may live in need and poverty due to the inadequacy of work income, income transfers or social assistance. An adequate level of social assistance is therefore of vital importance.
- 1.5
- The aim of this study is to analyse the whole income transfer system in Finland as a mechanism for reducing poverty. A linkage between transfers and work-incentives or any other such causal relationship is not the point. The point is to find those (tiny) parts of the system that directly help people well below the poverty line. Poverty is defined in relation to the average disposable income. Five poverty indices are used and they have either been defined in earlier studies or are defined below.
- 1.6
- In 1971, a committee set up to define the principles of social care issued a report in which they analysed a reference case so as to roughly illuminate the measures necessary for eliminating poverty, i.e. the adequate levels of social assistance. The conclusion was as follows: "The national pension or the current minimum wage fail to provide a living that could be regarded as adequate." According to the collective agreement of 1 September 1971, a single person's minimum wage after taxes in Helsinki was 423 Finnish marks and the national pension 480 Finnish marks (Komiteanmietintö 1971, 23).
 Microsimulation models in Finland
- 2.1
- Analysing the means of poverty elimination by using reference cases is today somewhat more advanced as it is now possible to feed data on households of different types into a computational model comprising a simulated income transfer and tax system. Reference cases are still used commonly in the drafting of legislation on income transfers and taxation, maybe because of their clarity. In Finland, various models are employed when computing with reference cases, such as the KOTO model (based on Excel).
- 2.2
- Samples taken from registers covering the whole population enable microsimulation with real households. However, as no fully up-to-date registers are available, it is necessary to make use of annual data on households and their members. In Finland, such models have been constructed since 1987 using Statistics Finland's income distribution data, which also contain some interview variables. Currently the static simulation models in Finland are SOMA, TUJA and JUTTA, which employ the SAS, Dyalog/APL, while JUTTA employs C/C++, Excel and Access programs.
- 2.3
- In this study the SOMA-model is used. This model is maintained by 5 researchers (the writer is one of them) from THL (National Institute for Health and Welfare), KELA (Social Insurance Institution) and STM (Ministry of Social Affairs and Health), which are all government institutions. The SOMA-model has been refined during that period and is regarded as reliable; its validity is high and often verified. It's likely that the SOMA-model reduces poverty a little bit more than in reality - one reason for which would be the non-take-up of social assistance (Behrendt 2002, 158-201;Kuivalainen 2007, 49-56;Oorschot 1991, 115-30).
- 2.4
- The SOMA-model simulates real-life income transfers and the tax system in the population for a statistical year. The total costs of planned legislative changes can be calculated using sampling weights. At the same time it is possible to calculate indices that measure inequality and poverty.
- 2.5
- Both the simulated and the real-life income transfer and tax system contain a wide variety of characteristics. The simulation program uses over 300 active parameters[1] for controlling the operation of the legislative system. The parameters (that is "the tiny parts of the system") consist of the very rules by means of which the adequacy of income transfers is specified in legislation. One particular (major) problem is how to identify a combination of parameters that is able to effectively describe poverty and inequality, that is, the adequacy of income transfers and the fairness of redistribution.
Method and data
- 3.1
- This article elaborates one method of identifying such a combination of parameters, testing it with the 2003 and 2004 versions of the SOMA model and Statistics Finland's income distribution data. Nothing of the kind has been previously implemented in terms of methodology, although some ideas have been expressed (Atkinson 2005; Sutherland 2002). This is a further test of the method implemented earlier this year (Sallila 2009).
- 3.2
- The SOMA model can be expressed succinctly as follows: Y=SOMA(PARA,X), where the output matrix Y consists of computed variables for incomes, income transfers and taxation. The data records of Y are the same as in the income distribution data, and all indices for the analysis of poverty and income distribution can be computed on that basis. PARA contains all the parameters of the SOMA model and X refers to the income distribution data insofar as the model makes use of its variables. (It should be noted that some of the variables of X have been calculated for the purposes of the model and are thus not contained in the original income distribution data. It would have been possible to allow the model to compute them, but because of their fixed nature they are here computed outside the simulation model. This speeds up the model, which is also an important consideration.)
- 3.3
- The research problem can be defined as an optimizing task. The optimizing program itself is an iterative process where SOMA is run repeatedly while each time using a new combination of parameters. The process is started with iteration step 0, where the simulation model is run using the parameters of the statistical year (2003 and 2004).
- 3.4
- Revenues and expenses are balanced at every iteration phase so that the maximum allowable deviation of the sum of disposable incomes (DI) from the baseline (iteration 0) is +/- €10 million (the sum of DI is some €75 billion).
Method in detail
- 4.1
- The solution is sought iteratively by first indentifying a parameter that reduces poverty optimally in absolute terms as measured by the Cumulative Poverty Index[2] (CUPI) (Sallila, Hiilamo and Sund 2006). The iteration step is always 10% of each parameters preceding value. (With the exception of a few parameters concerning the year of construction of dwellings, various age brackets and parameters with a value of 0 at the baseline). The length of the iteration step (10%) is not absolutely essential as Sallila (2009) has previously obtained almost the same result with a step of 5%. The number of parameters is first reduced through rough elimination[3] and each of the remaining parameters is then processed individually by running the SOMA repeatedly. After the parameter that reduces poverty optimally is identified, an optimal parameter is similarly identified for funding the changes in income transfers (only parameters that both reduce the Gini coefficient and have a funding effect are included initially[4]), the selection criterion being the lowest Gini coefficient. After the identification of the funding parameter, the parameter is tuned to a suitable value with regard to costs. This tuning takes place using an iterative 'tightening screw', which is rather laborious to tune and has not yet reached a sufficient looseness for an automation of the process. Finally, the solution obtained is examined for its effectiveness by comparing it with the value of the CUPI obtained as a result of the preceding iteration round. If the value of the CUPI changes less than 2% from the previous iteration, the result obtained is accepted. If the value is more than 2%, the process is restarted for a new iteration with this result and the previously obtained results as a starting point.
- 4.2
- The aim was to obtain a poverty-reducing sequence of changes in the income and tax system—and this was what was achieved. In the following, the sequences are described and the effects of the new income transfer and tax systems analysed.
Results
- 5.1
- The optimizing program[5] was run separately with the 2003 and 2004 models and income distribution datasets. The income data were not brought up to date. The 2004 model differed slightly from the 2003 model. The most important change in terms of poverty was that, unlike in the 2003 model, student loan (300 € per month for university students) was taken into account when calculating students' disposable income. When calculating the amount of social assistance, the student loan is always included in full in students' incomes (in accordance with the guidelines on applying the relevant Act), irrespective of whether the student has taken the loan or not. This has a major impact on the amount of social assistance that can be granted to the students. It is significant whether calculations concerning student poverty follow the same procedure as those that determine social assistance; the years 2003 and 2004 are now different in this respect, which affects the results. In other respects, the legislation from 2003 and 2004, respectively, was followed.
- 5.2
- The entire existing means of legislation were first searched for potential means of reducing poverty, i.e., among all parameters (PARA). This gave the sequences shown in Table 1 (see Appendices) while parameters are explicated in Table 2 (see Appendices).
- 5.3
- The result was exactly as expected. Social assistance emerged as the most important type of income transfer in the poverty reduction programme. We knew in advance that the level of social assistance has fallen clearly below the poverty line in Finland (Ritakallio 2005).
- 5.4
- When the 2003 model was used in the computation, the rules regarding single-adult households emerged as more important than those for two-adult households. The process described above only found a single change of rules concerning children. Even this single case occurred at the very end of the process, when poverty had already practically vanished. As shown in Table 2, the adult rules should be changed by 10% each step and 6 to 8 times, implying that the amount of social assistance for a single adult (rural area) should be increased from the €358.79 per month paid in 2003 to €769.10 per month.
- 5.5
- The policy programme for poverty reduction obtained using the 2004 model was very similar, with the exception that it now additionally included two changes to unemployment allowance and a parameter (XPERPR) affecting the basic deduction (€1480) in municipal taxation. Poverty could thus be reduced by lowering the percentage for the basic deduction from 20% to 18%. By contrast, the policy programme no longer contained the child rule for social assistance. The largest change was the one to be made in the two-adult household's social assistance (rural area), which was increased 7 to 10 times, reaching the value of €795.71 per month in 2004. In 2003, the value remained as low as €594.30.
- 5.6
- It should be remembered here that when the computation was carried out within the 2004 model, the student loan was included as students' income irrespective of whether the loan had been taken out or not. This, of course, affected poverty and also the poverty programme since the result of this change was that students were largely excluded from the search for a poverty-reducing parameter—the student loan at least reduced the calculated poverty among students compared with 2003.
- 5.7
- The focus on social assistance in the poverty policy programme was very much as expected as this last-resort income transfer is by definition targeted at poor people. However, the result shows that, at least as far as adults are concerned, the rules for social assistance have clearly fallen behind the target of poverty reduction, i.e., are inadequate in that sense. The need to remedy the situation is most urgent for single-adult households, but also for two-adult households. The need is slightly greater in rural areas than in urban areas, where the rules were originally higher. This suggests that there is no justification for maintaining the different levels of rules in the two categories of municipalities (urban and rural).[6]
- 5.8
- Increasing the tax percentage rate of (household's) capital incomes emerged as the only means of funding the change—measured by the Gini coefficient, this brought about the greatest decrease in income inequality. This as such was no big surprise. The surprising thing perhaps was that no other taxation factors were included, although various options were available, such as increasing the progressiveness of state income taxes. It seems that capital incomes are currently regressively taxed; poverty alleviation programmes change capital income taxation from being regressive to progressive. In addition, it is the rich that have capital incomes, so the above result was to be expected when using inequality as a criterion.
- 5.9
- This optimization produced no changes elsewhere in the income transfer system; the urgent need to change social assistance overwhelmed everything else. A question arose whether other income transfers are adequate in terms of poverty reduction. This was tested by carrying out the optimization as above except that no changes in social assistance were allowed but it was frozen at the initial level, i.e., at the level specified in the 2003 and 2004 legislation, respectively.
- 5.10
- The results of this new optimization are shown in Table 3 (see Appendices) and a summary and explanations are given in Table 4. The optimization with the 2003 model gave 32 iteration stages and 7 parameters and with the 2004 model, 11 iterations stages and 3 parameters that reduce poverty. For both years the optimizing program suggested improvements in the lowest levels of unemployment benefits, single persons' national pension, housing allowance and financial support for students.
- 5.11
- If we look at the first 11 iterations in Table 3 (Appendices), we see that the optimization program suggests that unemployment allowance should be increased to some €50 per day and the full national pension to €560 per month (rural area). In addition, the program suggests one change in both housing allowance for students and the general housing allowance.
- 5.12
- Figures 1 and 2 (see Appendices) illustrate the poverty impact of policy programme 1 and 2, respectively, with regard to costs. The curves for 2003 (left) and 2004 (right) shown in Figure 1 are quite similar in shape. The 2004 curve has a slightly steeper slope, especially with the definition of poverty based on 50% of the median income. However, the baseline for poverty (the first point on the curve) was slightly higher in 2004 than in 2003. For one reason or another, increasing social assistance as suggested by policy programme 1 reduces poverty somewhat more effectively in 2004 than in 2003, when the lower poverty line is used. When a poverty line based on 60% of the median income is used, the same effect can be observed, although it is less marked. Maybe this is due to the slightly lower number of social assistance recipients in 2004 (as calculated by the model). The number was 6.2% of households in 2004 and 7.1% of households in 2003. The number of social assistance recipients according to policy programme 1 increased nearly linearly as the iteration proceeded. In the linear regression model—having the percentage of social assistance recipients as the dependent variable—the slope per iteration was 0.804 in 2004 and 0.823 in 2003, the coefficient of determination for both models being more than 99%. In other words, policy programme 1 increased not only the level of social assistance but also the number of households receiving social assistance. In 2004, the number of recipients increased slightly less than in 2003.
- 5.13
- The total cost after the first eleven iterations of policy programme 2 was some €1.5 billion and the reduction in poverty between 2 and 2.5 percentage points. When the same amount of money is used for the reform according to policy programme 1, poverty would seem to disappear almost completely when the poverty line is based on 50% of the median. With the poverty line based on 60% of the median, the poverty rate dropped from 12.5% to less than 3%.
- 5.14
- The effects of the policy programmes are even more dramatic when they are examined with the Foster-Greer-Thorbecke poverty index[7] (Figure 1). The poverty line used is 50% of the median equivalent incomes. As this index focuses on changes in the incomes of the poorest, it shows a very rapid alleviation of poverty among them with programme 1. Measured by this index, programme 2 is also quite effective in reducing poverty. The effect was slightly higher in 2004 than in 2003, as also shown in Figures 2 and 3 in the Appendix.
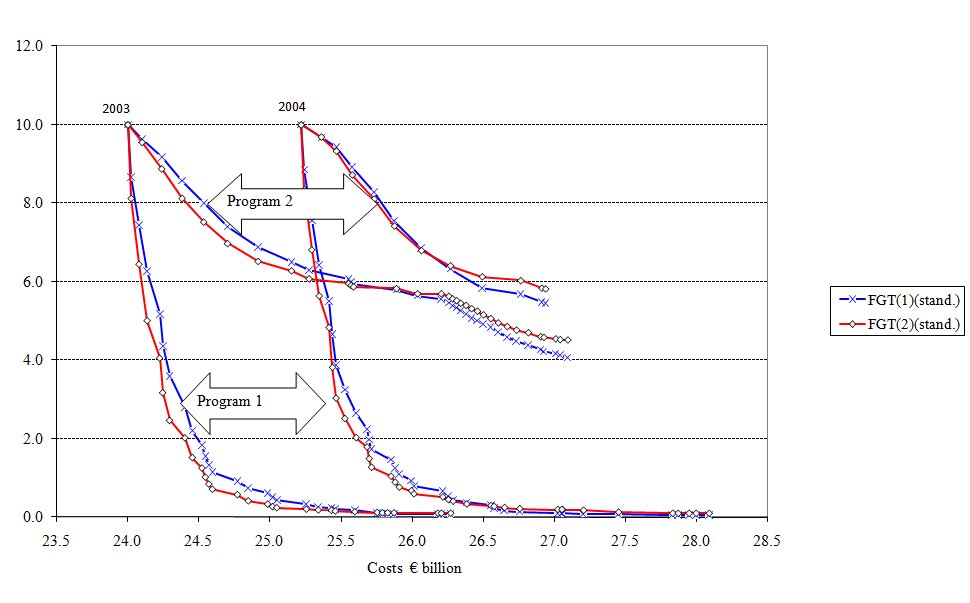
Figure 1. Foster-Greer-Thorbecke indices (standardised to an initial value of 10), policy programmes 1 and 2. Data and legislation are from the years 2003 (left) and 2004 (right) - 5.15
- Considering that the aim of the optimization method was to reduce poverty as effectively as possible, the results can be considered to be excellent. This can be seen in both policy programmes. In programme 2, the aim was to identify poverty reducing parameters in legislation other than social assistance provisions. Such parameters were identified especially in basic unemployment allowance/labour market support. Increasing the level of these benefits would clearly improve the chances for the poorest unemployed people to make their living.
- 5.16
- However, the results indicate that poverty cannot be eliminated without touching the rules for social assistance. This is shown clearly in Figure 1.
Discussion
- 6.1
- The most important result nationally is the provision of clear targets for political forces committed to taking effective measures to tackle poverty, i.e., to pursue legislative changes in accordance with the measures outlined above. Internationally, the result can be regarded as important in terms of methodology. The optimizing programs proved quite successful in identifying effective poverty reduction programmes.
- 6.2
- To what extent can the obtained policy programmes be regarded as politically realistic? The poverty programmes that have recently been drawn up in Finland almost annually in the context of the state budget-preparation process have contained no increases in social assistance, basic unemployment benefits or housing allowance. The 2001 poverty programme included no increases in the above-mentioned parameters. The most significant poverty policy element of recent years is obviously the one included in the 2005 policy programme, i.e. the abolishment of social assistance recipients' responsibility to pay part of their housing costs themselves. My evaluation of this policy programme showed that the programme as a whole (also including an increase of €5 in national pensions) reduced poverty by 0.4 percentage points; expenditure on social assistance would have grown by an average of €25 per household/year (Sallila 2005).
- 6.3
- When the political feasibility is examined in terms of expenditure, the amount of €1.5 billion necessary to eliminate poverty is roughly equivalent to the total increase in income transfers between 2003 and 2004. This is less than the cost of the tax reductions put in place recently in Finland.
- 6.4
- On the other hand, the amount of social assistance increases automatically with rises in the national pension index —indirectly without poverty programmes—but this usually only compensates for the rise in living costs and will not reduce poverty as the poverty line also rises at least to the same degree as the index.
- 6.5
- What then would happen if the increases in social assistance necessary for eliminating poverty were to be implemented? First, this would increase the number of social assistance recipients. Second, it would become apparent that other income transfers are inadequate, because some recipients continue to claim social assistance as a complementary form of support. This would create pressures to ensure the adequacy of other social security as well, particularly unemployment security. Improvements in benefits for the unemployed would further lead to pressures to raise the lowest wages. The same would happen with minimum pensions and sickness allowance. In all, a better quality of life would be achieved for the poorest people, who would get new opportunities to participate in social activities. Economic activity would also increase. All these developments could alleviate various social problems, improve health, decrease crime, diminish the number of children taken into care, reduce substance abuse, improve security, decrease homelessness, etc.
- 6.6
- Could there be any negative effects? It is possible that the optimization of policy would be carried out by shifting the emphasis in social policy permanently to the poorest groups, i.e., a shift would take place from a universalistic social policy to a means-tested poverty policy. This would create a large underclass that would not be quite as poor as currently but would be permanently dependent on social assistance. In other words, social assistance would gradually become the only form of social security, and social expenditure as a share of the GNP would decline. The income transfer system would be optimized towards a lower level of expenditure and it would merely reduce (income) poverty effectively. This would also lead to a more meticulous targeting of social services, with an erosion of services outside of those target areas.
- 6.7
- Thus the method would not automatically ensure the growth of welfare. It can only provide an opportunity to identify exact targets for policy making and at the same time evaluate proposed changes. The fight against poverty could thus be waged with a greater exactness and clarity than currently.
- 6.8
- The method developed is not only for targeting policy, it can also be used to analyse the major aims of modern welfare states more elegantly than before.
Notes
-
1"Active" means that small changes in the value of the parameter incur changes in the sum of disposable incomes.
2Compared with the traditional poverty rate, the advantage of the CUPI index is its sensitivity to income transfers to the poor, whereas the median poverty rate depends strongly on the size of the median. The Foster-Greer-Thorbecke index has a very similar advantage when the value of α is 1.0 or greater as the focus is on the size of the poverty gap.
3Rough elimination took place on the basis of the previous parameter-specific SOMA-model runs, whereby each parameter was allowed to vary around the value for the year of legislation with fairly small steps, calculating at the same time values for poverty, inequality, total disposable incomes, benefits and taxes, etc. The other parameters were thereby held constant at the baseline year value. The SOMA-model was run about 26 000 times (twice 31 times per parameter). This database was done for both the years 2003 and 2004. With these databases one can easily analyze changes in every single parameter.
4These databases are used in this analysis.
5The main optimization program is a quite short SAS-program using a lot of SAS-macros.
6This splitting of municipalities is removed from the legislation of social assistance from the year 2008 onwards.
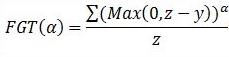
where y = disposable household income(DI), z = poverty line (50% of median DI), and α = 1 or 2
APPENDIX
-
Table 1: Optimal poverty-reducing sequences with the 2003 and 2004 models The 2003 model funding parameter The 2004 model funding parameter Iteration Parameter Value XPOM Parameter Value XPOM 1 A1KAN2 394.67 29.35 A1KAN2 397.01 29.29 2 A1KAN2 434.14 30.21 A1KAN2 436.71 29.96 3 A1KAN2 477.55 31.08 A1KAN2 480.39 30.64 4 A1KAN2 525.30 32.44 A1KAN2 528.42 31.53 5 A1KAN1 412.41 32.77 A1KAN1 414.87 31.85 6 A1KAN1 453.65 33.51 A1KAN1 456.35 32.17 7 A1KAN2 577.84 35.19 A1KAN1 501.99 32.96 8 A1KAN1 499.02 35.99 A1KAN2 581.27 33.99 9 A1KAN1 548.92 37.03 A1KAN1 552.19 34.98 10 A2KAN2 335.47 37.40 A2KAN2 337.46 35.18 11 A2KAN2 369.01 37.78 A2KAN2 371.20 35.39 12 A2KAN2 405.92 38.16 A1KAN2 639.39 37.16 13 A1KAN2 635.62 40.87 A2KAN2 408.32 37.53 14 A1KAN1 603.81 42.06 A2KAN2 449.16 37.91 15 A1KAN1 664.19 44.16 A1KAN1 607.40 39.01 16 A2KAN2 446.51 44.70 A2KAN1 352.64 39.24 17 A2KAN1 350.55 45.15 A1KAN2 703.33 41.86 18 A1KAN2 699.18 48.36 A2KAN2 494.07 42.38 19 A2KAN2 491.16 49.66 A2KAN1 387.90 42.80 20 A2KAN2 540.27 51.10 A1KAN1 668.14 44.04 21 A2KAN1 385.60 51.51 A1KAN1 734.96 46.25 22 A2KAN2 594.30 53.65 A2KAN1 426.69 46.52 23 A1KAN1 730.61 56.10 A2KAN2 543.48 47.48 24 A2KAN1 424.16 56.67 A2KAN2 597.83 48.85 25 A2KAN1 466.58 57.24 A1KAN2 773.66 52.32 26 A2KAN1 513.24 57.94 A2KAN1 469.36 52.74 27 A1KAN2 769.10 62.79 XPERPR 18.00 52.94 28 LAALKAN2 248.64 63.16 A2KAN2 657.61 54.92 29 A2KAN1 564.56 64.19 A2KAN2 723.37 58.13 30 A2KAN2 795.71 63.11 31 A2KAN1 516.30 63.62 32 TYPVRAHA 25.48 64.13 33 A2KAN1 567.93 64.77 34 TYPVRAHA 28.02 65.43 Table 2: Descriptions and occurrence of parameters Parameter 2003 2004 Parameter description A1KAN1 7 7 Social assistance, one adult, urban area, €/month A1KAN2 8 8 Social assistance, one adult, rural area, €/month A2KAN1 6 6 Social assistance, two adults, urban area, €/month A2KAN2 7 10 Social assistance, two adults, rural area, €/month LAALKAN2 1 Social assistance, child under 10, rural area, €/month TYPVRAHA 2 Unemployment allowance, €/day (basic) XPERPR 1 Percentage reduction of basic deduction in municipal taxation XPOM 29 34 Taxation: tax rate on capital income Table 3: Optimal poverty-reducing sequences with the 2003 and 2004 models, no changes in social assistance allowed The 2003 model funding parameter The 2004 model funding parameter Iteration Parameter Value XPOM Parameter Value XPOM 1 TYPVRAHA 25.32 29.96 KEKOYK2 523.30 30.27 2 TYPVRAHA 27.85 31.46 TYPVRAHA 25.48 31.15 3 TYPVRAHA 30.64 32.97 TYPVRAHA 28.02 32.05 4 TYPVRAHA 33.70 34.55 TYPVRAHA 30.83 33.45 5 TYPVRAHA 37.07 36.27 TYPVRAHA 33.91 34.63 6 TYPVRAHA 40.78 38.62 TYPVRAHA 37.30 36.36 7 TYPVRAHA 44.86 41.12 TYPVRAHA 41.03 38.18 8 KEKOYK2 520.22 42.31 TYPVRAHA 45.13 40.09 9 TYPVRAHA 49.35 45.23 TYPVRAHA 49.65 42.43 10 OPIASPRO 88.00 45.50 KEKOYK2 575.63 43.66 11 POVPR 10.00 45.76 OPIASPRO 88.00 44.01 12 TYPVRAHA 54.28 48.82 13 KEKOYK2 572.25 50.24 14 KEKOYK2 629.47 51.80 15 KEKOYK1 542.80 52.32 16 OPIASPRO 96.80 52.74 17 OPKK1MK 284.91 53.05 18 OPKK1MK 313.40 53.36 19 OPKK1MK 344.74 53.79 20 OPKK1MK 379.22 54.22 21 OPKK1MK 417.14 54.66 22 OPKK1MK 458.85 55.09 23 OPKK1MK 504.74 55.65 24 OPKK1MK 555.21 56.21 25 OPKK1MK 610.73 56.90 26 OPKK1MK 671.81 57.59 27 OPKK1MK 738.99 58.54 28 OPKK1MK 812.88 59.50 29 OMAV 88.00 59.85 30 OPKK1MK 894.17 60.70 31 OMAV 96.80 61.19 32 KEKOYK1 597.08 61.68 Table 4: Descriptions and occurrence of parameters Parameter 2003 2004 Parameter description KEKOYK1 2 Single person's national pension, urban area, €/month KEKOYK2 3 2 Single person's national pension, rural area, €/month OMAV 2 Percentage reduction of own risk in general housing allowance (base is 0 %, i.e. no reduction is made) OPIASPRO 2 1 Percentage for students' housing supplement OPKK1MK 13 Study grant for university students, €/month POVPR 1 Percentage in scales for own contribution in general housing allowance (logically same as OPIASPRO) TYPVRAHA 9 8 Unemployment allowance, €/day XPOM 32 11 Taxation: tax rate on capital income 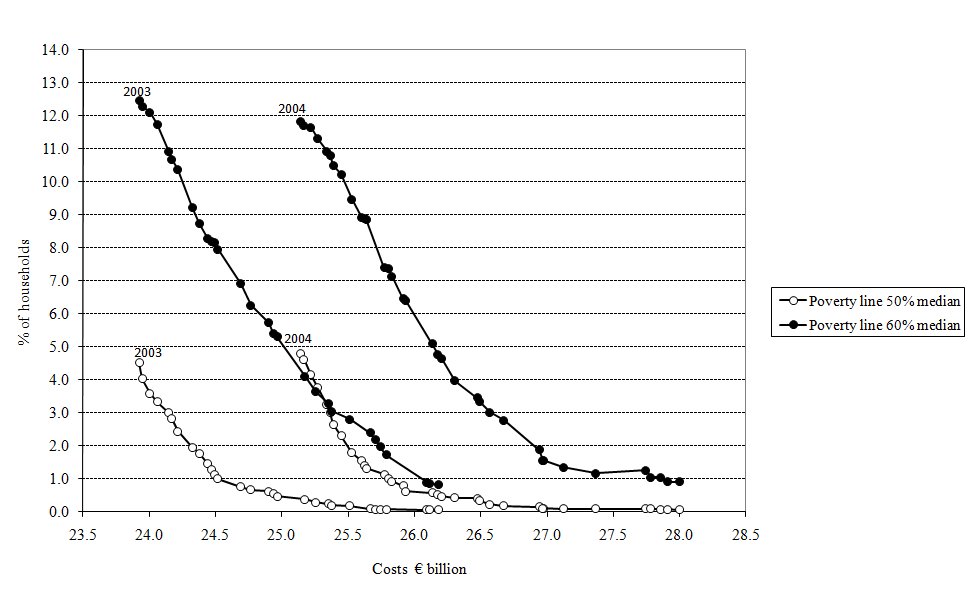
Figure 2. Poverty rates obtained with policy programme 1 as calculated with the 2003 (left) and 2004 (right) models in relation to costs (not brought up to date, € billion) 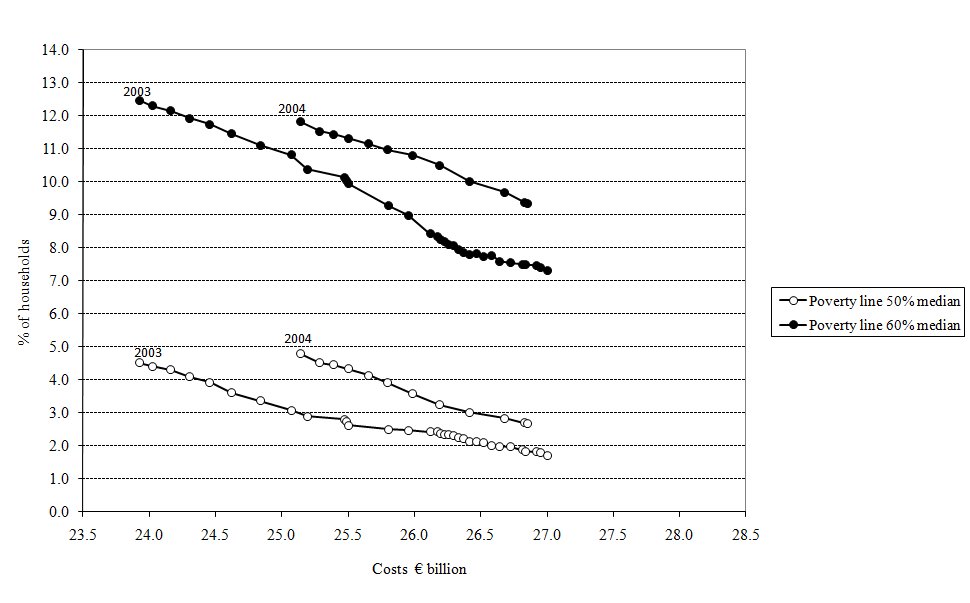
Figure 3. Poverty rates obtained with policy programme 2 as calculated with the 2003 (left) and 2004 (right) models in relation to costs (in that year's money, € billion)
References
-
ATKINSON, A. B. (2005) "EUROMOD and the Development of EU Social Policy." EUROMOD Working Paper EM1/05. University of Essex.
http://www.iser.essex.ac.uk/publications/working-papers/euromod/em1-05.pdf.
BEHRENDT, C. (2002) At the Margins of the Welfare State. Burlington USA: Ashgate.
KOMITEANMIETINTÖ. (1971) "Sosiaalihuollon periaatekomitean mietintö I. Yleiset periaatteet." A 25. Valtioneuvosto.
KUIVALAINEN, S. (2007) Toimeentulotuen alikäytön laajuus ja merkitys. Yhteiskuntapolitiikka. 72(1). pp. 49-56.
OORSCHOT, W. V. (1991) Non-take-up of social security benefits in Europe. Journal of European Social Policy. 1(1). pp. 15-30. [doi:10.1177/095892879100100103]
RITAKALLIO, V.-M. (2005) 'Tulonsiirrot—Köyhyys—Työttömyys - Turvaako perusturva?' Työttömien 12. valtakunnalliset ihmisoikeuspäivät 24.10.2005. Seis yhteiskunta - tahdomme sisään. Järvenpää: Työttömien valtakunnallinen yhteistoimintajärjestö.
SALLILA, S. (2005) 'Köyhyysohjelmien vaikutus köyhyyteen.' Sosiaalipolitiikan päivät 27-28.10. Turku: Julkaisematon, oma arkisto.
SALLILA, S. (2009) "Hyvinvointivaltion optimaalisen köyhyyspolitiikan määrittelyä (Defining the Optimal Poverty Policy for a Welfare State). Dissertation." Tutkimuksia - Research 1. Terveyden ja hyvinvoinnin laitos. National Institute for Health and Welfare. Sosiologian laitos. Helsingin yliopisto. Department of Sociology. University of Helsinki. https://oa.doria.fi/bitstream/handle/10024/43867/hyvinvoi.pdf?sequence=1 .
SALLILA, S., HIILAMO, H. and SUND, R. (2006) Rethinking relative measures of poverty. Journal of European Social Policy. 16(2). pp. 107-120. [doi:10.1177/0958928706062500]
SUTHERLAND, H. (2002) Indicators for Social Inclusion in the European Union: the impact of policy changes and the use of microsimulation models. Politica Economica, Rivista di studi e ricerche per la politica economica. 18(1). pp. 117-120.
VAN GERVEN, M.(2008) The Broad Tracks of Path Dependent Benefit Reform A Longitudinal Study of Social Benefit Reforms in Three European Countries, 1980-2006 (Polkuriippuvaisten sosiaaliturvaetuuksien muutosten leveät urat. Pitkittäistutkimus sosiaaliturvaetuuksien muutoksista kolmessa eurooppalaisessa maassa 1980-2006). 100. Kela, Research Department. http://www.kela.fi/in/internet/liite.nsf/NET/231008124708PB/$File/tutkimuksia100_netti.pdf?OpenElement