©Copyright JASSS

JASSS logo ----

Thomas Grebel and Esther Merey (2009)

Industrial Dynamics and Financial Markets

Journal of Artificial Societies and Social Simulation vol. 12, no. 1 12
<https://www.jasss.org/12/1/12.html>

For information about citing this article, click here

Received: 16-Jun-2008    Accepted: 19-Aug-2008    Published: 31-Jan-2009

PDF version


* Abstract

Financial markets mirror the evolution of real economic industries as much as they influence them reciprocally. In this paper we show an approach how to connect both. We will focus on the impact of industrial dynamics on financial markets. Real economic sectors as well as financial markets will be modelled using agent-based modelling techniques. Boundedly rational agents build up the endogenous evolution of an entrepreneurially driven industry, thereby substantiating the role of knowledge diffusion. Boundedly rational investors in the financial market learn about new industries and trade the corresponding shares. The complete model will be set up as a modular system which will allow investigating various scenarios.

Keywords:
Industrial Dynamics, Neural Networks, Financial Markets, Entrepreneurship, Endogenous Evolution

* Introduction

1.1
When assuming perfect rational behaviour investment decisions are simply a matter of calculus. Prices reflect complete information. Investment bids are the result of optimal decisions coordinated by markets to render Pareto-optimal artefacts. In such a framework the distinction of real economic phenomena and financial market phenomena are only an exercise of semantics. Efficient markets in the real economic sphere would be reflected by efficient markets in the financial sectors. Disruptive shocks in the real sector - such as innovation - would simply shift the efficiency level accompanied by a corresponding adjustment process to the financial market. Mutual repercussions do not matter and neither do reinforcement effects. Therefore, a partial analysis of a dichotomous world, i.e. of either the real economic sector or the financial sector taking the other one as given appears to be a legitimate conclusion.

1.2
On the contrary, if we assume a world built on boundedly rational behaviour, we have to introduce reinforcement effects since emerging inefficiencies in both spheres the real economic and the financial market sphere may reinforce each other. Swarms of innovation as Schumpeter calls it are one of the examples that shows that entrepreneurial behaviour may be rather contagious than the result of optimal behaviour. A behaviour, perceived as a feasible one, may just be imitated by others. The selection process via markets and the market structure itself will be determined by the scope of actors' heterogeneity. Homogeneous firms would render a polypoly in a perfect market with firms holding an equal atomistic part of the market. Heterogeneous firms with differing degrees of efficiency will render an industrial dynamics with firms exiting the market on the one hand and firms becoming dominant firms on the other. Hence, we will observe different trajectories in industrial evolution.

1.3
The processes in the real economy basically deliver the fundamental data relevant for decision making in financial markets. With imperfect economic actors and thus, with imperfect markets in the real economy, the decision-making process in financial markets is subject to bounded rationality, too. The selection process of firms in the economy will gradually reveal and separate the highly competitive firms from failing ones. Financial markets will follow this development and spur that process by the underlying investment behaviour. And again, the performance of financial markets will therefore be determined by the boundedly rational behaviour of heterogeneous actors and we will observe a reciprocal co-evolution of the real economy and the financial markets. As already mentioned, the aim of this paper is to present a possible, modest approach to connect those two spheres, real economy and capital markets.

1.4
Some of the ideas of the model presented here have already been put forward by Grebel et al. (2004). Modelling procedures for agent-based modelling, which we use, can be found in Grebel and Pyka (2006) or Beckenbach et al (2007).

1.5
The model consists of two modules, one representing the real economy and one representing the financial markets. The former is an agent-based model as discussed in detail in Grebel et al. (2003) and Grebel (2004). It delivers the data which feeds into the second module, the financial market module. As we constrain ourselves, here, to put into focus the impact of real economic aspects onto the capital market, we could use any model producing stylized facts about the real economy, that is, any model on industry life cycles. But as we aim at allowing for repercussions from the capital market onto the real economy, we want to show an easy way how to do it. Therefore we chose the real economy model above. The financial market module is modelled using a neural network approach, adequate to illustrate the learning process of boundedly rational investors.

1.6
Hence, the first challenge in this paper is to discuss the way how to connect those two spheres and the second is, to make a feasible assumption concerning investment decisions, since the state-preference approach by Arrow, though proving the existence of an investment decision comparable to a "pure" bond, does not suggest the uniqueness of such a portfolio.

1.7
In section 2 we will discuss the relevant literature to base our conceptual framework on. Section 3 will briefly state the real economy module which we will use and connect to the neural network approach of capital markets as suggested in the subsequent section 4. This section states the decision-making process of an investor. Section 5 shows how the inclusion of subjectivism can consequently substantiated reinforcement effects. Section 6 explains the trading process and how investors learn. Simulation results will be shown in section 7 before the last section summarizes results and addresses possible extensions of the model.

* How to Link the Real Economic Sector to Financial Markets?

2.1
The traditional literature which deals with the kind of industrial dynamics we have in mind when modelling the interdependency between the real economy and financial markets is associated with the work on industry life cycle theory. It deals with the dynamic aspects that in principle drive capital markets: growth trajectories and market selection spur or inhibit investment behaviour as Jovanovic (1982) suggests. Focusing on firm growth and generating a selection model with incomplete information, he describes the industrial evolution as a firms' learning process. Firms learn about their efficiency - some will survive whereas others will fail. The nature of this learning process is to be attributed to technological change. Abernathy and Townsend (1985) as well as Abernathy and Utterback (1978) and Utterback and Abernathy (1975) illustrate the challenging task of firms to cope with continuous change, the need for introducing product and process innovation to stay competitive in the long run. Thereby, new technological opportunities may make new firms enter in an early phase of a technological trajectory whereas firms with a lesser competitiveness will be driven out of the market as the sophistications of advanced technologies increase. Consequently, firms undergo certain phases of industrial evolution (Klepper and Graddy 1990; Gort and Klepper 1982) with a continuously changing demand on firms' capabilities in each phase. However, not all industries experience the same pace and magnitude of such a stylized industrial evolution. The characteristics of industry-specific technologies will differ across industries involving different organizational structures of the innovation process such as in modern knowledge-intensive industries (Grebel et al. 2006). Moreover, changes on the demand side such as changing consumer preferences (Abernathy 1978; Porter 1980) will crucially influence the dynamic behaviour of industries.

2.2
Obviously, there are a lot of different factors that drive the evolution of industries; factors that suggest a rather non-equilibrium type of story as mentioned above. With an industrial evolution full of indeterministic aspects, i.e. a world of true uncertainty and with capital markets meant to furnish a prosperous evolution of a competitive industry, the contingencies of the real economic evolution will be passed on to the financial sector. As much as firms have to reflect on an industry's prospects in order to decide on an adequate firm strategy, investors will be forced to undergo the same reflections to a certain extent to ensure the viability of their investment decisions. Hence, a trajectorial evolution in the real economy will be flanked by a corresponding evolution in the financial markets.

2.3
The link between the real economic sectors and the financial sector seems to be evident. The early phase of an industry life cycle is characterized by strong uncertainty which suggests high profit opportunities for both entrepreneurs and investors. Markets are turbulent and this also influences speculative investment behaviour. Market share volatility propagates into stock price volatility which even leads to excess volatility (Shiller 1989; Campbell and Shiller 1988 and Mazzucato and Semmler 1999). Investors over-react and stock prices fluctuate more than the expected present value of future dividends, as a rational yardstick for stock prices would suggest. Also Jovanovic and MacDonald (1994) emphasize the impact of the industrial dynamics on stock price fluctuations. They discuss the change of stock prices during the shakeout phase of an industry life cycle.

2.4
From a macroeconomic perspective Cochrane (2005) provides an overview on various traditional approaches to link financial markets with real economy variables. He reviews empirical models as well as theoretical concepts to point out the merits of, for example, measuring business cycle correlation of expected returns (Fama and French 1989). Furthermore, Cochrane addresses also the role of prices, returns and economic activity (Ang et al. 2006), consumption and expected stock returns (Lettau and Ludvigson 2001). The correlation between investment and stock prices is outlaid in Cochrane (1991), similar to Pastor and Veronesi (2005) who make the connection between the surge of internet IPOs and internet stock prices. Most of the work discussed in this respect accounts for an empirical perspective. Nonetheless, as Cochrane (2005) puts it, researchers often tend towards empirics and, thus, neglect a sound theoretical framework.

2.5
The literature in general addresses the link between real economic dynamics and financial markets and usually conclude with the lack of an adequate theoretical frame to investigate the relationship between industrial dynamics and financial markets. Cochrane (2005) formulates some aspects which qualities such a model should consider: it should deal with a multitude of various firms with different value/return ratios. It should be micro-based and producing the adequate data to compare with real data[1].

2.6
In this paper we try to construct such a model which takes into account real economic phenomena and makes the link to financial markets. We try to trace the co-evolution of two intertwined (non-equilibrium) trajectories. A strictly analytical approach seems not to be adequate, especially when we try to consider the reciprocity and thus the fallible behaviour of boundedly rational actors, that is, firms and investors.

2.7
There are a number of agent-based models that provide insights into the micro-dynamics of the industrial evolution such as Pajares et al (2003). They model an industrial sector with companies as the main actors, endowed with a cognitive capacity to learn from competitors and the market dynamics. Such a model generates the necessary data to feed into the financial market module.

2.8
As we intend to go a step further down the micro-level in order to model the decision-making process of heterogeneous actors, that is, the evolution of an industry, driven by entrepreneurial actors, we choose a micro-economic approach using a multi-agent interaction model. We use a multi-agent model of Grebel (2004) and Grebel et al. (2003). The literature mentioned above contains a lot of qualitative aspects on industrial dynamics but to achieve our ends, we need an explanation for the micro behaviour. Although it focuses on rather entrepreneurial aspects within the endogenous evolution of an industry, it renders stylized facts as suggested in industry life cycle theory and more important it offers the possibility to connect the micro-behaviour in the real economic sectors as well as in the financial markets.

* Endogenous Evolution of an Industry

3.1
Grebel et al. (2003) and Grebel (2004) use a micro-based simulation study which considers boundedly rational agents which strive to found firms. To this modelling approach a more detailed overview is given in the appendix. Whether a firm is founded or not depends on the individuals and their capacity to understand new technologies. Furthermore, such a start-up decision depends on an actor's social network and on market data which account for market sentiment. Economic actors are heterogeneous in their endowments. Each actor ait at time t is endowed with a certain amount of resources such as financial funds, vcit, their individual cumulated human capital, hcit and a psychological profile which may boost or inhibit entrepreneurial behaviour, ecit (with t = time). These complementary endowments may increase or inhibit an individual's propensity to undertake entrepreneurial actions. Consequently, the actor looks as follows:

Equation

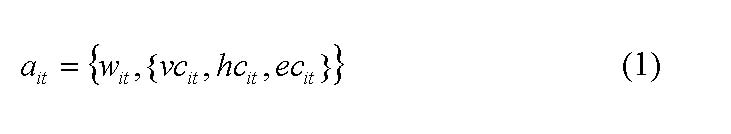
The additional component wit of an actor ait is dichotomous and takes values 1 or 0, saying whether the individual either has absorbed the new knowledge or not[2]. In case the actor understands the diffusing knowledge about a new technology, he is activated to possibly found a firm[3]. The diffusion of knowledge is a time-consuming process which has a crucial influence on the endogenous evolution of an industry: the faster the diffusion of knowledge, that is, the better actors understand a new technology, the higher expectations may be in terms of economic prospects; the foundation of the first firms at an early stage may induce a bandwagon effect triggering a surge of follow-up foundations. With a slow rate of knowledge diffusion, firms will be formed gradually step by step without the possibility of bandwagon effects occurring, since too few actors understand how to apply a new technology, a swarm of firm foundations will not occur: the percolation threshold of knowledge diffusion will not be reached and thus the shakeout phase will be less prominent over time. The diffusion of new technological knowledge is induced by the interaction of individuals, so that knowledge is eventually transmitted through society. The rate of diffusion is thereby determined by the actors' absorptive capacities.

3.2
While the process of knowledge diffusion goes on, the activated actors, those who know about the feasibility of a new technology, think of forming a firm. Thereby, the actor has to meet some presuppositions and he has to overcome the mental barrier to make a start-up decision. Besides a self-evaluation of whether he is capable of running a business or not, the social network plays an important role. In case the individual happens to meet the "right people", people who someone thinks to be complementary and willing to support a new business venture, the actual decision to found a firm is more likely to be made[4]. The networking process is modelled via a random permutation process taking into account the uncertainty in finding adequate co-founders.

3.3
According to the distinction by Smith (1989), the previous paragraphs describe the environment, i.e. the characteristics of the agents in our theory. Note, the actors in this module are disjoint from the agents in the financial market module. The institution, addressing the way of communication among agents, is based on spontaneous learning (Kirzner 1999) which expresses the idea that entrepreneurs spontaneously learn about business opportunities. Smith (1989) denotes such an institution moves of free form. The agents behaviour is a three-fold decision-making process: at any time step, firstly, they evaluate their set of endowments to be sufficient for undertaking entrepreneurial actions, secondly, the same evaluation process they perform with regard to his/her potential co-founders and thirdly, the founding team considers the current market sentiment, whether they see a window of opportunity to found a successful firm.

3.4
The firms founded by individuals consist of the total endowments (financial funds, capabilities, etc.) actors bring into the firm. Since all actors are boundedly rational, it is very unlikely that an optimal composition of a firm's endowment is formed (Grebel 2004). This is the outcome of the entrepreneurial decision-making process.

3.5
A firm's survivability is determined by the balance of its endowment relative to other competitors. A lack of competencies, of business knowledge, of managerial skills, etc. might not be compensated by financial funds. The start-up firm can be ill-chosen in size, whereby a solid, sustainable growth of a firm might be a better strategy.

3.6
Technically, a firm's competitiveness is derived from the endowments actors incorporate into the firm. The selection process, which drives the dynamics of the market and the industry in a broader sense, is implemented in the model using a heterogeneous oligopoly, which especially takes into account the heterogeneity of firms[5].

Figure
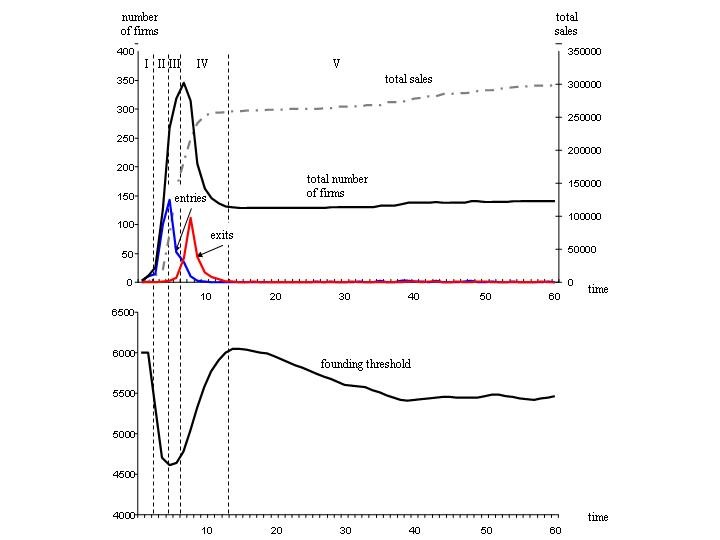
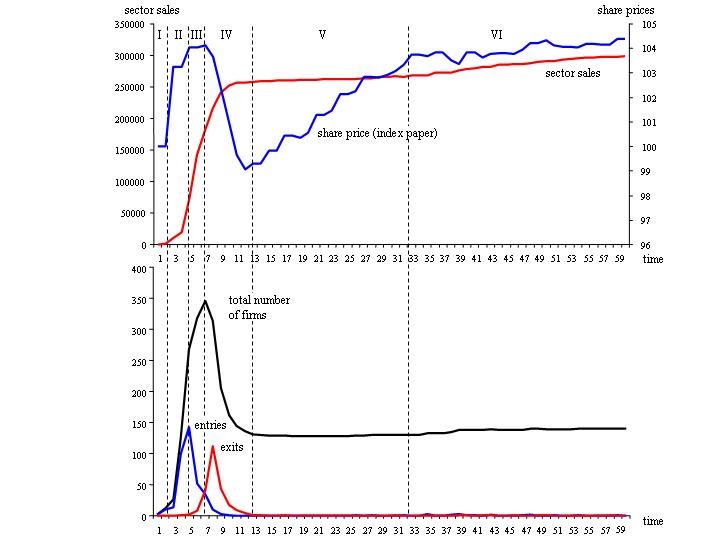
Figure 1. Simulation results of the endogenous evolution of an industry with a high rate of knowledge diffusion

3.7
The simulation runs of this model show specific patterns in the endogenous evolution of an industry. Figures 1 and 2 show two scenarios of an industry's evolution subject to different rates of knowledge diffusion. Total sales of the industry draw a sigmoid shape. This holds for both scenarios. In the fast diffusion case (figure 1), the number of firms on the market overshoots. The number of firms increases in phase II and III, whereby in the latter, the inflexion point has already been crossed. In phase IV a fierce shakeout takes place. The diagrams at the bottom depicts the so-called founding threshold, i.e. the market sentiment, the mental barrier of actors who found a firm[6]. As shown, we observe a euphoric behaviour that drives the founding process.

3.8
In figure 2 an industry evolution with a slow rate of knowledge diffusion is illustrated. The rate of diffusion may be constrained by the actors' absorptive capacities or the complexity of knowledge. Fewer actors are activated and therefore apt to found firms. Herd behaviour is thus reduced and the industry evolves less turbulent. Hence, phases II, III and IV obviously cannot be easily distinguished.

Figure
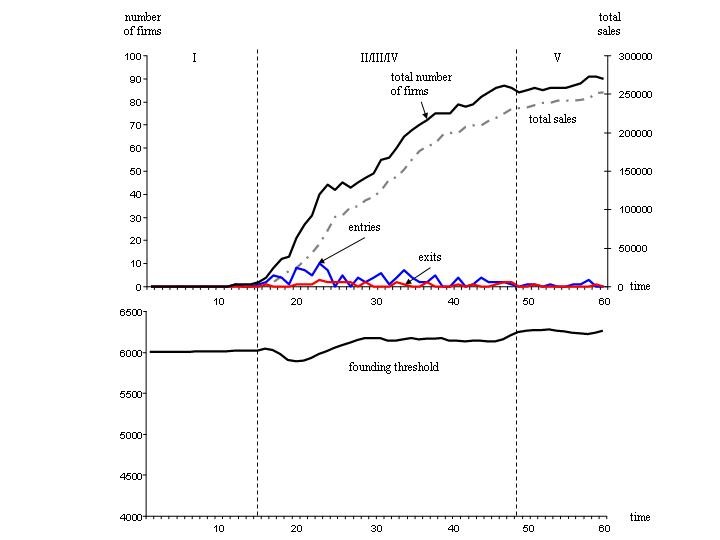
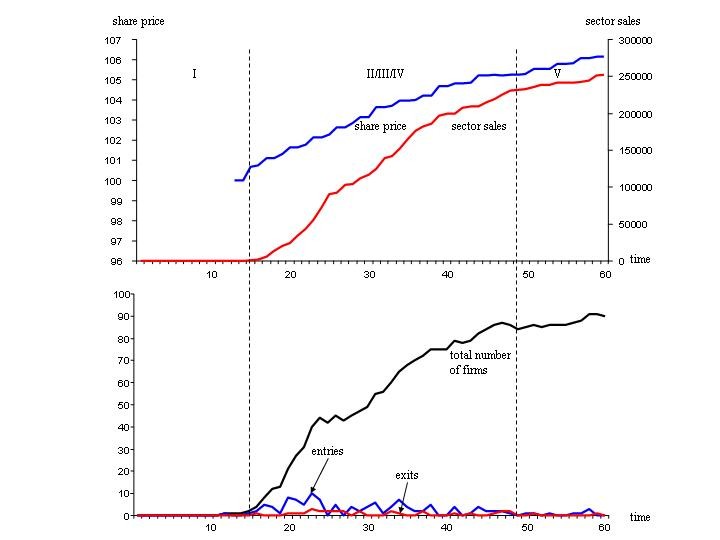
Figure 2. Simulation results of the endogenous evolution of an industry with a low rate of knowledge diffusion.

3.9
One may think of the emergence of the New Economy as an example for the case of fast knowledge diffusion. Founding a business in the internet seems to be manageable to many people, in contrast to the evolution of biotechnology firms, where euphoric behaviour, though evidently noticeable, was much lower.

3.10
This model as discussed in Grebel (2004) and Grebel et al. (2003) not only provides artificial macro-data but also firm specific data such as sales, profits, and relative competitiveness (determined by the firms balance in endowments), etc.

3.11
In summary, this model provides stylized facts of the evolution of an industry and describes the underlying micro-behaviour of individuals. Individuals decide to found a firm on the bases of a three dimensional decision-making process: do they think themselves to be capable of running a firm, is their social network supportive and is the market sentiment positive. The data supplied by this module will be used in the following as indicators on the real economy which influence the investors' decision-making process in the financial markets.

* The Investors' Decision Making Process

4.1
Suppose the real economic evolution was the result of perfectly competitive markets - disregarding what such industrial dynamics would look like - with perfectly rational actors, we would observe Pareto-optimal outcomes, predictable by the nature of perfect foresight and implicitly given complete information. Investment decisions based on such dynamics would consequentially lead to equivalently perfect financial markets. With perfectly rational investors, prices would simply reflect perfect information. This would prevent any reciprocal effects between those two spheres; no reinforcement effects and no speculative bubbles would occur.

4.2
When we relax the assumption on investors' perfect rationality and let them learn about real economic phenomena, i.e. we assume boundedly rational (myopic) investors, we open up the possibility of reinforcement effects; investors learn about the industrial dynamics as well as they take into account the investment behaviour of others. This learning effect would come to a halt unless there was not a ever-changing dynamic in the industrial evolution.

4.3
In the following, we will model the connection of these two spheres in a very simplified manner. The real economic dynamics module as outlaid above, delivers artificial data about the industrial evolution[7]. Based on this data investors will make their investment decisions. In account of bounded rationality we have to deal with complexity arising from the learning-process of heterogeneous agents, the continuously changing (real) economy and the interdependencies between individual investors' investment decisions[8]. This is a further simplification of the cognitive part of this decision-making process. The latter should receive more attention in future research (Gilbert 2006) and some promising attempts have already been made in this respect by Posada et al (2006).

4.4
The tool we use to model the micro behaviour of investors is neural network theory[9] based on the state-preference approach of Arrow (1964). This approach describes the decision-making process of an individual who decides over current (certain) consumption and the (uncertain) return of a portfolio investment. Sommer (1999) expands Arrow's approach to an n -period model using a single portfolio for his considerations. The composition of the portfolio, however, does not play a role. In our case, we will have to account for a variable number of shares in the market, since there is a varying number of firms in the market as shown in figures 1 and 2. The model we will suggest will be in the style of Sommer (1997).

4.5
The environment in this module are agents endowed with financial funds who strive to invest best in the financial market (compare Smith 1989; Posada 2006), that is, agents demand or supply shares. The institution, as discussed in the following, is modelled as a double auction system (compare Posada 2006). The neural net used below paraphrases the agents' behaviour. Investors make price forecasts based on the available market data and taking into account other investors' forecasts. This finally results in the bid/ask orders of the investor.

4.6
Figure 3 indicates the basic decision-making process of investors depicted by a multilayer perceptron. In the first layer, the information supplied by the endogenous evolution of the industry, such as the number of firms Q dependent on time t, may be perceived positively or negatively by the K investors. Each investor Ik, with k = {1, …, K } weighs the available information such as the number of firm entries and exits, sales growth rates, market shares, previous share prices, etc. The investor makes a subjective forecast of the possible price-span of a stock, with price limits esqk. Investor k estimates the price of share q to be e1qk in the best case ( s =1); in the worst case ( s =2) he estimates the lowest price with esqk. So far, this is the result derived within the so-called input layer of the neural net. The second layer, the so-called hidden layer, generates the subjective probability of an investor that his highest price estimate will be actually hit in the financial market. By interacting with the remaining investors, he compares his forecasts with the forecasts of others, which eventually renders the probability πqk that price e1qk will be achieved.

Figure
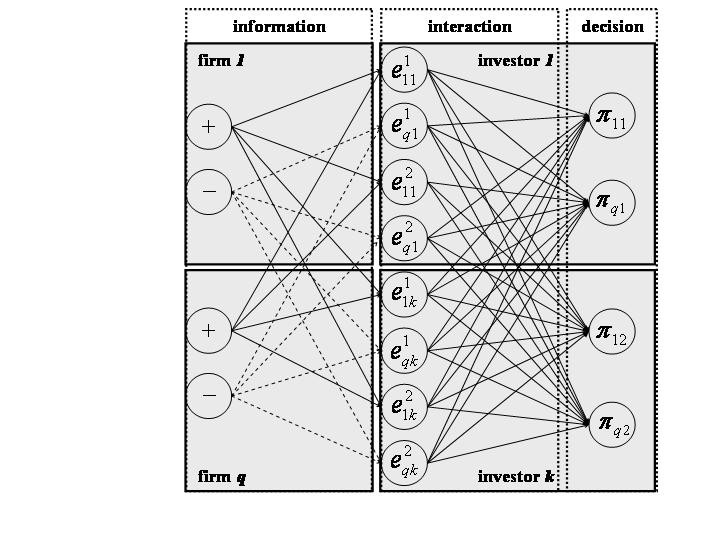
Figure 3. Investors as a Multilayer Perceptron

4.7
Neglecting consumption and given an initial amount of financial resources, Equation at time t =0, the investor spreads his total budget to equal parts among the available shares, i.e. for each investment decision q the investor has the same amount of money to spend. Henceforth, the total budget Equation at time t is composed of the sum of budgets Equation per investment decision q. This indeed is a rough assumption. For the time being, however, this seems to be the only way to solve the problem of the inexistence of a dominant portfolio[10]. Consequently, the investor simply decides between buying a share or buying a secure bond[11]. The risk-utility function of investor k considering investment decision (= share) q is given in equation (2).

Equation

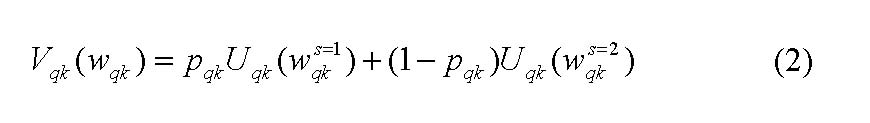
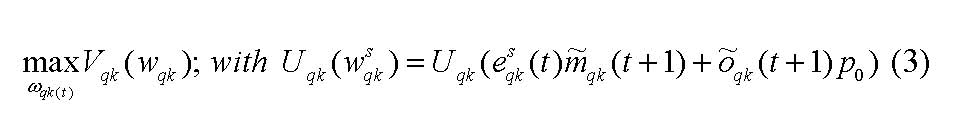
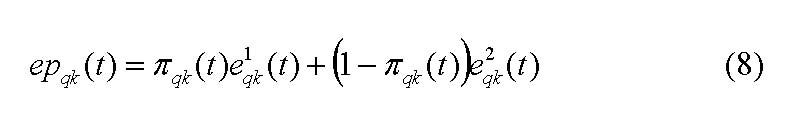
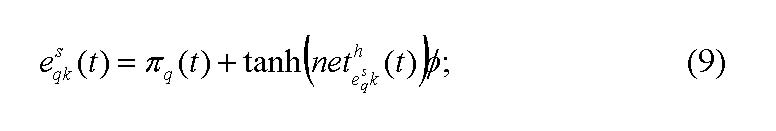
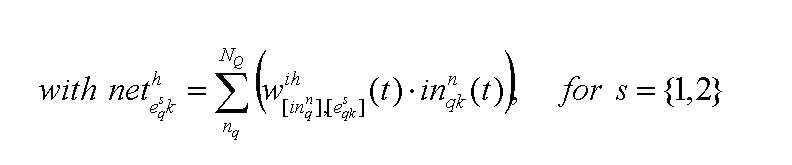
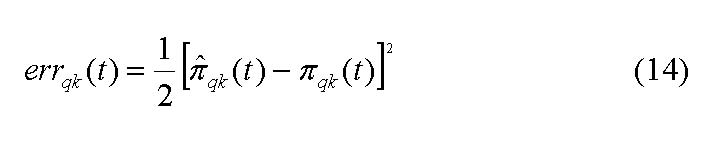
The maximization problem concerning share q takes the following form:

Equation

4.8
Hence, the utility[12] investor k draws from investment decision q derives from the future value of shares q plus the value of secure bonds he buys at price p0 with the remaining budget provided for investment q. Multiplying the desired number of shares the investor intends to hold, Equation ,[13] as well as multiplying the number of secure bonds, Equation , with their corresponding prices, the future wealth concerning investment decision q is determined. The budget constraint for investment decision q is[14]:

Equation

4.9
The actual price of the share q and the secure bond o is pq(t) and po, respectively[15]. Using (3) and (4) the first-order condition of investment q can be derived[16]:

Equation

4.10
Evidently Tqk indicates the market sentiment concerning investment q. To recall, esqk indicates the limit prices investor k thinks to be possible, with s =1 as the highest and s =2 as the lowest price; πqk is the assigned probability e1qk to come true. All these parameters will be determined within the neural net, the functionality of which will be described later on.

4.11
Now, the investor k 's demand function can be derived by using his maximal expected future wealth ωqk. Hence, the demand (supply), Equation , investor k articulates with regard to investment decision q reads as follows

Equation

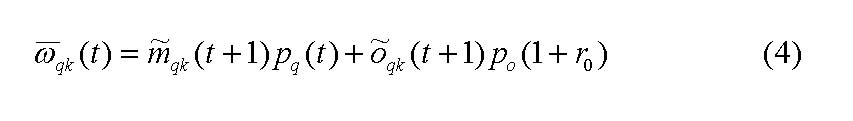
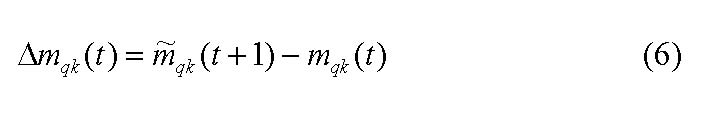
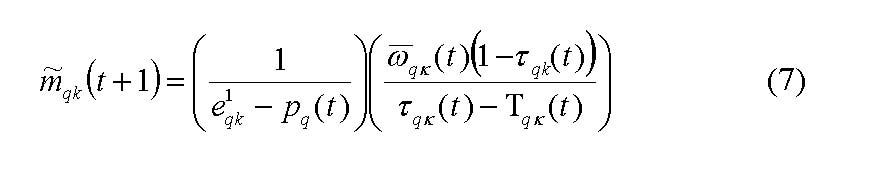
which derives from the difference in the stock of shares the investor wants to hold in two subsequent periods. The desired stock of shares the investor intends to hold at time t + 1 is calculated in the following:

Equation

Equation

4.12
The residual amount of budget ωqk which has not been used will be invested in secure bonds oqk. This emanates from the budget constraint given by equation (4).

Figure
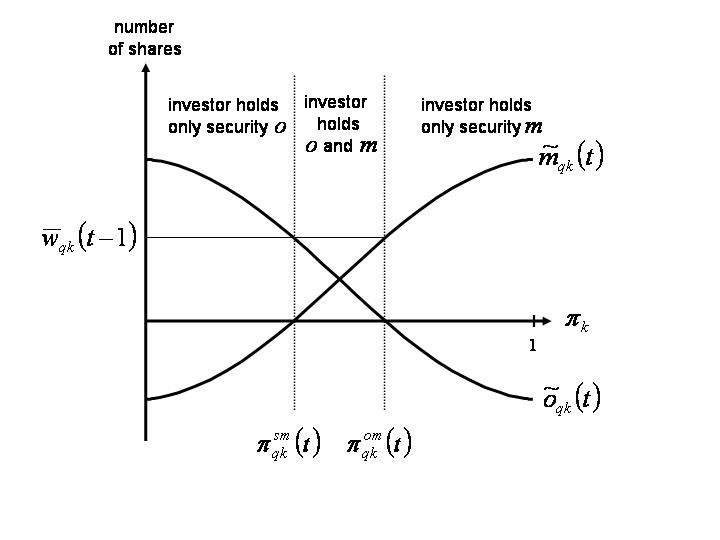
Figure 4. Demand for shares and secure bonds dependent on πk

Figure 4 graphs the resulting demand (supply) of investor k for share q, mqk(t), and the demand (supply) for the secure bond o, oqk(t)[17] subject to πk. If πk increases, since the subjective evaluation of the investor is gradually reinforced by other investors, he will want to redeploy its wealth from holding only secure bonds oqk, to holding both shares and bonds, to holding only shares mqk .

4.13
With the quantity of share q the investor demands for, he simultaneously expresses his order price epqk which simply is the expected value of his estimated price limits (equation (8)).

Equation

4.14
Up to this point, the investment decision is a standard maximization problem. However, prices are endogenously determined by the subjective decision-making process of investors. Next, we will explain the functionality of the neural net that determines price limits esqk and the subjective probability πqk.

* Individual Subjectivism and Reinforcement Effects

5.1
Assuming homogeneous investors of the type of a homo oeconomicus all investors have the same set of information and capabilities and all will come up with the same price forecasts for esqk and the same subjective probability &piqk the upper price limit will come into existence. However, with boundedly rational agents who need to learn and evaluate the market process under true uncertainty, individual decisions may differ owing to heterogeneous risk aversions and a subjective selection and appraisal of relevant information about the market. Some information will be perceived positively and thus increasing the expected upper price limit, whereas other information will be valued negatively and thus determining the lower price limit. Hence, the subjective upper price limit e1qk will result from taking into account the current price pq (t) and the subjectively weighted incoming positive information nethesqk(t) about the relevant economic indicators of firm success and market development. Equation 9 states this implication:

Equation

Equation

5.2
Each positively interpreted bit of information (in+nqk) about investment q is weighted by the individual weight (wih[in+nq],[esqk]) the investor k attaches to this information. With a sensitivity of φ the sum of all weighted positive (negative) pieces of information + NQ (- NQ ) renders an investor's expected upper (lower) price limit e1qk (e2qk). From the perspective of the neural net approach, this is the process that happens between the input and the hidden layer. Therefore the according weights wih[in+nq],[esqk] are label with superscript ih.

5.3
Up to this point, the investor has not yet taken into account the opinions of other actors. In other words, this is the part of the evaluation process that happens in isolation. In a further step, the investor considers the market sentiment within the capital market. Looking at the forecasts of other investors, he derives his subjective probability (πqk) with which his expected upper price limit (e1qk) of investment q will be reached. Similarly as in the case of the evaluation process in between the input and the hidden layer this probability is also a simple weighting process. The investor weights all estimates about price limits made by all other investors. Henceforth, the information neto[q,k] that feeds into the derivation of the individual's occurrence probability πqk is simply the weighted sum of all individual price forecasts made by other investors. This happens between the hidden and the output layer. Equivalently, the weights (who[e1qk]) are labelled with superscript ho between the output and the hidden layer. Consequently, the subjective probability reads as follows:

Equation

Equation

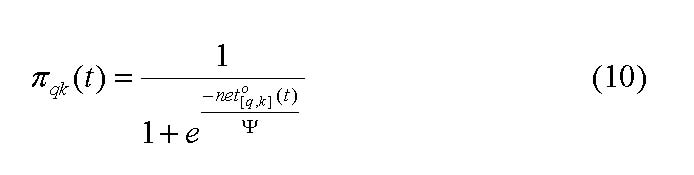
Parameter ψ indicates the sensitivity investors react to the market sentiment represented by the remaining investors' opinion to the investment opportunities.

* Trading and Learning Process

6.1
The trade in the financial market is straight forward. Trade is a bilateral transaction determined at the stock exchange. With the double auction system[18] the trade volume and prices are determined. Thereby, the resulting average price of a share traded serves as input information for the next period as suggest in equation (9).

6.2
Whereas equation (6) simply states the desired number of shares to buy (sell) and equation (8) the order price the investor expresses, the actual future wealth will be determined by the actual price and amount of shares he manages to buy (sell). When considering all investment decisions q of investor k, the actual future wealth will be:

Equation

6.3
The investor's budget is always exhausted so that the actual stock of secure bonds is calculated with:

Equation

6.4
Summing over q equations (11) and (12) render the actual value of total assets at time t +1. With the actual value of assets the investor can also infer the error made in his forecasts implicated by the demand of shares (equation (6)) and the corresponding order price (equation (8)). The learning process of the agent is the calculation of the ex post probability Equation given the corresponding order price Equation and desired stock Equation . In other words, the investor repeats his investment calculation as if he had known the actual outcome before, as if he had used the probability Equation a priori. Doing this, the investor's optimal decision would have yielded the value of the total assets of investment q:

Equation

6.5
Subsequently, the investor adjusts the weights he took into account the forecasts of other investors (weights from hidden to output layer) as well as the weights he put on the information about the sector and firms (weights from input to hidden layer). This is done with a back propagation algorithm[19]. The estimation error is given in the following equation:

Equation

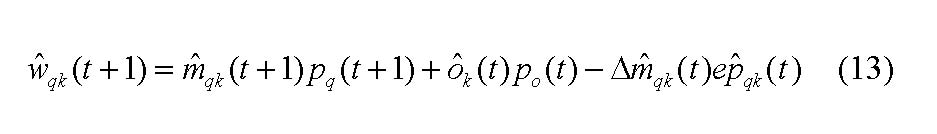
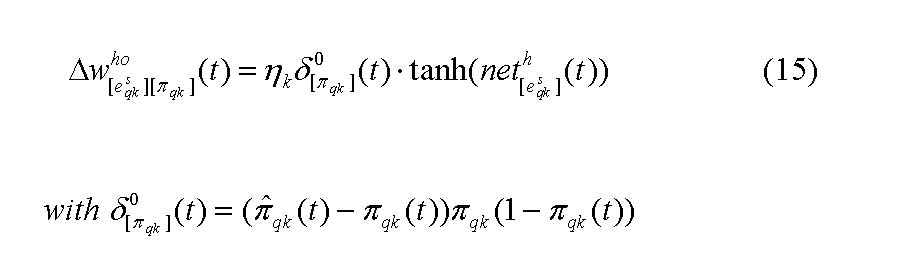
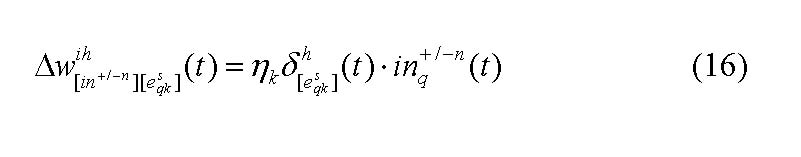
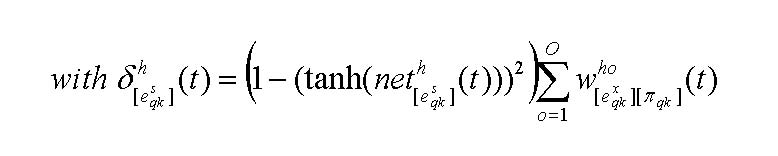
The adjustment of the weights between the hidden and the output layer, that is, the extent investors take account of other investors opinion looks as in the following[20]:

Equation

6.7
Parameter ς0qk] indicates the error made in the output layer and the learning rate of the investor is denoted by parameter ηk, with 0 < ηk < 1. The adjustment process of weights from the input to the hidden layer, the extent investors value specific information about the sector and the firms, equivalently is:

Equation

Equation

6.8
Parameter δh[esqk] implies the error made in the hidden layer and takes into account also the consequent error arising with δ0qk]. Hence, investors learn about how to interpret real economic data and how to evaluate investment behaviour.

* Simulation Results

7.1
We exerted the simulation runs with the data produced by the real economic module as discussed in Grebel et al. ( 2003) and Grebel (2004). Since we had to deal with some technical constraints[21] we proceed as follows:

7.2
In paragraphs 7.4 - 7.5 we categorized firms concerning their performance in order to reduce the number of micro agents. Owing to computing capacity constraints we had to reduce the number of shares traded. In order to present our idea we take two steps to circumvent this problem for the time being. Firstly, we show the functioning of the capital market module, the interdependence between share prices. In other words, we show the impact of real economic phenomena onto the capital market albeit only on a selection of firms. Secondly, we subsume all shares among a single share index in order to show the whole picture between the real economic sphere and the capital market.

7.3
This way we want to claim that the interplay between real economic (micro-)dynamics and financial market dynamics can be modelled in the way we laid out above.

Simulation Runs Based on Specific Micro-Data

7.4
The data that feed into the neural net simply are the endogenously generated stylized facts of an industry life cycle[22]. The data investors use out of the information set in order to stoke their investment decision-making process is positive and negative information such as entries, exits, sales and profits. The number of firms generated in the real economic module counts 391. The number of investors is 1,000 with 10,000 units of financial assets to be invested. The investors decide between secure bonds and available shares. All investments start out with the same price pq=po=100. The agents' learning rate is ηk=0.1 with risk aversion parameter nk=0.5. The sensitivity investors react to real economic developments is φ=10 and the weighted market sentiment investors take into account other opinions on the financial market is ψ=10. We arbitrarily selected five firms out of 391 in order to exemplarily show the resulting investment behavior. Figure 5 graphs the profit and sales trajectories of those five firms (#1 to #5). Every firms makes a loss at the beginning, whereas only three firms, which we named firm #2, #3 and firm # 4, manage to earn profits and avoid insolvency. Evidently, firm #1 and firm #5 have to exit in period 7 and 10, respectively. This is, what the real economy module delivers us as stylized facts.

Figure
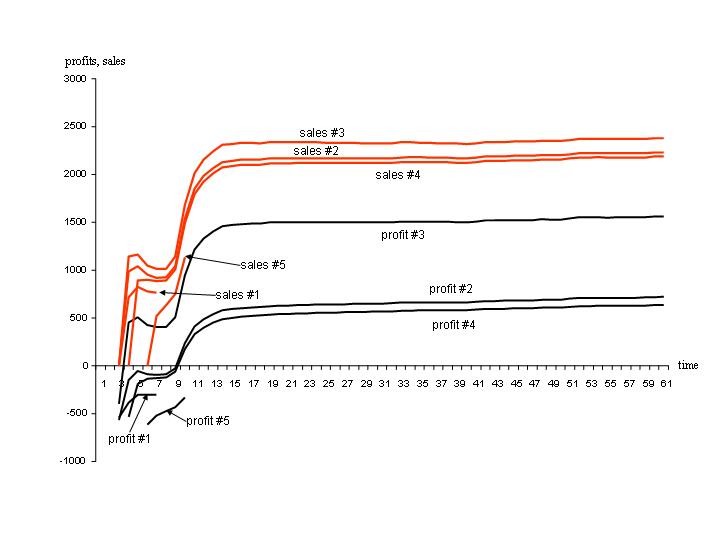
Figure 5. Stylized profits and sales of four selected firms

7.5
Using this micro data as input information into the neural net, the corresponding investment behaviour is depicted in figure 6. All shares start out with a stock price of 100 units. The share prices of firms #1, #2, #3 and #5 fall at the very beginning. Whereas share price #3 recovers, share #1 and #5 exit the market. The sales of all five firms are increasing at the beginning, and all five firms make losses. In contrast to firm #2, #3 and #4, firm #1 and #5 exit the market because of insolvency. Investors interpret the available information[23] (profit and sales - data which is processed between the input and the hidden layer of the neural net) as much as they take into account the opinion of other investors (information which is processed between the hidden and the output layer). Though firms #2, #3 and # 4 have similar profit and sales paths their share prices fluctuate. The interdependence between those firms' share prices is evident. The reinforcement effect amongst investors may cause the share price of firm #4 decrease, followed by a phase of recovery. as shown in figure 6. Over the long run, however, share prices reflect firm value, since the investors realize the errors made in their projections based on the available information. At this point it has to be emphasized that this is the share price development assuming a static environment. After there is no entry and exit anymore, i.e. no dynamic aspect that brings along change, share prices align to an equilibrium-like growth path corresponding to firm growth. This is a simplification which we make in order to show the interdependence between share prices. So we control for any possible shocks and restrict the set of information available to investors to only a few. When we allow for several shocks such as continuous innovation and when we increase the set of information, share price fluctuation will increase.

Figure
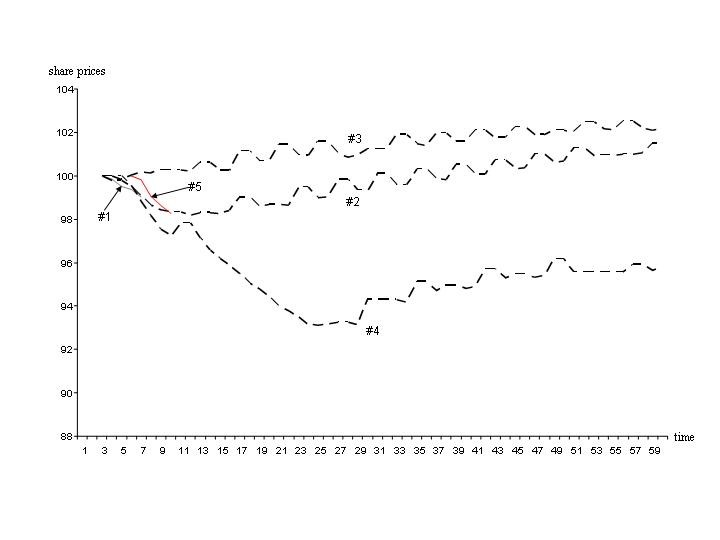
Figure 6. Corresponding share prices of the four firms selected

Simulation Runs Based on Stylized Facts

7.6
In the previous section we showed the basic functioning of the capital market model. The micro-data of firms was used as the basis for the investors' decision-making process. The more firms enter the market, the more shares there will be on the capital market. Hence, the investors have to cope with more information. Irrespective of the computational capabilities of investors in the real world, we are constrained to our computational capacity, which does not allow us to consider all firms (in numbers: 391) generated in the real economy module in order to show a micro-based capital market model driven by real economic dynamics.

7.7
Still, as it is our aim to model the interdependent process between real economic phenomena and capital markets, we compromised to restrict the capital market to a single index paper which subsumes all shares traded. That is, all upcoming shares enter this index paper. Consequently, this index paper is the only paper traded at the capital market (apart from secure bonds) and the information on the meso level, i.e. on the sector level, serves as the basis for decision making.

7.8
The results are given in the diagrams below. In figure 7 the evolution of the capital market is diagrammed corresponding to the real economic dynamics. With the emergence of a new sector with high growth rates at the beginning, the traded index paper experiences a rise in its price till period 6 where the share price plummets although sector sales are still increasing. Not before period 12 the share price recovers and starts to grow again over time. The information investors receive on the sector is illustrated in the diagram above within the same figure. Investors take into account the number of exits and entries as well as sector growth rates. At the beginning an increasing rate of entry with no observable exit rate is considered as positive information on the sector. Thereby, the reinforcement effects of investors additionally boosts the share price up. With an increasing exit rate and a decreasing rate of entry, the sector is valued less and less. In other words, during the shake-out phase of such a turbulent industry life cycle, the share price falls. Once the industrial dynamics becomes more balanced, share prices recover and evolve along the growth path of the economic sector.

Figure
Figure 7. Capital market and industry life cycle of a fictitious economic sector (high rate of knowledge diffusion)

7.9
Now, as the real economy and the capital market is connected, we see the share price development corresponding to a stylized industry life cycle. In an early phase I a few firms enter the market and shares are traded. In a very dynamic sector there is a rapidly increasing rate of firm entry (phase II). In the third phase, firm entry starts to decline and slowly the exit rate increases; share prices are still high in this euphoric phase. Phase IV, the starting point of the shake-out phase, causes the share price to fall. As the market consolidation process has been completed, phase V shows a slowly recovering share price. Assuming that the birth process of this sector is established by then, entry and exit are almost down to zero and the share price of the index paper aligns to the growth rate of the industry's profitability (phase VI).

Figure
Figure 8. Capital market and industry life cycle of a fictitious economic sector (low rate of knowledge diffusion)

7.10
Let us take a look at the case of a slowly evolving sector as depicted in figure 8. The capital market is also driven by the dynamics of the real economy. Herd behaviour is almost unobservable. The share price develops along a smooth development of a new industry sector. Phases II, III and IV coincide and major fluctuations of the share price do not emerge.

* Conclusion

8.1
In this paper we tried to give an example how to connect the real economic sphere with the financial sector. The starting point was a micro-based multi-agent model on the industrial dynamics of an entrepreneurial economy. Actors found firms. Firms enter the market, succeed or fail due to competition. A stylized industry life cycle is the outcome of that model. The data produced by this model serves as the basis for the decision-making process of the investors who act on the financial market. The investors' behaviour is modeled via a multi-layer neural net. The data on firms and the industry is processed in a first step resulting in investor individual price forecasts on shares. In a second step the investors additionally take into account the forecasts of other investors resulting in the actual bid or sales order. Errors made in their forecast are corrected by a back propagation algorithm. In other words, investors learn about an industry and thus drive stock prices contingent to the rate of such learning process. Aside from this learning process, the neural network approach basically yields a deterministic decision-making process of (myopic) boundedly rational agents. So far the link between the real economy and the capital market has been rudimentarily accomplished. Changes in the real economic sphere propagate into the financial sphere. A feedback process has not yet been implemented. The strengths of this approach is the modular setting of the entire model. Details on the real economy module can be changed as well as on the capital market module which simply renders a new scenario. Moreover, the neural net can be calibrated with empirical data and may describe stereotypical stock market processes. Since the neural net is based on individual agents, a multitude of different investor characteristics can be incorporated. Hence, this opens up a large basis for counterfactual analysis to gain insights into capital market dynamics.

8.2
For future research the task will be to elaborate this approach in both directions the industrial dynamics side and the capital market side. Moreover, a feedback process from the capital market to the real economy should also be implemented. With this model completed, we intent to analyze and compare various real economic sectors and their corresponding capital market phenomena.

8.3
Though there still is a lot of work to do, a first step has been made to give a solid footing to connecting the real economy with capital markets in a Schumpeterian sense.

* Appendix

The Real Economy Module

9.1
The real economy module is taken from Grebel et al. (2003). More details can be found in Grebel (2004). The reason why we use this frame to model the real economy lies in the possibility to connect the real economy with the financial market in a reciprocal way. As mentioned in the text: first, actors need information about the real economic sphere to rationalize their investment decision. This could be provided by any other adequate model such as Klepper and Graddy (1990) and Jovanovic and MacDonald (1994). But our intention is to allow for modelling feedback effects in order to take into account repercussions from the financial market onto the real economy as well.

9.2
The real economy module is designed in a very general form so that eventually one may investigate different scenarios and furthermore to implement the relationships and specificities of certain sectors. This basic design has to be seen as a platform approach that allows for several extensions with regard to the theoretical perspective as well as with regard to a closer look at the empirical sphere.

The Actors

9.3
To model the evolution of entrepreneurship and the founding of new firms, we start from the individual actors' level and in particular from the individuals' specific endowments. The individuals are characterized by the crucial features identified in the previous section: i) entrepreneurial spirit (ecti), which describes an actor's tendency not to become an employee but an independent firm leader; ii) human capital (hcti), representing an actor's specific level of technological as well as economic knowledge and skills and finally, iii) the actor's endowment and/or access to venture capital (vcti). These different features are all represented as real numbers on a cardinal scale in the interval [0,1], higher values indicating higher levels of the specific characteristics. Accordingly, the n different actors in our model are described by the following vector:

Equation

where ati := actor i at time t, i∈{1,…,n}. Since entrepreneurial behaviour is about innovative behaviour, actors first have to get to know a new technology in order to be able to innovate on it. The diffusion of new knowledge is a time-consuming process, whereby the rate of knowledge diffusion also has an influence on entrepreneurial behaviour seen from a macro perspective. To model this, wit is introduced which indicates an actor's stock of new knowledge. In case the actor has absorbed the new knowledge, wit =1, if not, wit remains 0. The diffusion process itself is modelled using a von-Neumann cellular automaton[24].

9.4
To build a starting distribution of the population of actors (17) random- n -triples are generated with the features ecti, hcti and vcti uniformly distributed within the interval.

Equation

Matching Process and Founding Threshold

9.5
For each iteration the population of actors not yet involved in a firm is permuted and k different actors are randomly brought together in order to evaluate their chances to found a possibly successful firm. For this purpose, we consider the specific attributes of the actors to be additive so that also a potential firm (Equation ) can be characterized by the triple of attributes of its k members:

Equation

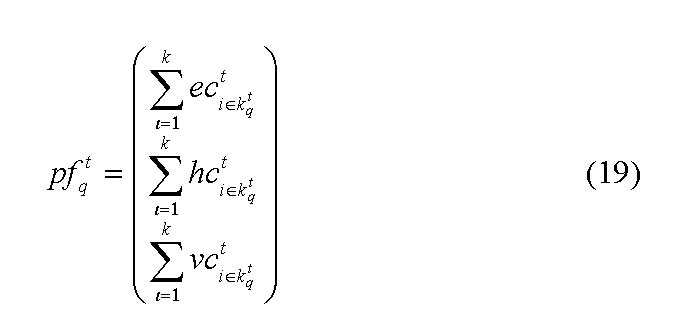
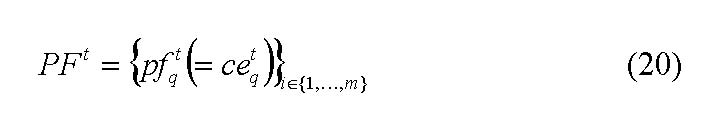
so that the set of potential firms at time t is

Equation

where q∈{1,…,m} denotes the specific potential firm and m the number of potential firms, i.e. the number of temporarily formed k -groups q in period t. Each group of actors has to evaluate if their comprehensive endowment Equation , which for simplicity is equal to Equation , is adequate. Yet, the actors' mere perception of their common resources, attitudes and motivation is not the only determinant for founding a firm. The actors involved are also influenced by their environment and the respective mood within the population. For modeling reasons, the so-called founding or entry threshold ψt is introduced, a "meso-macroeconomic signal" which endogenously depends negatively on the growth rate of the sector's sales wt. The growth rate of the sector's sales decreases the threshold in return. Furthermore, the threshold depends negatively on the return on sales rut and positively on the rate of exits dt and positively on time t:

Equation

9.6
If the k -group's, that is the potential firm Equation 's, comprehensive endowment Equation exceeds the foundation threshold ψt, the k actors decide to found a firm, thus the potential firm Equation turns into an actual firm Equation , and the formerly potential firm's comprehensive endowment Equation becomes the actual founded firm's comprehensive endowment Equation . Equation (22) gives the set of newly founded firms Equation in period t:

Equation

9.7
Hence, the set of all firms that have been founded up to time t is given in (23). In cased equation (22) does not hold, the potential firms simply represent a social network subject to future change. Consequently, their resources remain available for potential business ventures. Equation (24) gives the firm j's comprehensive endowment.

Equation

Equation

9.8
If the threshold is not exceeded, the option to found a firm, for the time given, is rejected by the actors. Consequently, the actors that do not get engaged in a firm are free to go for further trials in the following period. In the case of a successful foundation of a firm Equation with j∈{1,…,xt} the k actors involved are no longer available to found another firm. At the same time, this reduces the probability for other actors to find adequate partners. On the other hand, according to equation (25) the number of existing firms xt is increased by the number of firms Equation founded within a period, thereby also exerting a positive influence on the sector's aggregate turnover which positively feeds back on the founding threshold in the next period.

Equation

x t := number of firms in the industry at time t.

Survival and Exit

9.9
Whether a firm Equation survives in the market or is threatened by exit depends on its set of endowments and composition of aggregated capabilities. They determine a firm's competitiveness. For simplicity, the ratio between human capital and venture capital determines the fixed cost. The variable unit costs decline over time owing to a learning curve effect while accumulating output. In combination with the firm's individual demand curve (equation (26) the firm's profitability (fitness) relative to other firms is determined. Hence the hazard of exit, if facing insolvency, is stated.

9.10
A heterogeneous oligopoly is the formal expression of the interdependence of firms within the sector. By using a oligopoly module, a selection process taking into account the heterogeneity of firms is implemented. Equation (26)[25] shows a firm's individual demand curve which basically depends on the relative quality yjt of the products of firm j compared to others.

Equation

9.11
This heterogeneous oligopoly is a myopic optimization module as it is used by e.g. Meyer (1996) and Pyka (1999). It represents the market selection process which generates the data (stylized facts) that influence actors' behaviour; and, at the same time, the data in return is the outcome of actors' behaviour, thus the micro-macro reciprocity as suggested above is modelled. The module may be replaced by a more elaborate competition module to render a perhaps more precise concept of firm behaviour and competition. Nevertheless, the stylized facts that feed into the financial market module are generated and the chance to implement further feedback effects is made possible.


* Notes

1Compare Mazzucato and Semmler (1999).

2Differences in absorptive capacities among actors can easily be taken into account as shown in Grebel (2004).

3As an example one may think of someone who becomes acquainted with new information and communication technologies (ICT) and thinks of forming an e-commerce business.

4As an empirical fact, there is more than just one individual involved in a firm-founding process.

5See Grebel (2004) and Grebel, Pyka and Hanusch (2003) for more details.

6The founding threshold is a concept developed on the grounds of social psychology and mental models. See Grebel (2004) for more details.

7For simplicity reasons, each firm that emerges in the real economy is assumed to be listed at the stock exchange from the very beginning of its existence.

8Compare Day and Chen (1993).

9Neural networks provide an ideal modeling framework for complex economic systems, which are able to handle high-dimensional problems along with a high degree of nonlinearity . Besides the learning from data, neural networks allow for the integration of the decision behavior of individual economic agents into a market model. The decision-making scheme of an agent is thereby modeled by a single neuron. That process consists of three stages: information filtering, market evaluation and acting based on the rated information (Haykin 1999).

10As long as we consider a single share such as Sommer (1997) and let the investor decide whether to invest in a risk-bearing share or in a secure bond, there exists a unique solution of the investor's optimization problem. This is what the state-preference approach by Arrow states. If we increase the number of shares, although we might still have a pure bond, as Arrow calls it, there exists in general no unique optimal portfolio. Using budgets for each investment decision, we circumvent this problem which has definitely to be tackled in future research.

11Introducing a positive interest rate changes investment behavior. This can easily be implemented into the model, but to keep it simple, the interest rate shall be i=0.

12We assume risk-averse investors with

Equation

This is a standard assumption as discussed in Sommer (1999).

13The tilde over any parameter stands for the expected value.

14Since the existence of a unique optimal portfolio is at random, we need to presume a routinized behavior of investors. Therefore, we assume that investors partition their portfolio among all existing shares, so that for each share he has a fixed budget x which he decides how much of it should be invested into the share considered.

15The price of the secure bond functions as a numeraire. The prices for shares are determined using a double auction system as used in practice. Compare e.g. Garman (1976).

16Second-order conditions are fulfilled, since we deal with a convex optimization problem.

17As already stated, we assume that investors divide their budget into partial budgets per investment decision q. In each single investment decision the investor decides how much of the partial budget will be invested into investment mqk(t) and consequently, how much of the partial budget will be invested in secure bonds oqk(t)

18See Garman (1976, p. 267) for further details.

19Compare e.g. Rummelhart and McClelland (1987).

20Compare Sommer (1999).

21The simulation runs with all firms generated by the real economy module would last for decades with the computational capacity available to us.

22Further details on the industry life cycle theory is neglected, since we intent to show how to connect a real economic model with a capital market model.

23The information investors have are categorized into positive and negative information. Exemplarily, we chose the growth rate of sales and profits as positive information whereas losses and exits are considered negative information. These data we picked as an example in order to show the functioning of the model. At the same time, this cancels out excessive speculative aspects, which would cause the share price to fluctuate even more. This aspect we leave for future research.

24For brevity this aspect is not outlaid any further here. For a detailed description of the knowledge diffusion process and how it is implemented into this model see Grebel (2004) or email the author.

25pjt := product price of firm j at time t; yjt :=price limit of firm j at time t; ∑ :=price elasticity of demand; xjt :=output of firm j at time t; hjt := oligopolistic interdependence of firm j at time t; nt :=number of firms at time t.


* References

ABERNATHY, W J and Utterback J M (1978) Patterns of industrial innovation. Technology Review 80(7), pp. 40-47.

ABERNATHY W and Townsend P (1985) Technology, productivity and process change. Technological Forecasting and Social Change 8(4), pp. 379-396.

ANG A, M Piazzesi, and MWei. (2006) What does the yield curve tell us about GDP growth? Journal of Econometrics 131(1-2) pp. 359-403

ARROW K (1964) The role of securities in the optimal allocation of risk bearing. Review of Economic Studies, 31, pp. 91-96.

BECKENBACH F. Briegel R and Daskalakis M (2007) Behavioural foundation and agent-based simulation of regional innovation, Papers on agent-based economics. University of Kassel, No3.

CAMPBELL J and Shiller R (1988) The dividend-price ratio and expectations of future dividends and discount factors. Review of Financial Studies 14, pp. 195-228.

COCHRANE J H (1991) Production-based asset pricing and the link between stock returns and economic fluctuations. Journal of Finance 46(1), pp. 209-237.

COCHRANE J H (2005) Financial markets and the real economy, Working Paper NBER (11193).

DAY R H and Chen P (1993) Nonlinear Dynamics and Evolutionary Economics. Oxford University Press, Oxford.

FAMA E F and French K R (1989) Business conditions and expected returns on stocks and bonds. Journal of Financial Economics, 25, pp. 23-49.

GARMAN M B (1976) Market microstructure. Journal of Financial Economics, 3, pp. 257-275.

GILBERT N (2006) When does Social Simulation Need Cognitive Models? In: Cognition and Multi-Agent Interaction. Sun, R. (Ed.), Cambridge University Press.

GORT M and Klepper S (1982) Time paths in the diffusion of product innovations. Economic Journal. 92, pp. 630-653.

GREBEL T and Pyka A (2006) Agent-Based Modelling - A Methodology for the Analysis of Qualitative Development Processes, in: Francesco C. Billari, Thomas Fent, Alexia Prskawetz, Jürgen Scheffran (Eds.), Agent-Based Computational Modelling - Applications in Demography, Social, Economic and Environmental Sciences. Physica-Verlag, Heidelberg, 17-36.

GREBEL T Krafft J and Saviotti P-P (2006) On the life cycle of knowledge intensive sectors, Revue de l'OFCE, No. 97 , pp. 63-85.

GREBEL T (2004) Entrepreneurship - A New Perspective, Routledge.

GREBEL T Hanusch H and Merey E (2004) Schumpeterian dynamics and financial market anomalies. University of Augsburg working paper. Nº 264.

GREBEL T Pyka A and Hanusch H (2003) An evolutionary approach to the theory of entrepreneurship. Industry and Innovation, 20(4), pp. 493-514.

HAYKIN S (1999) Neural Networks: A Comprehensive Foundation, Prentice Hall.

JOVANOVIC B (1982) Selection and the evolution of industry, Econometrica, 50(3), pp. 649-670.

JOVANOVIC B and MacDonald G (1994) The life-cycle of a competitive industry. Journal of Political Economy, 102(2), pp. 322-347.

KIRZNER I (1999) Creativity and/or Alertness: A Reconsideration of the Schumpeterian Entrepreneur. Review of Austrian Economics, 11, pp. 5-17.

KLEPPER S and Graddy E (1990) The evolution of new industries and the determinants of market structure. RAND Journal of Economics, 21(1), pp. 27-44.

LETTAU M and Ludvigson S (2001) Consumption, aggregate wealth, and expected stock returns. Journal of Finance, 56, pp. 815-849.

MAZZUCATO M and Semmler W (1999) Market share instability and stock price volatility during the industry life-cycle: the US automobile industry. Journal of Evolutionary Economics, 9(1), pp. 67-96.

MEYER B Vogt C and Voβkamp R (1996) Schumpeterian competition in heterogeneous oligopolies, Journal of Evolutionary Economics, 6, pp. 411-423.

PASTOR L and Veronesi P (2005) Rational IPO waves. Journal of Finance, 60(4), pp. 1713-1757.

PAJARES J López A and Hernández C (2003) Industry as an Organization of Agents: Innovation and R&D Management. Journal of Artificial Societies and Social Simulation, 6(2)7 https://www.jasss.org/6/2/7.html.

PORTER M E (1980) Competitive Strategy: Techniques for Analyzing Industries and Competitors, Free Press, New York.

POSADA M Hernández C and López-Paredes A (2006) Strategic Behaviour in Continuous Double Auction. In: Advances in Artificial Economics. The Economy as a Complex Dynamic System. Bruun C. (Ed.), Springer Verlag, Lecture notes in Economics and Mathematical Systems. Nº 584.

PYKA A (1999) Der kollektive Innovationsprozeß. Eine theoretische Analyse informeller Netzwerke und absorptiver Fähigkeiten, Special Issue, Duncker & Humblot, Berlin.

RUMMELHART D E and McClelland J L (1987) Parallel Distributed Processing, MIT Press, Cambridge, MA.

SHILLER R (1989) Market Volatility, MIT Press, Cambridge, MA.

SMITH V L (1989) Theory, Experiment and Economics. The Journal of Economic Perspectives, 3(1), pp. 151-169.

SOMMER J (1997) An artificial stock market: Asset pricing and endogenous expectations using neural networks, Volkswirtschaftliche Diskussionsreihe (168).

SOMMER J (1999) Künstliche neuronale Netze zur Beschreibung des Anlegerverhaltens auf spekulativen Märkten: Eine theoretisch-experimentelle Analyse, Tenea, Berlin.

UTTERBACK J M and Abernathy W J (1975) A dynamic model of product and process innovation, Omega, 3(6), pp. 639-56.

----

ButtonReturn to Contents of this issue

© Copyright Journal of Artificial Societies and Social Simulation, [2009]