©Copyright JASSS

JASSS logo ----

Thomas Hills and Peter Todd (2008)

Population Heterogeneity and Individual Differences in an Assortative Agent-Based Marriage and Divorce Model (MADAM) Using Search with Relaxing Expectations

Journal of Artificial Societies and Social Simulation vol. 11, no. 4 5
<https://www.jasss.org/11/4/5.html>

For information about citing this article, click here

Received: 16-Nov-2007    Accepted: 02-Aug-2008    Published: 31-Oct-2008

PDF version


* Abstract

While many models have investigated the role of competitive mate selection processes in human marriage, few have addressed the potential for assortative processes to explain the observed demographics, as well as simultaneously investigating divorce. To explore the possibility that assortative mate selection processes may explain patterns of both marriage and divorce, we developed an agent-based model, MADAM (Marriage and Divorce Annealing Model), based on homophilic trait matching, in which individuals search for mates similar to themselves, but relax these expectations as they age. MADAM assumes individuals live in a world with N mate-relevant traits, where each individual chooses a set of k traits from those N to represent his or her identity. Individuals seek marriage partners with some number of identical traits, but over time relax their expectations for this desired threshold number of matching traits. Divorce is allowed when individuals find a partner who shares more traits with them than their current partner. With this implementation, we explored how population heterogeneity and individual differences affect population-level demographic trends, finding that increasing population heterogeneity and a reduction in the rate of relaxing expectations can both increase the mean age at first marriage. MADAM also accurately predicts demographic marriage and divorce data across cultures, with quantitatively accurate predictions for length of first marriage, likelihood of first marriage ending in divorce, and percent of population married by the end of the lifespan.

Keywords:
Mate Choice, Mate Search, Foraging, Homophily

* Introduction

1.1
Marriage and divorce are associated with important costs and benefits in human societies. Among the more critical costs, the average age of first marriage is negatively correlated with population birth rates (Mathews and Hamilton 2002), and adult single, widowed, and divorced individuals and their children are at greater risk of psychological and health problems and early death than married individuals of the same age and economic status (Amato 2000; Gardner and Oswald 2004). The cultural and individual factors underlying marriage and divorce, and thus influencing the ensuing costs, are not well understood. To what extent does cultural heterogeneity influence marriage and divorce rates? How do individual differences in mate search strategies influence the likelihood and longevity of marriage? And just how malleable are these important social institutions to seemingly small changes in individual behavior mechanisms?

1.2
The present work aims to answer these questions using the agent-based Marriage And Divorce Annealing Model (MADAM), which captures the features and variability of the available human demographic data on length and timing of relationships. The model is based on a ubiquitous animal foraging behavior called area-restricted search, here applied to the search task of individuals seeking high-quality relationships (with quality measured by how well two individuals match on specific features). The operation of the model also serves to demonstrate that marriage and divorce processes can be explained as outcomes of a non-competitive process involving selection for similarity in traits or preferences.

1.3
Marriage and divorce demographic data are presented in Figure 1 for New Zealand, Iceland, and England (Statistics Iceland 2004; National Statistics 2006; Statistics New Zealand 2004). Data for other countries have been published elsewhere (Statistics Canada 1996; Todd, Billari, and Simão 2005). The figure shows the hazard rates for marriage and divorce, which represent the probability that a previously unmarried (respectively, married) individual gets married (respectively, divorced) at a given age. The general trend is that marriage rates peak shortly after reproductive maturity and fall slowly with increasing individual age. Divorce rates show a similar pattern at slightly later ages. Comparing marriage curves across countries and over the past 20 years suggests that, across cultures, peak marriage rates are decreasing and first marriages are happening later in life. For example, the estimated median age at first marriage in the U.S. has been steadily increasing, from 22.7 in 1949 to 27.1 in 2003 for men, and from 20.3 to 25.3 during the same period for women (U.S. Census Bureau 2003). At the same time, divorce rates have risen steadily for the past 50 years in most of the Western world (Cherlin 1992; Goode 1993) while declining elsewhere (Heaton et al. 2001; Hirschman and Teerawichitchainan 2003) .

Figure
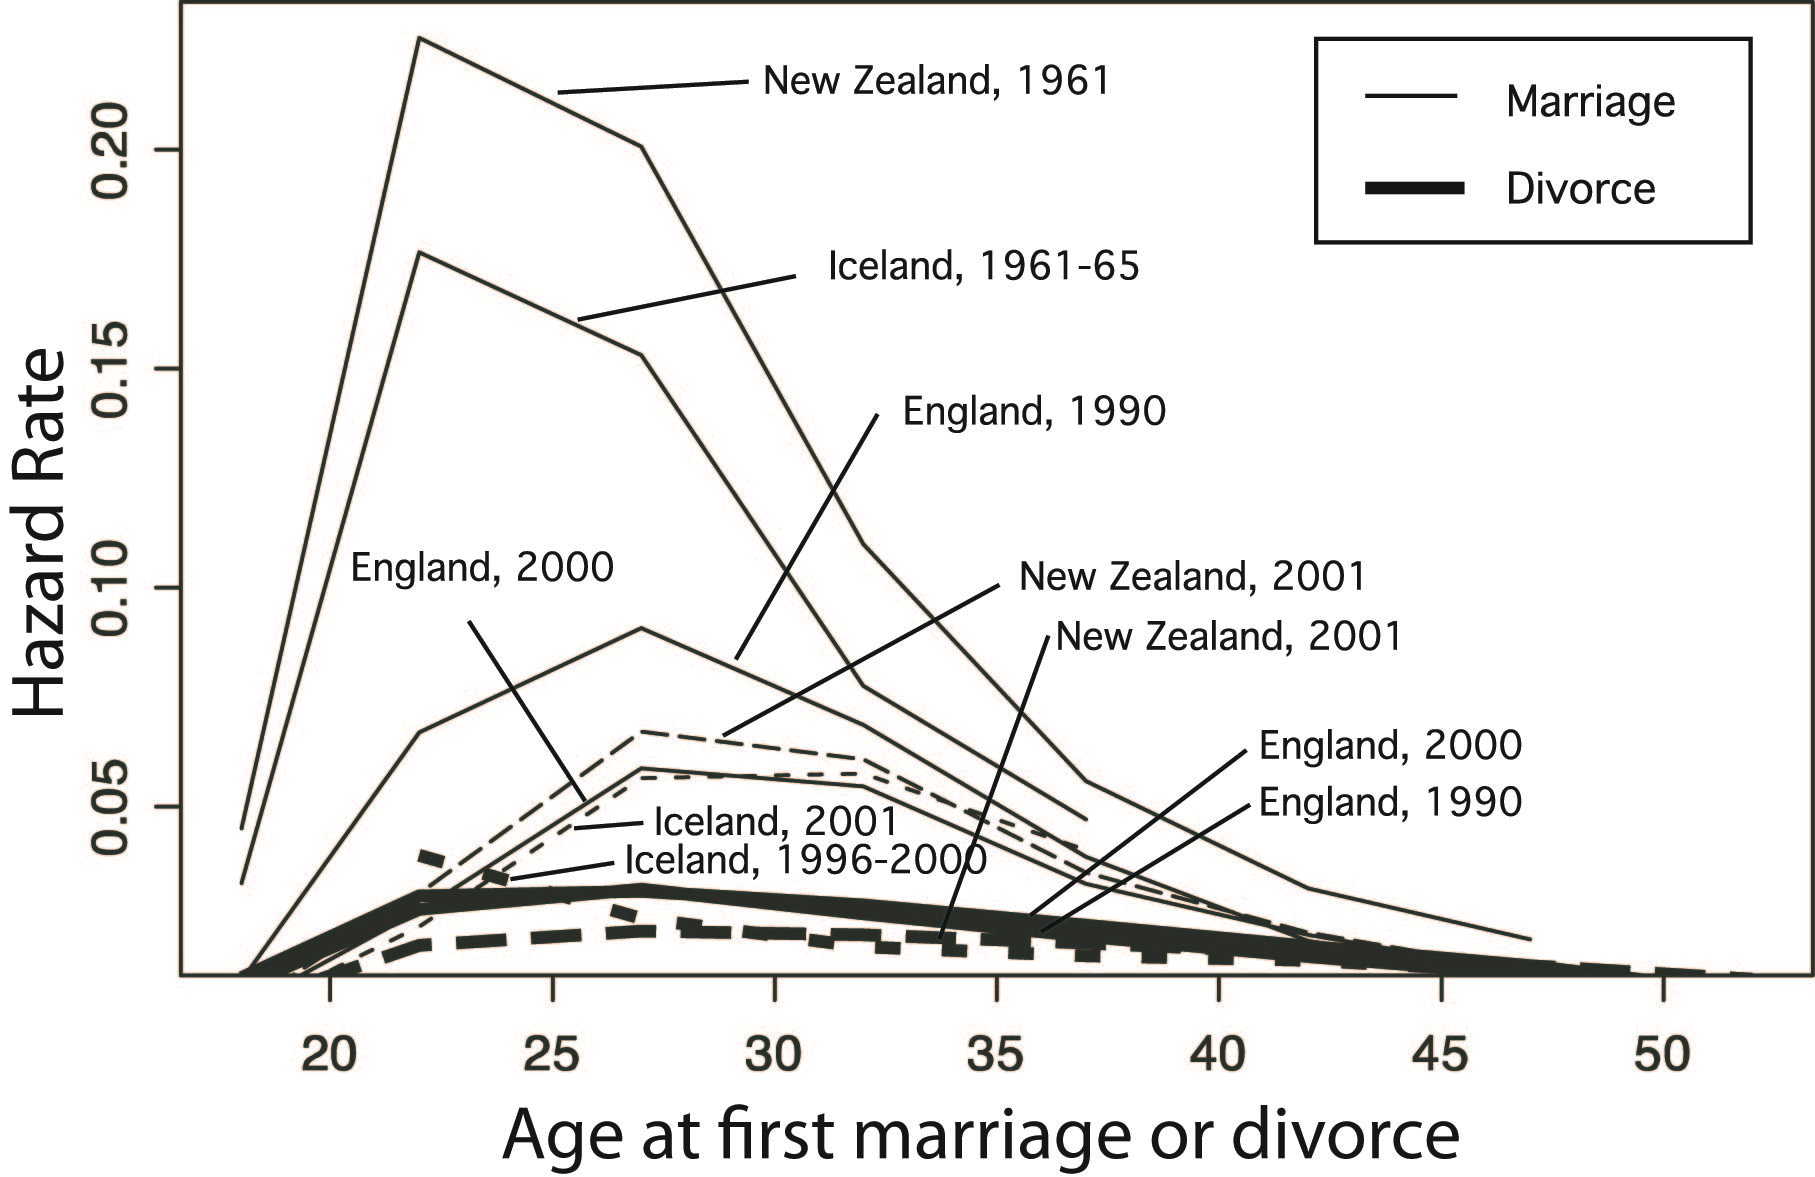
Figure 1. Age at first marriage and divorce hazard rates for the United Kingdom, Iceland, and New Zealand. The curves show the mean for both sexes at a given year. Thick lines represent divorce
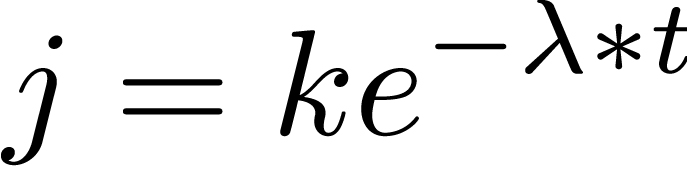
1.4
Could the trends in Figure 1 and across cultures arise as the consequences of changes in individual search behavior and population heterogeneity? To find out, we developed the MADAM model of search with relaxing expectations. Search with relaxing expectations refers to a broad class of search or foraging processes that begin with the highest expectation for success (and hence highest threshold above which a target will be accepted), and then, if an appropriate target is not found, relax that expectation (and threshold) and search for the next best target (or in the next best location—see Hills 2006). Targets in MADAM are marriage partners who may share some number of traits with the seeker.

1.5
The ratio of the number of traits represented across all individuals in the population relative to the number of traits held by each individual determines the overall population heterogeneity: For instance, if traits are books that an individual could like, there are 20 books in the world, and each individual likes exactly 4 books, then the heterogeneity of that population would 20/4 = 5. Individuals in populations with higher heterogeneity tend to share fewer traits on average with other individuals selected at random from the population; individuals in the previous world of 20 books will share far fewer liked books than individuals in a 20-book world with heterogeneity 2, where each individual now likes 10 books.

1.6
The search is non-competitive in the sense that individuals hope to find a best relationship determined by idiosyncratic preferences and traits that are shared with their partner. This is different from other models that assume a more competitive search based on population-wide common preferences, for example, where objective mate values are assigned to each individual and males compete for the agreed-upon best females (Miller and Todd 1998).

1.7
MADAM's use of relaxing expectations is inspired by a ubiquitous spatial foraging behavior known in the biological literature as area-restricted search, in which animals search locally around places where they have experienced resources in the recent past, but transition to more and more global search at more wide-spread locations as resources are not found. This behavior has been observed in many species, including mammals, insects, and nematodes (Bell 1991; Hills et al. 2004; Kareiva and Odell 1987). Recent evidence suggests an evolutionary relationship between this local-to-global foraging process and goal-directed cognition, as both share molecular and behavioral characteristics (Hills 2006). MADAM is primarily an extension of this local-to-global search process to human mate search with the initial 'local' mate search starting 'nearby' the individual's own traits and gradually allowing less similarity in an acceptable mate over time. This assumption of a continuous local-to-global mate search process for humans is both psychologically plausible and consistent with the evidence for homophily we describe below, as well as with data showing both monotonic declines in narcissistic personality traits (i.e., self-preferential behaviors) and an increase in agreeableness over the reproductive lifespan (Foster et al. 2003; Srivastava et al. 2003).

1.8
That individuals are most likely to be in relationships with others like themselves (homophily) is a staple of the sociological literature (McPherson et al. 2001). Marriage, in particular, is a hotbed of homophilic interactions (Kalick and Hamilton 1986; Kalmijn 1998). Humans appear to mate assortatively along dimension such as age, IQ, height, weight, nationality, educational and occupational levels, and physical and personality characteristics (Alvarez and Jaffe 2004; Miller and Todd 1998). While homophily between partners may increase during marriage—as a consequence of developing shared preferences—homophilic interactions begin long before marriage, and these may ultimately account for some of the observed homophily in marriage. Dimensions likely to organize individuals along homophilic relations prior to marriage are ethnicity in schoolmate friendships (Shrum et al. 1988) and work relations (Ibarra 1995; Lincoln and Miller 1979), age (Shrum et al. 1988), religion (Fischer 1977), education (Marsden 1988; Wright 1997), and behavioral similarity (Cohen 1977; Kandel 1978). Other dimensions likely to play a role in the development of homophilic relationships are geography, family relations, and organizing foci such as churches, schools, and the workplace (Fischer 1977).

1.9
Sharing characteristics with another individual increases their attractiveness. For example, similarity in preferences, attitudes, descriptions of objects, and social networks with someone lead to higher ratings of that person's attractiveness and desirability as a mate (Buston and Emlen 2003; Byrne 1997). In an elegant experiment, Moreland and Zajonc (1982) showed that by increasing or reducing the amount of perceived attitudinal similarity between a subject and a picture of a person, they could increase or reduce, respectively, the subject's physical attraction to that person. Furthermore, simple familiarity with a face, of the kind which may result from frequent social encounters, increases attractiveness (Peskin and Newell 2004). This suggests that attractiveness is not just in the eye of the beholder, but relative to the familiarity and shared identities of the beholder and the beheld (Cunningham et al. 1995; Thornhill and Gangestad 1999).

1.10
The evidence provided above for homophilic assortative mating appears to downplay the role of competition in human mate search, because homophilic mechanisms that sort the population into smaller subgroups based on similarity reduce competition by reducing the number of competitors. While competitive marriage models have been posited to explain marriage demography with resulting homophily along 'quality' dimensions (Todd, Billari, and Simão 2005; Kalick and Hamilton 1986), a non-competitive model incorporating the homophilic principle of 'self-seeks-like' has not yet been shown to be able to explain marriage and divorce demography (but see Jaffe 1999 for a gene-based biological example that explores the adaptive value of different mate selection criteria) . MADAM does so, building on research indicating that individuals make mate choices based on subjective similarity and incorporating relaxing expectations for matching preferences as unmarried individuals age.

* MADAM

2.1
To understand more about the factors influencing marriage and divorce (or the creation and dissolution of long-term pair bonds), we model mate search as a situation where individuals in the population have particular traits, and where individuals who share more traits are more likely get married. To do this we assume N mate-relevant trait dimensions available in the world. Traits can be taken to represent cultural preferences (e.g., the writing of James Joyce, caber tossing, or popular musicians) and/or they may represent the phenotypic display of genetic alleles (e.g., hair color and MHC). Each individual in the population is randomly assigned k traits (k < N, without replacement) that represent their identity. There are therefore (N choose k) individual types available in the population, with each type representing a unique set of k traits.

2.2
When individuals reach reproductive age they begin searching in the population for individuals of the opposite sex (this assumption can be relaxed, but we do not here) who are like themselves, in that they match on at least a certain number of traits. Any time two unmarried individuals meet and match on j or more traits, they get married. We call this preference level, j, the satisfice level (Todd 1997; Todd and Miller 1999), because it is the lowest level of similarity for which the individual is satisfied and therefore willing to get married.

Marriage

2.3
To simulate the marriage hazard rates shown in Figure 1, MADAM generates populations of individuals whose identities are represented by k distinct randomly chosen traits from a possible set of N population traits. Initially, individuals set their satisfice level j at its highest possible value, k, in expectation of finding the 'best' possible match—a mate who matches them on all their traits. Each year of time in the model, individuals randomly meet x individuals of the opposite sex from the population (without replacement) and compare traits. If a meeting couple match on enough traits, and neither is already married to another individual in the population, then they get married. Both individuals must agree for marriage to occur and the number of traits that match must be equal to or exceed each individual's satisfice level, j, which relaxes as time progresses.

2.4
Individuals all start at the same age, but experience differing relaxation rates for j. We assume that unmarried individuals relax their satisfice level with respect to their age, reducing it each year to a fraction of the previous year's value. The satisfice level j at a given age t is therefore

Equation (1)

2.5
Each individual is randomly assigned a relaxation (or decrement) rate, λ, from a normal distribution with mean μ and standard deviation σ. In this way, as individuals age, satisfice levels generally go down for unmarried individuals. The normal distribution does allow for some pathological individuals to have negative λ; constraining these individuals to λ = 0 does not affect the results we present here. This mimics the observation that in real populations some individuals never lower their standards (and may never get married). In general, different monotonically declining satisfice functions—for example, a linear relaxation (j = k - λ t)—generate demographic results for marriage and divorce similar to those we report here.

Divorce

2.6
Married individuals remain in the population and continue to encounter both unmarried and married individuals just as when single, which creates the potential for divorce. Numerous surveys suggest that adultery or infidelity is the most common reason for divorce (Amato and Previti 2003; Kitson et al. 1985). Consequently, we focus on divorce for the purpose of remarriage, where at least one individual finds a 'better' willing partner (with whom he or she shares more traits than they do with their present marriage partner) and leaves the present relationship to enter into the better-matched remarriage. Divorce with remarriage, as modeled here, represents a 'trade up' situation, for at least one of the initial marriage partners. As individuals trade up in the population—for partners who are better matched to themselves—the divorce rate eventually goes down because there are no better relationships to be had.

2.7
While satisfice levels are always decreasing for unmarried individuals, married individuals have a static satisfice level, which is set at the match level of their present marriage. The divorced-but-not-remarried former partners of remarried individuals begin relaxing their satisfice level anew, but it is relaxed from the value they enjoyed in their last marriage. In other words, k in equation 1 is replaced with the satisfice level experienced in the previous marriage and t begins again at zero.

Summary of the Model

2.8
The MADAM model begins by generating 100 males and 100 females. Each individual is assigned their trait identity of k traits, randomly chosen without replacement from the range 1 through N, where N is the number of possible traits to choose from in the population. Each individual's satisfice level, j, is initially set to k. Each individual is also assigned a relaxation rate, λ, sampled from the normal distribution N(μ, σ). In year one of model time, each male and each female randomly encounter x members of the opposite sex—these are assumed to be the number of encounters per year that are of sufficient seriousness to reveal underlying trait similarities. When two unmarried individuals meet, if they match on j or more traits they get married and fix their satisfice level, j, at the level of their current match. At the end of the year, all unmarried individuals relax their satisfice level according to equation 1. In the next year, all individuals meet as in prior years, but only unmarried individuals marry as in prior years. Married individuals who meet new partners (married or unmarried) that exceed their present satisfice levels and for whom they are also acceptable matches (so that both parties agree to a new marriage), divorce their old partners and marry the new partner, resetting their satisfice level to that of the new match (i.e., to how many features they and their new partner share in common). The divorced-but-not-remarried individual leaves their satisfice level at that of the prior marriage, but relaxes it according to equation 1 each year if no new partners are found.

2.9
The model has the following five free parameters: N = the number of possible traits in the population; k = the number of traits assigned to each individual; μ = the mean population satisfice-level relaxation rate; σ = the standard deviation in the population's relaxation rate; x = the number of encounters with new potential partners in each year. Increasing or reducing the encounter rate, x, functions to compress or expand, respectively, the timescale for events associated with the marriage and divorce curves. In the limit, where x equals the size of the partner pool, all marriage and divorce takes place in the first year. In the rest of this paper, we fix x at four encounters per year.

* Results

3.1
For a wide variety of parameter values, the qualitative patterns of marriage and divorce produced by MADAM match the empirical data (compare Figure 2 and Figure 3 with Figure 1). This pattern can be characterized as a rapid increase in marriage and divorce rates that peaks soon after the onset of mate search, and then declines slowly as individuals age. Note that the time axis should be taken as a measure of the years since the beginning of the mate search period, approximated for instance by ages between 10 and 13, at the onset of puberty.

How does cultural or population heterogeneity affect marriage and divorce rates?

3.2
Modern societies are increasingly culturally heterogeneous, with many more traits in the population than are held by any given individual. Furthermore, the internet and other forms of rapid telecommunication allow individuals to develop complex and specific preferences that were previously unavailable in our cultural history. With MADAM we can ask how population heterogeneity influences marriage and divorce rates by investigating the consequences of changing the number of population traits, N, and the number of individual traits, k. Population heterogeneity is defined here as the ratio of unique traits in the population to unique traits held by an individual. Figure 2 presents the results of MADAM for three different numbers of population traits and Figure 3 presents results for 6 different numbers of individual traits, showing the average of 1000 model runs for each parameter setting.

3.3
As the number of traits, N, in the population increases, holding the number of individual traits, k, constant, heterogeneity in the population goes up, causing peak first marriage rates to go down and be pushed to older ages (Figure 2). Divorce rates follow a similar pattern, but are reduced to a lesser degree than marriage curves. As populations become more heterogeneous, the best-matching partners become rarer in the population and thus harder to find, and individuals take longer to ultimately find worse matches. Conversely, as populations become more homogenous, marriage and divorce rates go up and the average age at first marriage goes down.

Figure
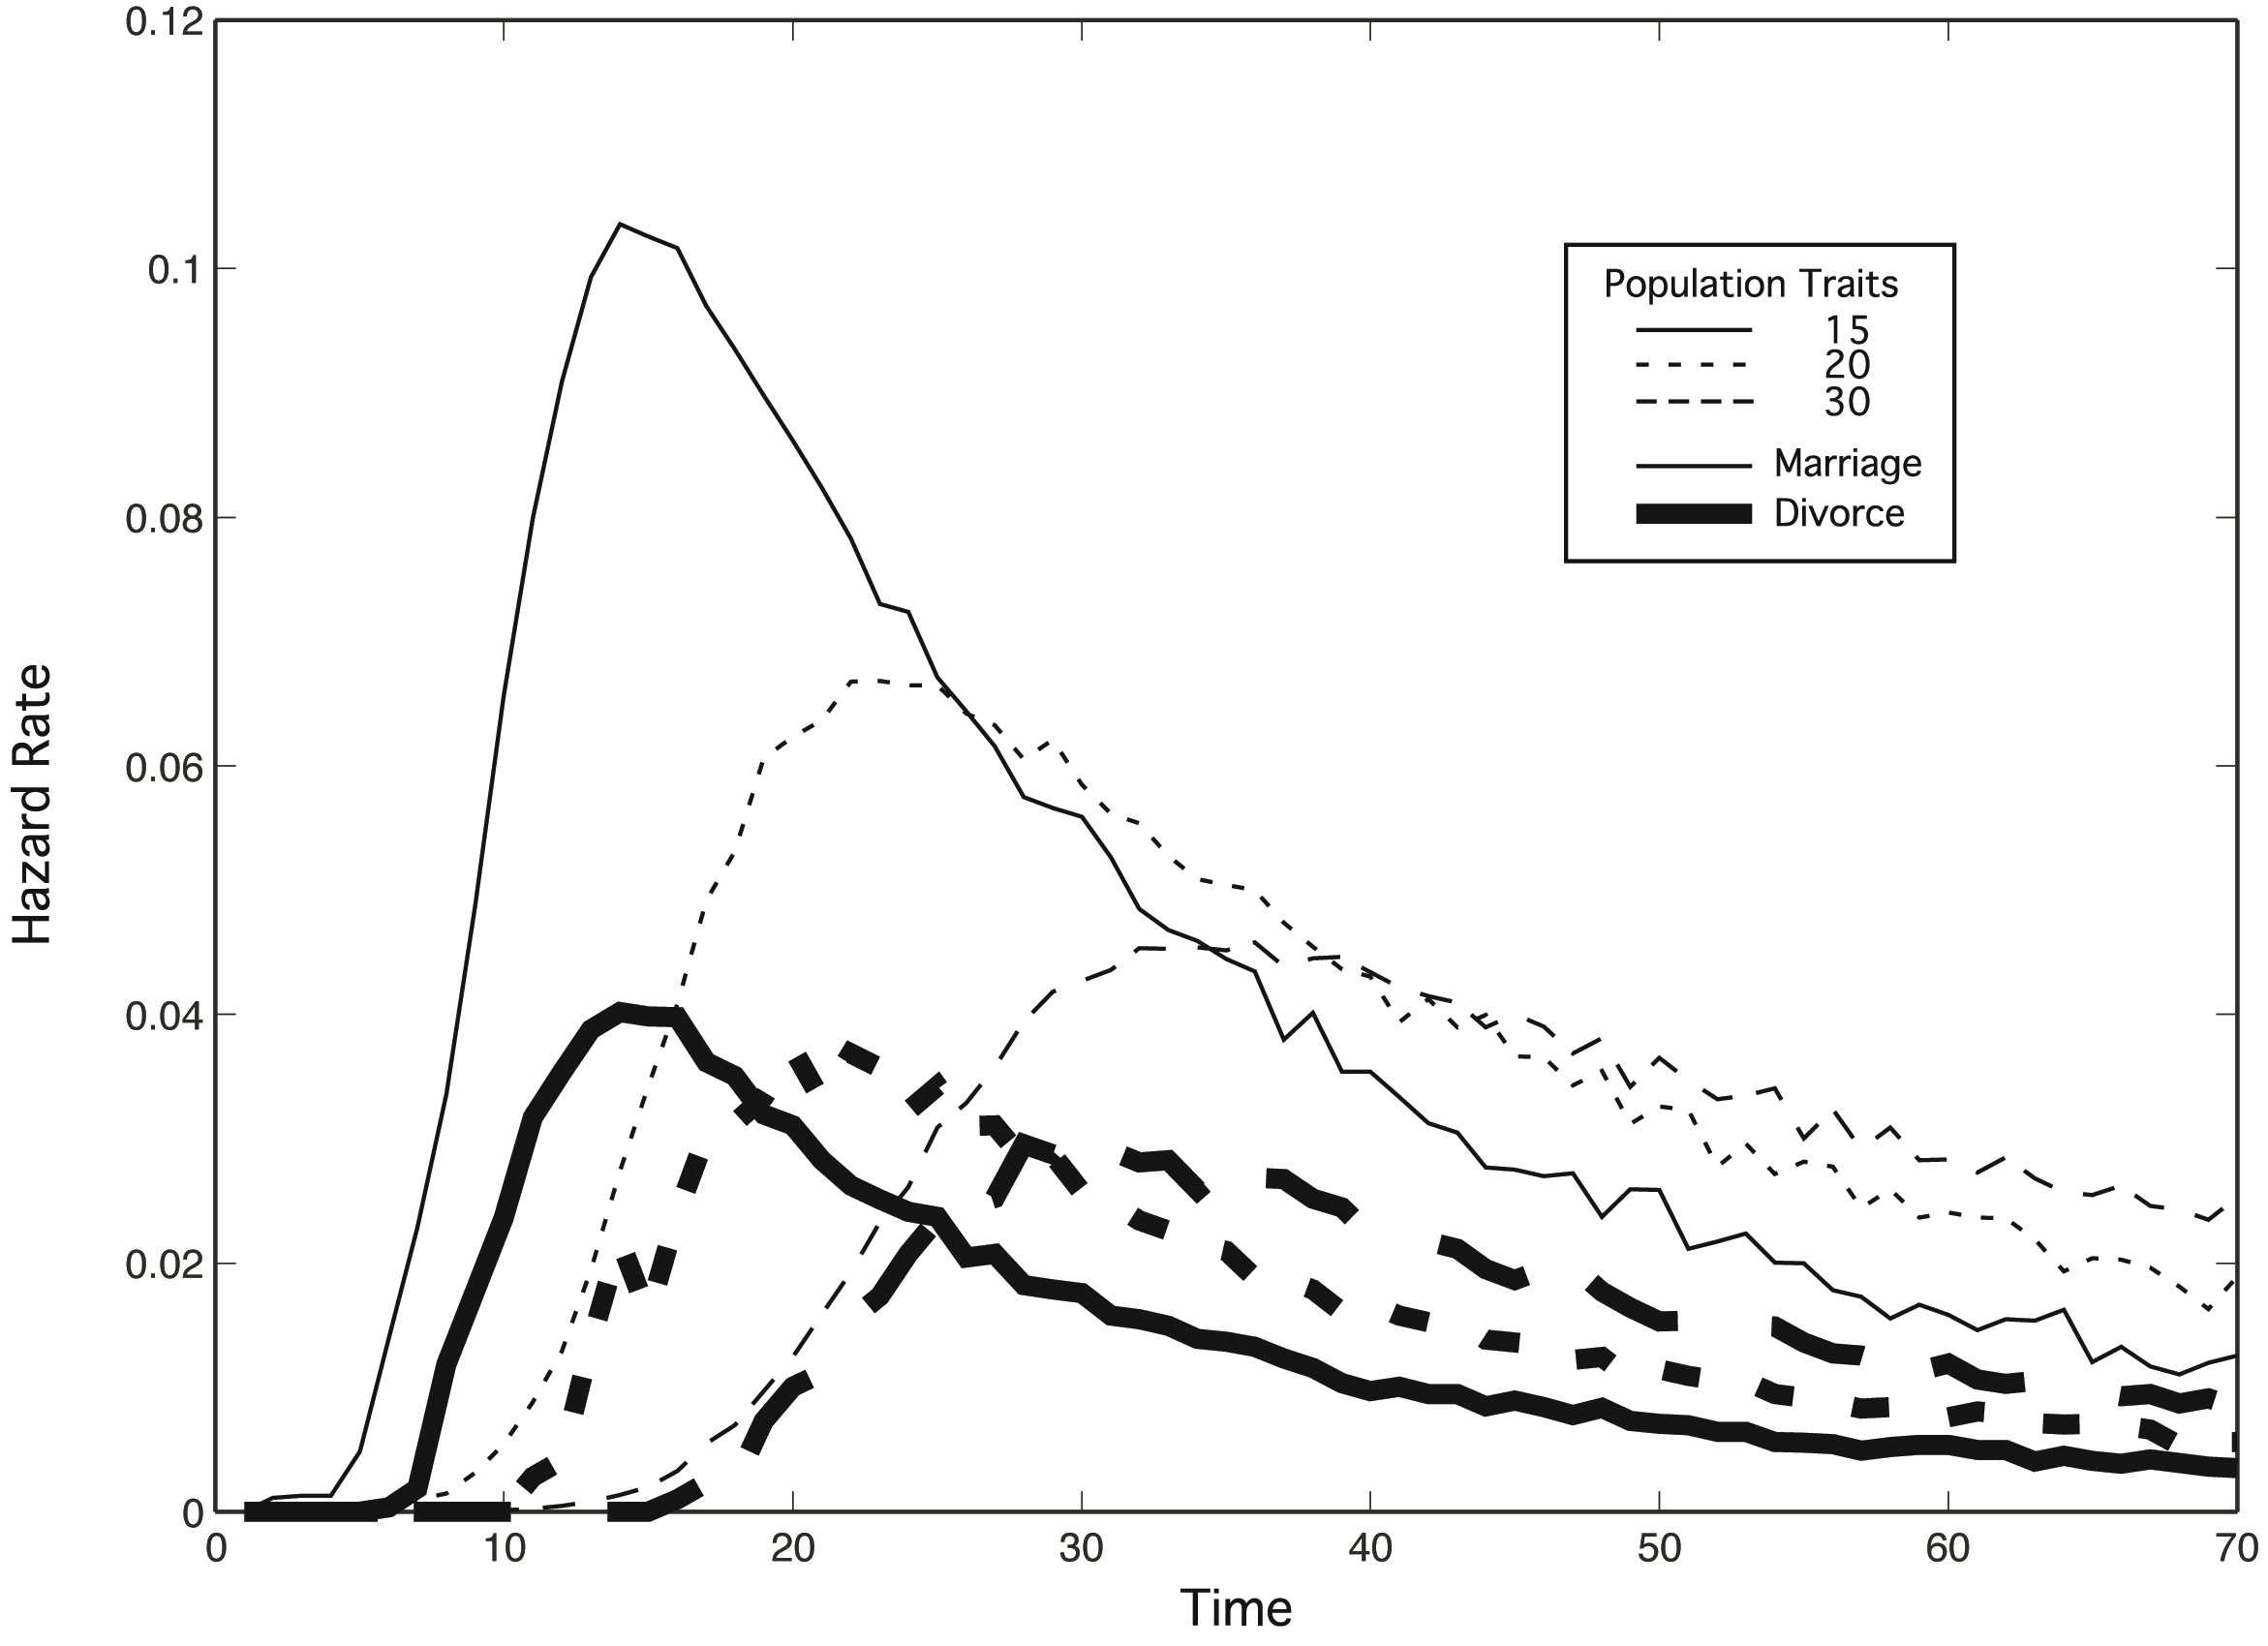
Figure 2. Age at first marriage and divorce hazard rates for differing levels of N population traits in a population with exponential rates of relaxing expectations. Lines represent mean results for 1000 replications each of 100 males and 100 females who meet only 4 individuals of the opposite sex per year. Individuals have 10 traits (k) sampled from the number of population traits. Satisfice levels start at 10 and are exponentially relaxed according to each individual's relaxation rate, λ, sampled from the normal distribution N(0.02, 0.01). Thin lines represent hazard rates for marriage; thick lines for divorce. Time is measured in model years from the onset of reproductive age (approximately 10)

3.4
Decreasing the number of individual traits while keeping the number of population traits constant also increases population heterogeneity. Again, both marriage and divorce rates shrink and shift to older ages as population heterogeneity increases, as shown in Figure 3 (where as usual satisfice level j always starts at k).

Figure
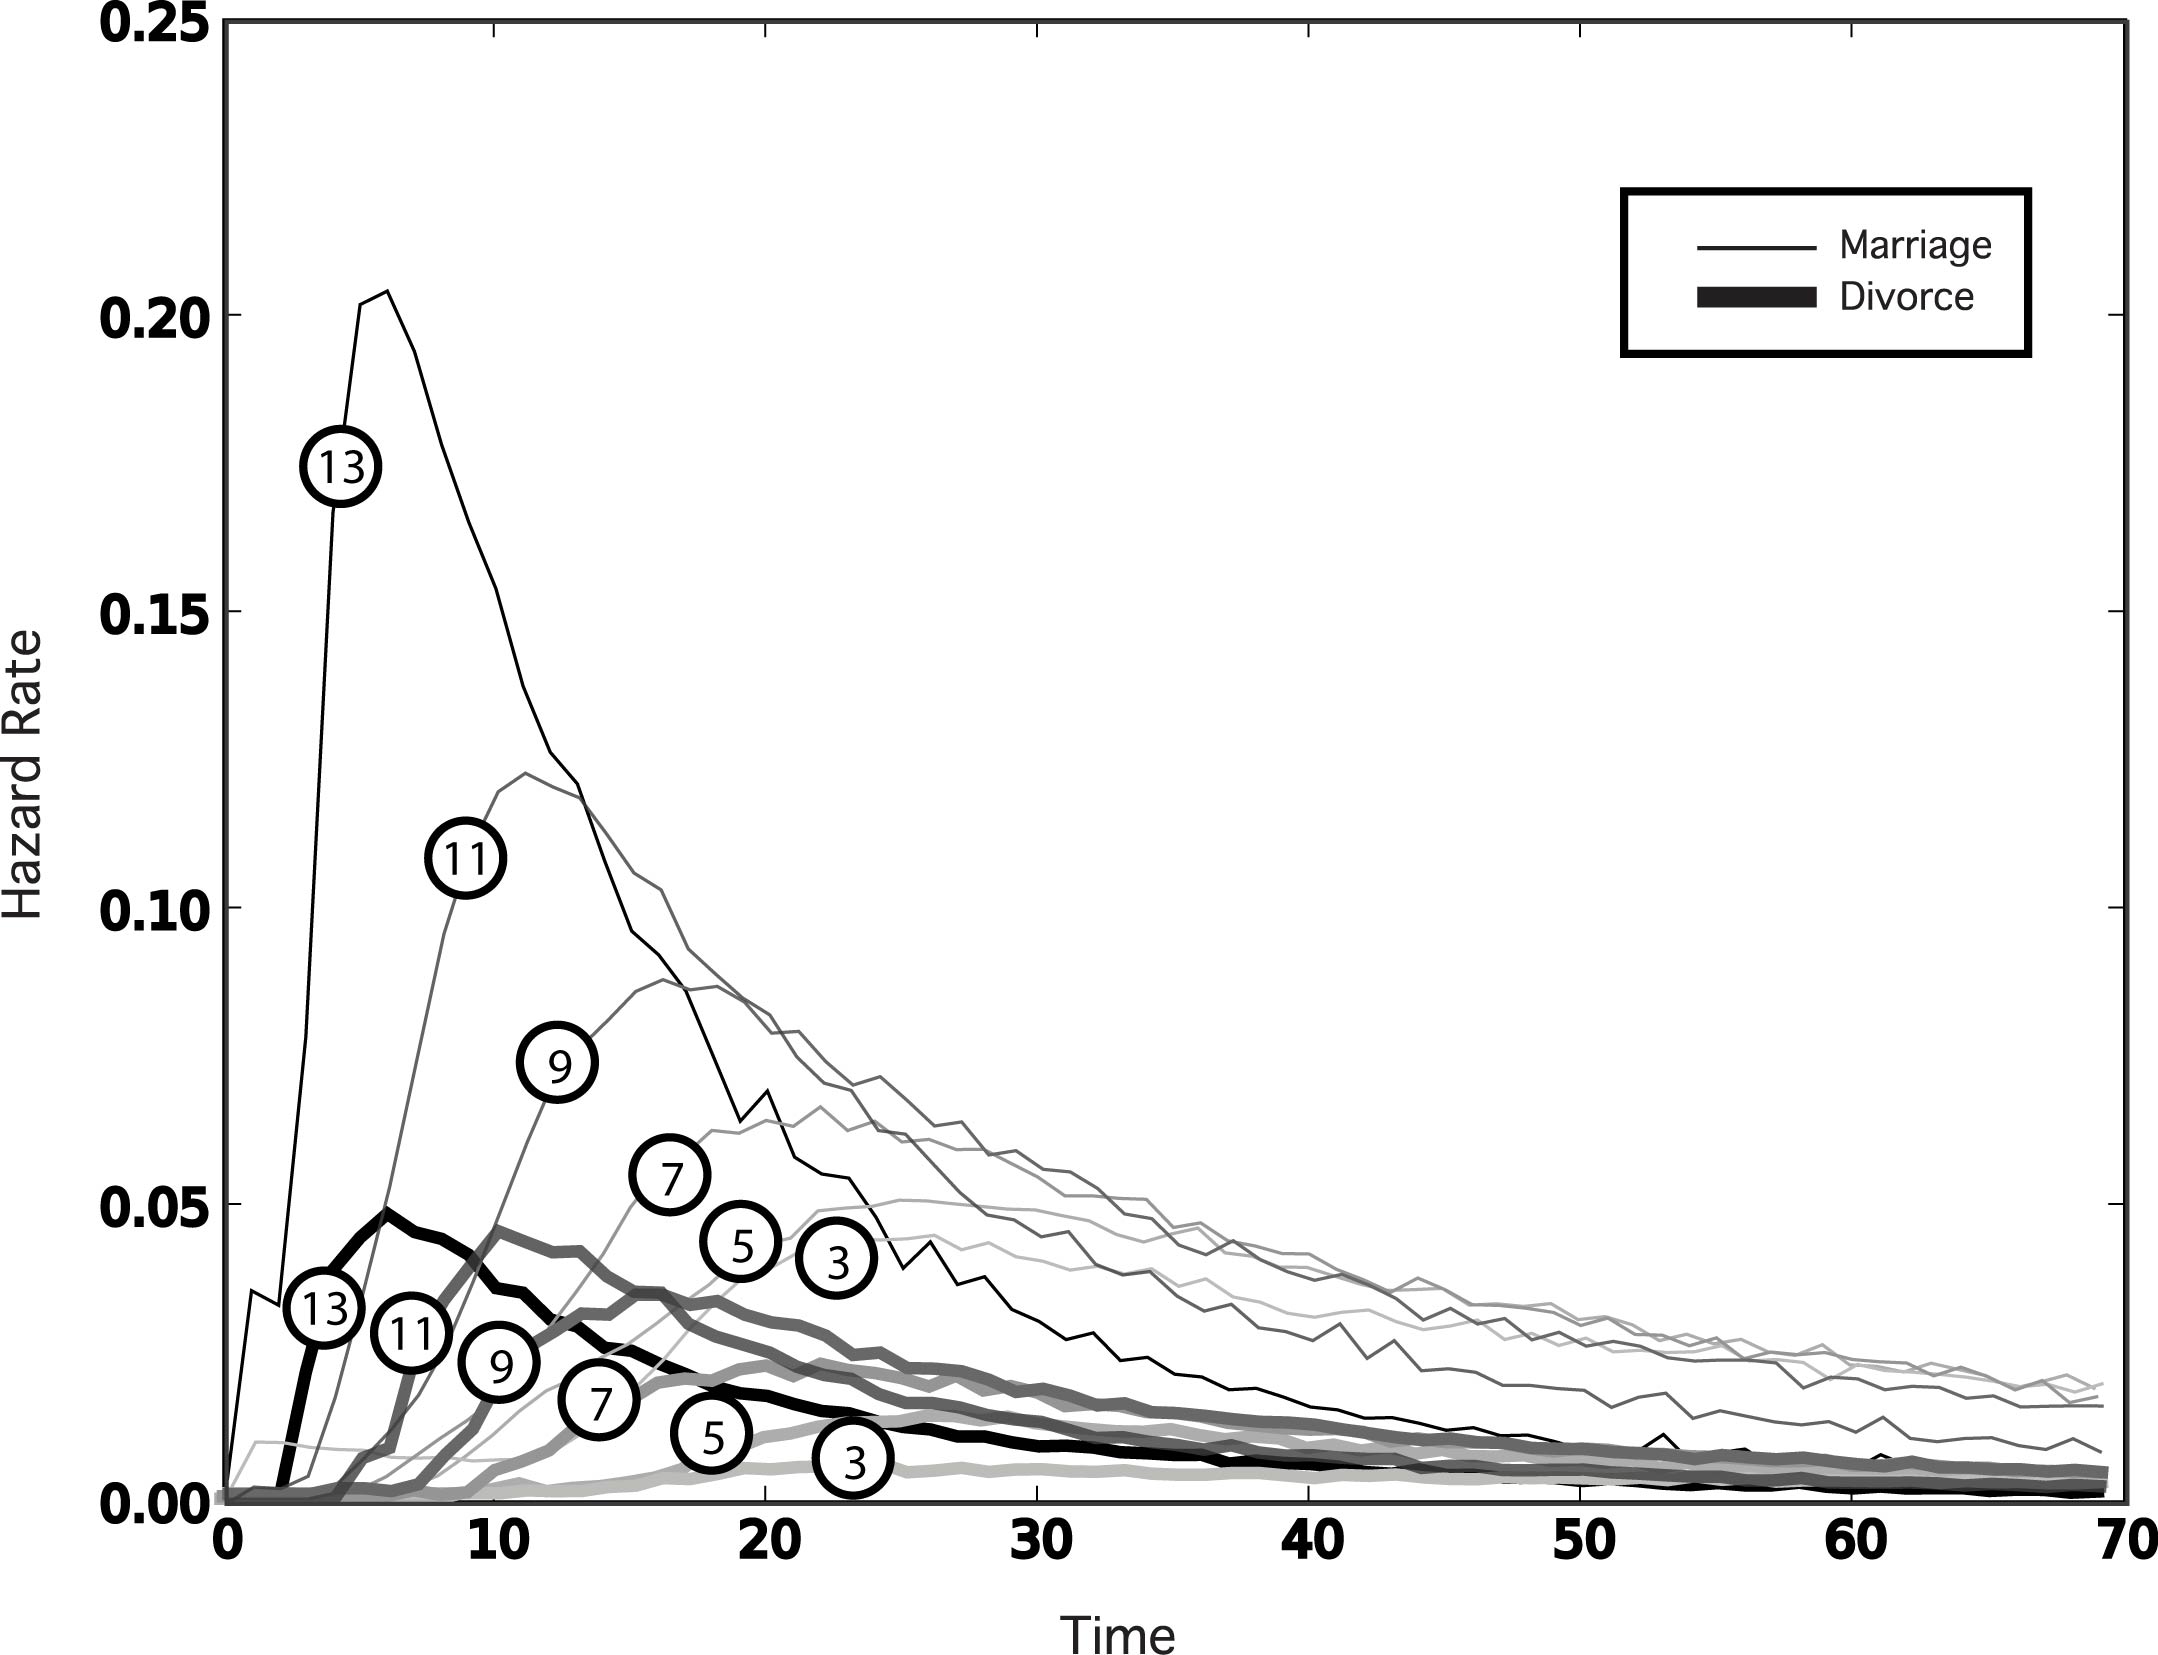
Figure 3. Age at first marriage and divorce hazard rates for differing levels of k individual traits (indicated in circles; thin upper lines represent marriage, thicker lower lines represent divorce), with N = 15. Satisfice levels start at j = k. Otherwise the simulation parameters are as in Figure 2. As the number of individual traits k are reduced relative to the number N of traits in the population, the peak age at first marriage and peak divorce rate move to older ages

3.5
In both of the above cases, the analysis suggests that if individuals are using feature matching to find mates, then as populations become more diverse relative to individuals, finding similar-enough partners becomes increasingly difficult. This causes both marriage and divorce rates to go down at younger ages, and also to increase at older ages.

3.6
In MADAM, N and k can both be raised in proportion to one another (e.g., going from N=30 and k=20 to N=300 and k=200) without significantly changing the qualitative results (data not shown). Also, if individuals in one population start with different k values, this flattens the marriage curves and raises the divorce curves (data not shown).

How do changes in individual search behavior affect marriage and divorce rates?

3.7
How might the emphasis in modern Western societies of "finding your perfect match" influence marriage and divorce rates? In MADAM, emphasizing a high level of compatibility can be captured by relaxing one's expectations more slowly, that is by lowering λ. Figure 4 shows simulation results for changes in the mean rate of relaxing expectations (μ). As relaxation rates go down, and individuals stay pickier for longer, the peak of the age-at-marriage distribution moves to the right, representing longer pre-marriage search periods. As with varying N and k, the curves also show that as relaxation rates go down, the rate of older marriages increases while that of younger marriages decreases. This is consistent with the intuition that populations that take longer to reduce their satisficing levels should take longer to marry. At the same time, populations that search longer for high quality mates have less divorce. In Figure 4 the divorce rates relative to the marriage rates (at the peak) go from approximately 40% of the marriage rate to 20% of the marriage rate as μ changes from 0.02 to 0.005.

Figure
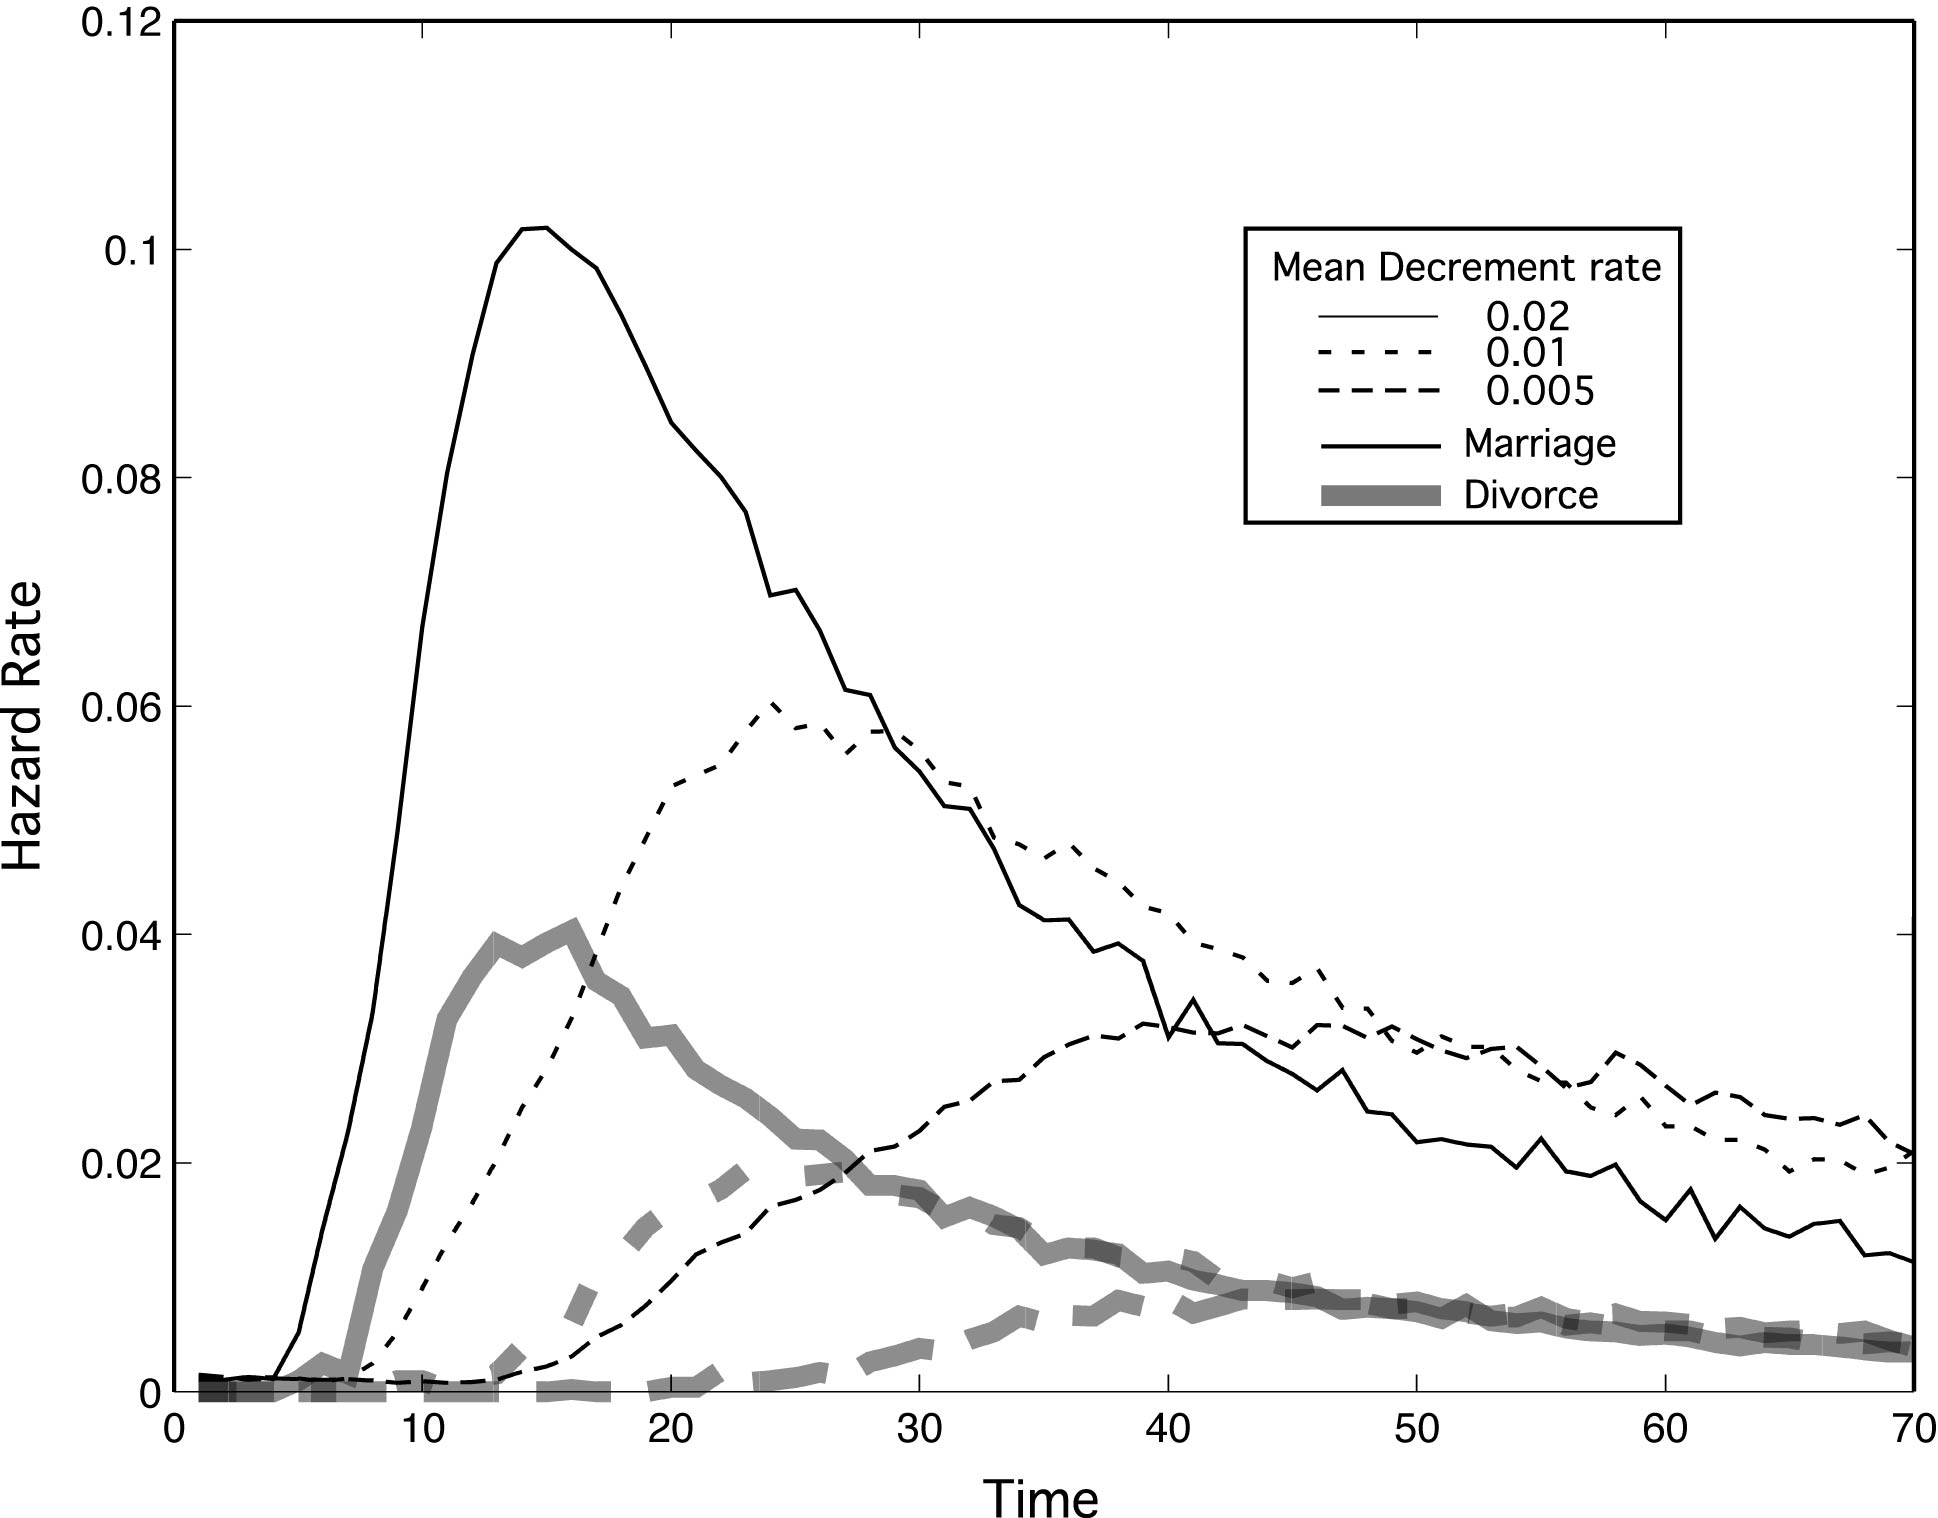
Figure 4. Marriage and divorce hazard rates for differing mean rates of relaxing expectations (μ). σ = μ / 2. Otherwise parameters are as in Figure 2, with N = 15 and k = 10. As individuals become pickier and relax their expectations more slowly, marriage rates go down in tandem with divorce rates

3.8
Increasing the standard deviation (σ) in individual rates of relaxing expectations has the consequence of both lowering marriage rates and increasing divorce rates (Figure 5). However, increasing σ also moves the peak of the marriage distribution to an earlier age, representing earlier age at first marriage on average. Low variance means most individuals are looking for partners with approximately the same expectations as themselves. In this way the population of unmarried individuals adjust their satisfice levels as a group. When variance is high, individuals tend to meet with differing expectations, and while this leads to a noticeable proportion of early low-expectation marriages and consequent high divorce rates immediately following, it does not lead to high peak marriage rates because individuals reach their peak expectation at different times.

Figure
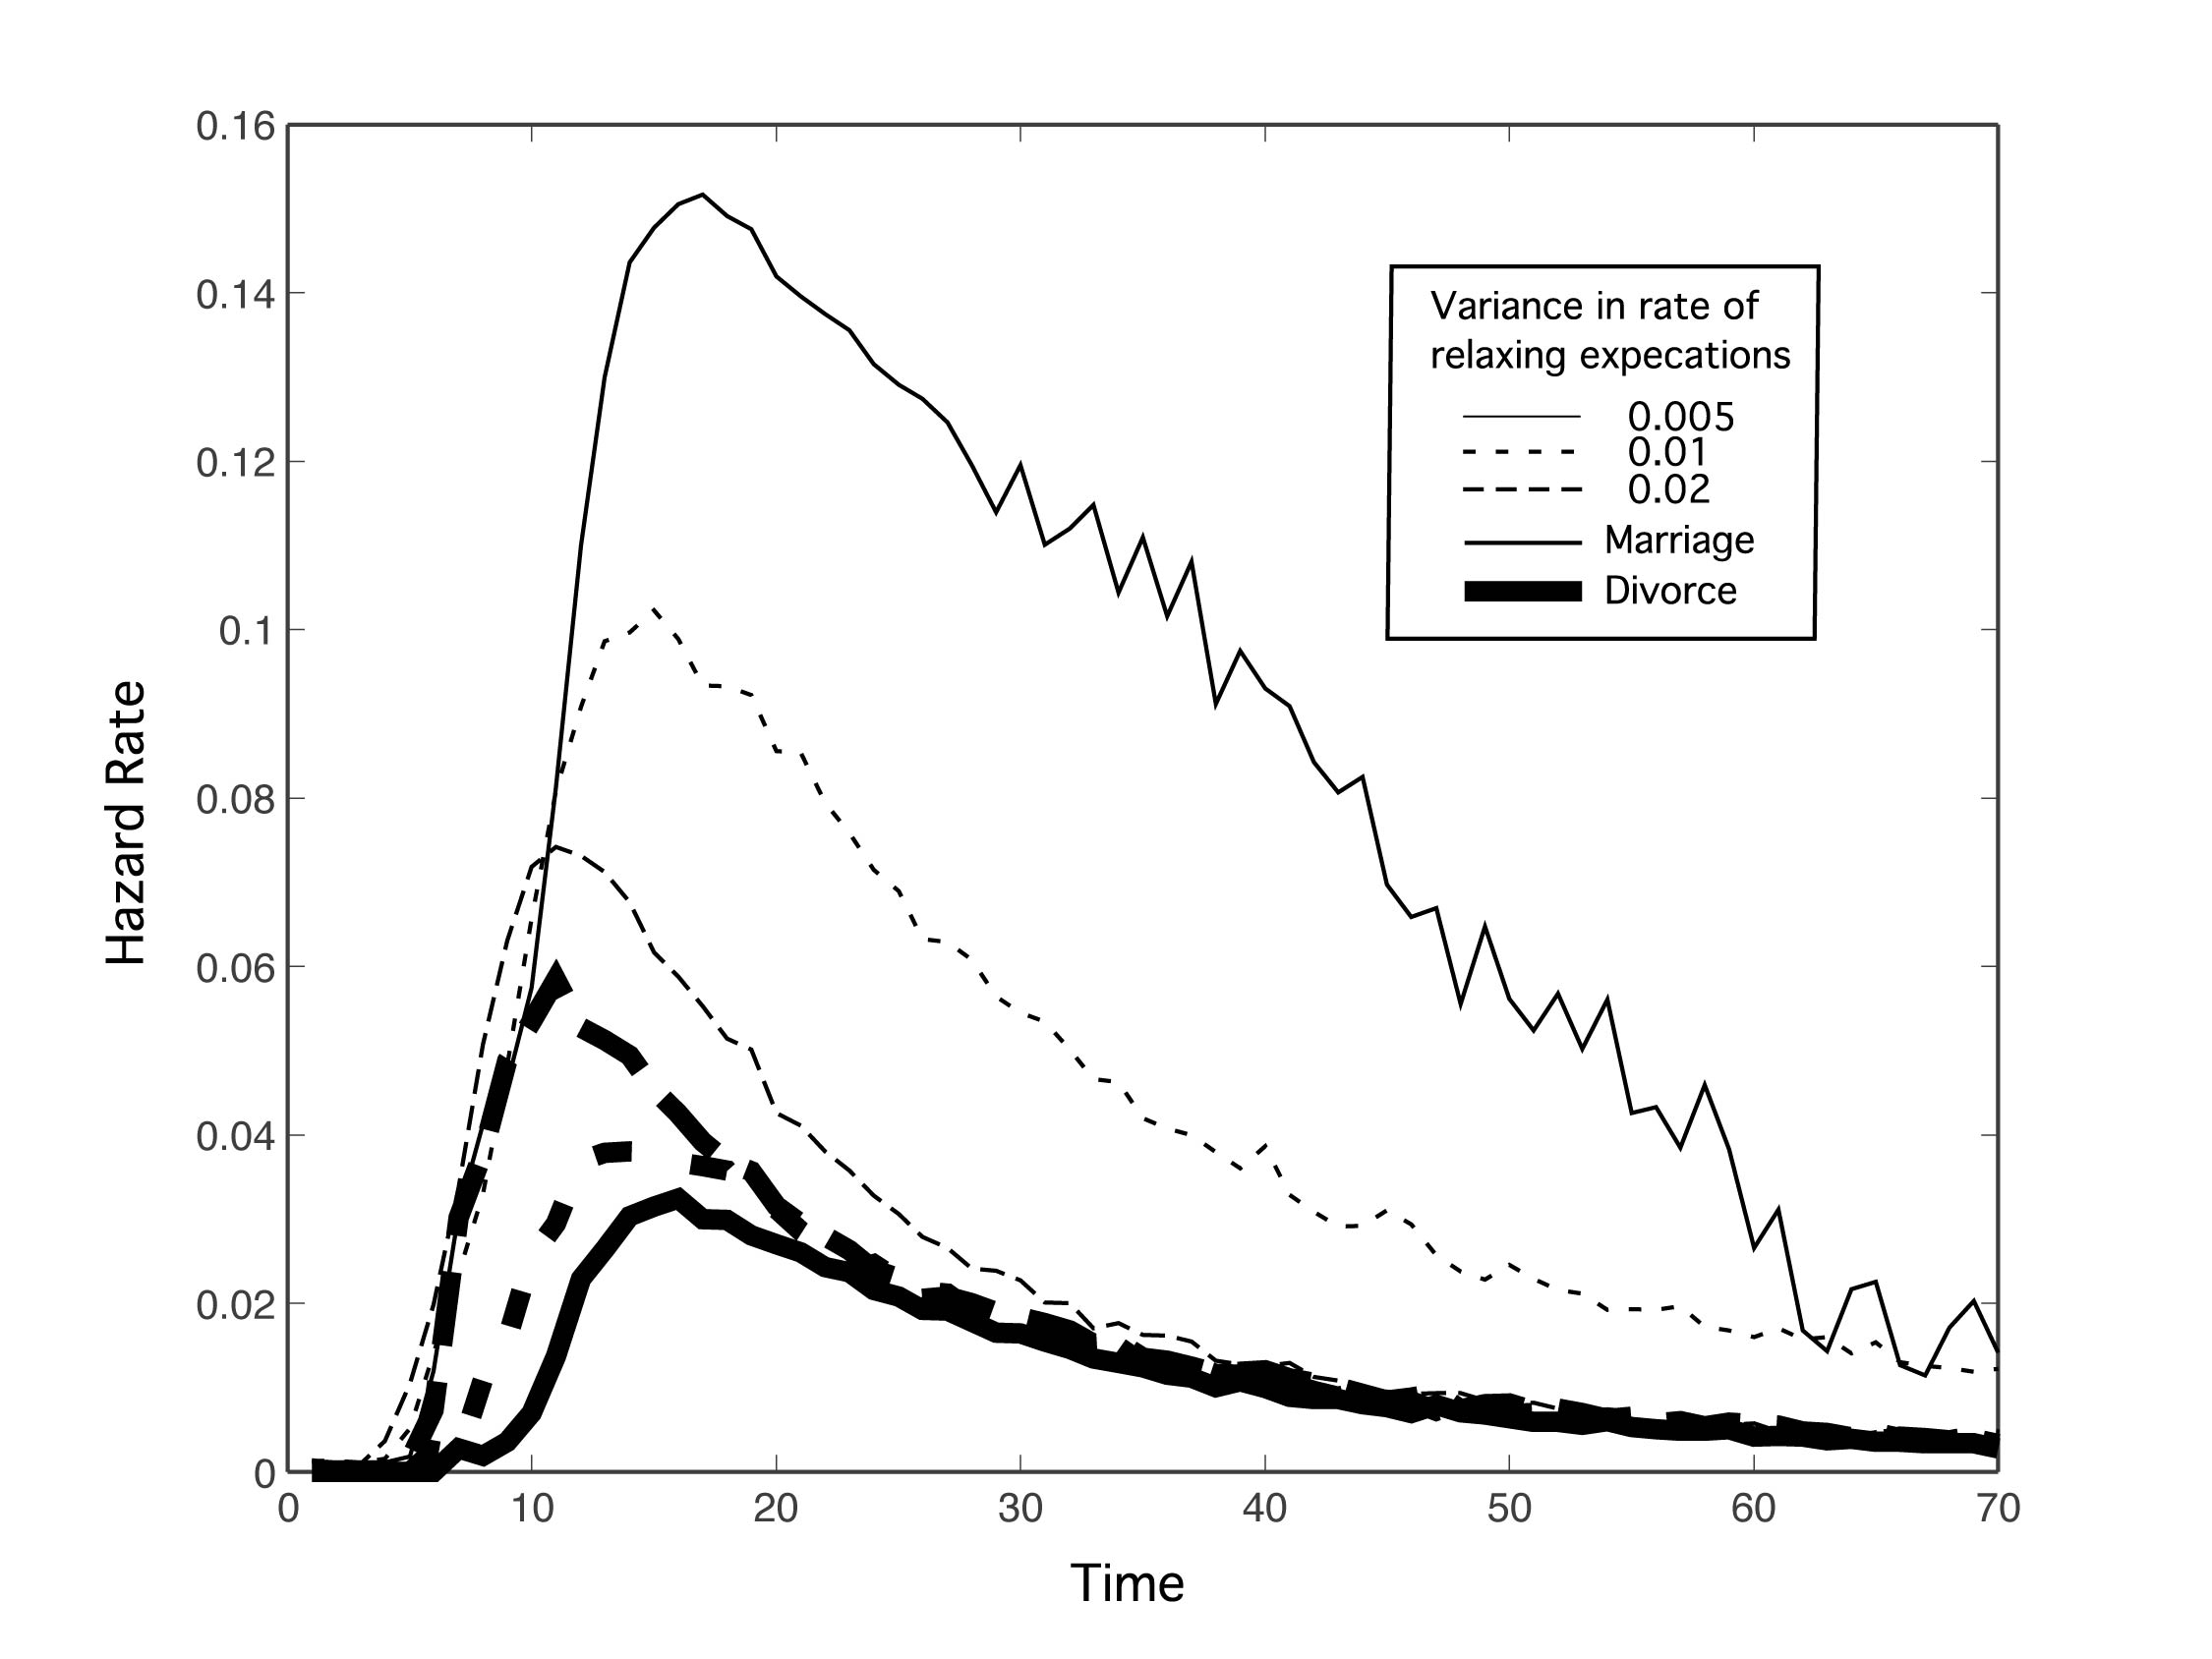
Figure 5. Marriage and divorce hazard rates for different amounts of variance (σ) in the population's rate of relaxing expectations. μ = 0.02, N = 15, and k = 10. Otherwise, parameters are as in Figure 2. As variance in the rate of relaxing expectations increases, marriage rates go down and divorce rates go up. Also notice that age at first marriage is reduced on average with increasing variance

3.9
The variance in the population's rate of relaxing expectations may be related to other forms of population heterogeneity. In particular, it is likely that when the population heterogeneity increases (as measured by N and k), so does the amount of variance in an individual's tendency to relax their expectations. Thus σ is likely to rise with population heterogeneity, but operate as an opposing force on timing and rates of divorce and age at first marriage.

A Case Study for Marriage and Divorce

3.10
To gain a sense for MADAM's ability to predict divorce statistics, we fit MADAM to marriage data and then tested its ability to generalize to the associated divorce statistics. We used marriage-by-age data collected in the U.S. in 1990 (Kreider 2002), and used MADAM to create a population of individuals whose peak marriage rates were roughly similar to the U.S. data by visual inspection. The age at first marriage distribution for 1990 peaks between 25 and 29 years of age with a hazard rate of 0.11. This data qualitatively matches that shown in Figure 2, with μ = 0.02 and σ = 0.01, 4 potential partners sampled per year, 15 population traits, 10 traits sampled per person, and letting the zero year for mate search start at age 13. We then used the matching 1000 population simulation to answer the following question: How well does the resulting divorce curve capture the general trends in divorce statistics for the U.S. approximately 5 years later?

3.11
Results from MADAM showed the probability that a first marriage ends in divorce is 0.47, the median length of a first marriage that ends in divorce is 6 years, and approximately 6% of the population in the model never marries. According to the U.S. Census Bureau data for 1996 (Kreider 2002), the probability of a first marriage ending in divorce was 0.50, the median length for a first marriage ending in divorce was 7 to 8 years (6.6 years at separation), and of individuals 50 years and over, less than 5% had never been married. This evidence suggests that the relationship between MADAM's marriage and divorce curves represents a reasonably accurate fit to the underlying divorce statistics. Though MADAM's flexibility could allow more complicated mechanisms for divorce to be modeled, the results suggest that in a society where marriages only ended when one partner remarried, the demographic patterns for divorce would be similar to those observed in Figure 1.

3.12
Using the 200,000 individuals in this simulation, we further asked how individual differences in λ influenced individual marriage and divorce statistics. For example, are individuals who rapidly reduce their expectations also more likely to divorce, and do they wind up in lower quality relationships in the long run? In answer to the first question, there is significant positive correlation between λ and the number of divorces a person has in their lifetime (p < 0.001; Pearson's correlation coefficient = 0.43). Individuals in the top quartile of λ may expect to have greater than 1.5 marriages more than individuals in the bottom quartile. High λ is also a significant predictor of early marriages (p < 0.001; Pearson's correlation coefficient = -0.58), with approximately 8 years difference between the top λ quartile and bottom quartile. These early marriages are of lower quality in terms of fewer matched traits, with approximately 0.13 fewer traits matched between top and bottom quartile. However, in the long run, while higher λ does predict a lower matching level of individuals in their final marriage, the correlation is marginal (p < 0.001; Pearson's correlation coefficient = -0.04). Though individuals who relax their expectations quickly marry sooner on average, they eventually find relationships nearly as compatible as other individuals who wait longer to marry.

* Discussion

4.1
Our results show that the Marriage and Divorce Annealing Model, MADAM, can qualitatively capture the observed demographic patterns for marriage and divorce, maintaining a relationship between marriage and divorce that is quantitatively realistic. MADAM also offers several specific hypotheses for the current international trends in marriage and divorce. One of the predictions of the model is that population centers with rising heterogeneity should see increasing age at first marriage. This increase in age at first marriage should also be observed when individuals relax expectations more slowly.

4.2
To the extent that rates of relaxing expectations are governed by psycho-cultural factors, slowly reducing expectations may be consistent with amplified narcissistic preferences at reproductive age (Foster et al. 2003) and increasing acceptance of cohabitation prior to marriage (Bumpass and Hsien-Hen 2000). The "me" generation may demand a higher quality partner, and cohabitation may satiate many of the psychological and biological needs that were previously satisfied by marriage. Moreover, women's greater economic autonomy provides them with more time to find an appropriate partner, allowing them to reduce their expectations more slowly.

4.3
Rising population heterogeneity may be a consequence of modern populations and cultures mixing at a rapid rate, both through international travel and via the internet and other long-distance communication networks. Though this may ultimately lead to a more homogeneous world population, initially it leads to local population heterogeneity. Individuals who encounter one another in day-to-day interactions are less likely to share common traits than they might have been fifty years ago.

4.4
MADAM makes a number of predictions that may be tested in real populations undergoing these types of transitions. For example, where two populations come together rapidly (without changing the romantic encounter rate) then the age at first marriage should increase as heterogeneity increases. If the two populations differ markedly in their rates of relaxing expectations, divorce should increase relative to marriage rates. On the other hand, if a population were to become more homogenous over time, for example due to changes in political policies that increase homogeneity in education and economic status, it should see earlier ages at first marriage.

4.5
Though the applications of MADAM that we have presented focus on similarity matching as an assortative mating process, the model is easily generalized to mating as a disassortative process—a process well supported in the biological literature (Ochoa and Jaffe 1999; Pusey and Wolf 1996; Tregenza and Wedell 2000). For example, the vertebrate major histocompatabilty complex (MHC) has been proposed as a mechanism for disassortative mating to prevent inbreeding: rats, mice, and humans prefer mates with dissimilar MHC (Penn and Potts 1999). Because of the highly polymorphic character of MHC it is not clear whether MHC plays a significant role in mate decisions beyond eliminating a small fraction of the population as incompatible, which is to say that most other individuals in a population may be "different enough" to make for successful pairings (D. Penn, pers. comm.). Nonetheless, we also simulated MADAM in the disassortative case by setting the target mate to be an individual with the fewest trait matches, starting the satisfice level at 0, and switching from a relaxation rate to an increment rate. Results of the disassortative variant of MADAM are not qualitatively different from those presented above (data not shown). In other words, the general properties of mate search with relaxing expectations, whether the search is for partners who share many traits (assortment) or for partners who share few traits (disassortment), are sufficient to generate marriage and divorce curves qualitatively similar to those observed in real populations.

4.6
Various extensions to the MADAM model should be explored in future work. For example, while MADAM's divorce rule is simple and captures marriage and divorce demography well in its current form, a variety of rules may better reflect human behavior, and different rules may work better in different cultures and individuals. Possible extensions include the addition of continuous trait parameters, using assortative and disassortative traits simultaneously, and exploring the role of variance in individual trait quantities. Again, a prerequisite to these extensions is finding supporting evidence for their necessity.

4.7
The MADAM model takes a unique approach to modeling marriage demography by being non-competitive and assortative and also by modeling the demographic data for divorce. We hope that MADAM will also provide a tractable framework for others to explore the relationship between individual and population level behaviors as they arise in relation to emergent population level search problems.

* Acknowledgements

This work was supported by the National Institute of Health, T32 Grant # HD 07475.

* References

ALVAREZ, L. & Jaffe, K. 2004 Narcissism guides mate selection: humans mate assortatively, as revealed by facial resemblance, following an algorithm of "self seeking like". Evolutionary Psychology 2, 177-194.

AMATO, P. R. 2000 The consequences of divorce for adults and children. Journal of Marriage and the Family 62, 1269-1287.

AMATO, P. R. & Previti, D. 2003 People's reasons for divorcing. Journal of Family Issues 24, 602-626.

BELL, W. J. 1991 Searching behavior: The behavioral ecology of finding resources. New York: Chapman & Hall.

BYRNE, D. 1997 An overview (and underview) of research and theory within the attraction paradigm. Journal of Social and Personal Relationships, 14, 417-31.

BUMPASS, L. & Hsien-Hen, L. 2000 Trends in cohabitation and implications for children's family contexts in the United States. Population Studies 54, 29-41.

BUSTON, P. M. & Emlen, S. T. 2003 Cognitive processes underlying human mate choice: The relationship between self-perception and mate preference in Western society. Proc Natl Acad Sci U S A 100, 8805-10.

CHERLIN, A. J. 1992 Marriage, Divorce, Remarriage. Cambridge, MA: Harvard University Press.

COHEN, J. 1977 Sources of peer group homogeneity. Sociology of Education 50, 227-41.

CUNNINGHAM, M. R., Roberts, A. R., Wu, C., Barbee, A. P. & Druen, P. B. 1995 Their ideas of beauty are, on the whole, the same as ours: consistency and variability in the cross-cultural perception of female physical attractiveness. Journal of Personality and Social Psychology 68, 261-279.

FISCHER, C. S. 1977 Networks and Places: Social Relations in the Urban Setting. Chicago: University of Chicago Press.

FOSTER, J. D., Campbell, W. K. & Twenge, J. M. 2003 Individual differences in narcissism: inflated self-views across the lifespan and around the world. Journal of Research in Personality 37, 469-468.

GARDNER, J. & Oswald, A. 2004 How is mortality affected by money, marriage, and stress? Journal of Health Economics 23, 1181-1207.

GOODE, W. 1993 World Changes in Divorce Patterns. New Haven: Yale University Press.

HEATON, T. B., Cammack, M. & Young, L. 2001 Why is the divorce rate declining in Indonesia? Journal of Marriage and the Family 63, 480-490.

HILLS, T. 2006 Animal foraging and the evolution of goal-directed cognition. Cognitive Science 30, 3-41.

HILLS, T., Brockie, P. J. & Maricq, A. V. 2004 Dopamine and glutamate control area-restricted search behavior in Caenorhabditis elegans. Journal of Neuroscience 24, 1217-1225.

HIRSCHMAN, C. & Teerawichitchainan, B. 2003 Cultural and socioeconomic influences on divorce during modernization: Southeast Asia, 1940s to 1960s. Population and Development Review 29, 215-253.

IBARRA, H. 1995 Race, opportunity and diversity of social circles in managerial networks. . The Academy of Management Journal 38, 673-703.

JAFFE, K. 1999 On the adaptive value of some mate selection strategies. Acta Biotheoretica 47, 29-40.

KALICK, S. M. & Hamilton, T. E. 1986 The matching hypothesis reexamined. Journal of Personality and Social Psychology 51, 673-682.

KALMIJN, M. 1998 Intermarriage and homogamy: causes, patterns, trends. Annu Rev Sociol, 395-421.

KANDEL, D. B. 1978 Homophily, selection and socializationin adolescent friendships. The American Journal of Sociology 84, 427-36.

KAREIVA, P. & Odell, G. 1987 Swarms of predators exhibit "preytaxis" if individual predators use area-restricted search. American Naturalist 130, 233-270.

KITSON, G. C., Babri, K. B. & Roach, M. J. 1985 Who divorces and why: A review. Journal of Family Issues 6, 255-293.

KREIDER, R. M. 2002 Number, timing, and duration of marriages and divorces: 1996 Current Population Reports P70-97

LINCOLN, J. R. & Miller, J. 1979 Work and friendship ties in organizations: a comparative analysis of relational networks. Administrative Science Quarterly 24, 181-199.

MARSDEN, P. V. 1988 Homogeneity in confiding relations. Social Networks 10, 57-76.

MATHEWS, T. J. & Hamilton, B. E. 2002 Mean age of mother, 1970-2002, National Vital Statistics Reports 51.

MCPHERSON, M., Smith-Lovin, L. & Cook, J. M. 2001 Birds of a feather: homophily in social networks. Annual Review of Sociology 27.

MILLER, G. F. & Todd, P. M. 1998 Mate choice turns cognitive. Trends in Cognitive Sciences 2, 1990-1998.

MORELAND, R.L. and Zajonc, R.B. 1982 Exposure effects in person perception: familiarity, similarity, and attraction. Journal of Experimental Social Psychology 18, 395-415.

NATIONAL STATISTICS 2006 http://www.statistics.gov.uk. Crown copyright material is reproduced with the permission of the Controller of HMSO.

OCHOA, G. and Jaffe, K. 1999 On sex, mate selection and the red queen. Journal of Theoretical Biology, 199, 1-9.

PENN, D. J. & Potts, W. K. 1999 The evolution of mating preferences and major histocompatability complex genes. American Naturalist 153, 145-164.

PESKIN, M. & Newell, F. N. 2004 Familiarity breeds attraction: effects of exposure on the attractiveness of typical and distinctive faces. Perception 33, 147-157.

PUSEY, A. & Wolf, M. 1996 Inbreeding avoidance in animals. Trends in Ecology and Evolution 11, 201-206.

SHRUM, W., Cheek, N. H. J. & Hunter, S. M. 1988 Friendship in school: gender and racial homophily. Sociology of Education 61, 227-239.

SRIVASTAVA, S., John, O. P., Gosling, S. D. & Potter, J. 2003 Development of personality in early and middle adulthood: set like plaster or persistent change? Journal of Personality and Social Psychology 84, 1041-1053.

STATISTICS CANADA 1996 Vital statistics compendium. Catalogue no. 84-214-XIE.

STATISTICS ICELAND 2004 Population. Statistical Series 89 (31).

STATISTICS NEW ZEALAND 2004 Demographic Trends 2003, Catalogue no. 30.001.

THORNHILL, R. & Gangestad, S. W. 1999 Facial Attractiveness. Trends in Cognitive Sciences 3, 452-460.

TODD, P. M. 1997 Searching for the next best mate. In Simulating Social Phenomena (ed. R. Conte, R. Hegselmann & P. Terna), pp. 419-436. Berlin: Springer-Verlag.

TODD, P. M., Billari, F. C. & Simão, J. 2005 Modeling the emergence of social marriage patterns produced by individual mate-search heuristics. Demography 42, 559-574.

TODD, P. M. & Miller, G. F. 1999 From pride and prejudice to persuasion: satisficing in mate search. In Simple Heuristics That Make Us Smart (ed. G. Gigerenzer & P. M. Todd), pp. 287-308. Oxford: Oxford University Press.

TREGENZA, T. & Wedell, N. 2000 Genetic compatibility, mate choice and patterns of parentage: invited review. Molecular Ecology 9, 1013-27.

U.S. CENSUS BUREAU 2003 Annual Social and Economic Supplement: 2003 Current Population Survey, Series P20-553.

WRIGHT, E. O. 1997 Class counts: Comparative studies in class analysis. New York: Cambridge University Press.

----

ButtonReturn to Contents of this issue

© Copyright Journal of Artificial Societies and Social Simulation, [2008]