©Copyright JASSS

JASSS logo ----

Annie Abello, Sharyn Lymer, Laurie Brown, Ann Harding and Ben Phillips (2008)

Enhancing the Australian National Health Survey Data for Use in a Microsimulation Model of Pharmaceutical Drug Usage and Cost

Journal of Artificial Societies and Social Simulation vol. 11, no. 3 2
<https://www.jasss.org/11/3/2.html>

For information about citing this article, click here

Received: 06-Aug-2007    Accepted: 16-May-2008    Published: 30-Jun-2008

PDF version


* Abstract

While static microsimulation models of the tax-transfer system are now available throughout the developed world, health microsimulation models are much rarer. This is, at least in part, due to the difficulties in creating adequate base micro-datasets upon which the microsimulation models can be constructed. In sharp contrast to tax-transfer modelling, no readily available microdata set typically contains all the health status, health service usage and socio-demographic information required for a sophisticated health microsimulation model. This paper describes three new techniques developed to overcome survey data limitations when constructing 'MediSim', a microsimulation model of the Australian Pharmaceutical Benefits Scheme. Comparable statistical matching and data imputation techniques may be of relevance to other modellers, as they attempt to overcome similar data deficiencies. The 2001 national health survey (NHS) was the main data source for MediSim. However, the NHS has a number of limitations for use in a microsimulation model. To compensate for this, we statistically matched the NHS with another national survey to create synthetic families and get a complete record for every individual within each family. Further, we used complementary datasets to impute short term health conditions and prescribed drug usage for both short- and long-term health conditions. The application of statistical matching methods and use of complementary data sets significantly improved the usefulness of the NHS as a base dataset for MediSim.

Keywords:
Base Data, Drug Usage, Microsimulation, Pharmaceutical Benefits, Scripts, Statistical Matching

* Introduction

1.1
During the past decade static microsimulation models of the income tax and cash transfer systems of developed countries have become very widespread (Harding and Gupta 2007, p. 8). For example, within Europe, EUROMOD has allowed the 15 original member countries of the European Commission to easily examine changes in tax-transfer systems in a comparable way and is now being extended to embrace the 10 new EC countries as well as indirect taxes and non-cash benefits (Sutherland 2007). Within Australia, the publicly available STINMOD model has been available for the past decade (Percival et al 2007) and Canada, the US, Norway and Spain also have such static microsimulation models (for overviews see Gupta and Harding 2007, pp.29-32). These models have meant that policy makers within the tax-transfer field within these countries have been able to readily estimate the detailed distributional and revenue consequences of a vast range of possible policy changes.

1.2
This stands in stark contrast to the paucity of distributional information available to health policy makers in most countries. While in many countries outlays on government provided or subsidized health services and products can approach or exceed outlays on cash transfers — and despite on-going concerns about possible social gradients in health and in health service usage (Walker et al 2006, AIHW 2006, Thurecht et al 2005, Turell and Mathers 2000, Walker and Abello 2000) — health policy makers are generally not able to draw upon sophisticated microsimulation models to help them assess the distributional consequences of policy changes that they are contemplating.

1.3
For example, across much of the industrialized world, the proportion of total government health outlays devoted to pharmaceutical drugs has been rising more rapidly than other components of health outlays (OECD Health Data 2005 and 2007, Medical News Today 2006). In Australia, for example, outlays on subsidized pharmaceuticals peaked at 14 per cent of total health outlays in 2002, up from only 8 percent fifteen years ago (OECD Health Data 2007). In several countries, including Canada and Australia, such rapid growth has prompted concern about the sustainability of the programs (Paris and Docteur 2006, Moise and Docteur 2007, Maynard and Bloor 2003, OECD Observer 2004).

1.4
Access to appropriately subsidized medicines is clearly a vital contributor to the well-being of families and individuals, particularly low income families. Yet only Canada and Australia appear to have developed the requisite microsimulation modelling infrastructure for assessing the current and future impact of possible policy reforms in this area (Gupta, 2007, Nguyen and Gupta 2007, Abello and Brown 2007).

1.5
Arguably, part of the reason why microsimulation models of the health sector have been slower to develop is the greater difficulties encountered when attempting to simulate health status and health service usage, relative to simulating cash transfer receipt or the payment of income taxes. While most countries now possess the detailed and publicly available microdata about household incomes and demographic characteristics that will permit ready replication of the rules of the tax-transfer system, household microdata about health status, health service usage and socio-demographic characteristics are often not as freely available and/or less comprehensive than required.

1.6
This article provides an insight into some of the major challenges that faced us as we attempted to construct a microsimulation model of pharmaceutical drug usage and cost for Australians. The construction of an adequate base microdata set, with the requisite information to allow simulation of drug usage and the family-based 'safety net' (designed to protect families with unusually high drug expenditures), necessitated unusually complex microsimulation techniques. As Nguyen and Gupta note about their broadly comparable Pharmasim microsimulation model for Canada, the creation of such a broad data set 'is one of the biggest challenges in the process due to non-availability of existing data sources that simultaneously contain all of the required information' (2007). This article is thus designed to provide insight to other modellers about possible methods for augmenting microdata sets that do not contain all the variables required for microsimulation of a particular aspect of social or tax policy.

1.7
Three particular methodological challenges are canvassed in this article. The first was how to match the individuals recorded into the Australian National Health Survey microdata into synthetic families (required for modelling the family 'safety net'). The second was how to add short-term health conditions onto the National Health Survey, which only contained information about long-term health conditions. The third was how to impute detailed drug usage patterns for the individuals captured in the National Health Survey, as it only covered prescribed medicines for national health priority areas that were specified as long-term by the respondent — a subset of total pharmaceutical drug usage.

Overview of the Australian PBS

1.8
The Australian Commonwealth Government's Pharmaceutical Benefits Scheme (PBS) aims to provide Australians with timely, reliable and affordable access to necessary and cost-effective prescription medicines.

1.9
Patients are required to make a contribution to the cost of prescribed medicines listed on the PBS. Individuals and families eligible for certain federal government pensions and allowances (e.g. age pension, unemployment benefit, disability pension) are able to access PBS medicines at concessional rates. These persons are known as concession cardholders. The PBS also has 'safety net' arrangements to protect individuals and families from large overall expenses for PBS-listed medicines. The levels of patient copayments and the PBS safety net arrangements are referred to as the PBS policy settings. Patient copayments and safety net thresholds (SNTs) are revised annually in line with movements in the consumer price index (CPI) from 1 January each year.

1.10
The majority of prescribed drug sales in Australia are covered by the scheme and, on average, the government subsidises patients to the extent of 84 percent of PBS drug costs. Currently nearly 80 percent of total government subsidies through the PBS accrue to concessional patients (those with the Pensioner Concession Card, the Commonwealth Seniors Health Card and the Health Care Card) and 20 percent to general patients.

1.11
Finding ways of curbing government expenditure on the PBS, while maintaining social equity and access to 'essential' medicines, is a continuing concern within federal health and financial public policy circles. Since the early 1990s government expenditure on the PBS has grown at more than 10 percent a year — well above the growth in the health budget (6 percent) or the economy (4 percent in terms of gross domestic product). However, over the next couple of years, rates of growth in PBS expenditure are likely to be below the long run average growth of the PBS. The Australian Commonwealth Treasury is forecasting PBS expenditure to grow over the coming three years at an average of 5.4 percent per annum in real terms, compared to 3.3 percent for the total health budget (Commonwealth Treasury 2005). Government's share of the costs of the PBS has steadily increased over time as PBS settings — patient copayments and safety net thresholds — which largely determine patient contributions, have increased in general only in line with inflation. In 2004-05, total PBS scripts reached 169 million and cost the government $5.4 billion. PBS-listed scripts priced below copayment reached 30 million (figure 1).

Figure
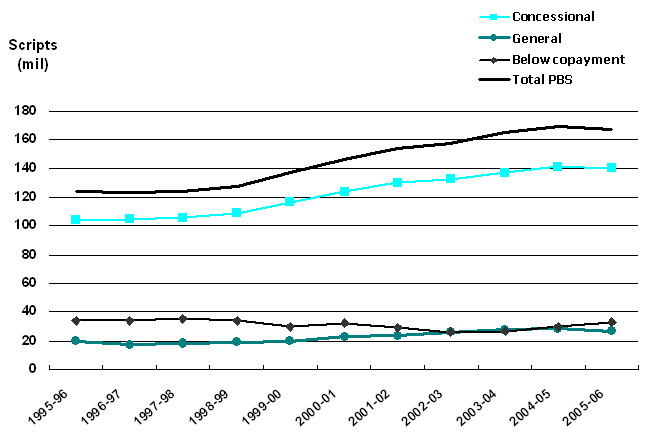
Figure 1. Volume of PBS-listed scripts, 1995-96 to 2005-06.
Data sources: Medicare Australia website; Drug Utilisation Sub-Committee (DUSC) Drug Utilisation Database, Pharmaceutical Benefits Branch, Commonwealth Department of Health and Ageing.
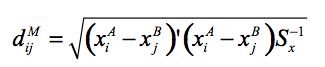
Microsimulation Modelling Using MediSim

1.12
Microsimulation is a means of modelling real life events by simulating the actions of the individual units that make up the system where the events occur (Brown and Harding 2005). Microsimulation models are based on microdata i.e. "low-level" population data — typically the records of individuals from either a national sample survey conducted by a national Bureau of Statistics or large administrative databases. In other words, microsimulation models begin with a dataset that contains detailed information about the characteristics of each person and family (income unit) or household within a sample survey or an administrative database (Brown and Harding 2002).

1.13
Microsimulation techniques bring a range of benefits to this type of modelling exercise: the models' databases can mirror the heterogeneity in the population as revealed in the large household surveys; they can replicate the complexity of the policy structures, transfers, and settings under investigation; and they can be used to forecast the outcomes of policy changes and 'what if' scenarios (i.e. the counterfactual where the results describe what, under specified conditions, may happen to particular individuals and groups). With the model being based on unit records, it is possible to examine the effects of policy changes for narrowly defined groups of individuals or demographic groups — and the models provide the ability to change a greater variety of parameters independently and therefore have the capacity to provide considerably more accurate estimates and detailed projections of the distributional effects of changes (Creedy 2001; Brown and Harding 2002; Brown and Harding 2005).

1.14
NATSEM models the Australian PBS using the microsimulation model MediSim. MediSim simulates the current and future use and costs of PBS medicines under existing and different policy settings (see, for example, Walker 2000, Walker et al 2000, Harding et al 2004, Brown et al 2005a and Brown et al 2005b). It also estimates the distributional effects of policy changes on Australian families. By altering the medicines included in the model, their assigned prices and script volumes, MediSim is capable of simulating the impact of: inclusion of new drugs on to the PBS list; restriction on the drugs listed on the scheme or on the pricing of drugs; increased restrictions on drugs by indication; increased use of generics at more competitive prices; or an increased emphasis on the quality use of medicines as reflected in changes in doctor prescribing behaviour; as well as changes to copayment and safety net arrangements.

1.15
The model could be used to provide answers to relatively simple issues such as the impact of expected changes in PBS subsidised drug prices and scripts over the next 5 to 10 years on government PBS outlays, or patient out-of-pocket expenditures and related revenues to industry. It can also be used to assess more complex matters such as the likely impact of, for example, the introduction of new PBS listed drugs, the effects of demographic and socio-economic changes upon outlays, or the distributional and revenue impacts of changing the rules of the PBS (such as the introduction of differential copayment levels as operate in many European countries).

Choice of Base Data

1.16
In 2003, NATSEM obtained joint industry and national competitive research funding to extend the capability of the model to include health outcomes and the evaluation not only of the costs but also the benefits arising from the use of medicines. A necessary step to modelling both the costs and benefits of these medicines is the inclusion of diseases and health conditions in the model's base file.

1.17
The model's original base, STINMOD/01a[1], was created from the Household Expenditure Survey (HES). It was thought initially that the best way to add diseases into the model's dataset was to replace the model's original base file (which in this paper we interchangeably refer to as "HES"), with either the 2001 or 1995 National Health Survey (NHS). The 1995 NHS is the best source of complete (although not up-to-date) information on illnesses and medicine usage. The 2001 NHS, on the other hand, contains the latest person-level information in Australia on long-term health conditions, drug usage for national health priority conditions[2], and health risk factors. However, the latter has a number of limitations as the base data for a microsimulation model following changes in survey design relative to previous surveys.

1.18
The 2001 NHS contains only limited information on prescribed medicine use (e.g. only usage related to priority diseases has been collected), and short-term health conditions (apart from the priority areas, the survey collected specific information on the health condition only of persons with long term conditions). Data on drug usage and the health condition/s for which the medicines are being taken, are essential in a model concerning usage of prescribed medicines. While the national priority areas, that are included in the survey, constitute a large share of the PBS (55% of scripts and 64% of costs), the residual that constitutes non-priority areas is still large and should be included in the model. Another major shortcoming of the 2001 NHS in regard to the PBS concerns the coverage of the survey. Unlike previous national health surveys, the 2001 survey did not obtain information on all persons in the household, so the Australian Bureau of Statistics (ABS) recommends that analysis of the 2001 file be done at the person level only (ABS 2003a). As the PBS annual safety net operates at the income unit[3] level, complete information on all family or income unit members (particularly on drug usage) is needed to adequately model this critical component of the PBS system.

1.19
Given the lack of currency of the 1995 health survey, the best option was to build the new model upon a dataset based on the 2001 NHS but modified such that there was complete information on each member of a family, and with additional information on short-term health conditions and drug usage. This was achieved by statistically matching the 2001 NHS to a person-level dataset derived from NATSEM's STINMOD/01a[4], and augmenting the resulting base file with information from the 1995 NHS on short-term health conditions and drug usage.

1.20
The next sections describe the methodology used for statistical matching (Section 2), imputation of short-term conditions (Section 3) and imputation of prescribed drug usage (Section 4). The paper concludes with a discussion of the outcomes of the imputations, and suggests possible future improvements and extensions of the model.

* Statistical Matching

2.1
Statistical matching is a procedure used to link two files or datasets where each record from one of the files is matched with a record from the second file that generally does not represent the same unit, but does represent a similar unit. It is a method to bring together microdata that are not available from a single data source[5]. Since the records to be matched in this exercise involve sample surveys (rather than administrative data or a census), and considering the incomplete coverage of families in the 2001 NHS, the matching of records involves finding the closest statistical match rather than actual matching of data records of the same persons.

The Data to be Matched

2.2
The HES contains around 18,000 person records and contains detailed income and expenditure information. Each record has a unique identifier at the household, family, income unit and person level. This hierarchy allows identification of persons to their correct income unit, family or household. Having this detail allows the proper modelling of the PBS safety net as expenditures on PBS drugs can be summed for each income unit.

2.3
The NHS contains around 27,000 person records. The NHS records have detailed information relating to the health of each person. To link records in both data sets, we need variables that are common to both data sets and strongly relate to the modelling area, in this case health. The variables that are common to the two sets of microdata to be matched are called the "matching" variables.

Issues

2.4
Differences in sample size among the different surveys should not be an issue as weighted duplications of records may be created so that the sample sizes in both datasets are equal (Taylor, Gomulka and Sutherland 2000). The main difficulty likely to be encountered is the choice of weights in the merged file. The weights in either the NHS or HES could be selected — but the risk is that the statistical distribution and parameters of the variables merged from the other survey will not be maintained. If constrained statistical matching is used, then the goal is to try to maintain the marginal distributions of the non-matched variables by minimising the difference in the weights of the records in the merged file to those of the two original surveys (Cohen 1991).

2.5
Prior to the actual matching, modifications to each dataset were made to make the matching variables from each dataset consistent. In the HES, we created separate data records for children, imputed concession card status (used to identify individuals and families who are eligible to access medicines at concessional rates) and estimated equivalent income deciles consistent with the 2001 NHS definition. In the NHS, we imputed a value for equivalent income decile when the response was 'not stated', and used self-assessed health status as a proxy indicator for income unit expenditure on prescriptions.

2.6
The details regarding modifications made to the data, details of the statistical matching procedure, the conditional independence assumption, definitions and differences between constrained and unconstrained matching, among other issues, are described in Technical Working Group ABS-NATSEM Collaboration on Statistical Matching (2004).

Statistical Matching Methodology

2.7
A two-step approach is used to statistically match the NHS and HES. First, person records are grouped, mainly by their income unit characteristics, into homogeneous cells to determine the most similar records. Next, persons belonging to the same group are matched together using a distance function. The cell groups are formed to ensure a certain standard is always maintained for the statistical match. When using a small number of cell groups, the accuracy of matches can be improved by a properly formulated distance function. A similar approach of first dividing the datasets into groups of similar households, before doing any actual matching, is discussed in Sutherland et al (2002).

2.8
Homogeneous groups The variables used to divide person records into homogeneous groups include age (6 groups), gender (2 groups), income unit expenditure on prescriptions (4 groups initially, then collapsed to 2 groups), income unit type (4 groups initially, then collapsed to 2 groups), and concession card status (2 groups). Using these five variables resulted in 384 cell groups. It was not until income unit type and expenditure on prescriptions had each been collapsed into two groups, that it was possible to obtain populated cell groups for all combinations (96 cell groups). While there were other common variables available (labour force status, number of usual residents in the household and equivalent income unit decile), these were not used as the more variables used, the less likely that cells will be populated (i.e not empty).

2.9
Distance function The distance function is a mathematical equation that attempts to more closely match individuals from the two surveys who fall within the same cell group. It is of the Mahalanobis form, defined as

Equation (1)

where Sx is the estimated covariance matrix for the X variables. This was calculated using user-defined weights corresponding to the relative importance given to each matching variable. The X variables include age, number of usual residents in the household and equivalent income unit decile. The age variable in the distance function has 16 possible categories, somewhat more than the 6 categories employed in the cell groups. Two approaches were considered in implementing this stage of the matching procedure: unconstrained and constrained matching.

2.10
Unconstrained matching Unconstrained matching is relatively simple and computationally easy. The approach is to match each HES record to the closest matching NHS record with replacement. Under this approach it is possible for the same NHS record to be matched with multiple HES records. Selecting NHS records for matching in this manner ensures that the "match quality" is high. Table 1 shows the accuracy of the match with respect to the variable age. Age was a cell group variable and this ensured a certain level of accuracy[6]. The distance function tightens the match very successfully for the unconstrained method. Consider the age group 40 to 44 in the matched dataset. 83 percent of the records have been matched to NHS records with the correct age group.

2.11
The downside is that it can be difficult to match many of the records so, ultimately, the distribution of the non-matching variables in the matched file can be very different from their distribution in the original dataset; this "can have a deleterious effect on the validity of the results of analyzing the matched file" (Cohen 1991 p. 65). The problems with unconstrained matching become more apparent when working with data at a finer level of disaggregation.

Table 1: Unconstrained matching age allocation

MatchedNHS age group
dataset0-45-910-1415-1920-2425-2930-3435-3940-4445-4950-5455-5960-6465-6970-7475+
0-4100...............
5-9.9010.............
10-14.1684.............
15-19...8812...........
20-24...3862...........
25-29.....79184........
30-34.....127514........
35-39.....31285........
40-44........831340....
45-49........15721110...
50-54........3127591...
55-59........13137211...
60-64........0131284...
65-69.............8992
70-74.............7867
75+.............5689

2.12
As MediSim is expected to utilize data on long-term health conditions in the NHS, we investigated the distribution of this variable. The NHS shows whether or not individuals have any of 94 possible long-term conditions. Analysis was done on each of these conditions and a comparison was made between the total number of cases for the unconstrained matching-based file and the original NHS data. For each long-term condition, the ratio of the number of conditions in the matched dataset, relative to the original dataset, was computed with a value of 1 implying that the unconstrained matched file provided a perfect representation for a given condition. For all 94 conditions, the ratio using the unconstrained matched file averaged 0.96, but ranged from 0.24 to 1.32. Such a result was not considered adequate and alternative methods needed to be developed.

2.13
Constrained matching An alternative to unconstrained matching is constrained matching, also known as the linear programming method following the work of Barr and Turner (1978) and subsequently applied by other authors such as Barr, Stewart and Turner 1982, Rodgers 1984 and Cohen 1991. Constrained matching requires the use of all records in the two sets of microdata to be matched, and thus, it is able to preserve the marginal distributions of the non-matching variables in each of the two microdata sets. This procedure is adopted to match each HES record to the closest matching NHS record without replacement. As the linear programming (LP) method selects records from the NHS without replacement[7], this is expected to reduce the quality of matches compared to the unconstrained matching. A clear advantage with this methodology is that it can guarantee that marginal distributions will remain unchanged.

2.14
The linear programming approach requires the sum of HES and NHS weights to be equal. This ensures a "balanced" problem. If a weight is interpreted as the number of people a record represents then an unbalanced problem leads to either people in the HES or the NHS not being matched. As this method is applied to each of the homogeneous cells, adjusting the weights of either the HES or the NHS to ensure a balanced solution will change the relative importance of each cell. The weights in this particular application were always re-aligned to the NHS population. This means that while marginal distributions will change for the HES variables, these will remain unchanged for the NHS variables.

2.15
Table 2 provides a measure of the "closeness" of the match, again with respect to the age variable. The weights that have been attached to the distance function are unchanged from those used to produce the results in Table 1. Table 2 shows that the closeness of the age match is not as robust as that of the unconstrained matching. The results are still promising, with very few records in the HES being matched to NHS records where the age categories are more than 1 group apart. A similar comparison was made, looking at the closeness of the matches for income deciles and the number of usual residents in the household (Appendix A). The income results are quite poor with many HES records being matched with NHS records more than 2 categories apart, while the number of usual residents in the household shows a relatively close match.

2.16
In the unconstrained matching section the marginal distributions for the 94 long-term conditions in the NHS were discussed. The statistically matched file often over or under-reported the incidence of these conditions. The constrained matching method ensures that the incidence in the matched file is identical to that of the original NHS file.

Table 2: Constrained matching age allocation

Matched NHS age group
dataset 0-45-910-1415-1920-2425-2930-3435-3940-4445-4950-5455-5960-6465-6970-7475+
0-4100...............
5-9.8713.............
10-14.1189.............
15-19...8812...........
20-24...2575...........
25-29.....77203........
30-34.....147314........
35-39.....11881........
40-44........701983....
45-49........12582271...
50-54........41257226...
55-59........13105927...
60-64........0121582...
65-69.............69238
70-74.............96229
75+.............3889

Conclusion Regarding the Statistical Matching

2.17
The purpose of the matching was to create a file structure amenable to family PBS expenditure. Family PBS expenditure depends on the age, health and card status of individuals within a family. The variables that have been used in the cell groups and the distance function attempt to account for these factors.

2.18
Two possible matching procedures have been compared: unconstrained matching, where NHS records can be matched to HES records with replacement; and constrained matching where linear programming was used to ensure that marginal distributions of at least the NHS variables remained constant. Both procedures have the ability to match relatively closely on the variables common to the two source microdata. Only the constrained matching can guarantee that marginal distributions will remain unchanged.

2.19
The work undertaken by NATSEM in collaboration with the ABS on statistical matching gave us a better understanding of the theoretical and practical issues in statistical matching, and how to evaluate the accuracy of the matched dataset. On this basis, the matched file that was estimated using constrained matching was selected as the preferred base file for MediSim. Essentially, the person records in the original NHS were reshuffled into different families based on the HES family structure, such that information on every family member (which is essential to modelling the safety net) was available. Given that the original NHS person records have now been reconstructed into complete families, NATSEM's intention is to use only the variables from the NHS. With the exception of family structure, individual values in the NHS are preserved in the statistically matched file[8].

* Imputing short term health conditions

3.1
The inclusion of variables on health conditions in the model's dataset is the necessary first step to developing a facility in the model to measure health outcomes and to simulate policy changes with respect to people's health status and need for medicines. It is also essential for a microsimulation model that seeks to derive estimates of PBS drug usage for those with particular short term conditions under changing PBS rules. The 2001 NHS does not provide information on people's short-term (ST) health conditions. The 1995 NHS provides the most comprehensive data about short-term conditions, and was used to impute such conditions onto the model population.

3.2
To impute ST conditions, the following tasks had to be undertaken: identify what short-term conditions need to be imputed; up-rate prevalence rates from 1995 to 2001; develop SAS code to impute the selected short-term health conditions onto the statistically matched dataset taking into account a range of explanatory variables; and move from a 2-weekly to an annual picture of short-term conditions.

Definitions

3.3
Short-term conditions are defined as conditions that are experienced for less than 6 months or are expected to last for 6 months or less (ABS 1996). Prevalence rate is the number of current cases or persons having the disease divided by the population at risk (Woodward 2005, pp.12-13).

What Conditions Count As Short-term And Need To Be Imputed

3.4
What specific health conditions are counted as short-term? Asthma, diabetes, arthritis and epilepsy are typically experienced as long-term conditions while dental problems, injuries, headaches, cough, colds, sore throat and influenza, and ear pain are typically short term in nature. In between is a wide spectrum of conditions that are characterised by some respondents as only short-term, only long-term, or both short and long-term.

3.5
The 1995 NHS has information on the number of persons reporting specific health conditions and the proportion indicating that the condition is short-term only. We designate as short-term those conditions where the proportion of 'only short term' as opposed to 'only long-term' or 'both short and long-term' to the total number of persons is more than 5%.

3.6
Next, we eliminated those short term health conditions for which information is available on the 2001 NHS, as information was collected on the seven national health priority areas. We used the ICD9 classification of health conditions, as this classification is common to both the 1995 and 2001 health surveys. However, we aggregated some specific conditions. For example, we combined sciatica, curvature of spine, diseases of the intervertebral disc, and unspecified back problems into one category — back problems. The main purpose was to increase the probabilities as when these are too low (and considering the indivisibility of record weights), it is difficult to accurately impute such probabilities. In summary, the number of specific conditions to be imputed was narrowed down to some 50 conditions, listed in Appendix Table B3.

Uprating Short-term Conditions To 2001 Levels

3.7
How did we uprate the prevalence of short term health conditions to 2001 levels, given that the latest comprehensive information we have is from the 1995 NHS? The most straightforward way was to assume that the change in the prevalence rate for short-term conditions was the same as change in the rate of prevalence for comparable long-term conditions (noting that for most conditions, there is a great deal of overlap between long-term and short-term conditions). For each short-term condition, we applied the change in the long-term prevalence rate over the period 1995-2001, to bring up the 1995 short-term prevalence rate to 2001 levels.

3.8
The underlying assumption is that most conditions have both a short-term and long-term element, and we expect the rate of change in the long-term element to be in the same range as the rate of change in the short-term element. We supplemented this with information from the Australian Institute of Health and Welfare (AIHW) population hospital morbidity data over the period 1995-2001 for specific health conditions.

3.9
There were many changes in the health surveys between 1995 and 2001, including changes in the definition and classification of health conditions. The change in the number of (specific) health conditions over the period could in part be due to differences in survey methodology. Nevertheless, whatever the reason for the changes in prevalence over the period 1995-2001, what was important was to reflect these changes in the model base file[9].

Two-week Window for Reporting Short-term Conditions

3.10
In the 1995 health survey, short-term conditions (or recent illness) are identified through an actions-based approach. Respondents were asked whether they had taken certain types of action in the previous two weeks, and the medical condition or other reasons for those actions. A two-week reference period was adopted as a compromise between minimising respondent recall errors and ensuring sufficient observations were recorded from which reliable estimates could be produced. The data were collected over a 12-month period so any seasonality occurring for particular conditions would have been accounted for. In summary, information from the 1995 NHS can be taken to estimate the prevalence of short-term health conditions in any two-week period during that year (ABS 1996, pp 121 and 125).

3.11
Although the 2-week period is practical for recall purposes, the relative shortness of this period has implications for our purposes. While the survey is able to capture information on all survey respondents that had a long-term condition, it is only able to capture information on a fraction of the respondents that had a short-term condition in a year. For example, those experiencing short-term conditions a month back would not be counted.

3.12
The next table shows the distribution of the Australian population by term of health condition. Nine percent of the 1995 respondents reported having a short-term health condition (only) within the past 2 weeks whereas, if we were to take an annual picture, the proportion of respondents that suffered from short-term health conditions sometime during the past year would be considerably higher. Similarly, the proportion of respondents with no health condition in 1995 (whether short- or long-term) would be considerably lower than the 16% reported based on the two-week survey window. Comparable figures for 2001 are presented to indicate the change between the two years.

Table 3: Distribution of persons by term of health condition, 1995 and 2001

YearConditionPersons
(thousands)%
1995Long term only or both recent and long-term13,36574
Recent only (short-term)1,6259
No health conditions (not applicable)2,89016
Total population18,061100
2001With a long term condition14,73778
Without a long term condition4,17922
Total population18,916100

3.13
In conclusion, while the 1995 NHS does have the most comprehensive information on short-term conditions, we need to take note of the limitations of the two-week window for reporting short-term conditions — particularly when what we actually require for the modelling are annual estimates.

Imputing the Prevalence of Short-term Health Conditions

3.14
Numerous studies have found a link between health and income (see Walker and Abello 2000 and Walker et al 2006 for review of relevant literature). We take concession card status as a proxy for income. Likewise, there are clear patterns in the distribution of disease by age, gender and self-assessed health status. Given the foregoing, the imputation of short-term conditions was based on concession card status, gender, age and self-assessed health status. Persons were divided into the following age groups, which were set up to represent differences in the prevalence of health conditions across these age ranges: 0-4, 5-14, 15-24, 25-39, 40-64, and 65 years and over.

3.15
Overview of imputation process Imputing short-term conditions onto the model population involved sorting the person records in the model base file by concession card status, gender, age group and self-assessed health status. For each short-term health condition, person records were selected at random to 'have' the ST health condition until the uprated prevalence figures were met.

3.16
Two-monthly prevalence rates Short-term conditions in the 1995 NHS were based on health conditions persons reported having over the previous two weeks. The prevalence of short-term (ST) health conditions on a two-weekly basis were obtained from the 1995 NHS then uprated to 2001 levels. The use of a fortnightly prevalence rate to impute short-term conditions onto the model dataset implies that we would have to impute 26 times to bring the fortnightly estimates up to annual estimates.

3.17
Another approach is to scale up or multiply by a number greater than 1.0 the prevalence rates (expressed as a percentage of the population) before imputing. However the scaled-up prevalence rates should not exceed 1.0 as a prevalence rate of 1.0 implies that all persons in the selected group will "get" the health condition. If the rate is greater than 1.0 then the target prevalence rate will not be achieved as there will not be sufficient number of persons to be imputed the disease. An inspection of the fortnightly prevalence rates for all short-term conditions showed that when multiplied by 26/6 (multiplied by 26 fortnights, and divided by 6 months), none exceeded 1.0, so a two-monthly prevalence rate was deemed to be reasonable.

3.18
To expand the two-week estimate to a two-monthly estimate, prevalence rates were multiplied by 26/6. The imputation procedure using the two-monthly prevalence rates was carried out six times, resulting in annual estimates of the prevalence of short-term conditions in the model population. Each two month imputation was independent of previous imputations. Doing the imputation this way implies that a person has one chance of getting a specific short-term health condition every two months. In actuality, some persons do experience some conditions (e.g. colds) more frequently than that, while other conditions (such as influenza) might only occur once in a season as infection leads to immunity. In general, however, we expect this assumption to be reasonable.

3.19
Take as an example, back problems. The two-monthly prevalence rates for this condition are shown in Table 4 by a person's age group, gender and card status; for purposes of simplicity we do not present the rates by self-assessed health status. The first figure of 0.03 indicates that, over a period of two months, we expect 3 percent of male concession cardholders aged 0-14 to be imputed to have a back problem while, for non-concession cardholders (the general population), the percentage is 1 percent.

3.20
Using two-monthly prevalence rates, the imputation process was done six times, for each short-term condition, so we end up with annual prevalence rates. Every two months about 3 percent of males aged 0-14 among concessional patients would be imputed to have a back problem once. Because of the imputation process used, a person could be imputed, at most, to have a back problem six times in a year.

Table 4: Two-monthly prevalence rate of back problems by concession card status, 2001 (per 100 population)
Source: NATSEM estimates.

ConcessionalConcessionalGeneralGeneral
MalesFemalesMalesFemales
15-34 years0.030.010.010.01
35-49 years0.090.090.070.16
50-64 years0.120.180.150.17
65-74 years0.230.180.130.17
75 years plus0.120.130.140.05

3.21
Cloning To adequately assign short-term health conditions across the whole population, it was necessary to clone the NHS records i.e. create multiple records of the same person in the dataset. Each record in a survey has a weight representing the likelihood of finding persons with a similar set of characteristics in the Australian population. Records can be duplicated with each clone i.e. each new record having a proportionally smaller weight (maximum weight was set at 200). The cloning of records with smaller weights enabled us to impute short-term conditions with greater accuracy.

Conclusion Regarding the Imputation of Short-term Health Conditions

3.22
Short-term health conditions were imputed based on the prevalence in 1995, uprated to 2001 levels, and taking into account the distribution of conditions by concession card status, gender, age and self-assessed health status. The two-weekly estimates were then annualized. There are a number of potential limitations in the methodology used, particularly assuming that the prevalence of short-term conditions over the period 1995-2001 changes at the same rate as that of long-term conditions. The method of scaling up the prevalence rates to a two-monthly level and doing the imputation six times to come up with annual estimates is a modelling simplification, and does not fully replicate the real-life process. For particular short-term health conditions (such as influenza), that may occur once in a season rather than several times, the modelling may need to be modified to reflect this. If the data on prevalence of short-term conditions were to be used for a purpose more directly related to health, then one would need to be careful in using the imputed values. For the purposes of MediSim, which is to use the prevalence of short-term health conditions (in addition to actual data on the prevalence of long-term conditions) to calculate the annual drug usage of individuals, the limitations of the methodology have a marginal effect on the model and what it can do.

* Imputing Prescribed Drug Usage

4.1
Data on the use of prescribed medicines is available in the 2001 NHS only for national health priority areas that are specified by the respondent as long-term. For short-term and non-priority health conditions, annual drug usage has to be imputed.

4.2
Imputing fortnightly drug usage involved the following steps: (a) estimating the probability of taking prescribed drugs given that one has a specific health condition; and (b) given that one takes prescribed drugs, modelling the number and type of drugs taken. Steps (a) and (b) were done separately for short-term and long-term conditions. Note that by implementing steps (a) and (b) we are implicitly assuming that there has been no change in the nature of demand and supply for prescribed medication, including such aspects as demand for new medicine and change in doctor prescribing patterns, amongst others. Over the period 1993 to 2003, there has in fact been an annual increase of about 3 percent in PBS scripts per capita (total PBS scripts divided by the Australian population). However, there is no data on the change with respect to number of persons using PBS drugs, or number of PBS scripts per person using PBS drugs, as 2003 is the first year for which we have data on the usage of scripts by all persons using PBS drugs (prior to 2003, Medicare Australia only monitored the usage of concession cardholders). Due to the lack of data on the changes in total PBS usage prior to 2003, we adopt a two-step approach: first, we impute drug usage using the 1995 patterns. Subsequently, we modify the imputed drug usage based on actual data as of 2003.

Imputing the Probability of Taking Prescribed Drugs

4.3
Not all persons who have health conditions take prescribed medication for that condition or even any medication at all. For each health condition, the 1995 NHS provides information on the proportion of persons having such conditions that take prescribed drugs[10]. This proportion varies by the type of health condition (with the proportions being very high for those with diabetes, most heart conditions, epilepsy, other hereditary diseases of the nervous system, and contraceptive management). Initially, we considered the possibility of grouping conditions based on closeness in the proportion of persons taking prescribed drugs. However, it was hard to find a common pattern and the best option seemed to be to do the allocation on a specific condition basis.

4.4
We estimated the probability of taking prescribed drugs, given that a person had a specific health condition, taking into account differences in gender, age, and card status. Card status is particularly important, as the usage of PBS drugs is much higher for concession cardholders than non-concession cardholders. Age is also particularly important, as the oldest and youngest age groups tend to have a higher proportion taking prescribed drugs.

Imputing the Number and Types of Drugs

4.5
After the proportion of persons (by specific health conditions) taking prescribed drugs had been established, the next step was to identify the number and types of prescribed drugs taken for each specific health condition. The variables taken into account include type of health condition, gender, age and card status.

Converting Fortnightly to Annual Drug Usage

4.6
There was no need to adjust the imputed drug usage for short-term conditions, due to the approach taken of scaling up the prevalence levels to a two-monthly period and implementing the imputation procedure six times. To convert the imputed fortnightly long-term drug usage into an annual figure, each person's script for a long-term condition was multiplied by 12, for each type of drug used. This presumes that a person with a chronic condition requiring the use of prescription drugs will use the drug(s) regularly throughout the year. This also assumes that scripts are issued for a 1-month's supply, which is generally the case for chronic conditions in Australia.

4.7
The actual (as against imputed) drug usage for priority conditions available on the NHS was summed up and converted to an annual figure using a factor of 12. This, together with the imputed scripts for non-priority conditions, represents the total number of scripts used annually by the total Australian population excluding Veterans[11].

PBS Scripts: Aligning Imputed Drug Usage to Administrative Data

4.8
After annual estimates of total prescribed drug usage had been imputed, we then shifted the focus to PBS prescriptions. In Australia, total prescribed drug usage includes three types of medicines:

4.9
The focus of the model is on PBS benefit or Group 1 drugs only so the alignment procedure selects and then aligns PBS scripts to administrative numbers.

4.10
The total annual scripts (imputed and actual) were summed up for each of the 19 drug classes in MediSim (see Appendix Table B1 for drug classes used in MediSim). For benchmarking purposes, we obtained administrative data on the number of PBS scripts per year per person by concession card status, gender, five-year age group and drug class for the year 2003 (see figure 2)[12]. We also had administrative data on the number of persons using PBS drugs, by the same categories.

Figure
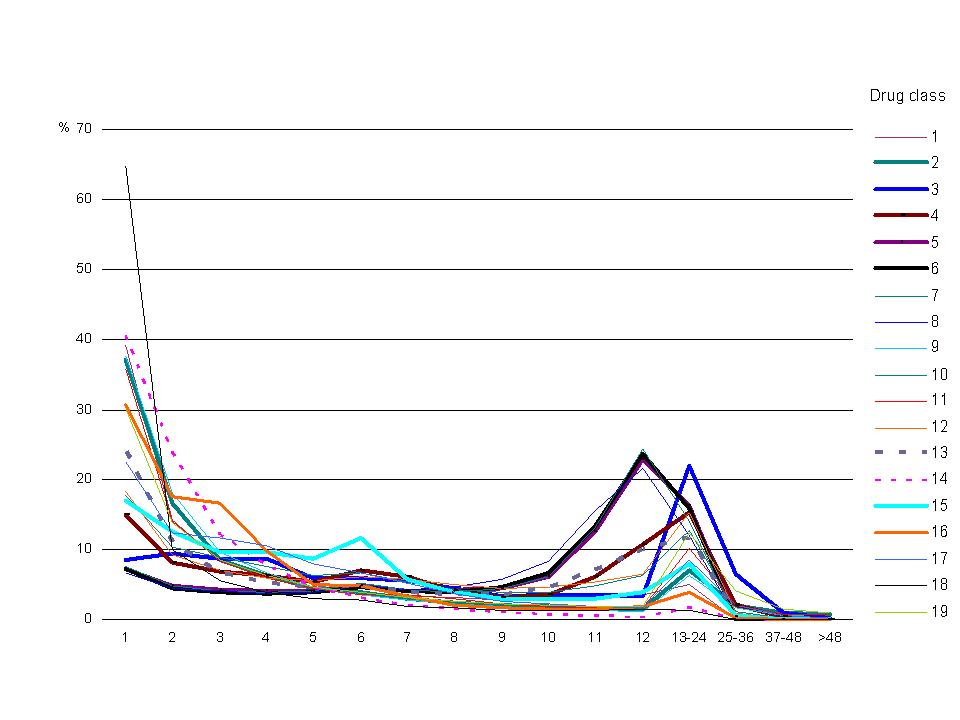
Figure 2. Distribution of annual PBS scripts per person, 2003
Data source: Medicare Australia
Note: See Appendix Table B1 for listing of drug classes. The data underlying this graph are in Appendix Table C1.

4.11
For each of the 19 drug classes, Figure 2 shows the proportion of PBS beneficiaries using only 1 script per year, 2 scripts per year, and so forth. Particular drug classes, such as drug class 18 (direct acting antivirals) and drug class 14 (antibiotics) are used only once a year by most persons, whereas other drugs taken for chronic conditions have higher annual scripts, with peaks at 12 scripts and 24 scripts per year.

4.12
Total script usage may be viewed as the product of number of persons using a particular drug type, and number of scripts used per drug type. To validate the data on drug usage, we examined this on two fronts. First, we looked at the number of persons taking drugs, and second, we looked at the number of scripts per person. Steps were taken to more closely align the imputed drug usage to administrative numbers.

4.13
Number of persons taking drugs The total number of scripts in the model base file looked reasonable. However, when looking at the number of persons using drugs and their average number of scripts, there were large discrepancies between what we had in the model, at that stage, and comparable administrative numbers from Medicare Australia[13]. In particular, administrative data showed many more persons using PBS medicines than we had estimated in the model, for most (14 out of 19) drug classes, particularly for the very young and the very old. The exceptions were these five drug classes: anti-inflammatories, vasodilators beta blockers, calcium channel blockers, anxiolytics and hypnotics and direct acting antivirals[14].

4.14
This discrepancy may be attributed in part to our methodology of imputing the probability that persons with specific health conditions take drugs simply based on 1995 usage rates. As discussed previously, due to changes in the coverage of the 2001 national health survey there is no data on the change between 1995 and 2001 in the number of persons taking drugs with specific health conditions. The discrepancy may also be attributed to the non-inclusion of institutionalised persons in the NHS data (with the NHS survey only covering people living in private dwellings)[15]. Supporting this assumption about the institutionalised, the "lack of persons" was true for most drug classes, even those that cater primarily to priority conditions, for which actual drug usage was available in the 2001 NHS. This includes asthma medications, diabetes medications, heart condition related drugs, mental- health related therapies and cancer drugs.

4.15
In conclusion, to take into account increases in the rate of medication between 1995 and 2001 as well as the non-inclusion of institutionalised persons in the NHS data, we revised the methodology to increase the proportions of persons taking medication for the 14 drug classes, until they matched administrative numbers. These individuals were taken from the group of persons having health conditions that required the use of those particular drugs.

4.16
Finally, for each drug class, we identified persons in the base file using the drug, listed their scripts classified by their card status-gender-age group, and designated (at random) some as PBS scripts until we had sufficient number of PBS users to match administrative numbers for each drug class-card status-gender-age group. Note that since persons may take multiple drugs, persons in the base file may have some of their scripts designated as PBS scripts, and others designated as non-PBS scripts.

4.17
Number of scripts per person Next we looked at the number of annual scripts per person in the model base file and compared this with administrative data from Medicare Australia. The administrative data shows, for each drug class, card status, gender and age group, how many persons used one script, two scripts, and so forth on an annual basis. To make this clearer we present an extract of the data on the distribution of scripts in Table 5. The table shows the distribution of PBS scripts of males with concession card status, using anti-inflammatories (drug class 1) in 2003. For example, the first cell in the table shows that 231 or the majority of young male children aged between 0-4 years used only one script in 2003.

4.18
The alignment procedure was as follows: for each of the 19 drug classes, by card status, gender and age group, scripts in the model base file were ranked from highest to lowest. This is compared with administrative data on the distribution of scripts. The administrative data on the distribution of scripts per person by drug class was used to revise the initial level of PBS scripts. In part, this revision of scripts may be viewed as a refinement to the crude method taken of giving each person with a long-term condition 12 scripts to convert the two-weekly drug usage into an annual figure.

Table 5: Example on distribution of PBS scripts per person (anti-inflammatories, males with concessional card status) by age group, 2003
Data source: Medicare Australia.

Number of persons by age group
No. of scripts0-45-1415-2425-3435-6465+
12313,42621,34240,65086,56985,152
2323353,09210,00535,84741,216
361198604,19420,61127,669
49704152,34415,74623,305
56371981,36810,46316,614
62241309088,50414,748
7219987067,41713,763
8110344526,17212,110
9111374207,35715,798
10179986712,23822,213
1107885976,74612,779
12019544895,96011,315
13-24012514137,07514,677
25-3600248363330
37+00044526
Total2914,09626,50063,465231,113311,715

Concluding Note on Imputation of Drug Usage

4.19
The methodology to impute drug usage for short-term and non-priority health conditions in the model was a long process. The initial steps, particularly using the 1995 national health survey, implicitly assumed no change in usage since 1995. However, subsequent steps — particularly aligning the imputed drug usage to actual data — compensated for this deficiency in the methodology due to data limitations. Because of the alignment method adopted, the designated PBS scripts in the model very closely approximate the distribution of (actual) administrative data on total scripts by drug class and the distribution of scripts per person, by drug class, concession card status, gender and age group. This represents a substantial advance in the data on drug usage. (Figures comparing the distribution of drug usage in the model base file with administrative data on actual PBS scripts are provided in Appendix tables C2 to C4.) In the previous version of the model, while the aggregates per drug class were accurate, we were less certain about whether scripts per person were reasonable. Similarly, the distribution of PBS users in the model now closely approximates the distribution of PBS users based on administrative data. Note that in order to more closely align scripts at the person level with administrative data, the model's records had to be cloned further, with each record having a maximum weight of 100 or less.

* An application of the model

5.1
Since the model was updated in 2004, MediSim has been used for number of applications on the distributional impact of the PBS in general and the PBS safety net in particular (Brown et al 2005a, Brown et al 2005b and Brown et al 2006). The model has also been used to quantify the effect of changing the rules of the PBS in various ways — such as greater differentiation in setting copayments, means-testing, changes in the indexation of copayment increases, and changes to the PBS pricing system.

PBS Policy Settings

5.2
The policy settings of the Pharmaceutical Benefits Scheme for recent years are given in table 6. The figures for 2005 show that:

5.3
Although some PBS medicines can cost over $100, patients are required to pay at most $28.60. If the full price of the drug is below $28.60 (or $4.60) then the patient pays the full price — these drugs are known as 'below copayment' drugs and are not included in PBS statistics.

5.4
Families requiring a lot of medicines in any one year are protected by the PBS safety net. Once a family that does not have concessional benefits records spending beyond the safety net limit of $874.90 in a calendar year, they are required to pay only $4.60 for each further PBS medicine within the same year. For concessional patients there is no cost once their families have a record of spending beyond the safety net limit of $239.20 in a calendar year. In this case the government pays the full price of all further PBS medicines prescribed within the year. Each year, on 1 January, the safety net for each family is reset to zero for administrative purposes.

Table 6: Policy settings of the Pharmaceutical Benefits Scheme, 2001-06

1/1/20011/1/20021/1/20031/1/20041/1/20051/1/2006
$$$$$$
Copayment — Concessional
Below safety net3.53.63.73.84.64.7
Above safety net000000
Copayment — General
Below safety net21.922.423.123.728.629.5
Above safety net3.53.63.73.84.64.7
Safety net threshold
Concessional182.0187.2192.4197.6239.2253.8
General669.7686.4708.4726.4874.9960.1
No. of safety net scripts
Concessional525252525254
General313131313133

Overview

5.5
There were a number of significant changes in 2005 that affected the Australian PBS. Foremost was a 21 percent increase in patient copayments and safety nets starting 1 January 2005, relative to the previous year. Another measure that came into force was that the price of all drugs in a reference-pricing group (or medicines that produce similar health effects) were required to drop 12.5 percent once one of them came off patent and the first generic version became available. Further, starting 2006, the safety net thresholds were legislated to increase by two scripts in each year for four years. This adds to the safety net threshold the equivalent cost of eight scripts by 2009.

5.6
In 2005-06, total PBS prescriptions declined by 1.2 percent relative to the previous financial year. This is the first time since 1990-91 — coinciding with another significant copayment increase — that PBS scripts showed any decline. In 2005-06 some 172 million scripts were estimated to be subsidised under the PBS at a total cost of $6.6 billion[16], with 82 percent of this expenditure being met by Government and 18 percent from patient contributions.

5.7
The next sections describe which Australian families benefited most from government outlays on the PBS. The results for 2005-06 are presented by income quintile, age group, family type and lifecycle group.

5.8
Income quintile is derived from equivalent disposable annual family income based on the new OECD equivalence scale. The quintiles are population based in that each person has been ranked by the equivalent disposable annual income of their family and the population divided into fifths. Quintiles have been calculated separately for concessional, general and all persons. Thus, the bottom quintile of concessional patients is the bottom 20 percent of individuals who live in families that have a concession card, after ranking by the equivalent disposable annual income of their family. Disposable annual income per family is simply gross annual income of the family minus income tax. An equivalence scale is used to adjust the income of each family, in an attempt to place families with a differing number of mouths to feed on a more equal basis. The equivalence scale used is the new OECD scale, which gives a value of 1 to a single adult, 0.5 to a second adult and 0.3 to each dependent child.

5.9
Family type is defined in terms of whether or not there are dependent children in the family and whether or not there are one or two adults in the family e.g. couple versus sole parent or single person family. Dependent children are defined as children aged 0 to 14 years, or aged 15 to 24 years and engaged in full-time study, or non-fulltime students aged 15-20 who are considered dependents. Lifecycle group is based on family type plus age of the head of the family.

5.10
Costs and script volumes are averaged over the total population, not just families who used PBS medicines in 2005-06. With improved modelling of the safety net in the updated MediSim, it is now possible to report annual figures — thus the distributional impact of the PBS reported in this paper are annual and not the fortnightly window previously reported in Harding et al (Harding et al 2004).

Distributional Outcomes

5.11
Income group About 41 percent of all PBS government outlays are directed towards the poorest one-fifth of Australians. In sharp contrast, just under 8 percent of total PBS outlays are received by the most affluent one-fifth of Australians. This highly pro-poor pattern of outlays reflects the higher subsidy received by persons in lower income families (figure 3).

Figure
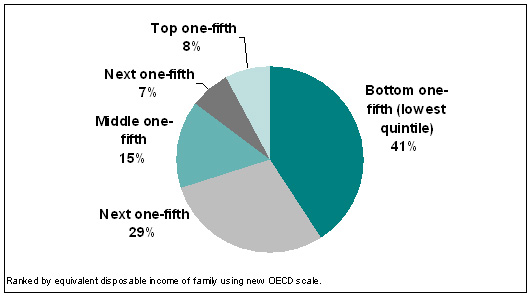
Figure 3. Estimated percent of PBS outlays received by each income quintile of Australians, 2005-06

5.12
Concession card status by age group While partly related to income, age is another key driver of the receipt of PBS benefits. Figure 4 emphasises how outlays on concessional patients dominate the system. It also illustrates clearly how negligible are outlays on general patients aged 60 years and above.

5.13
During childhood and adolescence, between two-thirds and three-quarters of all PBS government outlays are received by concessional families, with the remainder being directed at children living in families that are not within the social security and family payments safety net.

5.14
During the years of the 30s, about two-thirds of all PBS outlays go to those living in concessional families, with this proportion falling to its lowest level of about half of all PBS outlays when individuals are in their late 40s and early 50s. During this period of the life cycle, Australians are relatively more likely to have become 'empty nesters', be in employment and not be dependent on the welfare or other benefits that provide a passport to the concessional PBS card. However, this profile changes dramatically during the retirement years after age 55. From age 65 onwards, about 95 percent of all PBS outlays directed at this age group go to concessional families, reflecting the high rates of receipt of the age pension and the extension in recent years of PBS concessional status to most self-funded retirees. In addition, of course, the pattern of rising total PBS outlays across the life cycle is a product of increasing rates of morbidity as age increases, reflected in the steady rise in script numbers after the age of 20 years.

5.15
The pattern of PBS benefits generally rising steadily with increasing age stands in sharp contrast to the underlying population distribution. Of every six dollars spent by Government on the PBS, one dollar was received by a person aged 75 years or more. And yet while this age group received about 17 percent of total PBS government outlays, they represented only 5.6 percent of Australians. Conversely, Australians aged 20 to 24 received only 2.4 percent of total PBS government outlays but represented 7 percent of the Australian population.

Figure
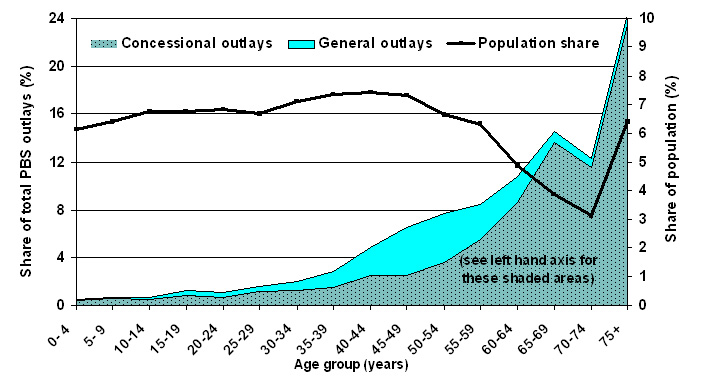
Figure 4. Estimated percent of PBS outlays received by age group, 2005-06

5.16
Concession card status by income group Another possible perspective is to separate the concessional and general populations, and then calculate income quintiles for each group (rather than for the population as a whole, as done above). Thus, in this case, 'concessional quintile 1' equates to the poorest 20 percent of Australians living in families that receive concessional pharmaceuticals, while 'general quintile 1' represents the poorest 20 percent of Australians living in families that do not receive concessional pharmaceuticals.

5.17
Figure 5 traces PBS government outlays received as a percentage of disposable income, for all Australians and for those who live in concessional and general families. Government outlays per family (expressed as a proportion of family disposable income) decrease significantly as family incomes rise. The poorest one-fifth of families receive government benefits amounting to 6.6 percent of family disposable income, compared to 0.4 percent for the top 20 percent. This pro-poor pattern of expenditure occurs for both concessional cardholding families and non-concessional families. Total expenditure by families and the government on PBS subsidised medicines amounts to 8.1 percent of the annual disposable income for the lowest concessional income quintile families, decreasing to 3.4 percent for the top concessional quintile, and for general patients from 1.6 percent to 0.5 percent.

Figure
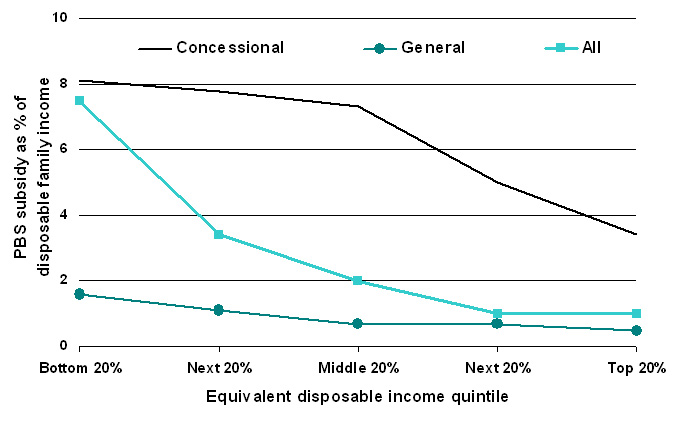
Figure 5. Estimated PBS subsidy as a proportion of disposable family income, 2005-06

5.18
Concession card status by family type One of the important redistributive effects of health outlays is the support offered to families with children (ABS 2001b, Harding et al 2002). Accordingly, Figure 6 and Table 7 show the estimated value of the PBS subsidy received by different types of families in Australia.

Figure
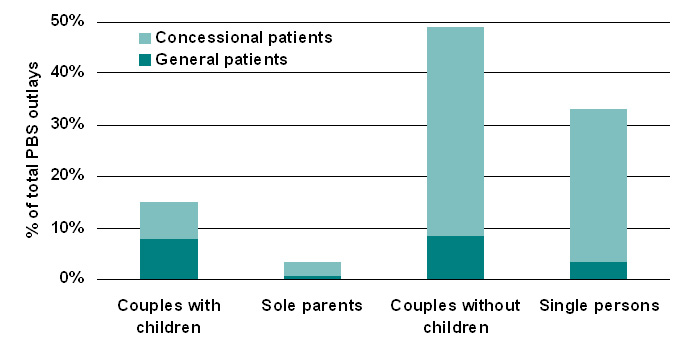
Figure 6. Estimated distribution of PBS subsidy by family type, 2005-06

5.19
Families with children are estimated to spend between 0.3 and 0.4 percent of their annual disposable income on PBS medicines in 2005-06. This seems to occur irrespective of whether or not the family is a couple or sole parent family, are concessional cardholders or not, and independently of the number of children.

5.20
The majority of couple with children families (80 percent) do not have concessional status and receive Government subsidies to the value of only 0.5 percent of their annual family income. In contrast, sole parent families typically have concession cards and receive a much higher government subsidy of $507 on average per annum per family, which is equivalent to 1.8 percent of disposable family income. Sole parent families receive an estimated 3.2 percent of total government outlays on the PBS while couples with children receive 14.9 percent.

Table 7: Estimated impact of the PBS by family type, 2005-06

CouplesSoleCouplesSingleAll
withparentswithoutpersonsfamilies
childrenchildren
Unit
All patients
Disposable annual income per family (1)$58,03931,40039,79026,55236,638
Family spending per year on PBS drugs (2)$20383.8220.473.5137.3
Family spending % of income (2/1)%0.30.30.60.30.4
Govt subsidy per family on PBS drugs (3)$487.4455.51,109.00347.1569.2
Government subsidy % of income (3/1)%0.81.42.81.31.5
% of all PBS govt. subsidy received by this group%14.93.248.933100
Total PBS expenditure per family (2+3) $690.4539.31329.4420.6706.5
Total PBS spending % of income (2+3)/1 %1.21.73.31.61.9
No. of families '0002,1704692,5505,15710,347
Concessional patients
Disposable annual income per family (1)$33,56027,91825,98518,06322,903
Family spending per year on PBS drugs (2)$136.674.8198.6106.7132.7
Family spending % of income (2/1)%0.40.30.80.60.6
Govt subsidy per family on PBS drugs (3)$1141.7507.22062796.71161.9
Government subsidy % of income (3/1)%3.41.87.94.45.1
% of all PBS govt. subsidy received by this group%7.42.740.529.680.2
Total PBS expenditure per family (2+3) $1278.35822260.6903.41294.6
Total PBS spending % of income (2+3)/1 %3.82.18.755.6
No. of families '0004243711,0972,0163,907
General patients
Disposable annual income per family (1)$63,97544,53950,21831,99844,973
Family spending per year on PBS drugs (2)$219117.8236.952.2140.1
Family spending % of income (2/1)%0.30.30.50.20.3
Govt subsidy per family on PBS drugs (3)$328.8260.338958.6209.5
Government subsidy % of income (3/1)%0.50.60.80.20.5
% of all PBS govt. subsidy received by this group%7.60.58.43.419.8
Total PBS expenditure per family (2+3) $547.8378.1625.9110.8349.6
Total PBS spending % of income (2+3)/1 %0.90.81.20.30.8
No. of families '0001,746981,4533,1426,439

5.21
In stark contrast, couples without children spend much more, both in terms of absolute dollars and as a proportion of their income, on PBS medicines than any other family type. This is true for both concessional and non-concessional families. In addition, this family type receives more government dollars per family — the government subsidy on PBS medicines for concessional couple only families amounts to 7.9 percent of family disposable income and 0.8 percent for general couple families. Thus, this family type invests heavily in prescribed medicines while receiving nearly 50 percent of total government expenditure on the PBS. As shown in the next section, this result is driven by the high proportion of aged couples without children in this group.

5.22
As expected, the pattern of expenditure for single persons differs significantly by concessional cardholder status. About 60 percent of all singles will not possess a concession card and therefore are likely to receive an extremely low PBS subsidy across the year (less than $60). Consequently, even though single person families without concession cards represent about 30 percent of all Australian families, they receive only 3.4 percent of total government PBS outlays. This group of individuals also have the lowest user-contribution, averaging an annual expenditure on PBS subsidised drugs of only $52 (i.e. $1 per week).

5.23
Concessional single person families are, however, the second largest user group of PBS medicines, receiving nearly 30 percent of all government PBS expenditure and contributing a further $107 per person per year in the costs of PBS medicines.

5.24
Concession card status by lifecycle group If PBS expenditure is to be seen as an investment in the future health and productivity of the nation then what are the outlays on PBS medicines by families and government in terms of stage in the lifecycle? As Figure 7 and Table 8 indicate, the PBS has major effects across the lifecycle.

Figure
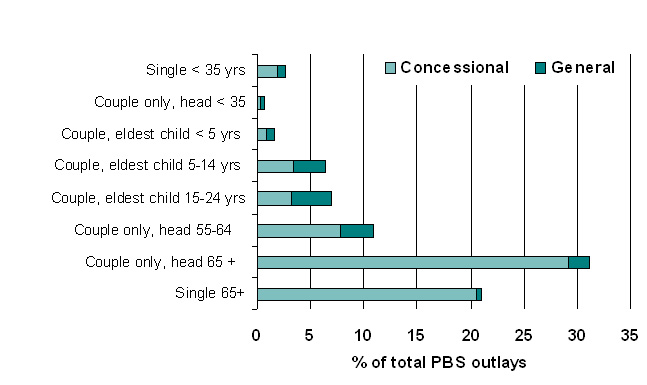
Figure 7. Estimated distribution of PBS subsidy by lifecycle group, 2005-06

5.25
The biggest consumers of medicines are elderly couples and singles, whose estimated total PBS expenditures per family are over $2500 and around $1300 respectively. Over 90 percent of these elderly families access PBS medicines at concession rates. While these two groups represent 17 percent of all Australian families, they receive over half of all Government outlays on the PBS. Given their relatively low incomes, this subsidisation represents a significant welfare transfer — 8.9 and 6.9 percent of disposable annual family income.

5.26
In contrast, single persons aged less than 35 years spend the least on PBS medicines, matched by relatively low government subsidisation ($20 for general patients and $187 for concessional patients). Similarly, young couples are the second lowest investors in PBS medicines but it is this group that receive the lowest share of government subsidies of any lifecycle group. Just over one-fifth of young singles are concession cardholders — whereas only 9 percent of young couples are entitled to the reduced concessional rates.

5.27
Both expenditure by families with children and government outlays increase as the children grow older and family size increases. Couple families where the eldest child is aged 15-24 years and who have a concession card are expected to have a total expenditure of around $1656 in 2005-06 on PBS subsidised medicines and general families $859.

5.28
Summary The description of distributional outcomes indicate that the PBS is highly progressive, with two-fifths of total PBS outlays being directed at the poorest one-fifth of Australians. There are also pronounced distributional effects by age and over the life cycle.

Table 8: Estimated impact of PBS by lifecycle group, 2005-06

SingleCoupleCouple,CoupleCoupleCoupleCoupleSingle
<35yrsonly, headeldesteldesteldestonly, headonly, head65+ yrs
<35yrschildchildchild55-64yrs65+ yrs
Unit
All patients
Disp. annual family income (1)$27,69953,67054,57357,91260,67036,55329,20118,771
Family spending on PBS (2)$1948111188295276265165
Family spending % income (2/1)%0.10.10.20.30.50.80.90.9
Govt PBS subsidy per family (3)$57.8104.4278431734.2949.123231132
Govt subsidy % of income (3/1)%0.20.20.50.71.22.686
% of all PBS govt subsidy received by this group%2.70.61.66.571131.621.3
Total PBS family spending (2+3) $76.8152.43896191029.21225.125881297
Tot. spending % income (2+3)/1 %0.30.30.71.11.73.48.96.9
No. of families '0002,4694184301,1186216467691,009
Concessional patients
Disp. annual family income (1)$19,83128,96630,17333,82234,92924,18026,60717,693
Family spending on PBS (2)$296695129171188219158
Family spending % income (2/1)%0.10.20.30.40.50.80.80.9
Govt PBS subsidy per family (3)$187.4476.8742.61063.61485.41746.52422.81200.5
Govt subsidy % of income (3/1)%0.91.62.53.14.37.29.16.8
% of all PBS govt subsidy received by this group%1.90.30.83.43.27.929.220.6
Total PBS family spending (2+3) $216.4542.8837.61192.61656.41934.52641.81358.5
Tot. spending % income (2+3)/1 %1.11.92.83.54.789.97.7
No. of families '0005493971221132244678932
General patients
Disp. annual family income (1)$2994756224593536384167625440604874631947
Family spending on PBS (2)$1646114202328329613244
Family spending % income (2/1)%0.050.080.20.30.50.71.30.8
Govt PBS subsidy per family (3)$20.765.9187275.3531.2465.21571.5294.3
Govt subsidy % of income (3/1)%0.10.10.30.40.81.13.20.9
% of all PBS govt subsidy received by this group%0.70.30.833.8320.4
Total PBS family spending (2+3) $36.7111.9301477.3859.2794.22184.5538.3
Tot. spending % income (2+3)/1 %0.10.20.50.71.31.84.51.7
No. of families '0001,9213793608974894029076

* Summary and conclusion

6.1
Considerable challenges face modellers attempting to construct health microsimulation models. This article has described a number of steps taken to overcome the 2001 NHS survey limitations as the main base file for MediSim, a model of Australia's Pharmaceutical Benefits Scheme. First, we statistically matched the NHS with another survey, to create synthetic families and get a complete record for every individual within each family, as family level information is needed to model PBS safety nets. The statistical matching allowed the retention of the health information available on NHS 2001, whilst borrowing the family structure from another survey. Next, we imputed short-term health conditions based on detailed information in the previous (1995) NHS and converted the two-weekly prevalence rates derived from the 1995 survey's two-week recall period to annual figures. Finally, we imputed annual drug usage for short-term and non-priority long-term health conditions. These initial estimates were then aligned to administrative data on PBS benefit drugs.

6.2
The application of statistical matching methods and use of complementary data sets significantly improved the usefulness of the 2001 NHS as a base dataset for MediSim, and enabled improved modelling of the PBS safety net. These enhancements to the national health survey have improved the capability of MediSim as a microsimulation tool for policy-makers, the pharmaceutical industry and health researchers.

6.3
This article also illustrated some of the outputs that can now be derived from the MediSim model, and this analysis clearly demonstrates that the PBS has pronounced distributional effects. The Scheme is highly progressive, with two-fifths of total PBS outlays being directed at the poorest one-fifth of Australians. There are also highly differential effects by age and over the life cycle.

6.4
While much work has been undertaken to enhance the model's main data base, there is still scope for possible future improvements and extensions of the model with respect to its base data as well as applications.

6.5
To date, the primary utility of the model has been based on its capability to estimate patient and government expenditures on PBS medicines based on various price and copayment assumptions, as well as to estimate the corresponding effect on families belonging to various income groups. The introduction of diseases into the model's dataset opens the possibility of using these health measures in some way, for example, to examine options that raise copayment thresholds for general patients but simultaneously protect the chronically ill through safety net provisions.

6.6
Over the medium-term, the current methodology of using patterns in the 1995 health survey to impute drug usage will become outdated. One way to update the methodology is to utilise administrative data on usage of PBS scripts and number of persons using PBS scripts, that is available starting 2003. As the administrative dataset does not have any information on the underlying health conditions for which the drugs are being taken, this could be supplemented by developing a concordance between specific health conditions and types of drugs taken for these conditions.

6.7
Over the long-term, statistical matching of the national health survey with administrative datasets, may provide the solution. In 2006, the Australian Bureau of Statistics started looking into statistically matching the census with administrative data on births and deaths, long-term migration and national disease registers. In the years to come, the possibility of statistically matching surveys, particularly the health survey, with administrative data, may become a reality.

* Acknowledgements

The construction of the current version of MediSim was supported by an Australian Research Council linkage grant (LP0219571), and by Medicines Australia, the Industry Partner to this grant. The authors would like to thank Brendan Shaw, Senior Manager, Policy and Research, Medicines Australia and members of the Pharmaceutical Economic Taskforce of Medicines Australia for their advice and input on the modeling, and three anonymous referees for valuable comments.


* Notes

1 STINMOD/01a is NATSEM's static microsimulation model of the Australian tax and transfer system, based on the 1998-99 Household Expenditure Survey (HES).

2 The Australian health system has identified 7 national health priority areas (NHPAs), including arthritis and musculoskeletal conditions, asthma, cancer control, cardiovascular health, diabetes mellitus, injury prevention and control, and mental health. The diseases and conditions targeted under the NHPA initiative were chosen because they currently impose high social and financial costs on Australian society, and through appropriate and focused attention significant gains in the health of Australia's population can be achieved.

3 The Australian Bureau of Statistics defines an income unit as 'one person or a group of related persons within a household, whose command over income is assumed to be shared. Income sharing is assumed to take place within married (registered or de facto) couples, and between parents and dependent children' (ABS 2001).

4 NATSEM was given approval by the ABS to conduct the statistical matching, and as part of the approval process, a joint ABS-NATSEM Technical Working Group on Statistical Matching was formed.

5 Rodgers (1984) gives a detailed description of statistical matching, as do Rassler (2002), Radner et al (1980), Cohen (1991), Sutherland et al (2002) and Moriarty and Scheuren (2001).

6 The results are based on unconstrained matching where the distance function used weights of 0.5 for age, 0.25 for equivalised income unit decile and 0.25 for the number of usual residents in the household.

7 For the LP approach each record was "exploded" so that a record was repeated to the extent of its weight. The selection without replacement refers to this "exploded" data set.

8 For our purposes, this only posed a problem with respect to the family income variable. As persons had been reconstructed into synthetic families, whilst retaining all original NHS variables, persons belonging to the same family had different family income values. To have a consistent family income, we averaged the income within each family. This average value was used to rank persons into income quintiles. Note however that the situation would be the same for any variable which relates to the whole family (and should thus be the same across the family), e.g. rurality, SEIFA.

9 For selected long-term conditions, the ABS has made a study of the comparability of the 1995 and 2001 surveys (ABS 2003b). For some conditions, such as heart and circulatory, they have indicated that each successive survey has improved the breadth and specificity of questioning for heart and circulatory. For mental conditions, a greater level of public awareness (and acceptance) may have influenced the higher rates of disclosure of mental health conditions.

10 For most health conditions (except diabetes, heart problems, depression, psychoses, and epilepsy and a few other conditions) a large proportion of persons did not report using any prescribed medication over the previous two weeks in the 1995 NHS. One reason for this could be that not all persons who have a long-term condition currently have an acute episode of that condition, in which case they may opt to take their medication less frequently or not at all. Other reasons could be that prescribed medication is not appropriate for that condition, or that non-prescribed medicine or other types of treatment are used to manage that condition.

11 Veterans were excluded from the model as there is a scheme that parallels the PBS, called the Repatriation Pharmaceutical Benefits Scheme (RPBS) that is separately administered for Australian war veterans and their dependants.

122003 is the first calendar year for which Medicare Australia had data on the distribution of scripts per person by gender, age group and drug classification for both concession cardholders and non-cardholders. Previous to this, data were only collected on concession cardholders that had not yet reached the safety net.

13 Medicare Australia was previously known as the Health Insurance Commission (HIC).

14 Related information on general practice activity (Britt et al 2004) shows that for four out of the five drug classes listed, there was a decrease in medication rates (albeit over a slightly different time period, 1998 to 2004), which is consistent with the finding that for these particular drug classes, there were sufficient number of persons taking medications.

15 The institutionalised include those in hospitals and in homes for the aged and disabled. While we have no data on their drug usage, we expect this to be much higher than the drug usage of persons not living in those institutions.

16 Actual data for 2005-06 are slightly different from NATSEM estimates: at 167 million scripts (instead of 172 million) and total cost of A$6.7 billion (instead of A$6.6 billion).

* Appendix

A Statistical matching tables


Table A1: Quality of the match: number of usual residents variable

NHSHES number of usual residents
123456
Unconstrained1937 . . . .
27903000
33980711
41378621
512313792
6316111465
Constrained181143100
248210310
3218611810
417127271
5112166714
621232072


Table A2: Quality of the match: equivalent income decile variable

HES equivalent income unit decile
NHS12345678910
Unconstrained
17620400 . . . . .
213759300 . . . .
366739410 . . .
4015721651000
50131170123000
6 .0127825210
700 .01885320
8 . . . .0048754
9 . . . .0003889
10 . . . . .0 .0397
Constrained
1351071214123213
212311716973123
3511281516112236
437223151296815
54634231311121113
63644731161299
7274658421366
8254545947137
9135865874612
10114873551254

B Classifications in MediSim


Table B1: Drug classes in MediSim

1Anti-inflammatories
2Asthma medications
3Diabetes medications
4Vasodilators & beta blockers
5ACE inhibitors
6Angiotensin IIs
7Calcium channel blockers
8Cholesterol & triglyceride reducers
9Analgesic medications
10Antipsychotics
11Anxiolytics & hypnotics
12Antidepressants
13Stomach medications
14Antibiotics
15Antineoplastics
16Genitourinary
17Anti-epileptics
18Direct acting antivirals
19All other medications


Table B2: Health conditions in MediSim
Note: NHPA = National Health Priority Area

1NHPA ArthritisRheumatoid arthritis
Osteoarthritis
Arthritis NEC
2NHPA AsthmaAsthma
3NHPA DiabetesDiabetes Mellitus — Type 1
Diabetes mellitus — Type 2
Diabetes unspecified
4NHPA Heart or circulatory conditionAtherosclerosis
Fluid problems NOS
Varicose veins
Haemorrhoids
Other diseases of circulatory system
Hypertension
Heart disease
Stroke
Ill-defined symptomatic heart condition
Cerebrovascular disease
5NHPA MentalNerves tension nervousness
Other mental disorders
Depression
Psychoses
Emotional problems NEC
Body image & eating disorders
Alcohol and drug dependence
Mental retardation specific delays in development
6NHPA CancerSkin cancer
Breast cancer
Neoplasms NEC
7NHPA Injury poisoningComplications surgical NEC
Fractures
Dislocations, sprains and strains
Internal injuries
Open wounds
Bruising and crushing
Entry of foreign bodies
Burns and scalds
Poisoning other than by food
Other injuries
Injuries type not stated
8Musculoskeletal systemBack problems
Other diseases musculoskeletal
Osteoporosis
Rheumatism
Absence of limbs or parts
Musculoskeletal deformities
9Other endocrineThyroid disease
Gout
Obesity
Other endocrine and immune diseases
High blood sugar
High cholesterol
10Respiratory systemBronchitis/ Emphysema
Sinusitis
Cough or sore throat
Other diseases of respiratory system
Common cold
Hayfever
Influenza
11Eye & adnexaBlindness not corrected glasses
Other diseases of eye and adnexa
Visual disturbances
Cataracts
Glaucoma
Hypermetropia/Far-sighted
Myopia / Short-sighted
Presbyopia
12Ear & mastoidOtitis media
Deafness (complete/ partial)
Ear pain
Other diseases ear & mastoid proc
13Nervous systemEpilepsy
Other diseases nervous system
Migraine
Paralysis
Other hereditary diseases nervous system
14Infectious diseasesHerpes
Tinea
Other infectious diseases
15Digestive systemDiarrhoea enteritis
Ulcer
Hernia
Constipation
Dental problems
Other diseases digestive system
16Genito-urinaryKidney diseases
Other diseases urinary system
Other diseases genital system
Disorders of menstruation
17Skin subcutaneous tissueSkin rash NOS
Eczema dermatitis
Acne
Other diseases skin and subcutaneous tissue
Psoriasis
18Diseases of the bloodDiseases of blood
19Complications childbirthComplications of pregnancy etc
20Other Signs & symptomsAllergy NEC
Insomnia
Pyrexia
Localised swelling
Difficulty breathing
Chest pain
Abdominal pain
Heartburn
Dizziness
Headache due to stress
Headache unspecified or trivial
Virus
Other symptoms ill-defined conditions
21Preventive measureImmunisation
22Congenital conditionsCongenital anomalies
23Disability necSpeech impediment NEC
Blackouts loss of cons NEC
Missing organs NEC


Table B3: Short term health conditions imputed in MediSim

Musculoskeletal systemBack problems
Other diseases musculoskeletal
Other endocrine systemThyroid disease
Gout
Other endocrine and immune diseases
Respiratory systemBronchitis/ Emphysema
Cough or sore throat
Other diseases of respiratory system
Common cold
Influenza
Eye & adnexaOther diseases of eye and adnexa
Visual disturbances
Ear & mastoidOtitis media
Ear pain
Other diseases ear & mastoid proc
Nervous systemOther diseases nervous system
Migraine
Infectious diseasesHerpes
Tinea
Other infectious diseases
Digestive systemDiarrhoea enteritis
Constipation
Dental problems
Other diseases digestive system
Genito-urinary systemKidney diseases
Other diseases urinary system
Other diseases genital system
Disorders of menstruation
Skin and subcutaneous tissueSkin rash NOS
Eczema dermatitis
Acne
Other diseases skin and subcutaneous tissue
Psoriasis
Diseases of the bloodDiseases of blood
Complications of childbirthComplications of pregnancy etc
Other signs & symptomsAllergy NEC
Insomnia
Pyrexia
Localised swelling
Difficulty breathing
Chest pain
Abdominal pain
Heartburn
Dizziness
Headache due to stress
Headache unspecified or trivial
Virus
Other symptoms and ill-defined conditions

C Drug usage tables


Table C1: No. of annual scripts per person, by drug type, 2003 (percent distribution)

No. of scriptsDrug class
12345678910111213141516171819
139.2337.118.5315.007.207.197.556.6637.7017.7335.8718.2423.9840.6016.9330.6822.5064.8030.19
214.1316.619.338.044.854.484.774.4918.0510.4214.129.2510.9223.8412.6317.4612.459.9913.85
38.268.528.716.854.183.914.103.989.698.948.357.106.6312.079.6916.5711.595.458.45
46.316.348.596.313.993.683.933.776.737.545.945.935.137.719.549.8310.513.886.28
54.354.525.875.403.993.864.143.974.556.244.375.474.414.588.734.907.912.994.63
63.693.975.837.054.734.625.224.773.576.613.586.024.583.1111.644.896.692.813.86
73.322.895.606.044.054.024.264.262.715.433.545.703.792.035.743.285.151.863.16
83.062.454.384.024.193.973.954.662.224.333.034.913.491.443.852.073.731.612.65
92.762.013.413.194.494.684.355.741.773.872.214.483.601.022.961.582.601.312.26
102.891.803.463.526.156.616.098.401.483.851.894.594.400.752.881.542.211.222.04
113.391.543.446.0812.6013.3213.0715.471.264.751.705.326.940.573.041.401.861.301.90
123.571.483.3810.7022.9523.7224.4021.681.156.271.616.5510.010.463.801.851.691.401.91
13 – 244.957.1121.9715.3016.2715.8513.9611.966.1912.8110.2515.4111.651.637.863.848.491.3812.34
25 – 360.092.066.512.110.350.090.200.181.621.072.110.910.410.170.600.102.030.004.12
37 – 480.010.840.870.320.010.000.010.010.630.120.660.090.040.030.090.010.470.001.46
49+0.000.740.120.070.000.000.000.000.690.030.760.030.010.010.010.000.110.000.88
Total100.0100.0100.0100.0100.0100.0100.0100.0100.0100.0100.0100.0100.0100.0100.0100.0100.0100.0100.0

Drug class descriptions
1 Anti-inflammatories6 Angiotensins11 Mental: anxiolytics & hypnotics16 Genitourinary
2 Asthma medications7 Calcium channel blockers12 Mental: antidepressants17 Anti-epileptics
3 Diabetes8 Cholesterol & trig13 Stomach medications18 Direct acting antivirals
4 Vasodilators9 Analgesics14 Antibiotics19 All other medications
5 ACE inhibitors10 Mental: antipsychotics15 Cancer: antineoplastics


Table C2: Distribution of drug usage per specific health condition

Health groupHealth conditionDrug class
12345678910111213141516171819All
1NHPA ArthritisRheumatoid arthritis48 . .0 . 0 .10 11 39100
Osteoarthritis63 .010 0019 11 14100
Arthritis NEC63110 . 1016 01 18100
2NHPA AsthmaAsthma .98 2100
3NHPA DiabetesDiabetes Mellitus — Type 1 . .9700 .1 . . .0 1100
Diabetes mellitus — Type 2 . .9302 110 . .0 3100
Diabetes unspecified1 .9201 .10 . .1 3100
4NHPA Heart circAtherosclerosis5 . .16 .133611 . .2 26100
Fluid problems NOS1 .01 . .0 . . 98100
Varicose veins9 . . .1 . .14 .4 . 72100
Haemorrhoids . . . . . . .4 . . . 96100
Other dis circulatory system10 .1024280470 . . 8100
Hypertension000202702502000 25100
Heart disease00034902217000 26100
Stroke2 . .1021318131 . . . 23100
Ill-def symp heart cond1 .025901815000 40100
Cerebrovasc dis9 . . . .29 . .11 . . . 51100
5NHPA MentalNerves tension nervousness 114339 8100
Other mental disorders 9574 11100
Depression 12969 10100
Psychoses 601115 14100
Emotional problems NEC 341444 8100
Body image & eating disorders 100100
Alcohol and drug dependence . . . . .59 6 35100
Mental ret delays devt . . . . . .15 79 6100
6NHPA CancerSkin cancer 7 92.5 100
Breast cancer 0 100 100
Neoplasms NEC 21 51 73.6 100
7NHPA Injur poisComplic surgical NEC11 .20 1 .13 .34 59 16100
Fractures181 . . . . .53 .50 17 5100
Disloc sprains and strains50 . . . . 1 .30 .71 8 2100
Internal injuries11 . . . . . .37 .00 41 11100
Open wounds0 . . . . . .12 .00 70 19100
Bruising and crushing23 . . . . . .43 . . . 27 7100
Entry of foreign bodies0 . . . . . .5 . . . 75 20100
Burns and scalds0 . . . . . .14 . . . 68 18100
Poisoning other than by food0 . . . . . .0 . . . 79 21100
Other injuries02 . . . 1310 .0 . 66 18100
Injuries type not stated100 . . . . . .0 . . . 0 0100
8Muscoskel sysSciatica46 . . . . .38 .80 8100
Dis of the interver disc29 . . . . .51 .64 11100
Back problems (unspecified)35 . .0 . .46083 7100
Other dis musculoskel32 .1 1 .19043 40100
Curvature of spine32 . . . .53 .015 0100
Osteoporosis10 . . . .6 .10 83100
Rheumatism48 . . .6 .311 .00 32100
Absence of limbs or parts0 . . . . . .19 .00 81100
Musculoskeletal deformities39 . . . . . .30 .30 28100
9Other endocrineThyroid disease 100100
Gout150 .00 0 .2 .0 . 82100
Obesity . . . . . .23 . . . 95100
Oth endocrine and imm00000 010000 98100
High blood sugar . .91 . . . . . . . . 9100
High cholesterol . .00110971 . . . 1100
10Respirat sysBronchitis/ Emphysema .66 1 . 0 .0 .00 17 016100
Sinusitis052 . . . . .30 . . 22 121100
Cough or sore throat019 . . . . .3 . . . 39 137100
Other dis respiratory system024 . .1 1 .200 . 36 134100
Common cold .12 . . . . .8 . . . 41 139100
Hayfever .49 . . . . .1 .00 25 124100
Influenza .8 . . . . .4 . . . 45 142100
11Visual distBlindness not corr glasses20 . .1 . . . . . . 79100
Other dis eye and adnexa .2 .3 0 .2 . . . 60 133100
Visual disturbances . . .2 . . . .13 . 85100
Cataracts . . .8 . . . . . . 92100
Glaucoma . . .27 1 .0 . . . 72100
Hypermetropia/Far-sighted . . . . . . . . . . 100100
Myopia / Short-sighted . . . . . . . . . . 100100
Presbyopia . . . . . . . . . . 100100
12Ear & mastoidOtitis media .1 . . . . .1 .0 . 62 134100
Deafness (complete/ partial) . . . . . 48 . . . . . 34 18100
Ear pain32 . . . . .15 . . . 51 128100
Oth dis ear & mastoid proc .1 .1 . 12 .1171 50 127100
13Nerv sysEpilepsy0 . .0 . . . .051 93 100
Other dis nervous system16 . . . . . .191115 48100
Migraine3 . .9 . 2 .30014 50100
Paralysis . . . . . . .141210 . 64100
Oth hered dis nerv sys1 . .11 2 .7 .75 76100
14Infectious disHerpes . . . . . . . . . .2 98 100
Tinea . . . . . . . . . . . 100100
Other infectious dis13 . . . . .2 . .2 92100
15Digestive sysDiarrhoea enteritis . . . . . .12 .0075 219100
Ulcer00 .0 . 0 .0 . .04049 10100
Hernia . . .0 . 0 .2 . .1 96100
Constipation . . .13 . . . . .177 19100
Dental problems22 . . . . .24 .1 . 72100
Other dis digestive system1 . .00 104011 92100
16Genito-urinaryKidney diseases10 .32 113 . .1 89 100
Other dis urinary system . .101 0 . . .17 76 410100
Other dis genital system31 .0 . 0 .5 .11 85 4 100
Disorders of menstruation6 . .0 . . .2 .01 88 4 100
17Skin subcut tissSkin rash NOS . . . . . . .0 . . . 100100
Eczema dermatitis01 . . . . . .000 99100
Acne . . . . . . . . . . . 100100
Oth dis skin and subcut tiss0 . . . . 0 .2 .00 889100
Psoriasis01 . . . .00 .1 . 98100
18Dis of the bloodDiseases of blood2 . . . . 3 . . . . . 95100
19Complic chldbrthComplic of pregnancy etc .13 . . . . . . . . . 69 18100
20Oth symptomsAllergy NEC133 . . . . .1 .11 64100
Insomnia0 . .0 . . .317516 4100
Pyrexia4 . . . . . .21 . . . 25 25 25 100
Localised swelling27 . . . . . . . . . . 73100
Difficulty breathing .51 .2111551 . .1 . 15100
Chest pain98 .23 .1512 .17 . .2 15100
Abdominal pain7 . .1 . 1 .14 . . .77 100
Heartburn2 . . . . . . . . . .98 100
Dizziness . . . . . 10 .102 .4 75100
Headache due to stress . . . . . . .48 .23 . 28100
Headache unspec or trivial40 .1 . 0 .86002 5100
Virus14 . .0 . .12 . . . 83 100
Oth symp ill-defined cond23 .30 019155 71100
21PreventiveCheckup/ examination8 .5 .2 . . . . .4 81100
Contraceptive management . . . .0 . . . .1 . 99 100
Counselling . . . . . . . . . . . 100100
Immunisation . . . .8 . . . . . . 92100
22CongenitalCongenital anomalies21 . . .2 . .10 . . . 67100
23DisabilitySpeech impediment NEC .29 . . . . . . .71 . 0100
Blackouts loss of cons NEC . . . . . . . . .42 . 58100
Missing organs NEC .49 . . . . . . . . . 51100
Due to rounding, totals do not always add up to 100.
Source: NATSEM estimates using 1995 NHS.


Table C3: Distribution of persons by concession card status and age: actual vs. model estimates (percent)

Medicare Australia 2003Model 2003-04% Difference
ConcessionalGeneralConcessionalGeneralConcessionalGeneral
All100100100100
0-4152600
5-9252600
10-1425350-1
15-1946470-1
20-24454501
25-29646400
30-34857410
35-39859500
40-44115135-20
45-49135154-21
50-5415415400
55-5914511640
60-64876720
65-69292101-1
70-74191900
75+11611402


Table C4: Average scripts per person by concession card status, gender and age group: actual vs. model estimates

Medicare Australia 2003Model 2003-04% Difference
GenderAge groupConcessionalGeneralConcessionalGeneralConcessionalGeneral
All21.59.621.98.7-210
Males0-44.22.54.42.6-5-2
5-94.12.74.42.8-7-4
15-245.13.85.43.4-612
25-3910.15.610.04.9113
40-6422.113.022.911.1-317
65 +35.626.235.418.6141
Females0-43.72.54.02.5-8-1
5-93.52.63.92.6-10-3
15-245.83.65.73.327
25-3910.05.29.54.7512
40-6424.610.824.010.136
65 +41.719.541.719.80-1


Table C5: Average no. of scripts by concession card status and drug class: actual vs. model estimates

Medicare Australia 2003Model 2003-04
ConcessionalGeneralConcessionalGeneral
Ave. no. scripts per person21.59.621.98.7
No. of drugs classes per person3.41.93.51.7
Ave. no. scripts/person/drug6.35.26.35.2
1 Anti-inflammatories4.63.14.63.1
2 Asthma medications6.53.36.53.3
3 Diabetes10.75.610.75.6
4 Vasodilators8.34.68.34.6
5 ACE inhibitors9.58.29.58.2
6 Angiotensins9.48.59.48.5
7 Calcium channel blockers9.37.79.37.7
8 Cholesterol & trig. reducers9.48.09.48.0
9 Analgesics5.05.35.05.2
10 Antipsychotics6.95.86.95.7
11 Anxiolytics & hypnotics6.13.16.13.1
12 Antidepressants7.56.47.56.4
13 Stomach medications7.05.27.05.2
14 Antibiotics2.92.32.92.3
15 Cancer: antineoplastics5.75.85.75.8
16 Genitourinary3.92.73.92.7
17 Anti-epileptics6.15.26.15.2
18 Direct acting antivirals2.32.72.32.7
19 All other medications7.84.47.84.4

* References

ABELLO, A., and Brown, L. (2007). Model 18: MediSim (Static Microsimulation Model off the Australian Pharmaceutical Benefits Scheme) In Modelling our Future: Population Ageing, Health and Aged Care, Gupta, A. and Harding, A. (Eds), Elsevier, Amsterdam, International Symposia in Economic Theory and Econometrics, Volume 16, pp. 533-542.

AUSTRALIAN BUREAU OF STATISTICS (2001a) Income Distribution, Australia, Catalogue no. 6523.0, Canberra.

AUSTRALIAN BUREAU OF STATISTICS (2001b) Government Benefits, Taxes and Household Income, Australia, ABS Catalogue No. 6537.0, Australian Bureau of Statistics, Canberra.

AUSTRALIAN BUREAU OF STATISTICS (2003a) National Health Survey: User's Guide, 2001, Catalogue No. 4363.0.55.001, Canberra.

AUSTRALIAN BUREAU OF STATISTICS (2003b) Occasional Paper: Long-term Health Conditions — A Guide to Time Series Comparability from the National Health Survey, Australia (ABS Catalogue no. 4816.0.55.001).

AUSTRALIAN BUREAU OF STATISTICS (1996) National Health Survey User's Guide, Australia, 1995, Catalogue no. 4363.0.

AUSTRALIAN INSTITUTE OF HEALTH AND WELFARE (2006) Health Inequalities in Australia: Morbidity, Health Behaviour, Risk Factors and Health Service Use, Canberra, Australia.

BARR, RS and Turner, JS (1978) 'A new, linear programming approach to microdata file merging', 1978 Compendium of Tax Research, Office of the Treasury, Washington, D.C.

BARR, RS, Stewart, WH and Turner, JS (1982) 'An Empirical Evaluation of Statistical Matching Strategies', mimeograph, Edwin L. Cox School of Business, Southern Methodist University, Dallas, Texas.

BRITT, H, Miller, G C, Knox, S, Charles, J, Valenti, L, Pan, Y, BROWN, L, Abello, A and Harding, A (2006) Which Australian Families Benefit from the Australian Pharmaceuticals Benefit Scheme's Safety Net?, Agenda, 13(3), pp. 211-224.

BROWN, L (2005a) "Distributional Impacts of the Pharmaceutical Benefit Scheme's Safety Net", Presented at the Australia Health Economist's Conference 29-30th of September 2005, Auckland.

BROWN , L (2005b) "Distributional Impacts of the PBS in 2005-06: An Investment in Australian Families", The 3rd Annual Conference on The Future of the Pharmaceutical Benefits Scheme, 24-25 August 2005, Sydney

BROWN, L and Harding, A (2005) 'The new frontier of health and aged care', Ch. 10. in Quantitative Tools for Microeconomic Policy Analysis, Conference Proceedings, Canberra, 17-18 November 2004, Productivity Commission, Canberra.

BROWN, L and Harding, A (2002) Social Modelling and Public Policy: Application of Microsimulation Modelling in Australia. Journal of Artificial Societies and Social Simulation, 5 (4) 6 https://www.jasss.org/5/4/6.html

COHEN, M (1991) 'Statistical matching and microsimulation models'. In Citro, C F and Hanushek, E A (eds), The Uses of Microsimulation Modelling, Review and Recommendations, vol. 1, National Academy Press, Washington

COMMONWEALTH DEPARTMENT OF THE TREASURY (2005) Budget Strategy and Outlook 2005-06, Budget Paper No. 1, Treasury, Commonwealth of Australia, May.

CREEDY, J (2001) Tax modelling. Economic Record, 77 (237), pp. 189-202.

GUPTA, A (2007) 'Pharmasim Model', in Gupta, A and Harding, A (eds.). Modelling Our Future: Population Ageing, Health and Aged Care, International Symposia in Economic Theory and Econometrics, vol. 16, Amsterdam, Elsevier B. V.

HARDING, A and Gupta, A (2007) 'Introduction and Overview', in Harding, A and Gupta, A. (eds), Modelling Our Future: Population Ageing, Social Security and Taxation, International Symposia in Economic Theory and Econometrics, vol. 15, Elsevier B. V., Amsterdam, pp. 1-29.

HARDING, A, Abello, A, Brown, L and Phillips, B (2004) The Distributional Impact of Government Outlays on the Australian Pharmaceutical Benefits Scheme in 2001-02, Economic Record, 80 (Special Issue) S83-S96.

HARDING, A, Percival, R, Schofield, D, and Walker, A (2002) The lifetime distributional impact of government health outlays, Australian Economic Review, 35(4), pp.363-379.

MAYNARD, A and Bloor, K (2003), Dilemmas in regulation of the Market for Pharmaceuticals, Health Affairs, vol. 22:3 pp.31-41.

MEDICAL NEWS TODAY (2006), Share of pharmaceutical spending in total healthcare expenditure remains high across most EU countries', 30 Feb 2006, http://www.medicalnewstoday.com/articles/37057.php

MOISE, P and Docteur, E (2007) Pharmaceutical Pricing and Reimbursement Policies in Sweden, Health Technical Paper no. 28, OECD.

MORIARTY, C and Scheuren, F (2001) 'Statistical Matching: Pitfalls of Current Procedures', in Proceedings of the Annual Meeting of the American Statistical Association, August 5-9, 2001.

NGUYEN, L and A. Gupta (2007) 'A Microsimulation Model to Evaluate Hypothetical Drug Plans', Abstract of paper to be presented at the 1st General Conference of the International Microsimulation Association, Vienna, 20-22 August 2007 (available from http://www.euro.centre.org/ima2007/Submissions.pdf)

PARIS, V. and Docteur, E. (2006) 'Pharmaceutical Pricing and Reimbursement Policies in Canada', Health Technical Paper no. 24, OECD.

PERCIVAL, R, Abello, A and Vu, Q N (2007) 'STINMOD (Static Incomes Model), in Gupta, A. and Harding, A. (eds.), Modelling Our Future: Population Ageing, Health and Aged Care, International Symposia in Economic Theory and Econometrics, vol. 16, Amsterdam, Elsevier B. V.

OECD Health Data (2007) http://www.oecd.org/health/healthdata

OECD (2005) http://www.oecd.org/document/25/0,2340,en_2649_201185_34967193_1_1_1_1,00.html

OECD OBSERVER (2003), 'Bitter Pill', January 2004, No. 240/241 December 2003 http://www.oecdobserver.org/news/fullstory.php/aid/1171/Bitter_pill.html

RADNER, D B, Allen, R, Gonzalez, M E, Jabine, T B and Muller, H J (1980) "Report on Exact and Statistical Matching Techniques," Statistical Policy Working Paper 5, U.S. Government Printing Office.

RASSLER, S (2002) Statistical Matching: A Frequentist Theory, Practical Applications, and Alternative Bayesian Approaches, Springer-Verlag.

RODGERS, W (1984) An Evaluation of Statistical Matching, Journal of Business and Economic Statistics, vol. 2, No. 1, January 1984.

SUTHERLAND, H (2007) 'EUROMOD — The Tax-Benefit Microsimulation Model for the European Union, in Gupta, A and Harding, A (eds.). Modelling Our Future: Population Ageing, Health and Aged Care, International Symposia in Economic Theory and Econometrics, vol. 16, Amsterdam, Elsevier B. V.

SUTHERLAND, H, Taylor, R and Gomulka, J (2002) Combining household income and expenditure data in policy simulations, Review of Income and Wealth, vol. 48:4, pp. 517-536.

TAYLOR, R, Gomulka, J and Sutherland, H (2000) Creating Order out of Chaos? Identifying Homogeneous Groups of Households across Multiple Datasets, paper presented at the 26th General Conference of the International Association for Research in Income and Wealth, Cracow, Poland, 27 August to 2 September.

TECHNICAL WORKING GROUP ABS-NATSEM COLLABORATION ON STATISTICAL MATCHING (2004) Statistical Matching of the HES and NHS: An Exploration of Issues in the Use of Unconstrained and Constrained Approaches in Creating a Basefile for a Microsimulation Model of the Pharmaceutical Benefits Scheme, ABS Methodology Advisory Committee Paper, June 2004.

THURECHT, L, Walker, A, Harding, A and Pearse, J (2005) 'The 'Inverse Care Law', Population Ageing and the Hospital System: A Distributional Analysis', Economic Papers, vol 24:1, pp.1-17.

TURELL, G and Mathers, C (2000) 'Socioeconomic status and health in Australia', Medical Journal of Australia, vol 172, pp.434-438.

WALKER, A (2000) Distributional impact of higher patient contributions to Australia's Pharmaceutical Benefits Scheme, Australian Health Review, vol. 23:2, pp. 32-46.

WALKER, A and Abello, A (2000) Changes in the Health Status of Low Income Groups in Australia, 1977-78 to 1995, Discussion Paper no. 52, National Centre for Social and Economic Modelling, University of Canberra

WALKER, A, Abello, A and Harding, A (2000) 'The impact of demographic and other changes on expenditure on pharmaceutical benefits in 2020 in Australia', in Mitton, L, Sutherland, H and Weeks, M (eds), Microsimulation Modelling for Policy Analysis: Challenges and Innovations, Cambridge University Press, pp. 149-71.

WALKER A, Pearse, J, Thurecht, L and Harding, A. (2006) 'Hospital admissions by socio-economic status: does the 'inverse care law' apply to older Australians?' Australian and New Zealand Journal of Public Health, vol 30:5, pp.467-473.

WOODWARD, M (2005), Epidemiology: Study Design and Data Analysis, Chapman & Hall/CRC Press, pp. 12-13.

YOSHIZOE, Y and Araki, M (1999) Use of statistical matching for household surveys in Japan. In 52nd Session of the International Statistical Institute, Helsinki, Finland

----

ButtonReturn to Contents of this issue

© Copyright Journal of Artificial Societies and Social Simulation, [2008]