
Dmytro Tykhonov, Catholijn Jonker, Sebastiaan Meijer and Tim Verwaart (2008)
Agent-Based Simulation of the Trust and Tracing Game for Supply Chains and Networks
Journal of Artificial Societies and Social Simulation
vol. 11, no. 3 1
<https://www.jasss.org/11/3/1.html>
For information about citing this article, click here
Received: 09-Jul-2007 Accepted: 15-Apr-2008 Published: 30-Jun-2008

 Abstract
| Table 1: Consumer satisfaction points by commodity type and quality | |||
Quality | Commodity type | ||
| Blue | Red | Yellow | |
| Low | 1 | 2 | 3 |
| High | 2 | 6 | 12 |
|
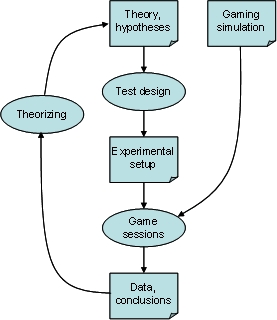
| Figure 1. The gaming cycle |
|
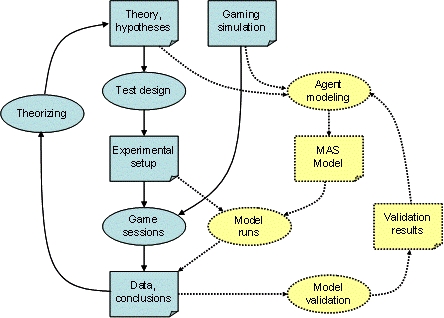
| Figure 2. The research cycle combining gaming simulation with multi-agent simulation |
Hypothesis 1: When the initial willingness to trust is high the percentage of high quality products sold is higher than when the initial willingness to trust is low.
Hypothesis 2: In a homogeneous environment with all opportunistic agents there are more cheats than with other profiles.
Hypothesis 3: In a homogeneous environment in which all agents are thrifty, i.e., who want to be certain about value for money, there are more traces than with other profiles.
Hypothesis 4: Thrifty agents buy less high quality products than opportunistic and quality-minded agents.
Hypothesis 5: In a mixed setting with opportunistic and thrifty agents, the opportunistic agents cheat less than in a mixed setting with opportunistic and quality-minded agents.
|
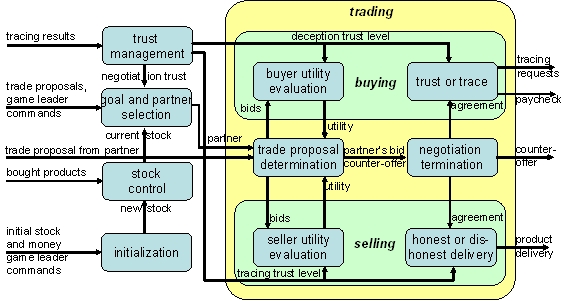
| Figure 3. Trading agent architecture |
|
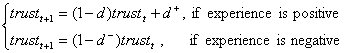
(1) |
where trustt represents trust after the t transactions. The value of trust=1 represents complete trust, trust=0 represents complete distrust, and trust=0.5 represents complete uncertainty. The model represents that the most recent experience has the strongest impact (short memory) and that negative experience may have stronger impact than a positive experience. The latter is similar to the endowment effect (Hanemann 1991). Losing trust that one thought to be endowed with has more impact than finding a partner's trustworthiness confirmed. The factors d+ and d- are impact factors of positive and negative experiences respectively. They are related by an endowment coefficient e.
|
|
(2) |
 |
(3) |
|
|
(4) |
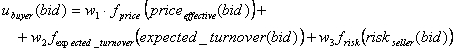
where costtransaction represents some extra cost for the buyer that depends on the type of partner. In the current simulations the value is set to zero for purchases of consumers from retailers, of retailers from middlemen, and of middlemen from producers. It is set to infinity for all other combinations, to enforce the agents to follow their role in the supply chain. In future simulations it may be varied to allow for bypassing some links. The expected turnover is the average of the agent's beliefs about the minimal and maximal future selling price of the commodity to be bought. For consumers the expected turnover is set to the satisfaction level.
|
|
(5) |
The probability of deceit is greater than zero only if the quality of the commodity quality is high and it is not certified. If these conditions are satisfied than the probability of deceit is estimated as the complement of buyer's trust in the seller.
|
|
(6) |
where q=1 if the bid suggests high quality, 0 for low quality and c=0 if the bid suggests a certified transaction, 1 without certificate.
|
|
(7) |
where
|
|
(8) |
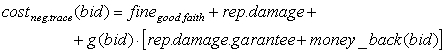
and g represents the guarantee function (5): g(bid)=1 if the bid involves a guarantee; g(bid)=0 otherwise.
|
|
(9) |
|
|
(10) |
|
|
(11) |
|
|
(12) |
where pricepurchase(bid) represents the proposed price of the anticipated transaction , pricesell,min represents seller's belief about the minimal price he may receive receive from alternative buyers (opportunity cost); costtransaction represents cost of making a transaction with the given partner, in the current simulations the value is set to zero for sales of retailers to consumer, middlemen to retailers, and of producers to middlemen (for more details, see the definition of the transaction costs in the "Buyer Model" section); costcertification represents the fee a player has to pay the tracing agency for tracing the commodity and providing a certificate, if needed.
|
|
(13) |
|
(14) |
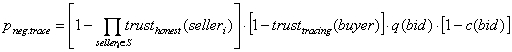
where S is the set of agents upstream in the supply chain of this particular lot; trusthonest(selleri) represents the experience-based trust the seller has in an upstream seller to deliver according to promise; trusttracing(buyer) represents the experience-based trust the seller has in its negotiation partner to accept a delivery without tracing it; q(bid)=1 if the quality is high, 0 if the quality is low; c(bid)=1 if a certificate is present or will be provided, 0 otherwise. Both trusthonest(selleri) and trusttracing(buyer) will be updated according to equation (1).
|
(15) |
where g(bid)=1 if the bids entail a guarantee, 0 otherwise.
|
|
(16) |
where the satisfaction ratio is taken from table 1.
|
(17) |
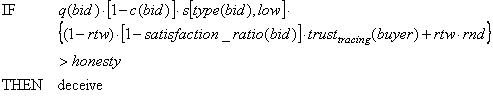
where rtw is the weight of the random term, set in the interval [0, 1]; rnd represents a uniformly distributed random real number from interval [0, 1]; function s[type(bid),low] returns 1 if the selling agent has low quality products in stock (opportunity to deceive), 0 otherwise. The temptation to deceive depends on the value ratio of low and high quality. Each agent has an honesty parameter that represents the agent's threshold for deceit.
|
|
(18) |
|
(19a) |
|
|
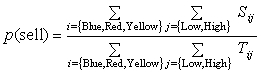
(19b) |
where Sij stands for actual stock level of product i and quality j, and Tij stands for the corresponding target level.
|
| Figure 4. Sensitivity of trust update parameters |
|
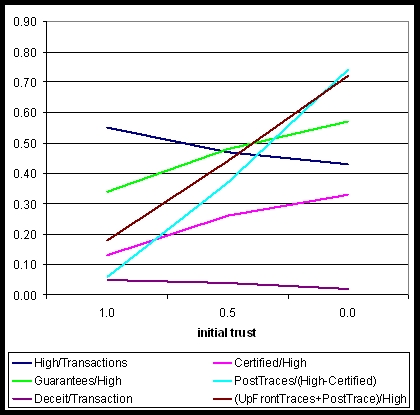
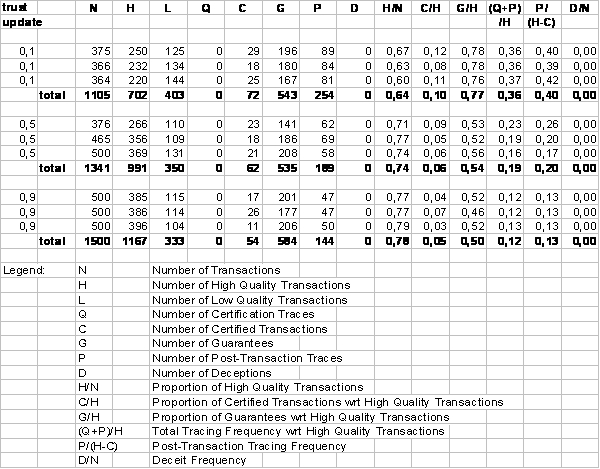
| Figure 5. Sensitivity of initial trust |
|
|
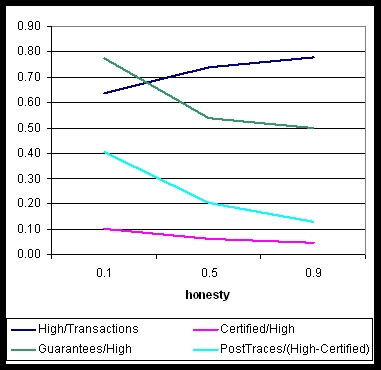
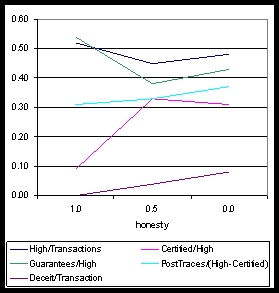
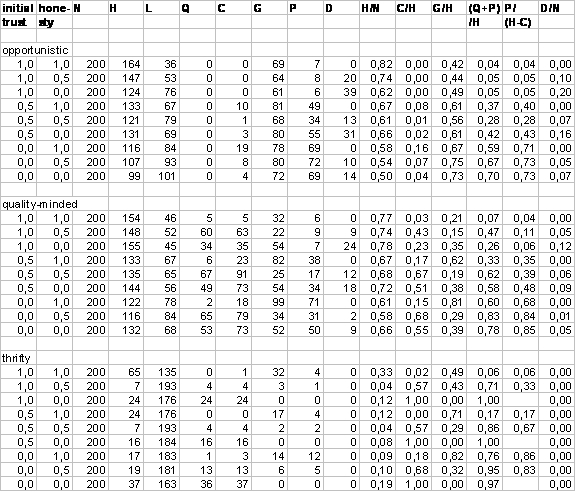
| Figure 6. Sensitivity of honesty: a — game statistics for different honesty levels, b — deceit frequency for opportunistic, quality-minded and thrifty agent for different honesty levels | |
|
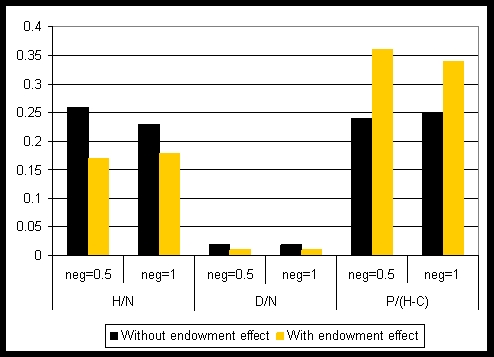
| Figure 7. Sensitivity of endowment effect |
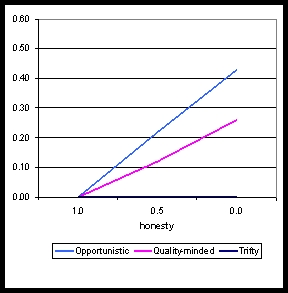
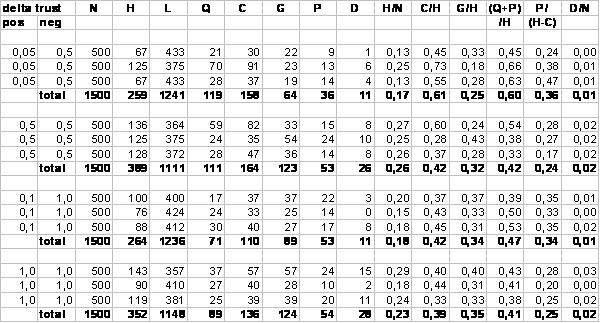
Hypothesis 1 is directly confirmed by the data in Figure 5: The aggregated statistics of games with initial trust set to zero, 0.5, and 1.0 show an increasing trend for the proportion of high quality transactions (H/N=0.43, 0.47, and 0.55, respectively).
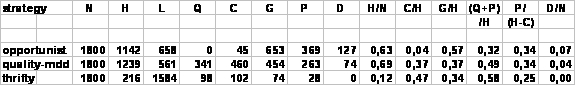
For the purpose of testing the remaining hypotheses, the results from Table A2 are aggregated per strategy in Table A6.
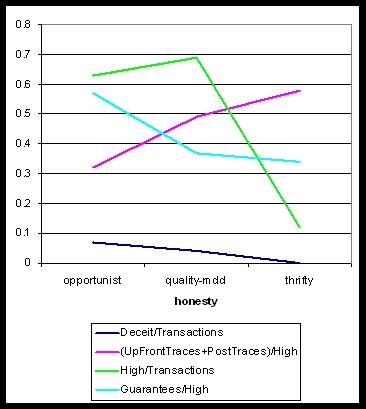
Hypothesis 2 is confirmed by the results: D/N=0.07 for the opportunists, 0.04 for the quality-minded, and 0.00 for the thrifty agents, the latter simply giving little opportunity for deceit (Figure 8). Thrifty agents prefer low quality unless they can get certified or guaranteed high quality products for a very good price. Quality-minded agents prefer to avoid the risk of deceit by trading certified products, thus reducing the possibility of deceit at the cost of up-front tracing, but unlike the thrifty agents they will buy high quality even if a risk remains. Opportunistic agents prefer high quality and in addition they prefer a good price over certainty. In the buyer role they take an increased risk of being deceived; in the seller role they are easily tempted to deceive. As a consequence deceit occurs most frequently in games with opportunists.
Hypothesis 3 is confirmed by the results for (Q+P)/H in Figure 8 (i.e., the sum of up-front and post-transaction tracing requests relative to the number of high quality transactions). The absolute number of traces is low in games with thrifty agents, because they trade little high-quality products (column H/N in Table A6). However, relative to the number of high quality transactions, they have the highest tracing level. The tracing frequencies found in simulated games with quality-minded agents are not as high as for thrifty agents, but relatively high compared to the opportunists, due to up-front tracing in order to certify products before selling them. This increases price, but the quality-minded are willing to pay for the certainty that comes with it.
Hypothesis 4 is confirmed by the detailed data in column (Q+P)/H of Figure 5 (the aggregation level of Figure 8 does not give sufficient information to compare with hypothesis 4). The proportion of high-quality transactions is less sensitive for trust in the quality-minded games than it is for the other strategies. The quality-minded prefer high quality and if they distrust they likely compensate the risk by either up-front or post-transaction tracing (high values of (Q+P)/H and P/(H-C) in the lower rows for quality-minded in Table A3). They are prepared to pay a higher price to reduce uncertainty.
|
| Figure 8. Sensitivity of strategies |
Opportunists also trade many high-quality products, but they pay for it in a different way. They accept the risk of deceit more easily. This is an effect of the low weight of risk evaluation in their utility functions that makes opportunist negotiate about price or potential profits. The latter makes them trade more high-quality products. Opportunists agree to trade with a money-back guarantee (column G/H) more often than agents with other strategies, that prefer a certificate (column G/H). This is due to lower cost of guarantees with respect to certification and the low weight of risk evaluation in the negotiation models of opportunists.
Agents following a thrifty negotiation strategy prefer to pay a low price, so they will not easily agree on buying with certificates or guarantees. In addition, they avoid the risk of being deceived. This results in a low ratio of high quality products (H/N) being traded.
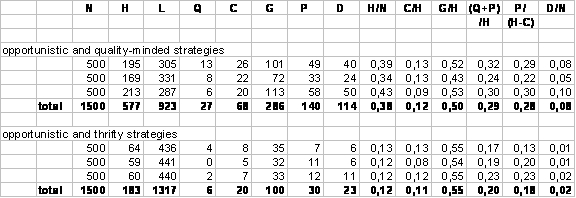
The simulation results presented so far concerned games with homogeneous agent populations. Hypothesis 5 is about games with differently configured agents in the same game.
This hypothesis reflects observations of human simulation games that reveal extreme values of deceit frequency between games with mixed populations of opportunists and quality-minded on the one extreme and games with mixed populations of opportunists and thrifty agents on the other extreme. Figure 9 (see also Table A7) presents statistics of simulated games populated with agents with different strategies. Some agents were configured to follow an opportunistic strategy. The others were following a quality-minded strategy in the first series of games, and a thrifty strategy in the second series of games. The simulation statistics confirm hypothesis 5: much deceit in the first series (D=114), little deceit in the second series (D=23), although all agents are configured as dishonest.
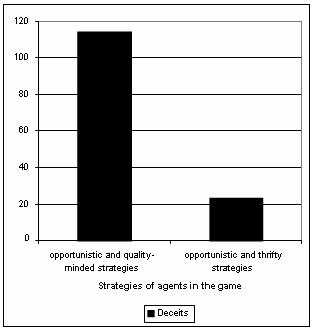
|
| Figure 9. Deceits in games with mixed strategies |
|
| Table A1. Statistics of simulated games with varying values of trust update. Positive trust update=negative trust update; strategy neutral; initial trust 0,5; initial and minimal honesty 1.0; confidence 0.95. |
|
| Table A2. Statistics of simulated games with varying values of initial trust and honesty for different negotiation strategies. Minimal honesty=initial honesty; positive trust update=0.3, negative trust update=1.0; confidence=0.95. Tables 5, 6, and 7 present aggregated views of the data. |
|
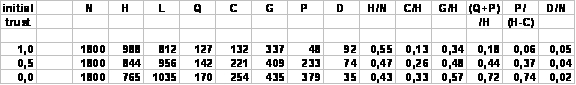
| Table A3. Aggregated statistics of 3×9 simulated games with varying values of initial trust the ratios H/N, … ,D/N are calculated on the rows of the table, so they are a weighted average of the ratios in table A2, applying the ratio's denominator as weight factor |
|
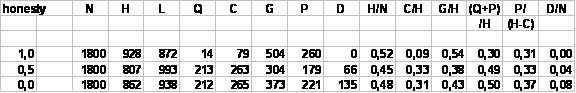
| Table A4. Aggregated statistics of 3×9 simulated games with varying values of honesty (minimal honesty and initial honesty both set equal to the value in the first column). |
|
| Table A5. Statistics of simulated games with varying values of trust update. Strategy=neutral; initial trust=0,5; initial and minimal honesty=1.0; confidence=0.95. |
|
| Table A6. Aggregated statistics of 3×9 simulated games with different strategies defined in section 5. |
|
| Table A7. Statistics of simulated games with different mixed strategies. Minimal honesty=intitial honesty=0.5; initial trust=0.5; positive trust update=0.3, negative trust update=1.0; confidence=0.95. |
BOSSE, T., and Jonker, C.M. (2005). Human vs. Computer Behaviour in Multi-Issue Negotiation", Proceedings of the 1st International Workshop on Rational, Robust, and Secure Negotiations in Multi-Agent Systems, IEEE Computer Society Press, pp. 11-24.
BURGOON, J.K., Stoner, G.M., Bonito, J.A., and Dunbar, N.E. (2003). Trust and Deception in Mediated Communication. Proceedings of the 36th Annual Hawaii International Conference on System Sciences (HICSS'03) - Track1, p.44.1.
CAMPS, T., Diederen, P., Hofstede, G. J., and Vos, B. (eds.) (2004). The emerging world of Chains and Networks, Reed Business Information.
CASTELFRANCHI, C., and Falcone, R. (2001). Social Trust: A Cognitive Approach, C. Castelfranchi, Y.H. Tan (eds.), Trust and Deception in Virtual Societies, Kluwer Academic Publishers, pp. 55 — 90.
CASTELFRANCHI, C., and Falcone, R., and de Rosis, F. (2001). Deceiving in GOLEM: How to strategically pilfer help. C. Castelfranchi and Y.H. Tan, Trust and Deception in Virtual Societies, Kluwer, pp. 91-110.
DIEDEREN, P.J.M., and Jonkers, H.L. (2001). Chain and Network Studies. KLICT paper 2415, 's Hertogenbosch, The Netherlands.
DRUCKMAN, D. (1994). The educational effectiveness of interactive games. D. Crookall and K Arai, Simulation and gaming across disciplines and cultures, ISAGA.
DE ROSIS, F., Castelfranchi, C., Carofoglio, V., Grassano, G. (2003). Can Computers deliberately deceive? Computational Intelligence 19:215-234.
DUKE, R.D., and Geurts, J.L. (2004). Policy games for strategic management, pathways into the unknown, Dutch University Press, Amsterdam.
GRANDISON, T., and Sloman, M. (2000). A Survey of Trust in Internet Applications, IEEE Communications Surveys.
HANEMANN, W. M. (1991): Willingness to Pay and Willingness to Accept: How Much Can They Differ?. The American Economic Review, Vol. 81, No. 3, pp. 635-647.
HOFSTEDE, G., and Hofstede, G. J. (2005). Cultures and Organizations: Software of the Mind. Third Millennium Edition. New York: McGraw-Hill.
HOFSTEDE, G.J., Spaans, L., Schepers, H., Trienekens, J., and A. Beulens (eds) (2004). Hide or confide: the dilemma of transparency. Reed Business Information. ISBN 90 5901 374 3
JONKER, C.M., Meijer, S., Tykhonov, D., and Verwaart, T. (2005). Modelling and Simulation of Selling and Deceit for the Trust and Tracing Game. C. Castelfranchi, S. Barber, S. Sabater, & M. Singh (Eds.), Proceedings of the Trust in Agent Societies Workshop, pp. 78-90.
JONKER, C.M., Meijer, S., Tykhonov, D., and Verwaart, D. (2005). Multi-Agent Model of Trust in a Human Game. P. Mathieu, B. Beaufils, & O. Brandouy (Eds.), Artificial Economics, A Symposium in Agent-based Computational Methods in Finance, Game Theory and their Applications, AE2005, pp. 91-102. (Lecture Notes in Economics and Mathematical Systems, 564).
JONKER, C.M., and Treur, J. (1999). Formal analysis of models for the dynamics of trust based on experiences. F.J.Garijo, M.Boman (eds.), Proceedings of MAAMAW'99, LNAI 1647, pp. 221 — 232.
JONKER C.M., and Treur, J. (2001). An agent architecture for multi-attribute negotiation. B. Nebel (ed.), Proceedings of the 17th Int. Joint Conf. on AI, IJCAI '01, pp. 1195 — 1201.
JØSANG, C., and Presti, S. (2004). Analysing the Relationship between Risk and Trust. C.Jensen, S.Poslad, T.Dimitrakos (eds.): Trust Management, Proceedings of iTrust 2004, LNCS 2995, pp. 135 — 145.
LAZZARINI, S.G., Chaddad, F.R., and Cook, M.L., (2001). Integrating supply chain management and network analysis: the study of netchains, Journal on Chain and Network Science, Nr. 1, pages 7 — 22.
MCCONNELL, C. R., Brue. S. L. (2001) Economics, McGraw-Hill Companies.
MEIJER. S., and Hofstede, G.J. (2003). The Trust and Tracing game. Proceedings of 7th Int. workshop on experiential learning. IFIP WG 5.7 SIG conference, Aalborg, Denmark.
MEIJER, S., and Hofstede, G. J. (2004). Simulations and simulation games in the agro and health care sector. KLICT working paper TR-214, Den Bosch, The Netherlands.
MEIJER, S., Hofstede, G.J., Beers, G. and Omta, S.W.F. (2006). Trust and Tracing game: learning about transactions and embeddedness in a trade network. Production Planning & Control, Vol. 17, No. 6, September 2006, 569-583
MEIJER, S., and Verwaart, T. (2005). Feasibility of Multi-agent Simulation for the Trust-and-Tracing Game. M. Ali and F. Esposito (Eds.), Innovations in Applied Artificial Intelligence, Proceedings of IEA/AIE 2005, LNAI 3533, pp. 145-154.
MOSS, S., and Edmonds, B. (2005). "Sociology and Simulation: Statistical and Qualitative Cross-Validation", American Journal of Sociology, 110(4), January 2005.
RAMCHURN, S. D., Hunyh, D., and Jennings, N.R. (2004). Trust in Multi-Agent Systems, Knowledge Engineering Review.
POWELL, W.W. (1993). Neither market nor hierarchy: network forms of organization. Research in Organizational Behavior, vol. 12, pp. 295-336.
VAN LIERE, D.W., Hagdorn, L., Hoogeweegen, M.R., and Vervest, P.H.M. (2004). The business networking game — an experimental research tool for analysing modular business network structures. Hofstede, G.J.; S. Meijer; J.O. Riis; R. Smeds (eds) Proc. of the 8th international workshop on experimental learning in chains and networks, IFIP WG 5.7 SIG conference, Wageningen, The Netherlands.
WARD, D, and Hexmoor, H. (2003). Towards Deception in Agents. Proc. of AAMAS '03.
WILLIAMSON, O.E. (1985). The Economic Institutions of Capitalism. Free Press, New York.
WILLIAMSON, O.E. (1998). "Transaction Cost Economics: How it Works, Where it is Headed", De Economist, Vol. 146, No. 1, pp. 23-58
ZUNIGA-ARIAS, G., Meijer, S., Ruben, R. and Hofstede G. J. (2006). Bargaining power in mango supply chains: an experimental gaming approach. Proceedings of the 7th International Conference on Management in AgriFood Chains and Networks 2006, Ede, Holland.
 Return to Contents of this issue
© Copyright Journal of Artificial Societies and Social Simulation, [2008]