©Copyright JASSS

JASSS logo ----

Sergi Lozano and Alexandre Arenas (2007)

A Model to Test How Diversity Affects Resilience in Regional Innovation Networks

Journal of Artificial Societies and Social Simulation vol. 10, no. 4 8
<https://www.jasss.org/10/4/8.html>

For information about citing this article, click here

Received: 02-Mar-2007    Accepted: 24-Jun-2007    Published: 31-Oct-2007

PDF version


* Abstract

Research about resilience on complex systems has been commonly addressed from a structural point of view, relating this concept to the preservation of the connectivity against the suppression of individual nodes or individual links. This perspective coherently encompasses the analysis of resistance of networked infrastructures to structural damage (e.g. power grids, roads and communication networks) but not necessarily other scenarios (e.g. socio-ecological systems). Here we associate the resilience concept to the capability of a social organization to keep acceptable levels of functionality against external socio-economic disrupting factors that do not imply necessarily destruction of existing links. As a particular case of study, we show how diversity of the organizational characteristics improves resilience of regional innovation systems to uncertain socio-economic situations. Particularly speaking, we will deal with models where network structure is as important as the diversity of behaviours in agents decisions. We reanalyze the conclusions of a classical text about regional development (Saxenian 1994), comparing the evolution of two industrial districts (Silicon Valley and Boston's Route 128), by first making a qualitative analogy in terms of resilience and, second, building up a simplified model of innovation systems that supports quantitatively our argumentation. The methodology presented in this paper, based on a simple network model designed from the qualitative conclusions of previous works about industrial networks, allows us to translate abstracted theoretical evidences on networks in more specified scenarios, and can contribute fruitfully to this line of research.

Keywords:
Resilience, Diversity, Complex Networks, Innovation Systems

* Introduction

1.1
The most common conception of 'resilience', borrowed from Material Science, defines it as the property of a material to return to its original shape after a deformation below a certain elastic limit (Webster's online dictionary). However, in the literature about adaptive complex systems, this concept names also the capability of a system to remain in a particular state (defined by a certain kind of functionality) after an external disturbance, by any self-organization process. Such a definition, that relates resilience with the interplay between dynamics and system's structure, makes this concept especially interesting for scholars involved in the study of all kind of complex systems, ranging from ecological to economical and other sorts of social systems. In particular, it has been a key concept in the analysis of complex systems from the theory of complex networks.

Extending the concept of resilience in complex networks

1.2
Within the theory of complex networks, the concept of resilience has been associated to the network robustness to the removal of their vertices. More precisely, it has been assimilated to the capability to keep large connectivity levels after vertices removal that account for random failures or intentional attacks (Albert et al 2000; Newman 2003; Costa 2004). Other scientists have deepened on the dynamical consequences of node elimination, for example, congestion of traffic dynamics (Moreno et al 2003), avalanches of failures (Motter and Lai 2002,Crucitti et al 2004), or reorganization of connected elements into particular structures (Jain and Krishna 2002). This perspective has limited the applicability of these results to particular scenarios where connectivity is the most important factor to take into account.

1.3
However, the concept of resilience has a wider meaning in other fields also related to complex networks beyond these ones. Actually, 'resilience' is a common concept in ecology, where we can find many works that study the resilience of certain ecosystems to disruptions on their environmental conditions (Holling 1973; Westman 1978) by climate changes or pollution (Gunderson 2000), for example. In social systems, the following definition of resilience, proposed by the International Strategy for Disaster Reduction of the United Nations: The capability of a system, community or society potentially exposed to hazards to adapt, by resisting or changing in order to reach and maintain an acceptable level of functioning and structure. (ISDR 2006), is a good example of the evolution of the concept. Related to this, an interesting approximation to the resilience of social systems is led by the Resilience Alliance, a research organization comprised of scientists and practitioners interested on the dynamics of social-ecological systems (RA 2006). These scholars propose the application of research results about resilience in ecological systems to different social issues (specially, but not exclusively, to management of natural resources) (Berkes et al 2003; Bodin 2006).

1.4
According to the wide applicability of the concept of resilience, we propose to enrich the study of resilience of complex systems with new perspectives, beyond the purely structural ones. On one side, we can take into account other sort of external perturbations (apart from the removal of vertices) on the system. On the other hand, we can analyze the influence of these external perturbations on its functionality, and explore how certain (not necessarily structural) system properties or mechanisms can improve the system's resilience against these effects.

Diversity as a resilience factor of socio-economical systems

1.5
Diversity (understood, in a wide sense, as heterogeneity of perspectives, behaviours, characteristics, profiles, etc.), is one of these properties that are able to enhance system's resilience to certain external changes. Natural systems provide us with a nice example to support this claim: Biodiversity (usually in combination with other characteristics like, for instance, complex patterns of relationships between individuals and species) is known to improve ecosystem's resilience to changes on their environment (Peterson et al 1998). On the other hand, there are also valuable examples of resilience enhancement by diversity in different social complex systems for instance, stock markets, where people tend to diversify their investments in order to minimize risk to unexpected changes.

1.6
In agreement with the idea that variety can contribute to the resilience enhancement of different social systems, in this work we have studied how the introduction of heterogeneity into certain organizational characteristics of nodes can improve the resilience of networked social systems to confront uncertain socio-economic environments.

1.7
The inspiration of our work is a classical case of study in the literature about regional innovation scenarios (Saxenian 1994). Like other studies on particular examples of "Marshallian" new industrial districts, such as the Third Italy (Piore and Sabel 1984) or the Orange County (Scott and Paul 1990), this often-cited work in regional economics literature stresses the role of small, innovative, firms embedded within a regionally cooperative network facilitating innovation and management of crisis, see (Freeman 1995) for a review. In this particular case studied by Saxenian, the author describes two North American hi-tech industrial poles with completely different organizational characteristics (Silicon Valley and Boston's Route 128), and establishes a relationship between these organizational differences and the opposite evolution of the industrial districts during the late 1980s, when the international electronics market became extraordinarily competitive and uncertain. While Silicon Valley adapted to the new situation and (its innovation culture) flourish as a worldwide reference, Boston Route 128 couldn't confront the uncertainty of the new scenario and suffered an important crisis.

1.8
About Saxenian's descriptions of both industrial districts, on one side she observed that Silicon Valley presented a densely networked and flexible organization, where information was shared quite freely between companies (even competitors) and with research institutes and local government institutions. Moreover, Saxenian interpreted the extremely high values of job mobility and business creation rates, as an indicator of individual initiative and independence. On the other, she found that Boston's Route 128 was dominated by large and autarkic corporations with a very rigid hierarchy, where people involved in research and development were expected to be strictly loyal to the company and behave "synchronized" as a block.

1.9
Note that this Saxenian's work can be linked with our previous argumentation about diversity affecting resilience of organizations. First, both industrial districts were economical systems oriented to innovation creation and diffusion (their functionality to be conserved or, if possible, improved). Second, she found that the raise on dynamism and competition of electronics market at the late 80s made it an uncertain scenario (the external threat or disrupting factor). Finally, Saxenian pointed out the non-uniformity of certain organizational characteristics of Silicon Valley, specially its particular social structure and its variety of individual initiatives, to be key features to explain Silicon Valley's capability to adapt to the new scenario.

1.10
Nonetheless, to this point, this interpretation of Saxenian's work from a resilience perspective is only made qualitatively. To deepen on this particular and other similar cases of study, we need to describe heterogeneity in a quantitatively way and to develop some type of resilience measurements. To make a quantitative approximation to this issue, we have used Saxenian's descriptions to build up a simplified model of innovation systems, and observed the evolution of their functionality in terms of efficiency in different environments (from quiet to highly competitive ones). Our numerical results, agreeing to Saxenian's qualitative conclusions, strongly suggest that the presence of diversity in certain organizational features increases the capability of industrial districts to maintain high rates of functionality within competitive and dynamic economical environments. In other words, we have shown quantitatively that a greater variety on these organizational features, enhance the resilience of industrial poles (as innovation systems) to the uncertainty induced by high levels of competition and dynamism (the external disrupting factor).

1.11
Below in this paper we include details about the models construction, especially concerning to how we have incorporated Saxenian's observations and have theorized about functionality of both industrial districts as innovation systems. We also present and explain the numerical results obtained and finally, we list some conclusions, both about this particular case of study and about general research on resilience of complex systems, that will be helpful in the general context of industrial networks and clusters.

* Modelling diversity as a resilience factor of organizations against socio-economic uncertainty: Silicon Valley vs Boston's Route 128

Diffusion of innovations in social networks

2.1
Since the goal is to model both industrial districts as innovations systems, we have to take into account previous research about diffusion of innovations in social systems.

2.2
Starting from the five categories of innovation adopters presented by Rogers (2003, first edition 1962), many scholars have focused on the role played by each individual's behaviour over processes of diffusion of innovations, and how the decision to adopt or not an innovation is conditioned by others previous decisions. A common approach is introduced in the 'bandwagon theories', based on the idea that each new adoption of an innovation within a population increases the pressure for others to adopt it. Each agent has a certain threshold of resistance to pressure, which can be surpassed as the pressure increases. If this happens, the agent adopts the innovation and her decision reinforces the pressure for adoption in the population. Scholars have identified different sorts of adopting pressures, related to concepts like profitability (Davies 1979), learning (Mansfield 1961) or fads (Meyer and Rowan 1977).

2.3
However, it is not quite realistic to assume that when an agent adopts an innovation, the whole population become aware of it and, moreover, that the pressure to adopt increases over all non-yet adopter in the same degree, independently of their relation or similarity with the new adopter. We can find works that study the extension and speed of innovation's spreading in populations with complex patterns of interaction (Burt 1981,Granovetter 1985). These works stress the role of social networks as disseminators of useful information about innovations and previous adoption decisions (how many close contacts have adopted it before, for instance) (Burt 1987). As a consequence of this role of the social substrate, the amount of information a potential adopter receives about the innovation, depends both on the social structure and on her concrete position in the network (Abrahamson and Rosenkopf 1997).

2.4
In order to deepen on the influence of individual behaviours and organizational structures over the diffusion of innovations, many scholars have used computational models. We can find some excellent reviews and general ideas about all them in Valente (1995), Abrahamson and Rosenkopf (1997) and Valente (2005).

A simple model of diffusion of technological innovations

2.5
Our models for both scenarios described by Saxenian are based on a simple model of innovation diffusion presented by Guardiola et al. (2002). In this model, a population of N agents linked through a certain quantity E of edges, form a network. Each agent in the network is characterized by a real variable ai, her technological level, for instance. The other main parameter of the model is the resistance to change C. When an agent i has upgraded her characteristic variable ai, all her neighbours (the agents linked to her) become aware of the change and balance their interest on the upgrade (quantified as the difference of a's values) with the resistance to change C. In this way C, controls the mechanism by which imitation drives the innovation's diffusion process.

2.6
The dynamics of the model consist on a repetition of the following steps:
  1. Each time step, a randomly chosen agent updates her characteristic ai :

aiai + Δi (1)

where Δi is a random variable with mean λ.

  1. All agents j ∈ Γ(i), where Γ (i) is the set of neighbours of agent i, decide whether they want to upgrade or not, according to the following rule:

aiajCaj = ai (2)

where C is a constant, for simplicity
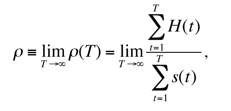
  1. If any j ∈ Γ (i) decide to imitate i, we let her neighbours also decide if they want to imitate this behaviour or not. This procedure is repeated until no more agents want to change, concluding an avalanche of imitation events. The model assumes that the time scale of the imitation process is much shorter that the corresponding to the random exogenous updates.

2.8
In this model it is considered that each individual adjustment elicits a certain cost. This cost is fixed and does not depend on the advanced technological level. Taking this into account, an optimal situation would be one in which the system reaches a certain average global technological level with the minimum cost, that is, the minimum number of adjustments. According to such a perspective, it is useful for defining a macroscopic observable measuring the closeness of the system to this optimal situation or, from another point of view, the fitness of system's configuration to the process of innovation's diffusion. In Guardiola et al (2002) this macroscopic observable is called mean rate of advance and is defined as follows:

Equation (3)

where H(t) is the total technological advance induced by a technological avalanche (the sum of all increases on the a level achieved by agents in the system) and s(t) corresponds to the avalanche size (the total number of agents 'affected' by it).
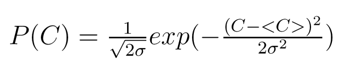
2.9
Although the simplicity of this model represents a good starting point for quantitative analysis, it is still not realistic enough to reproduce the two scenarios described by Saxenian. We have modified the model to capture two concrete cultural features of the industrial districts described in Saxenian (1994): The topology of the social substrate of each pole, and the individual behaviour of innovator agents when facing diffusion processes. There are two reasons that make these cultural features especially interesting for our work about resilience and diversity. First, Saxenian affirms that differences on these two cultural characteristics played a key role on the greater capability of Silicon Valley to adapt to (and take profit from) changes on their economical environment, that is, its resilience to changes on the market. Second, both of them can be described in terms of levels of heterogeneity on certain organizational features.

Modelling the social topology of both industrial sites

2.10
About the social topology, Saxenian indicate that people in Silicon Valley used their formal and informal links to share information with other people beyond their organizational boundaries, while in Boston, because of the autarky and secrecy imposed, information exchange was mainly restricted to the same group (company, division, department or team). To reproduce these structural particularities, we have used an algorithm proposed in Boguñá et al (2004) that is able to build up different social-like network topologies in function of a parameter called the homophile characteristic, which is everyone's preference to establish and maintain relations with people that have any common characteristic with (profession, hobbies, age or political feelings, for example).

2.11
The model presented in Boguñá et al (2004) is based on the intuitive idea that individuals tend to establish acquaintance or friendship links with other individuals if they feel, in some sense, close to them. Consequently, quantifying or graduating this closeness feeling one can calculate the probability of two individuals to establish a link. To do that, two parameters are used: the social distance between individuals in a social space defined by one or more cultural features and traits, and the homophile characteristic described above. In a macroscopic scale, given a population of agents with a set of social features, high values of the homophile lead to topologies with marked segregated communities and, on the contrary, lower homophiles favour integrated mixed structures.

2.12
In our case study, network of Boston 128 corresponds to a large homophile, because actors tend to exchange information only with people in closed homogeneous groups (with little social distances among them). On the contrary, Silicon Valley is supposed to have a small one, due to people's inter-group interactions. Moreover, preserving the original nomenclature proposed in Boguñá et al (2004), from now on in this paper we associate the symbol α to the homophile.

Modelling heterogeneity on individual behaviour

2.13
Individual initiative and independence of agents observed in Silicon Valley should be represented as a wide diversity of individual traits (to highlight the idea that each actor had its own perspective). On the contrary, rigid hierarchy and employee obedience in Boston would correspond to a more uniform configuration, where decisions are taken centrally and actors act as synchronized as possible.

2.14
Notice that the individual behaviour of agents in the original model of diffusion of innovations previously described is limited to their capability to decide whether to adopt or not innovations (a parameter upgrades). Since this decision depends on the value of resistance to change, a straightforward way to incorporate on different individual behaviours of agents in the model is to introduce differences on the resistance values of actors. To explain this modification in detail, we need to introduce a new concept we call resistance profile.

2.16
The resistance profile of a system is understood statistically as the probability distribution of the resistance. In Guardiola et al (2002), the resistance profile was a Delta distribution, i.e. 0 for all values except for a certain C. This particular choice of the resistance profile is far from a real scenario, where we expect to find a distribution of resistance values around a central one. Consequently, if we want to reproduce artificially a more realistic resistance profile we should assign resistance values to actors following a wider statistical distribution. Moreover, to reproduce a situation with a large variety of behaviours (a wide resistance profile) we need a distribution with a high standard deviation. On the contrary, a low standard deviation leads us to a narrow resistance profile simulating a more homogeneous scenario.

2.17
We have used a Gaussian distribution to generate actor's resistance with a high deviation to simulate Silicon Valley heterogeneity, and a low deviation for Boston Route 128. Consequently, the probability distribution function that describes the resistance profile is expressed as follows:

Equation (4)

Where <C> is the average value of resistance to change in the system, and σ is the standard deviation that determines the degree of heterogeneity of individual behaviours.

2.18
Summarizing, we have developed a simple model of diffusion of innovations in social substrates characterized by two organizational features: The topology of the social substrate of each pole and the individual behaviour of agents when facing diffusion processes. The first scenario (Silicon Valley) presents high levels of diversity for both properties. On the contrary, connectivity patterns and individual behaviours are more homogeneous in the second scenario (Boston Route 128). In Fig. 1, we represent the main differences between the simulated industrial poles.

Figure
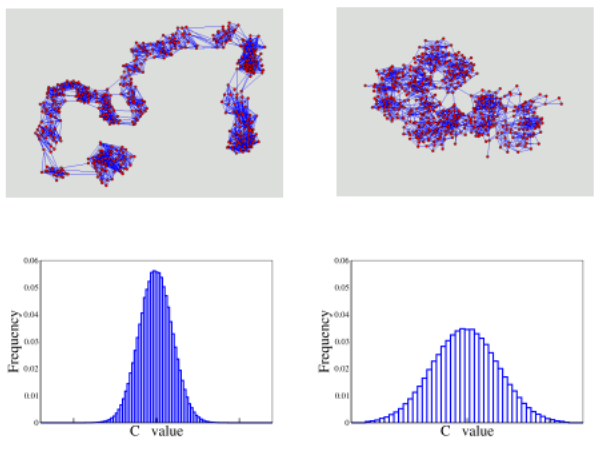
Figure 1. Characteristics of the synthetic models proposed for Boston Route 128 (left) and Silicon Valley (right). Top: structures obtained using the model described in the text for high (left) and low (right) homophile for N=500 agents. Bottom: resistance to change profiles used in both respective scenarios

Results

2.19
Once both technological poles have been established as particular configurations of the original model, we are ready to simulate the diffusion of innovations process and analyze its performance. In particular, we will characterize the performance or fitness of the system as the mean rate of advance defined before. We also have to define an independent variable to quantify environmental changes or dynamism. The idea of using the resistance to adopt a new innovation to represent the behaviour of actors is also useful here. In a dynamic scenario, people tends to adopt novelties easily due to what has been called 'competitive bandwagon pressures' (they try to minimize the risk of loosing competitive advantage to others if any innovation is a success) (Abrahamson and Rosenkopf 1993) and, consequently, the average resistance to change is low. On the contrary, in a quietness situation (when competition is weaker), they all become more conservative and the average resistance to change increases. Therefore, we can assume that the average value of the resistance to change among all agents in the system is low in dynamic situations and high in calm ones. Taking this into account, we have expressed the dynamism of the environment as the opposite of the average resistance to change in the population.

2.20
The evolution of ρ as a function of the economical dynamism for both configurations is shown in Figure 2. Although both plots are quite similar for low values of the dynamism, we can see that differences arise when the environment changes to more dynamic scenarios. The plot corresponding to Silicon Valley's mean rate of advance reaches higher values than the Boston Route one, and it begins to decline for very high levels of dynamism, when Boston Route ρ value has already lost nearly a 15% comparing to its maximum. Since the mean rate of advance is an indicator of the level of functionality of each industrial district (in terms of innovation diffusion) to each scenario, these results tells us that the organizational configuration corresponding to Silicon Valley adapts better to competitive scenarios than de Boston Route one. It resists to (and, even, take profit from) mid to high levels of dynamism, and begins to loose functionality (but very slowly) only when competition is really high.

2.21
Observing that the differences between both models are the few ones summarized in Figure 1, and that the original model is very simple (so we cannot consider that any other parameter, out of our control, could introduce additional differences), we conclude that the better adaptation of Silicon Valley's model is merely due to its variety in terms of relational substrate and individual initiatives and perspectives.

2.22
These conclusions support quantitatively the parallelism established, in qualitative terms, above in this text: Saxenian's work about Silicon Valley and Boston Route 128 reaction to the changes on electronics market at the end of the 1980s, can be interpreted as an example of the diversity role as a resilience enhancer of socio-economic systems. Then, we theorize that heterogeneity in certain organizational features of regional innovation systems increases their resilience to uncertain scenarios like, for instance, is assumed that the absence of hubs in communication networks improves their resilience, in terms of connectivity, to intentional attacks.

Figure
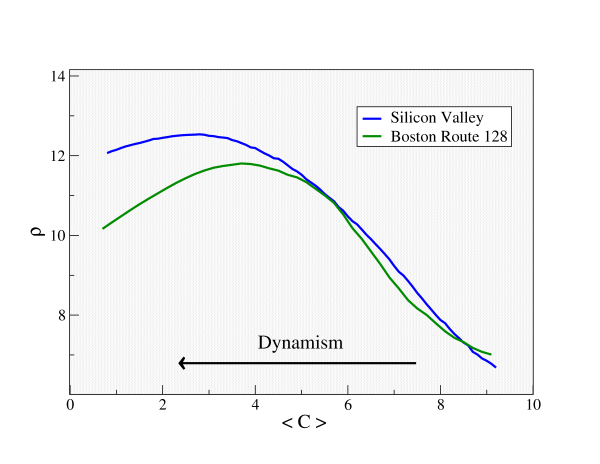
Figure 2. Evolution of the performance of each simulated industrial pole in terms of the mean rate of advance, as a function of the dynamism of the environment (calculated as the opposite of the average resistance value). These results have been obtained by averaging 100 independent realizations, each one consisting on 5000 iterations of the three-step dynamics presented above

Testing the robustness of the model

2.23
To this point, we have seen that the configuration corresponding to Silicon Valley reaches higher values of ρ, and presents a better response to more dynamic situations. However, a natural question arises: Is this phenomenon really the result of the mixed action of low homophily and narrow resistance profile, or it can be obtained just from one of the two features? To shed light on this issue, we have calculated several alternative configurations obtained as variations of the two previous ones. Results are shown in Figures 3a and 3b.

2.24
In Figure 3a, we plot the configurations obtained with the same resistance profile used before in Silicon Valley, but higher values of homophily. The most evident consequence of increasing the homophily (and, therefore, of limiting the heterogeneity of agent's neighbourhood), is a reduction on the ρ values. This behaviour can be explained by the limitation on the range of agent's connections as homophily grows: Note that the higher the homophily, the smaller part of the system can be reached by agent's to spread new innovations.

2.25
Cases represented in Figure 3b have been obtained from the Boston Route configuration by changing the standard deviation of its resistance profile. Here, we observe that the increasing on the width value has two main consequences: A reduction of ρ values, and a shift of the maximum fitness of the system towards more dynamic situations. The first phenomenon can be related to the difficulties introduced on the spreading of innovations by highly diverse individual behaviours. The second one is coherent with the idea, presented above in this paper, that diversification is a good strategy against uncertainty.

2.26
It is worth mentioning that we have also computed other possible variations of the experiment. As is shown in Table 1, the behaviours observed in those cases are in agreement with the ones reported above.

Table 1: Maximum fitness value (ρ max.) and its position (<C>) for nine different system configurations, determined by their homophile ( α ) and deviation of change profile ( σ ). Cases corresponding to Silicon Valley (SV) and Boston Route (BR) are indicated as a reference to the eye. Though both parametres of the model influence the position and value of the maximum fitness, the dependence of the fitness value on α seem to be stronger (see text)

σ
  0.8  2  6
α2.9
ρ max.: 13.74
<C>: 5.00

ρ max.: 13.10
<C>: 4.00
(SV)
ρ max.: 12.54
<C>: 2.80
5(BR)
ρ max.: 11.80
<C>: 3.70

ρ max.: 10.99
<C>: 2.90

ρ max.: 10.63
<C>: 1.83
7
ρ max.: 9.35
<C>: 2.85

ρ max.: 7.15
<C>: 1.75

ρ max.: 5.49
<C>: 0.75

2.27
At the light of these results, we conclude that both organizational characteristics (low homophily and high heterogeneity on individual initiative) are needed to reproduce the behavior of Silicon Valley configuration. Let's propose an example to illustrate this affirmation. Imagine that we want to improve the tolerance of Boston Route to more uncertain (dynamical) scenarios. We could try to do that by increasing the width of the resistance profile (which, in organizational terms, would be equivalent to stimulate individual initiative within the companies), but maintaining a high value of homophily (a rigid structure of closed groups). The result of such an experiment would be that the resilience of the regional system to uncertainty would effectively grow but, on the contrary, its fitness values would decrease in general.

Figure
Figure
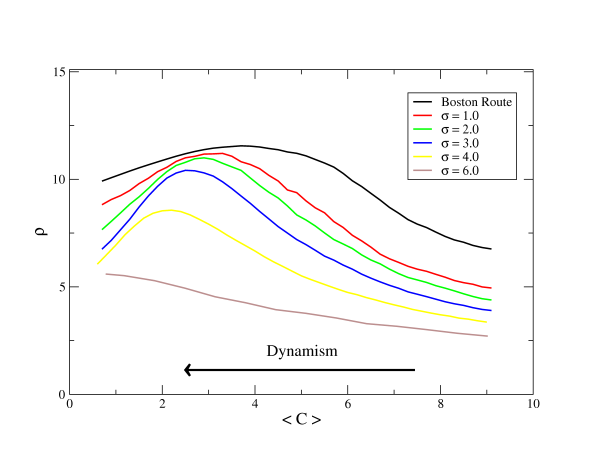
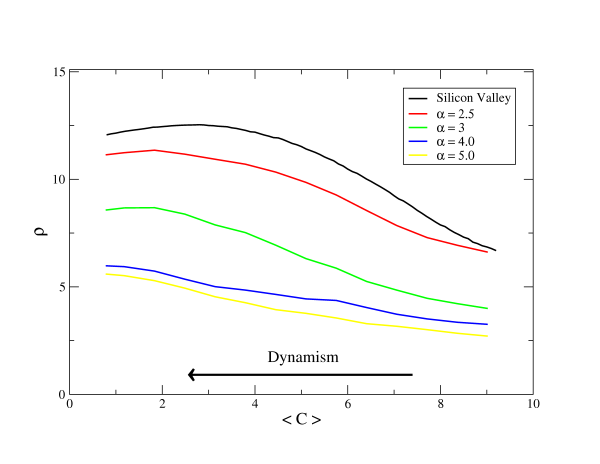
Figure 3a (top) & Figure 3b (bottom). Effect of modifying the original configurations by increasing the homophily (controlled by the homophile α) and the width of the resistance profile (controlled by the deviation σ), respectively. As in figure 2, these plots are the result of averaging 100 realizations of 5000 steps of our model dynamics

* Conclusions and further possibilities

3.1
In this work we have addressed the role of diversity as a factor that enhances resilience of organizations to uncertainty in their socio-economical environment. We have theoretically abstracted the regional innovation scenario in a complex network approach, inspired in a previous work (Saxenian, 1994) where certain organizational characteristics were related to the success or failure of industrial districts to confront highly competitive markets. We have built a simple model that grasps some general properties of the substrate of interactions in socio-economic environments, and the dynamics of the innovation processes on top of them. This abstraction is rooted on the formation of social acquaintances by preferential social distance attachment (Boguñá et al 2004), and on the processes of diffusion of innovations in socio-economic environments (Guardiola et al. 2002). This model allows us to alleviate from the specific details of particular agents and to theorize about the emergent phenomena we observe from very simple assumptions. A wide range of empirical phenomena, for example evolution of industrial clusters, are suitable for being studied with this methodology. In particular, we have focussed on the explanation of the qualitative observations of a classical work of regional development of industrial districts (Saxenian 1994), in terms of topological features of the substrate of interactions between socio-economical agents.

3.2
The most innovative contribution of the current work, from the complex networks perspective, is the introduction of diversity as a key element to enhance resilience understood in a wide sense, not necessarily related to lost in connectivity. This element supposes a step forward in complex networks theory relating functional robustness to external disruptive factors, beyond connectivity degradation.

3.3
Our work provides a double contribution to resilience analysis in socio-economical systems. Conceptually, we approach the resilience concept from a perspective different from the strictly structural one. From a methodological point of view, the procedure used in this paper to analyze the case study, based on simple numerical models designed from the conclusions of a previous qualitative analysis of real raw data, could be useful for the analysis of resilience in other cases related to social systems.

3.4
Resilience is a topic that is attracting progressively more attention on research fields related to industrial clusters and regional development. We can find references approaching it from a conceptual viewpoint, relating organizational adaptive capacity with other well-known concepts in the literature like "flexible specialization" or "collective learning capacity" (Staber and Sydow 2002). Other works use concrete real examples to illustrate the relationship between the resilience of regional socio-economical systems and, for example, the educational levels or the application of knowledge management techniques at a regional scale (Gerstlberger 2004). Taking this into account, further efforts on the development of computational models, like the one presented in this work, are needed to support quantitatively all this research based on an extended conception of resilience.

* Pseudo-code of the model

4.1
In order to facilitate the replication of the results, we include a pseudo-code of our model. We focus only on the core, namely the system construction and diffusion dynamics. We do not deep on issues like graphical display or collecting results. All source codes and precise instructions to compile and execute them can be found here

Declarations

N: integer;                                     -- Number of agents composing the population

type agent {   
             Id: integer;                       -- Agent's identification number
             a: float;                          -- Real value describing, for instance, the technological level
             C: float;                          -- Resistance to change value
             caract: float;                     -- Numerical value of  the social trait, needed to calculate the social distance  
      }

     type tagents is array (0..N-1) of agent;    
 
     type System {
             agents: tagents;                   -- Population of agents
             scale: float;                      -- Scale of the social attribute, known as 'b' 
                                                -- in Boguñá et al (2004).
             homo: float;                       -- Homophile value of the social attribute, known as α in the text
     }

Initialization

 
    procedure Crea_sistema (C_ave, C_dev: in float) {    -- Procedure that builds the system                    
           
                                                 -- Agent initialization
        for each agent in agents {                     
            agent.a:= 0.0;                       -- Initial value of 'a' is 0 for 
                                                 -- all the elements in the population.

            agent.C:= dist_norm(C_ave, C_dev);   -- The resistance to change value is
                                                 -- determined by a gaussian distribution
                                                 -- defined by C_ave and C_dev
     
            agent.caract:=dist_uni(Float(N)/10.0));           
                                                 -- Value of the social trait is defined by a
                                                 -- uniformly distributed random variable
                                                 -- with an average depending on the
                                                 -- system size.
            }


                                                 -- Determination of links between agents 
         for each agent i in agents { 
              for each agent j in agents that (j.Id > i.Id) {

                                                  -- Calculation of the linkage probability
                                                  -- as defined in Boguñá et al. (2004) 
                   prob := (1.0/(1.0+(((1.0/scale)*abs(i.caract - j.caract) ^ (homo));
                         
                                                  -- Creation of the link in function of the probability
                   if (dist_uni(0.5) ≤ prob) then  agents i and j become neighbours;
                   }     
               }
         
    }

Dynamics of the model

   
    function Intro_innovation (){    --Introduces an innovation in the system (1st step of diffusion dynamics).
    
         first_agent := dist_uni (N / 2);         -- The agent who starts the avalanche is chosen
                                                  --  randomly with equal probability.

         first_agent.a : =  fist_agent.a + incr;  --  Here 'a' is upgraded by a random 'incr' value

         return (first_agent);
    }


     procedure Update_neighbours (principal: in agent) {      -- Implements the innovation avalanche  (2nd and 3rd steps of diffusion dynamics)
    
          candidates_list := Check_neighbours(principal);     -- All neighbours of agent principal that want
                                                              -- to upgrade their 'a' level are listed in 
                                                              -- candidates_list.  
          
          while candidates_list  is not empty {
       
               next := chosen randomly from candidates_list;  -- One neighbour in candidates_list is chosen
                                                              -- randomly... 
           
               next.a := pos.a;                               -- ... to upgrade her 'a' level. 
                    
               Update_neighbours (next);                      -- As agent next has upgraded her level, her
                                                              -- neighborhood also notice the innovation
                                                              -- avalanche. This process is implemented
                                                              -- by calling recursively the procedure
                                                              -- Update_neighbours. 
                
               candidates_list := Check_neighbours(pos);           
           }
     }


    procedure Genera_jocs () {                    -- Generates the diffusion dynamics

        for num_real independent realizations of the experiment {
             for each agent in agents {
                  agent.a:= 0.0;                                -- The value of 'a' is reset to 0
                        
                  agent.C:= dist_norm(C_ave, C_dev);            -- The resistance to change value is determined
                                                                -- by a gaussian distribution with an average
                                                                --  and standard  deviation
                 }

             for num_steps time steps {
                 initial := Intro_innovation();                 --  A new innovation is introduced in the
                                                                --  system. Variable 'initial' receives the Id of  
                                                                --  the agent that has upgraded her 'a' value 
                                                                --  (first step of the dynamics).    
       
                 Update_neighbours(initial);                    -- Innovation avalanche (second and third steps of the dynamics)

                  s := Number of agents in the avalanche;       -- Data about the extension and magnitude of
                  H :=  Total increment on 'a' values;          -- the avalanche is stored.
                  
                  }
    
               rho := rho + (H/s);                              -- The value of ρ (mean rate of advance) is
                                                                -- calculated for each independent realization. 
        }
  
        rho := rho / Float(num_real);                           -- The final value of Rho is calculated as an
                                                                -- average of the values obtained at each 
                                                                -- independent realization. 
    }

Main program

     Procedure Main() { 
        
         Num_real : Number of independent realizations       
         num_steps : Number of time steps
         C_ave:  Average value of the resistance to change (related to environment dynamism)
         C_dev: Standard deviation of the resistance to change (related to indidual initiative);

         Crea_sistema (C_ave, C_dev);                      --  The system is created
       
    
         for each Cave value from Cmin to Cmax {           -- ρ is calculated for diferent values of C_ave
                                                           -- (for different values of the dynamism of the
                                                           -- socio-economical environment).
              Genera_jocs(C_ave, C_dev, );                              
              }

     }


* References

ABRAHAMSON, E., and ROSENKOPF L. (1993) Institutional and competitive bandwagons. Academy of Management Review, 18, 487-517.

ABRAHAMSON, E., and L. ROSENKOPF. (1997). Social network effects on the extent of innovation diffusion: a computer simulation. Organization Science, 8, 289-309.

ALBERT, R., JEONG, H., BARABSI, A.-L. (2000). Error and attack tolerance of complex networks. Nature, 406, 378-382.

BERKES, F., COLDING, J. and FOLKE, C. (editors) (2003) Navigating Social-Ecological Systems: Building Resilience for Complexity and Change. Cambridge, UK: Cambridge University Press.

BURT, R.S. (1981) Innovation as Structural Interest: Rethinking the Impact of Network Position on Innovation Adoption. Social Networks, 2, 327-355.

BURT, R.S. (1987) Social Contagion and Innovation, Cohesion versus Structural Equivalence. American Journal of Sociology, 92, 1287-1335.

BODIN, Ö. A network perspective on ecosystems, societies and natural resource management. PhD thesis. Available at: http://www.diva-portal.org/su/abstract.xsql?lang=en&dbid=844

BOGUÑÁ, M, PASTOR-SATORRAS, R, DÍAZ-GUILERA, A and ARENAS, A (2004) Models of social networks based on social distance attachment. Phys. Rev. E, 70 (056122).

CRUCITTI, P., LATORA, V. and MARCHIORI, M. (2004) A model for cascading failures in complex networks. Phys. Rev. E 69, 045104(R).

DAVIES, S. (1979). The diffusion of process innovations. Cambridge, UK: Cambridge University Press.

FONTOURA COSTA, L. (2004). Reinforcing the Resilience of Complex Networks. Phys. Rev. E, 69, (066127).

FREEMAN, C. (1995). The National System of innovation in historical perspective. Cambridge Journal of Economics, 19 (1), 5-24.

GERSTLBERGER, W. (2004). Regional innovation systems and sustainability - selected examples of international discussion. Technovation, 24 (9).

GRANOVETTER, M. (1985). Economic Action and Social Structure: The Problem of Embeddedness. American Journal of Sociology, 91, 481-510.

GUARDIOLA, X, DÍAZ-GUILERA, A, PÉREZ, C.J., ARENAS, A, and LLAS, M, (2002) Modelling diffusion of innovation in a social network. Phys. Rev. E, 66 (026121).

GUNDERSON, L.H. (2000) Ecological resilience-in theory and application. Annual Review of Ecology and Systematics, 31, 425-439.

HOLLING, C.S. (1973) Resilience and Stability of Ecological Systems. Annual Review of Ecology and Systematics 4, 1-23.

ISDR (2006) International Strategy for Disaster Reduction - United Nations. http://www.unisdr.org/eng/library/lib-terminology-eng%20home.htm.

JAIN, S. and KRISHNA, S. (2002). Crashes, recoveries, and "core shifts" in a model of evolving networks. Phys. Rev. E, 65 (026103).

MANSFIELD, E. (1961). Technical Change and the Rate of imitation. Econometrica, 61, 741-766.

MEYER, J. and ROWAN, B. (1977). Institutionalized Organizations: Formal Structure as Myth and Ceremony. American Journal of Sociology, 83, 340-363.

MORENO, Y., PASTOR-SATORRAS, R., VÁZQUEZ, A. and VESPIGNANI, A. (2003) Critical load and congestion instabilities in scale-free networks. Europhys. Lett., 62 (2), 292-298.

MOTTER, A.E. and LAI, Y.C. (2002). Cascade-based attacks on complex networks. Phys. Rev. E, 66, 065102(R).

NEWMAN, M.E.J, (2003) The structure and function of complex networks. SIAM Review, 45, 167-256.

PETERSON, G., ALLEN, C.R. and HOLLING, C.S. (1998) Ecological Resilience, Biodiversity and Scale. Ecosystems, 1 (1): 6-18.

PIORE, M. and SABEL, C. (1984) The second industrial divide: Possibilities for prosperity. New York: Basic Books.

RA (2006) Resilience Alliance. http://www.resalliance.org/

ROGERS, E. M. (2003) Diffusion of innovations. New York, USA: The Free Press.

SAXENIAN, A. (1994) Regional Advantage: Culture and Competition in Silicon Valley and Route 128. Cambridge, MA, USA: Harvard University Press.

SCOTT, A. and PAUL, A. (1990). Collective order and economic coordination in industrial agglomerations: The technopoles of Southern California. Environment and Planning C: Government and Policy, 8, 179-193.

STABER, U. and SYDOW, J. (2002). Organizational Adaptive Capacity: A Structuration Perspective. Journal of Management Inquiry, 11, 408-424.

VALENTE, T. W. (1995) Network models of the diffusion of innovations. Cresskill, NJ, USA: Hampton Press.

VALENTE, T. W. and DAVIS, R. L. (1999). Accelerating the diffusion of innovations using opinion leaders. The Annals of the American Academy of the Political and Social Sciences, 566, 55-67.

VALENTE, T. W. (2005). Models and methods for innovation diffusion. In Carrington, P. J., Scott, J. and Wasserman, S. (Eds.) Models and Methods in Social Network Analysis. Cambridge, UK: Cambridge University Press.

WESTMAN, W.E. (1978) Measuring the inertia and resilience of ecosystems. BioScience, 28 (11), 705-710.

----

ButtonReturn to Contents of this issue

© Copyright Journal of Artificial Societies and Social Simulation, [2007]