©Copyright JASSS

JASSS logo ----

Dara Curran and Colm O'Riordan (2007)

Cultural Learning in a Dynamic Environment: an Analysis of Both Fitness and Diversity in Populations of Neural Network Agents

Journal of Artificial Societies and Social Simulation vol. 10, no. 4 3
<https://www.jasss.org/10/4/3.html>

For information about citing this article, click here

Received: 14-Aug-2006    Accepted: 17-Sep-2007    Published: 31-Oct-2007

PDF version


* Abstract

Evolutionary learning is a learning model that can be described as the iterative Darwinian process of fitness-based selection and genetic transfer of information leading to populations of higher fitness. Cultural learning describes the process of information transfer between individuals in a population through non-genetic means. Cultural learning has been simulated by combining genetic algorithms and neural networks using a teacher/pupil scenario where highly fit individuals are selected as teachers and instruct the next generation.

This paper examines the effects of cultural learning on the evolutionary process of a population of neural networks. In particular, the paper examines the genotypic and phenotypic diversity of a population as well as its fitness. Using these measurements, it is possible to examine the effects of cultural learning on the population's genetic makeup. Furthermore, the paper examines whether cultural learning provides a more robust learning mechanism in the face of environmental changes.

Three benchmark tasks have been chosen as the evolutionary task for the population: the bit-parity problem, the game of tic-tac-toe and the game of connect-four. Experiments are conducted with populations employing evolutionary learning alone and populations combining evolutionary and cultural learning in an environment that changes dramatically.

Keywords:
Cultural Learning, Dynamic Environments, Diversity, Multi-Agent Systems, Artificial Life

* Introduction

1.1
Some research has been performed with regard to the combination of both evolutionary and life-time learning approaches (Nolfi & Parisi, 1996; Floreano & Mondada, 1996; Nolfi, Parisi, & Elman, 1994; Sasaki & Tokoro, 1997). Cultural learning is an alternative model which combines evolutionary learning with a modified version of life-time learning that allows populations to pass on knowledge to the next generation through a process of artifact creation or communication, often achieved through imitation.
1.2
A number of theoretical models have been developed to examine the interaction of culture and evolution (Cavalli- Sforza, 1981). In addition, the simulation of culture in populations of artificial organisms has been focus of much research (De Jong, 1999; Batali, 1998; Denaro & Parisi, 1996; Oliphant & Batali, 1997; Kirby & Hurford, 1997; Best, 1999; Cangelosi, 1999; Borenstein & Ruppin, 2003; Curran & O'Riordan, 2005; Curran & O'Riordan, 2004).
1.3
Previous work has examined the effects of cultural learning with regard to fitness (Curran & O'Riordan, 2006a), and an analysis of the effects of cultural learning on both the fitness and diversity of evolving neural network populations (Curran & O'Riordan, 2006b). A number of experiments were undertaken where populations of neural networks evolved in a number of static, non-changing environments.
1.4
The aim of this work is build on previous results by examining the effect of cultural learning on populations that evolve to solve a variety of benchmark tasks in environments that change dramatically. We examine fitness as well as both the genotypic and phenotypic diversity of the populations. The work is not primarily concerned with the objective problem solving performance of cultural learning but focuses instead on the effects of culture on populations of evolving agents.
1.5
While the effects of cultural learning have been examined before, the results presented diverge from previous work and shed more light on the subject. The model employed examines fitness and both genotypic and phenotypic diversity in dynamic environments and builds on previous models (such as Borenstein's (Borenstein & Ruppin, 2003)) by allowing individuals to impart knowledge that they themselves have acquired during their lifetimes.
1.6
Systems respond to changes in environment in an either explicit or implicit way. Explicit methods of response to environmental changes include hypermutation and re-initialisation (Morrison, 2004). This work is focused on a more implicit means, namely the preservation of diversity through cultural learning. The preservation of diversity can be seen as an emergent property of the cultural process, rather than an explicit goal and it is this property that we wish to exploit.
1.7
We have selected three bench-mark problems (the bit-parity problem, the game of tic-tac-toe and the game of connect-four) to examine the effect of cultural learning in populations of neural networks. A series of experiments were conducted using populations employing evolutionary-learning alone and populations employing both evolutionary and cultural learning.
1.8
The remainder of this paper is arranged as follows: Section 2 summarises related research and background material. Section 3 presents the model employed to conduct the experiments including a discussion of the encoding scheme, cultural learning implementation and diversity measures used. Section 4 describes the experiments: bit- parity, tic-tac-toe and connect-four. Section 5 outlines a discussion of the results obtained and Section 6 presents conclusions.

* Related Work

2.1
The following section outlines some background material including learning models, diversity and changing environments.

Learning Models

2.2
A number of learning models can be identified from observation in nature. These can roughly be classified into evolutionary, life-time and cultural learning.
Evolutionary Learning
2.3
Evolutionary learning refers to the process whereby a population of organisms evolves, or learns, by genetic means through a Darwinian process of iterated selection and reproduction of fit individuals(Darwin, 1859). In this model, the learning process is strictly confined to each organism's genetic material: the organism itself does not contribute to its survival through any learning or adaptation process.
Life-time Learning
2.4
There exist species in nature that are capable of learning, or adapting to environmental changes and novel situations at an individual level. Such learning, known as life-time learning is often coupled with evolutionary learning, further enhancing the population's fitness through its adaptability and resistance to change. Any adaptations acquired during an agent's life are not re-encoded into its genome. Much research explores the interactions between evolution and learning, showing that the addition of individual lifetime learning can improve a population's fitness(Nolfi & Parisi, 1996; Floreano & Mondada, 1996; Nolfi et al., 1994; Watson & Wiles, 2002; Curran & O'Riordan, 2003).
Cultural Learning
2.5
A population capable of transmitting information from one individual to another an be said to possess a culture. Such information exchanges can occur between peers (horizontal cultural transmission), parents and children (vertical cultural transmission) or both (oblique cultural transmission) (Cavalli-Sforza, 1981). Culture can take many forms such as language, signals or artifactual materials.
2.6
Such information exchange occurs during the lifetime of individuals in a population and can greatly enhance the behaviour of such species. The simulation of culture in populations of artificial organisms has been focus of much research(Yanco & Stein, 1993; De Jong, 1999; Batali, 1998; Denaro & Parisi, 1996; Oliphant & Batali, 1997; Kirby & Hurford, 1997; Saunders & Pollack, 1994; Best, 1999; Cangelosi, 1999; Brighton & Kirby, 2001; Borenstein & Ruppin, 2003).

Diversity

2.7
A common view of the evolutionary process is that diversity enhances the performance of a population by providing more opportunities for evolution and that diversity maintenance can avoid populations becoming trapped in local maxima. A homogeneous population offers no advantage for improvement as the entire population is focuses on a particular portion of the search space. By contrast, a diverse population will simultaneously sample a large area of search space, providing the opportunity to locate good solutions.
2.8
Previous work has focused on the measurement of both genotypic diversity (typically through edit distances (Gusfield, 1997; O'Reilly, 1997) between genomes) and phenotypic diversity (including entropy measurement (Rosca, 1995), crowding (De Jong, 1975) and niching (Mahfoud, 1995a, 1995b). In addition, much research has focused on promoting, maintaining or re-introducing diversity into evolving populations of solutions in order to achieve maximum performance. This includes work on mating schemes (Booker, 1982, 1985; Collins & Jefferson, 1991; Davidor, 1991; Hillis, 1990; Muhlenbein, 1989; Spiessens & Manderick, 1991) and fitness sharing(Goldberg & Richardson, 1987; Deb & Goldberg, 1989).

Changing Environments

2.9
A robust multi-agent system should be able to withstand and adapt to environmental changes. This type of behaviour parallels that of the natural world where species capable of adaption will have more chance of evolutionary success than ones that are rigid and incapable of such plasticity.
2.10
Much research has focused on the tracking of changing environments with regard to multi-agent and artificial life systems (Nolfi & Parisi, 1996; Grefenstette, 1992; Sasaki & Tokoro, 1997; Menczer, 1994; Cliff & Miller, 1995; Trojanowski & Michalewicz, 1999) focusing on Latent Energy Environments and fitness functions which vary over time. The general goal is to develop the ability of a population to adapt to a change within a reasonable length of time and to guide evolution toward a level of plasticity otherwise difficult to attain.

* Model

3.1
A population of agents is used to solve three benchmark tasks. Each agent consists of a neural network controller that allows it to perceive and interact with its environment. The neuro controller's architecture and weight values are encoded into the agent's genome and are allowed to genetically evolve over the course of each experiment using a genetic algorithm (Holland, 1975). Naturally, weight values altered during an agent's lifetime through any cultural process are not re-encoded into the genome. The neural network employs a standard sigmoidal threshold function which does not evolve.
3.2
The model allows populations to evolve using evolutionary learning alone, or using a combination of evolutionary and cultural learning. When cultural learning is applied, teacher agents instruct pupil agents by interacting with their environment (see the following section for more details). An agent's life can be summarised in the following steps:
3.3
The general algorithm for the experiments presented in this work is as follows:
3.4
The following subsections outline the encoding scheme used to convert an individual's genetic code to a neural network structure, the cultural learning implementation and the diversity measures employed for this work.

Encoding Scheme

3.5
One of the most crucial aspects of the model is the translation of genetic codes to neural network structures. Many encoding schemes were considered in preparation of the simulator, prioritizing flexibility, scalability, difficulty and efficiency. These included Connectionist Encoding (Belew, McInerney, & Schraudolph, 1992), Node Based Encoding (White, 1994), Graph Based Encoding (Pujol & Poli, 1998), Layer Based Encoding (Mandischer, 1993), Marker Based Encoding (Moriarty & Miikkulainen, 1995), Matrix Re-writing (Kitano, 1990; Miller, Todd, & Hedge, 1989), Cellular Encoding (Gruau, 1994), Weight-based encoding (Sutton, 1986;Kolen & Pollack, 1991) and Architecture encoding (Koza & Rice, 1991).
3.6
The scheme chosen is inspired by Marker Based Encoding which allows any number of nodes and interconnecting links for each network giving a large number of possible neural network architecture permutations. Marker based encoding represents neural network elements (nodes and links) in a sequential list. Each element is separated by a marker to allow the decoding mechanism to distinguish between the different elements and therefore deduce interconnections (Kitano, 1990; Miller et al., 1989).
3.7
In this implementation, a marker is given for every node in a network. Following the node marker, the node's details are stored in sequential order on the bit string. This includes the node's label and its threshold value. Immediately following the node's details, is another marker which indicates the start of one or more node-weight pairs. Each of these pairs indicates a back connection from the node to other nodes in the network along with the connection's weight value. Once the last connection has been encoded, the scheme places an end marker to indicate the end of the node's encoding (Figure 1).

Neural Network Encoding
Figure 1. Neural Network Encoding Example

Crossover
3.8
As a result of the chosen encoding scheme, crossover may not operate at the bit level as this could result in the generation of invalid gene codes. Therefore, the crossover points are restricted to specific intervals - only whole node or link values may be crossed over.
3.9
Two-point crossover is employed in this implementation. Once crossover points are selected, the gene portions are swapped. The connections within each portion remain intact, but it is necessary to adjust the connections on either side of the portion to successfully integrate it into the existing gene code. This is achieved by using node labels for each node in the network. These labels are used to identify individual nodes and to indicate the location of interconnections. Once the portion is inserted, all interconnecting links within the whole gene code are examined. If any links are now pointing to non-existing nodes, they are modified to point to the nearest labeled node (Figure 2).

Crossover Example
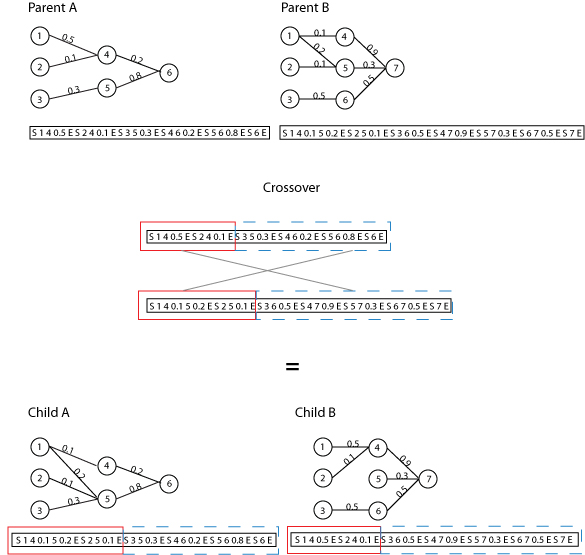
Figure 2. Sample crossover

Mutation
3.10
The mutation operator introduces additional noise into the genetic algorithm process thereby allowing potentially useful and unexplored regions of problem space to be probed. The mutation operator usually functions by making alterations on the gene code itself, most typically by altering specific values randomly selected from the entire gene code. In this implementation, weight mutation is employed. The operator modifies a weight according to a random percentage value chosen randomly from the range -200% to +200%. Mutation can alter the value of a start or end marker, thereby introducing structural novelty into the evolutionary process.

Cultural Learning

3.11
Cultural learning is implemented using an imitation scheme similar to that employed by Hutchins and Hazlehurst (Hutchins & Hazlehurst, 1991, 1995), Borenstein and Ruppin (Borenstein & Ruppin, 2003) and Nolfi (Nolfi & Parisi, 1996; Nolfi et al., 1994) which employ a teacher agent's neural network output value as the target for pupils. The fittest agents of the current generation are selected to become teachers that instruct the next generation. The model therefore employs a vertical model of cultural transmission, where information is passed on from one generation to the next(Boyd & Richerson, 1985; Belew, 1990).
3.12
Individuals are generated from their genetic code and are immediately exposed to teaching. As an agent encounters stimuli in its environment, it responds both behaviourally (emitting a signal through its output nodes) and verbally (emitting a signal through its verbal units—see Figure 3). Pupils iteratively attempt to imitate the teacher's verbal output value using cycles of error back propagation. These are referred to in the rest of this paper as teaching cycles where one teaching cycle is equivalent to a single exposure to stimulus and a subsequent error back-propagation.

Agent Communication Architecture
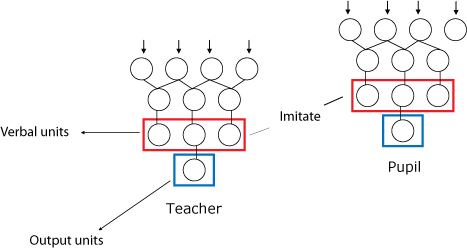
Figure 3. Agent Communication Architecture

3.13
It is possible that a teacher may possess a different number of verbal nodes than a pupil. In this case, the cultural interactions are restricted to the verbal nodes which both the pupil and teacher have in common.
3.14
A teaching cycle is outlined in the following steps: The model is not restricted to imparting only innate knowledge (knowledge that is genetically inherited and that agents have at their disposal from birth). In other words, teacher agents may impart knowledge that they themselves acquired culturally during their own learning phase.

Diversity Measures

3.15
The following sections outline the implementation for the genotypic and phenotypic diversity measure employed in this work. The population's diversity is measured at the start of each generation and before any cultural learning takes place.
Genotypic Diversity
3.16
The genotypic diversity measure considers the encoding of each agent's neural network in considerable detail, in an effort to combine node and link information to attain an expressive representation of the differences between two individuals.
3.17
To begin, it is important to note that the marker-based encoding method employed imposes two restriction on a detailed diversity scheme:
3.18
The first of these restrictions is easily dealt with. A Euclidian distance measure can easily be found between two items in the gene codes being compared. The second restriction is more complex: using a traditional, naive approach, two gene codes could be directly compared using the Euclidian measure above. However, such comparison would yield a high diversity rate for two identical, but rotated strings. Since the computational time required to search each pair of strings and correct any rotational deficiencies (which may or may not exist) would be impractical, a different method had to be devised.
3.19
Our proposed method examines the content of the genotype and breaks each chromosome into meaningful portions, where a meaningful portion is defined as data contained between a start and end marker. In other words, each meaningful portion contains data about a single node and all its emanating links to other nodes. Once all meaningful portions have been extracted from the string, any remaining data is kept aside maintaining its contiguous structure and labelled as inactive. It is worth noting that this data should be considered dormant rather than purely redundant as a crossover or mutation may re-activate previously isolated inactive data.

Genotypic diversity measure
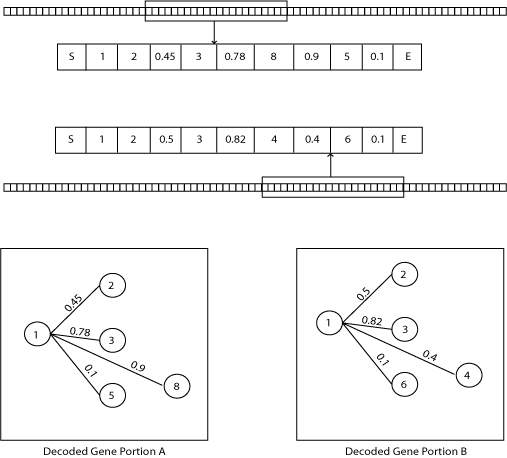
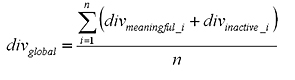
Figure 4. Genotypic diversity measure
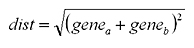
3.20
Having isolated the meaningful and inactive gene portions from the pair of gene codes being examined, the algorithm proceeds to examine meaningful portions of each genecode. The length of each portion corresponds exactly to the number of links that emanate from each node. Clearly, each meaningful portion will not be of equal length. As a result, an approach must be devised to choose pairs of portions that most merit comparison. For instance, it is hardly worth comparing an input node, with no incoming links, with an output or hidden node. Furthermore, it is reasonable to assume that two hidden nodes with an approximately similar number of links are suitable and useful for comparison.
3.21
Thus, the algorithm selects pairs of meaningful gene code portions of equal (or of as similar as possible) length from the gene codes being examined (Figure 3) and performs a Euclidian distance measurement for each value to determine their similarity.

Formula (1)

The distance measures for each pair of portions is averaged together to give a diversity measure for the two full length chromosomes.
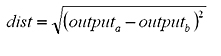
3.22
Once all pairs of meaningful gene portions have been examined for a given pair of gene codes, the algorithm performs the same comparison task for the inactive data. Since, as previously argued, such data is dormant rather than redundant, it merits comparison as equally as active meaningful portions.
3.23
Each member of the population is compared with every other member, and the diversity measure is averaged over the entire population, resulting in a global diversity measure:

Formula (2)

Phenotypic Diversity
3.24
The approach employed to measure the phenotypic diversity of the population is inspired by the work of McQuesten (2002). Specifically, the phenotypic diversity measure examines the actual response of an agent to a given stimulus, rather than relying on pure fitness measures, giving a more meaningful result. The approach undertaken in this work provides each agent with a number of stimuli to its neural network input layer, records the agent's neural network response and compares all the population's responses using a Euclidian distance measure for each response:

Formula (3)

3.25
The agent's phenotypic diversity is measured at the end of its life, after any cultural learning takes place. This facilitates the comparison between populations employing cultural learning and those that do not.
3.26
The number of stimuli given to each agent is limited in scope. While it would be possible to examine the response of the entirety of an agent's cognitive capacity, such an approach would be intractable for the more complex problem domains detailed in this work. Instead, the neural network's behavioural response is sampled using a number of fixed stimuli for each member of the population. Thus, the algorithm is comprised of the following steps: The algorithm is repeated such that each agent is compared with all other agents in the population. The distance measures are averaged to produce a global phenotypic diversity measurement.

Changing Environments

3.27
The focus of this paper is to examine the effect of a dramatic change in environment for a population employing evolutionary learning alone and one employing both evolutionary and cultural learning. While such catastrophic changes are not necessarily typical of real-world situations, they are nevertheless useful to analyse as a worst case scenario.
3.28
A dramatic change in a zero-sum game-playing environment can be generated by suddenly reversing the object of the game. In other words, the goal of the game changes from a win to a loss, completely altering the fitness landscape. It should be noted that such a change does not necessarily result in a problem of equal difficulty. There is no guarantee that playing to lose is equitable to, harder than or easier than playing to win. However, this goal reversal still achieves its aim: to create a potentially disastrous change in environment.

* Experimental Results

4.1
The experiments presented in this section employ two populations: one using evolutionary learning alone and the other employing both evolutionary and cultural learning. The bit-parity and tic-tac-toe experiments employed 100 agents, while the connect-four experiment allowed 50 agents to evolve (due to processing time constraints). Both populations were allowed to evolve for 400 generations. Crossover was set at 0.6 and mutation at 0.02. These parameters were determined empirically to provide good performance. The results presented are averaged from 20 independent runs.
4.2
Agents play games against a minimax player whose first move is randomized, allowing agents to play games of some variety. Fitness is assigned according to the length of the game. In other words, agents are rewarded for bringing the game to as close as possible to a draw.
4.3
The environment change occurs at generation 200 and is simulated by reversing the object of the game. Following the change, agents must now attempt to lose the game, rather than trying to win. The following sub-sections describe each experiment in detail.

Bit-Parity

4.4
The first problem attempted by the two populations is the 5-bit parity problem. For the first 200 generations, the agent's environment is such that it must respond with a one for patterns containing an odd number of ones and zero for patterns containing an even number of ones. At generation 200, this is reversed such that what was once rewarded is now punished. The following sections outline the results obtained examining both the fitness values and diversity measures for the two populations.
Fitness Values
4.5
Figure 5 shows the average fitness values obtained by the populations, along with the variance obtained over the difference runs, represented by error bars. The change in environment is clearly evident at generation 200 as a dramatic drop in fitness occurs for both populations. This result is as expected: such a dramatic environmental change is certain to have adverse effects on the population.

Bit-Parity Population Fitness
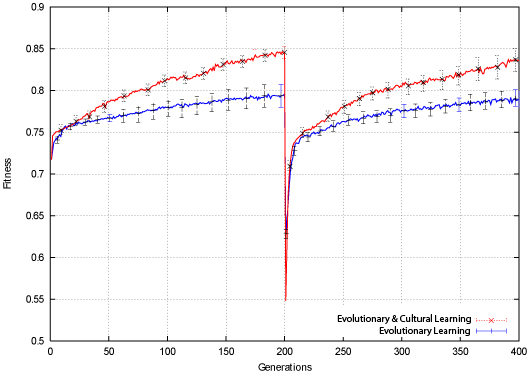
Figure 5. Bit-Parity Population Fitness

4.6
The initial portion of the experiment shows a distinction between the performance of the two populations. While both show a general upward trend, it is clear that the population employing both evolutionary and cultural learning is capable of achieving significantly higher levels of fitness than evolutionary learning alone. Following the environmental change both populations show signs of recovery but again, the population employing cultural learning quickly distinguishes itself as superior to that employing evolutionary learning alone. The initial high fitness of both populations can be explained by the relative simplicity of the bit-parity problem and the size of the initial populations. It is quite likely that a high proportion of the initial population will be able to partially solve the 5-bit problem. However, it is significantly more difficult to solve the problem fully.
4.7
Another interesting aspect of the results is that the drop in fitness level displayed by the two populations at the moment of environmental change is quite different. The cultural learning population shows a significantly deeper drop than the population employing evolutionary learning. This result can be explained when one considers the state of the population (and therefore its potential teachers) immediately before and after the change occurs. In the generation prior to the change, a number of teachers are selected from the population on the basis of their performance relative to the problem. Once the change occurs, these teachers are now given the task of instructing pupils but the environment is now completely reversed. Thus, the teachers provide an example which is entirely unsuitable for imitation in the new environment and therefore the population's fitness is severely reduced.
4.8
This result represents a potential problem with vertical cultural transmission as proposed by Belew (1990) and many others. While such a system is well suited to stable environments where the acquired knowledge of teachers can be guaranteed to be useful, it clearly has problems once that knowledge becomes obsolete. Rather than aiding the population in attaining higher fitness levels, the cultural learning process compounds the effect of the environmental change.

Bit-Parity Average Fitness for Population Before and After Teaching
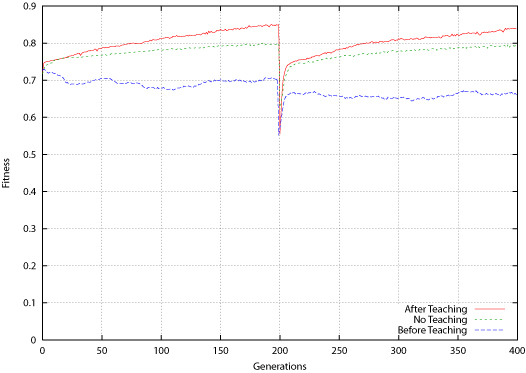
Figure 6. Bit-Parity Average Fitness for Population Before and After Teaching

4.9
The final set of bit parity results relating to the fitness of the cultural learning population is displayed in Figure 6. This figure shows the fitness levels of the population employing evolutionary learning alone, and the cultural learning population prior to and after teaching has taken place. Once again, the environment change is evident at generation 200, shown as a sharp drop in fitness across both populations. The three data sets quickly diverge and as before, it is evident that the cultural learning population prior to learning is significantly worse than the evolutionary learning population. However, once teaching is applied, the cultural learning population improves dramatically. It is clear that the cultural learning population's genotypes are suited towards learning rather than being innately attuned to the environment.
Diversity
4.10
The second measure obtained from the experiment dealing with environmental change for both population is diversity. As before, two types of diversity are measured: genotypic and phenotypic. Genotypic diversity is concerned with the genetic differences between individuals of a population while phenotypic diversity measures the differences in behaviour of individuals toward their environment.
Genotypic Diversity
4.11
Figure 7 illustrates the results obtained for the genotypic diversity measure for both populations over the course of the experiment. Both populations show a similar trend with the genotypic diversity rapidly descending and stabilising until generation 200, where there is a slight rise and fall around the environmental change. It is apparent from this set of results that cultural learning is sustaining genotypic diversity at a higher level than evolutionary learning alone but that the environmental change has a slight effect on both populations.

Bit-Parity Genotypic Diversity
Figure 7. Bit-Parity Genotypic Diversity

4.12
This slight rise in genotypic diversity around the environmental change can be explained by considering the state of the populations immediately before and after the change occurs. At the point of the change, the genotypic diversity for both populations is relatively stable, indicating that a suitable neural network architecture has been converged upon. Once the change occurs however, this architecture is likely to be inadequately equipped to deal with the environment reversal. As a result, the selection component of the evolutionary process attempts to locate high performing members of the population, some of which may well have been considered among the worst only a few generations beforehand. In addition, it is likely that unlike the mutually similar individuals making up the majority of the population (as a result of convergence), these individuals are quite different from one another. Therefore, not only is the population's genetic makeup altered radically from one generation to the next, but the population itself is comprised of quite diverse individuals, resulting in the increased genotypic diversity exhibited in these results.
4.13
The subsequent drop in genotypic diversity following this initial rise is indicative of the fact that the evolutionary process has quickly selected those few individuals which happen to be able to solve the problem and that these have quickly replicated themselves across the population.
Phenotypic Diversity
4.14
Figure 8 shows the results obtained for the phenotypic diversity measure. Again, both populations show similar trends with a slight fall in diversity followed by a rise in diversity around the environmental change. It is evident from the results that cultural learning is capable of sustaining a higher level of phenotypic diversity than evolutionary learning alone, though this is more pronounced in the second half of the experiment.

Bit-Parity Phenotypic Diversity
Figure 8. Bit-Parity Phenotypic Diversity

4.15
The rise in phenotypic diversity evident around the environmental change is indicative of the fact that the population's behaviour becomes highly diverse at this point in the experiment. As a result of the selection process and rise in genotypic diversity observed above, it is clear that phenotypic diversity is likely to rise simultaneously. For the population employing evolutionary learning one can say that an individual's genotype is highly correlated with its phenotype and one would therefore expect that a rise in genotype diversity among the population would be mirrored by a comparable rise in phenotypic diversity.
4.16
The cultural learning population's mapping from genotype to phenotype is less direct, owing to the teaching process and therefore cannot be explained adequately in this manner. However, if one considers how teachers and pupils interact at this point in the experiment, an explanation is apparent. The instruction of pupils by teachers will inevitably tend to make pupils more similar to their teachers. If a population has converged and the teachers selected are similar, then one would expect a low level of phenotypic diversity in the population. But if a population has not yet converged, but is in fact in a state of disarray such as the one following such a dramatic change, then its teachers are likely to be diverse in behaviour. A population having teachers of diverse behaviour is one that is likely to exhibit high phenotypic diversity as is evident in the results obtained.

Tic-Tac-Toe

4.17
Tic-tac-toe, or three in a row is a very simple two player game played on a 3×3 board. Each player is assigned either the X or O symbol and takes turns placing one symbol onto the board at a time. Each player attempts to place three of his/her pieces in a horizontal, vertical or diagonal line of three. Each agent's neural network structure contains 18 input nodes, 2 for each board position where 01 is X, 10 is O and 11 is an empty square. Nine output nodes corresponding to each board position are used to indicate the agent's desired move. The node with the strongest response corresponding to a valid move is taken as the agent's choice.
4.18
The following sub-sections outline the results obtained from the experiment, namely an examination of the fitness and diversity values for both populations.
Fitness Values
4.19
Figure 9 shows the average fitness of both populations. The change in environment can be clearly seen as a dramatic drop in fitness at generation 200. It is clear from the results that the population employing both cultural and evolutionary learning is capable of achieving higher levels of fitness than the population employing evolutionary learning alone for the first half of the experiment.
4.20
However, the cultural learning population does not recover following the change and remains at the same level as that of the population employing evolutionary learning alone. The cultural learning population shows early signs of recovery immediately following the change in environment, but does not make any further advances, stagnating at the same level as the population employing evolutionary learning alone. It is possible that the environment reversal for this particular problem may be more difficult to adjust to than first assumed.

XXXXXXXXXXXX
Figure 9. Tic-Tac-Toe Average Fitness

4.21
To fully understand the reasons for this, it is worth considering the problem analytically. In the normal game of tic-tac-toe, the optimal strategy is to block an opponent if necessary and place a piece on the square through which the most remaining winning lines run. Thus, the optimal move at the start of the game is to place your piece in the centre square, thereby giving four possible winning lines. This is the only move which gives the maximum number of winning lines.
4.22
However, when the object of the game is to lose, as in reverse tic-tac-toe, the problem becomes more difficult. An optimal strategy in this case is to move pieces onto squares with the least number of possible winning lines. At the start of a game there are four such possible positions. Therefore a neural network agent must decide from four equivalent possible optimal moves rather than the single optimal move in ordinary tic-tac-toe. It is this added choice that makes the problem more difficult to solve for the population.

Tic-Tac-Toe Average Fitness for Population Before and After Teaching
Figure 10. Tic-Tac-Toe Average Fitness for Population Before and After Teaching

4.23
The final set of results illustrated in Figure 10 shows the fitness for the population employing evolutionary learning alone and the cultural learning population before and after the teaching process is applied. Once again it is evident that the teaching process produces individuals that may be have an innate ability towards learning rather than an innate suitability with regard to their environment, occurring before and after the environment change. These results show similar trends to ones found in similar research (Nolfi & Parisi, 1993, 1994; Sasaki & Tokoro, 1997), suggesting that the population's knowledge about the environment is stored in its culture rather than in its genes.
Diversity
Genotypic Diversity
4.24
Figure 11 illustrates the results obtained for both populations. Both populations begin with very high levels of genotypic diversity. However, the two populations begin to diverge around generation 75, where the population employing both evolutionary and cultural learning maintains a higher level of diversity compared to the population employing evolutionary learning alone. The cultural learning process is producing more genetically diverse individuals while maintaining its fitness levels.

Tic-Tac-Toe Genotypic Diversity
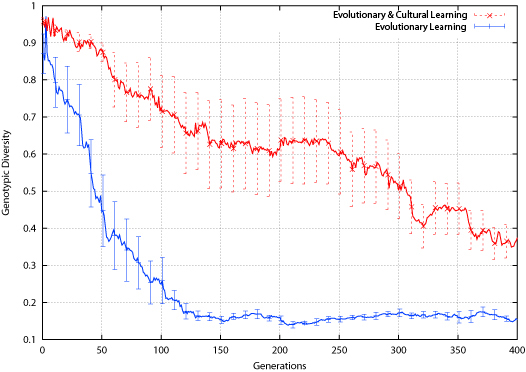
Figure 11. Tic-Tac-Toe Genotypic Diversity

Phenotypic Diversity
4.25
The results for the second measure of diversity, phenotypic diversity, are displayed in Figure 12. As in the previous experiments, the population employing both evolutionary and cultural learning exhibits an increased phenotypic diversity level throughout the experiment's length. The population produces a number of high performing individuals that are different in terms of behaviour. Thus, a number of different high performing strategies are simultaneously in existence within the population.
4.26
It is also clear from these results that the variance amongst the different experiment runs is significantly higher than that of the bit-parity experiment, suggesting that a higher number of varying strategies are adopted ó a consequence of the increased complexity of the problem.

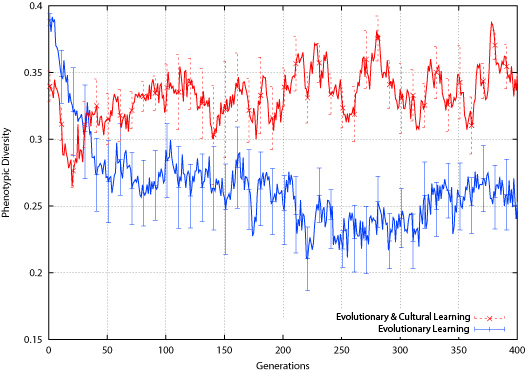
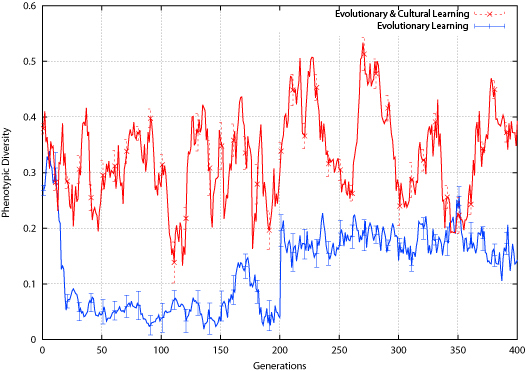
The effect of the environment change is different for the two populations: the population employing evolutionary learning alone shows a slight drop in phenotypic diversity around the environment change, while the cultural learning population shows a slight rise. Again, this is different than what was found in the bit-parity experiment, where both populations showed a slight rise in phenotypic diversity around the environment change.

Tic-Tac-Toe Phenotypic Diversity
Figure 12. Tic-Tac-Toe Phenotypic Diversity

4.27
The rise in phenotypic diversity exhibited by the cultural learning population is indicative of the population's relative plasticity towards such environment changes. While the rise is not large, it nevertheless indicates that the number of behaviours existing within the population has increased following the environment change. Following the change, the population produces an increased number of behaviours, making an attempt at exploration to break out of the slump in fitness caused by the change. This effect is clearly beneficial when one considers the positive effect on the population's subsequent recovery. Cultural learning provides the population with an increase in phenotypic diversity just when such an increase is most required. Given a large number of potential behaviour from which to select, the evolutionary process is better capable of quickly recovering from dramatic changes.

Connect-Four

4.28
The game of connect-four is a two-player game played on a vertical board of 7×6 positions into which pieces are slotted in one of seven available slots. Each player is given a number of coloured pieces (one colour per player) and must attempt to create horizontal, vertical or diagonal piece-lines of length four. Players place one piece per turn into one of the seven slots. The piece then falls onto a free position in the chosen column, creating piles, or towers, of pieces. If a column is full, the player must select an available slot.
4.29
At each move, the current board position is taken and the agent's pieces are added iteratively into each slot. At each iteration, the network is shown the board position through its 84 input nodes. The neural network responds to each board position through its only output node. The board position with the strongest output response is deemed to be the agent's preferred board position.
4.30
The following sections outline the results obtained for fitness values and diversity measures for both populations.
Fitness Values
4.31
Figure 13 shows the results obtained for the average fitness of each population throughout the experiment. While both populations begin the experiment with similar fitness values, the two quickly diverge as the population employing evolutionary and cultural learning produces higher fitness values than the population employing evolutionary learning alone. The change in environment is clearly visible as a dramatic fall in fitness in both populations at generation 200.

Connect-4 Average Fitness
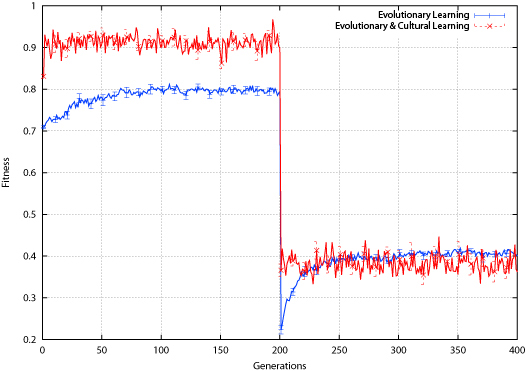
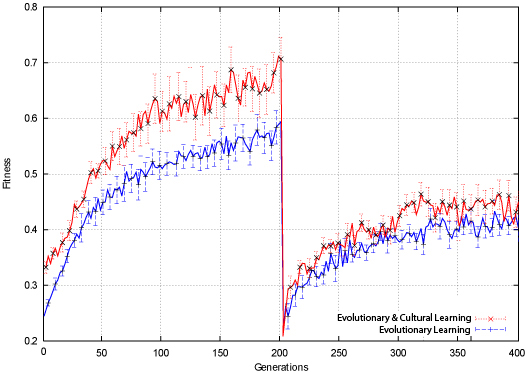
Figure 13. Connect-4 Average Fitness

4.32
The cultural learning population shows a slightly sharper drop in fitness than the population employing evolutionary learning alone. This is most likely due to its over-reliance on ineffectual teachers chosen in the generation prior to the environment change. These teachers are accustomed to the old environment and are unsuitable models for the next generation. While both populations show recovery following the change, the cultural learning population is clearly more successful, showing a faster rise in fitness.
4.33
The final set of results illustrated in Figure 14 shows the average fitness for the population employing evolutionary learning alone, the average fitness of the cultural learning population prior to teaching and the average fitness of the cultural learning population after teaching. As observed in previous experiments, the cultural learning population prior to teaching performs poorly, worse than the population employing evolutionary learning alone. However, once learning is applied, the population's fitness improves dramatically showing that the population is more attuned towards learning than its environment.

Connect-4 Average Fitness for Population Before and After Teaching
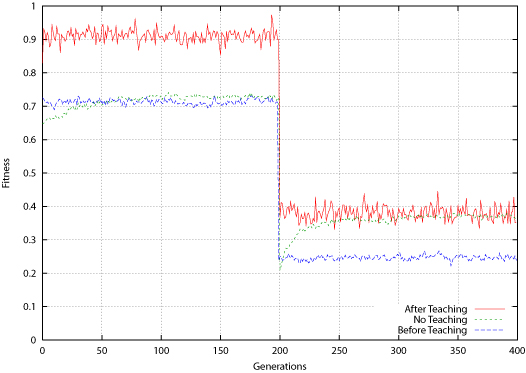
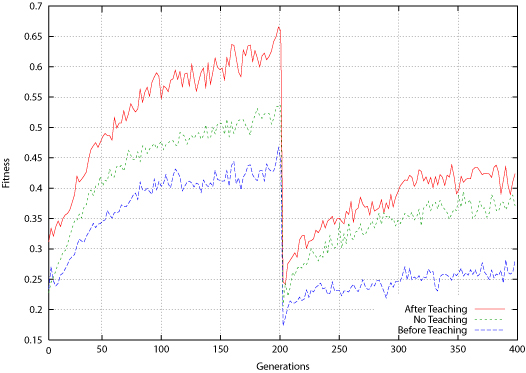
Figure 14. Connect-4 Average Fitness for Population Before and After Teaching

Diversity
Genotypic Diversity
4.34
Figure 15 shows the results obtained for the genotypic diversity measure for each population taken over the course of the experiment. Both populations begin the experiment with similar levels of diversity but quickly diverge as the cultural learning population maintains a significantly higher level of diversity during the course of the experiment. While the cultural learning population's diversity levels may vary between experiment runs (as exhibited by the error bars in the figure), even the least diverse cultural learning population is more diverse than the best evolutionary learning population. Clearly, the cultural process is capable of sustaining considerably higher levels of genotypic diversity than evolutionary learning alone.

Connect-4 Genotypic Diversity
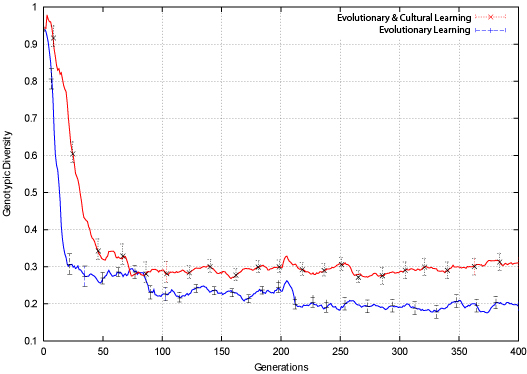
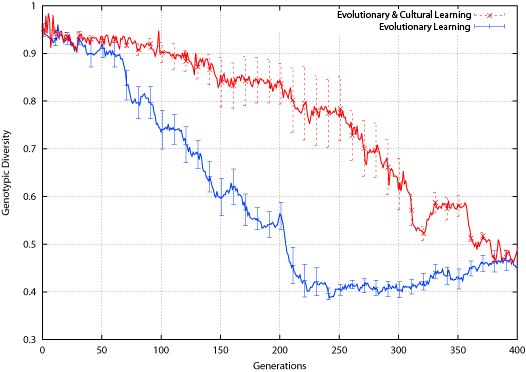
Figure 15. Connect-4 Genotypic Diversity

Phenotypic Diversity
4.35
Figure 16 shows the results obtained for the phenotypic diversity measure for each population over the course of the experiment. As observed previously, the cultural learning population exhibits a higher level of phenotypic diversity than the population employing evolutionary learning alone. The ability to sustain a high number of individual behaviours within a population while continuing to increase average fitness levels shows that the population is producing a number of successful connect-four strategies, rather than converging on a universal uniform approach.
4.36
The environment change has different effects on each population. The population employing evolutionary learning alone shows a drop in phenotypic diversity indicative of a focusing on a more limited number of behaviours in the population. This effect mirrors the corresponding drop in genotypic diversity observed above. The population's reaction to the environment change is to narrow its focus on the few individuals that are capable of developing strategies for the new problem. As a result, these individuals propagate through the population, showing a decline in phenotypic diversity. Diversity recovers somewhat following the change, but does not achieve its previous levels.

Connect-4 Phenotypic Diversity
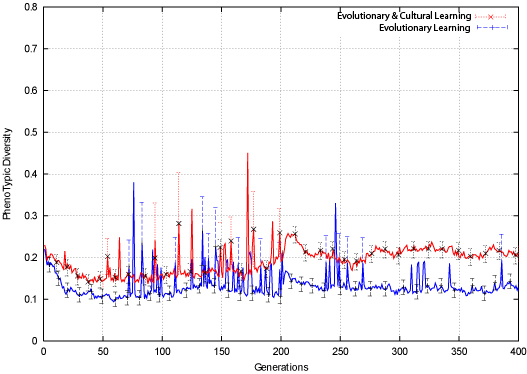
Figure 16. Connect-4 Phenotypic Diversity

4.37
The cultural learning population shows an increase in phenotypic diversity at the environment change, showing that instead of narrowing its focus on a few individuals, the cultural learning process generates a higher number of novel behaviours in order to expand its exploration of the problem space. Again, this effect is mirrored by the corresponding rise in genotypic diversity observed above. This expansion in the number of novel behaviours is clearly beneficial to the population as can be seen by examining its recovery in terms of fitness levels. The high number of novel individuals allows a renewed exploration of problem space, leading to the discovery of strategies suitable to the new environment.

* Discussion

5.1
From the results outlined in the Results section it can be said that it is not entirely clear that cultural learning allows populations to recover from the single dramatic environmental change. For the bit-parity and connect-four experiments, the population recovers, but for the more difficult problem reversal present in the tic-tac-toe environment, neither population is capable of tracking the environmental change.
5.2
While in general, both populations exhibits a significant drop in fitness at the moment of environment change, it is significantly more pronounced in the cultural learning population for the bit-parity and connect-four problems. This is a somewhat unexpected result as one may assume that given the rapidity of information transmission in the cultural process, the population should be able to track the change immediately.
5.3
However, these result can be explained by examining the vertical cultural information transmission mechanisms being employed. Fit agents are selected from the current generation to instruct the next. So, if a number of teachers are selected at generation n they will instruct pupils from generation n + 1. If the environment change occurs at generation n + 1, then teachers accustomed to the old environment (prior to the change) are going to be inadequate models of behaviour in the new, reversed, environment. Thus, rather than aiding the pupils, the teachers actually hinder the population's performance, leading to a significant drop in fitness. By contrast, if evolutionary learning is used alone, there are no teachers to mislead the next generation and thus the fitness drop is less pronounced.
5.4
This result outlines a potential flaw in the vertical cultural transmission model and invites the investigation of alternatives. An alternative approach would be to consider the horizontal transmission model, where teachers are selected from the current generation to teach their contemporary peers. Alternatively a mixed model, termed oblique transmission would consider teaching input from both the current and previous generations (Belew, 1990).
5.5
The drop in fitness for the other two problem tasks is more pronounced in the population employing evolutionary learning than the one employing both population and cultural learning. This is due to the differences in the problem task before and after the change in environment.

* Conclusion

6.1
This paper examines the effect of cultural learning on a population of evolving neural network agents exposed to a dramatic change in environment. The results obtained show that it is not fully clear that cultural learning is capable of better recovery following such dramatic changes compared to evolutionary learning alone. While the cultural learning population recovers more quickly from the change in the connect-four experiment, the results of the tic-tac-toe experiment show that if the environment change leads to a more difficult environment, both learning models struggle to track the change. This issue should be addressed through further experimentation employing different environmental changes and problem sets.
6.2
The results of the diversity measures show that the cultural learning process is capable of sustaining high levels of genotypic diversity for considerably longer than evolutionary learning alone. The cultural process has reduced selective pressure to genetically evolve good solutions to the problem task. Agents born with innately mediocre or poor networks are corrected by the cultural process and, in general, exhibit higher fitness levels than individuals from populations employing evolutionary learning alone. Furthermore, an effect of the cultural learning process is to produce populations that are significantly more diverse, and so are better able to adapt to changes in environment.
6.3
Future work will examine the effects of cultural learning on a more diverse range of environments and problem domains. In addition, research will be undertaken to develop a more sophisticated phenotypic diversity measure to more fully explore the search space in order to better understand the effect of learning on the behaviour of populations.

* Acknowledgements

The first author would also like to acknowledge the support of the Irish Research Council for Science, Engineering and Technology.


* References

BATALI, J. (1998) 'Computational simulations of the emergence of grammar', Approaches to the evolution of language: Social and cognitive bases, Cambridge: Cambridge University Press.

BELEW, R. K. (1990) 'Evolution, learning and culture: Computational metaphors for adaptive algorithms', Complex Systems, Vol. 4, pp. 11-49.

BELEW, R. K., McInerney, J., & Schraudolph, N. N. (1992) 'Evolving networks: Using the genetic algorithm with connectionist learning', Proceedings of Artificial life II. pp. 511-547. Redwood City, CA: Addison-Wesley.

BEST, M. L. (1999) 'How culture can guide evolution: An inquiry into gene/meme enhancement and opposition', Adaptive Behavior, Vol. 7(3/4), pp. 289-306.

BOOKER, L. B. (1982) 'Intelligent behavior as an adaptation to the task environment', Unpublished doctoral dissertation, The University of Michigan.

BOOKER, L. B. (1985) 'Improving the performance of genetic algorithms in classifier systems', Proceedings of the international conference on genetic algorithms and their applications, pp. 80-92. Pittsburgh, PA.

BORENSTEIN, E., & Ruppin, E. (2003) 'Enhancing autonomous agents evolution with learning by imitation', Interdisciplinary Journal of Artificial Intelligence and the Simulation of Behaviour, Vol. 1(4), pp. 335-348.

BOYD, R., & Richerson, P. (1985) Culture and the evolutionary process. University of Chicago Press.

BRIGHTON, H., & Kirby, S. (2001) 'The survival of the smallest: Stability conditions for the cultural evolution of compositional language', In Proceedings of ECAL'01, pp. 592-601, Springer-Verlag.

CANGELOSI, A. (1999) 'Evolution of communication using combination of grounded symbols in populations of neural networks', Proceedings of IJCNN99 international joint conference on neural networks, Vol. 6, pp. 4365-4368, Washington, DC: IEEEPress.

CAVALLI-SFORZA, L. L. (1981). Cultural transmission and evolution, a quantitative approach, Princeton University Press.

CLIFF, D., & Miller, G. F. (1995). 'Tracking the red queen: Measurements of adaptive progress in co-evolutionary simulations', Proceedings of the Third European Conference on Artificial Life (ECAL 1995), p. 200-218, Springer.

COLLINS, R. J., & Jefferson, D. R. (1991) 'Selection in massively parallel genetic algorithms'. Proceedings of the Fourth International Conference on Genetic Algorithms, pp. 249-256.

CURRAN, D., & O'Riordan, C. (2003) 'On the design of an artificial life simulator', Proceedings of the seventh international conference on knowledge-based intelligent information & engineering systems (KES 2003), pp. 549-555, University of Oxford, United Kingdom.

CURRAN, D., & O'Riordan, C. (2004) 'A comparison of population learning and cultural learning in artificial life societies'. Proceedings of ninth international conference on the simulation and synthesis of living systems (ALIFE9).

CURRAN, D., & O'Riordan, C. (2005) 'Applying cultural learning to sequential decision task problems', Proceedings of the 16th Irish artificial intelligence and cognitive science conference (AICS 2005).

CURRAN, D., & O'Riordan, C. (2006a) 'The Effects of Cultural Learning in Populations of Neural Networks', Artificial Life, Vol. 13(1), pp. 45-67.

CURRAN, D., & O'Riordan, C. (2006b) 'Increasing population diversity through cultural learning', Adaptive Behavior, Vol. 14(4), pp. 315-338.

DARWIN, C. (1859) The origin of species: By means of natural selection or the preservation of favoured races in the struggle for life. Bantam Classics.

DAVIDOR, Y. (1991) 'A naturally occurring niche and species phenomenon: The model and first results', Proceedings of ICGA, pp. 257-263, San Diego, CA, USA: Morgan Kaufmann.

DE JONG, E. D. (1999) 'Analyzing the evolution of communication from a dynamical systems perspective', Proceedings of the European conference on artificial life (ECAL 1999), pp. 689-693.

DE JONG, K. A. (1975) 'Analysis of behavior of a class of genetic adaptive systems', Unpublished doctoral dissertation, The University of Michigan.

DEB, K., & Goldberg, D. E. (1989) 'An investigation of niche and species formation in genetic function optimization', Proceedings of the third international conference on genetic algorithms, pp. 42-50, San Francisco, CA,USA: Morgan Kaufmann Publishers Inc.

DENARO, D., & Parisi, D. (1996) 'Cultural evolution in a population of neural networks', Proceedings of the 8th italian workshop on neural nets, pp. 100-111.

FLOREANO, D., & Mondada, F. (1996) 'Evolution of plastic neurocontrollers for situated agents', From Animals to Animats IV: Proceedings of the Fourth International Conference on Simulation of Adaptive Behavior, Vol. 4.

GOLDBERG, D. E., & Richardson, J. (1987) 'Genetic algorithms with sharing for multimodal function optimization', Proceedings of the second international conference on genetic algorithms on genetic algorithms and their application, pp. 41-49, Mahwah, NJ, USA: Lawrence Erlbaum Associates, Inc.

GREFENSTETTE, J. J. (1992) 'Genetic algorithms for dynamic environments', Parallel problem solving from nature 2, pp. 137-144.

GRUAU, F. (1994) 'Neural network synthesis using cellular encoding and the genetic algorithm', Unpublished doctoral dissertation, Centre d'etude nucleaire de Grenoble, Ecole Normale Superieure de Lyon, France.

GUSFIELD, D. (1997) Algorithms on strings, trees and sequences: computer science and computational biology, Cambridge Univ. Press. (Gusfield)

HILLIS, W. D. (1990) 'Co-evolving parasites improve simulated evolution as an optimization procedure', Proceedings of the ninth annual international conference of the center for nonlinear studies on self-organizing, collective, and cooperative phenomena in natural and artificial computing networks on emergent computation, pp. 228-234. Amsterdam, The Netherlands, The Netherlands: North-Holland Publishing Co.

HOLLAND, J. H. (1975) Adaptation in Natural and Artificial Systems, University of Michigan Press

HUTCHINS, E., & Hazlehurst, B. (1991) 'Learning in the cultural process', Proceedings of Artificial life II, pp. 689-706, Cambridge, MA: MIT Press.

HUTCHINS, E., & Hazlehurst, B. (1995) 'How to invent a lexicon: The development of shared symbols in interaction', Artificial societies: The computer simulation of social life, pp. 157-189, London: UCL Press.

KIRBY, S., & Hurford, J. (1997) 'Learning, culture and evolution in the origin of linguistic constraints', ECA 19'97, pp. 493-502, MIT Press.

KITANO, H. (1990) 'Designing neural networks using genetic algorithm with graph generation system', Complex Systems, Vol. 4, pp. 461-476.

KOLEN, J. F., & Pollack, J. B. (1991) 'Back propagation is sensitive to initial conditions', Advances in Neural Information Processing Systems, 3, pp. 860-867.

KOZA, J. R., & Rice, J. P. (1991) 'Genetic generation of both the weights and architecture for a neural network', International joint conference on neural networks, IJCNN-91, Vol. 2, pp. 397-404), Seattle, WA: IEEEComputer Society Press.

MAHFOUD, S. W. (1995a) 'A comparison of parallel and sequential niching methods', Proceedings of the sixth international conference on genetic algorithms, pp. 136-143.

MAHFOUD, S. W. (1995b) 'Niching methods for genetic algorithms', Unpublished doctoral dissertation, University of Illinois.

MANDISCHER, M. (1993) 'Representation and evolution of neural networks', Artificial neural nets and genetic algorithms proceedings of the international conference at Innsbruck, Austria, pp. 643-649. Wien and New York: Springer.

MCQUESTEN, P. H. (2002) 'Cultural enhancement of neuroevolution', Unpublished doctoral dissertation, University of Texas, Austin.

MENCZER, F. (1994) 'Changing latent energy environments: A case for the evolution of plasticity', Technical report cs94-336.

MILLER, G. F., Todd, P. M., & Hedge, S. U. (1989), 'Designing neural networks using genetic algorithms', Proceedings of the third international conference on genetic algorithms and their applications, pp. 379-384.

MORIARTY, D. E., & Miikkulainen, R. (1995) 'Discovering complex othello strategies through evolutionary neural networks', Connection Science, Vol. 7(3-4), pp. 195-209.

MORRISON, R. W. (2004) Designing Evolutionary Algorithms for Dynamic Environments, Springer.

MUHLENBEIN, H. (1989) 'Parallel genetic algorithms, population genetics and combinatorial optimization'. Proceedings of the third international conference on genetic algorithms, pp. 416-421, San Francisco, CA, USA Morgan Kaufmann Publishers Inc.

NOLFI, S., & Parisi, D. (1993) 'Self-selection of input stimuli for improving performance', Neural networks in robotics, pp. 403-418,. Kluwer.

NOLFI, S., & Parisi, D. (1994) 'Desired answers do not correspond to good teaching inputs in ecological neural networks', Neural processing letters, Vol. 1(2), p. 1-4.

NOLFI, S., & Parisi, D. (1996) 'Learning to adapt to changing environments in evolving neural networks', Adaptive Behavior, Vol. 5(1), pp. 75-97.

NOLFI, S., Parisi, D., & Elman, J. L. (1994) 'Learning and evolution in neural networks', Adaptive Behavior, 3(1), pp. 5-28.

OLIPHANT, M., & Batali, J. (1997) 'Learning and the emergence of coordinated communication', The newsletter of the Center for Research in Language, Vol. 11(1).

O'REILLY, U. M. (1997) 'Using a distance metric on genetic programs to understand genetic operators'. IEEE international conference on systems, man, and cybernetics, Vol. 5, pp. 4092-4097.

PUJOL, J. C. F., & Poli, R. (1998)  'Efficient evolution of asymmetric recurrent neural networks using a two-dimensional representation', Proceedings of the first European workshop on genetic programming (EUROGP) , pp. 130-141.

ROSCA, J. P. (1995) 'Entropy-driven adaptive representation', Proceedings of the workshop on genetic programming: From theory to real-world applications, pp. 23-32.

SASAKI, T., & Tokoro, M. (1997), 'Adaptation toward changing environments: Why Darwinian in nature?', Fourth European conference on artificial life, pp. 145-153, Cambridge, MA: MIT Press.

SAUNDERS, G. M., & Pollack, J. B. (1994) 'The evolution of communication in adaptive agents', Technical Report of the Department of Computer and Information Science, The Ohio State University.

SPIESSENS, P., & Manderick, B. (1991) 'A massively parallel genetic algorithm: Implementation and first analysis', Proceedings of the 4th International Conference on Genetic Algorithms, pp. 279-287. San Diego, CA, USA: Morgan Kaufmann.

SUTTON, R. S. (1986) 'Two problems with back-propagation and other steepest-descent learning procedures for Networks', Proceedings of the 8th annual conference of the cognitive science society, pp. 823-831.

TROJANOWSKI, K., & Michalewicz, Z. (1999) 'Evolutionary algorithms for non-stationary environments', Proceedings of 8th workshop: Intelligent information systems, pp. 229-240, Watson, J., & Wiles, J. (2002) 'The rise and fall of learning: A neural network model of the genetic assimilation of acquired traits', Proceedings of the 2002 congress on evolutionary computation (CEC 2002), pp. 600-605.

WHITE, D. W. (1994) 'Gannet: A genetic algorithm for searching topology and weight spaces in neural network design', Unpublished doctoral dissertation, University of Maryland College Park.

YANCO, H., & Stein, L. (1993) 'An adaptive communication protocol for cooperating mobile robots'. From Animals to Animats 2: Proceedings of the second international conference on simulation of adaptive behavior, pp. 478-485, Cambridge MA: MIT Press.

----

ButtonReturn to Contents of this issue

© Copyright Journal of Artificial Societies and Social Simulation, [2007]