
|
|
(A.1) |
|
|
(A.2) |
where Crate represents the rate of contact between an individual and his or her respective neighbors, Ctime the number of contacts between the individual and those neighbors in one day, Trate the average infected individual transmission rate, Tperiod the average infected individual transmission period, Avg. Mirror Identities the average number of mirror identities, and Num. of Neighbors the number of neighbors for each mirror identity.
| Table A.1: Parameters used in the experiments | |||||||
| R0 | Crate | Ctime | Trate | Tperiod | Avg. Mirror Identities | Num. of Neighbors | |
| Singapore Taipei Toronto | 2.7 | 1/8 | 4 | 0.045 | 5 | 3 | 8 |
|
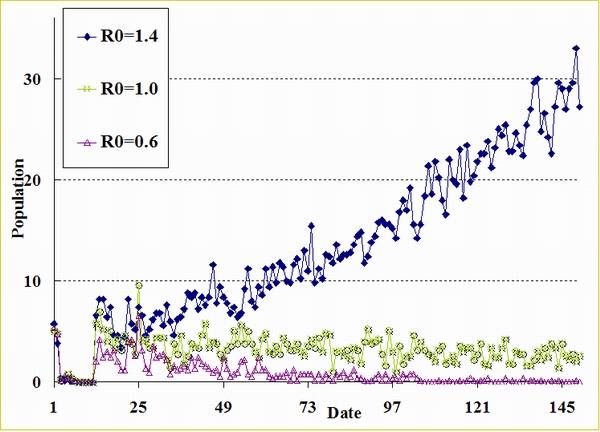
| Figure A.1. Epidemic curves (R0 = 1.4, 1.0, and 0.6) when Tperiod = 6, Avg. Mirror Identities = 3, and Ctime = 4 |
| Table A.2: Initial Global Environment Parameters | ||
| Attribute | Value | Description |
| P | 100,000 | Total number of agents. |
| M | 5 | Upper limit of an agent's mirror identities. |
| H | 500 | Height of the two-dimensional lattice used in the cellular automata. |
| W | 500 | Width of the two-dimensional lattice used in the cellular automata. |
| Avg. Mirror Identities | 3 ~ 4 | Average number of mirror identity. |
| DayIncubation | 5 | Average number of incubation days. |
| DayInfectious | 25 | Average number of infectious days. |
| DayRecovered | 7 | Average number of recovered days. |
| RateSuper | 0.0001 | Percentage of super-spreaders among total population. |
| RateYoung | 0.3 | Percentage of young (0 to 20 years) agents in total population. |
| RatePrime | 0.5 | Percentage of prime (21 to 60 years) agents in total population. |
| RateOld | 0.2 | Percentage of old (60 years and above) agents in total population. |
| RateInfection | 0.045 | Average infection rate. |
| RateDeath | 0.204 | Average death rate. |
| Table A.3: Singapore Simulation Input Data | |||||
| Time Step | Action | Persons | State | Public Health Policy | Special Description on the Simulator |
| 2003/3/1 | Trigger | 1 | Infectious | Super-spreader | |
| 2 | Trigger | 2 | Infectious | ||
| 11 | Set | Reducing Public Contact | Efficacy = 0.9, Popularity = 0.5 | ||
| 15 | Trigger | 1 | Incubation | Wearing Mask Policy for Healthcare Worker | Efficacy = 0.9, Popularity = 0.9 |
| 22 | Trigger | 2 | Incubation | ||
| 23 | Set | Home Quarantines | 10 days, Popularity = 0.9 | ||
| Controlling Hospital Access | Efficacy = 0.9, Popularity = 0.9 | ||||
| Wearing Mask Policy for General Public | Efficacy = 0.9, Popularity = 0.5 | ||||
| 25 | Trigger | 2 | Infectious | ||
| 52 | Set | Taking Body Temperature | Efficacy = 0.9, Popularity = 0.5 | ||
| Table A.4: Taipei Simulation Input Data | |||||
| Time Step | Action | Persons | State | Public Health Policy | Special Description on the Simulator |
| 2003/3/20 | Trigger | 1 | Infectious | ||
| 2 | Trigger | 4 | Incubation | ||
| 9 | Trigger | 1 | Incubation | ||
| 11 | Trigger | 2 | Infectious | ||
| 12 | Trigger | 2 | Infectious | Home Quarantines | 10 days, Popularity = 0.9 |
| 14 | Trigger | 1 | Infectious | ||
| 27 | Trigger | 1 | Infectious | Wearing Mask Policy for Healthcare Worker | Efficacy = 0.9, Popularity = 0.9 |
| 47 | Set | Controlling Hospital Access | Efficacy = 0.9, Popularity = 0.9 | ||
| 53 | Set | Home Quarantines | 14 days, Popularity = 0.9 | ||
| Wearing Mask Policy for General Public | Efficacy = 0.9, Popularity = 0.5 | ||||
| 74 | Set | Home Quarantines | 10 days, popularity = 0.9 | ||
| 88 | Set | Taking Body Temperature | Efficacy = 0.9, Popularity = 0.5 | ||
| Table A.5: Toronto Simulation Input Data | |||||
| Time Step | Action | Persons | State | Public Health Policy | Special Description on the Simulator |
| 2003/2/23 | Trigger | 1 | Infectious | ||
| 6 | Trigger | 1 | Infectious | ||
| 19 | Trigger | 1 | Infectious | Wearing Mask Policy for Healthcare Worker | Efficacy = 0.9, Popularity = 0.9 |
| Reducing Public Contact | Efficacy = 0.9, Popularity = 0.5 | ||||
| 30 | Trigger | 1 | Infectious | ||
| 37 | Set | Controlling Hospital Access | Efficacy = 0.9, Popularity = 0.9 | ||
| Home Quarantines | 10 days, Popularity = 0.9 | ||||
| 38 | Trigger | 1 | Infectious | ||
| 68 | Close | All Public Health Policies opened before | |||
| 91 | Set | Wearing Mask Policy for Healthcare Worker | Efficacy = 0.9, Popularity = 0.9 | ||
| 112 | Set | All Public Health Policies closed before | |||
BECKER N G (1992) Infectious-Diseases of Humans - Dynamics and Control. Australian Journal of Public Health, 16, pp. 208-209.
KOOPMAN J (2004) Modeling infection transmission. Annual Review of Public Health 25: 303-26.
RILEY S, Fraser C, Donnelly C A, Ghani A C, Abu-Raddad L J, Hedley A J, Leung G M, Ho L M, Lam T H, Thach T Q, Chau P, Chan K P, Lo S V, Leung P Y, Tsang T, Ho W, Lee K H, Lau E M, Ferguson N M, and Anderson R M (2003) Transmission Dynamics of the Etiological Agent of SARS in Hong Kong: Impact of Public Health Interventions. Science, 300(5627), pp. 1961-1966.
LIPSITCH M, Cohen T, Cooper B, Robins J M, Ma S, James L, Gopalakrishna G, Chew S K, Tan C C, Samore M H, Fisman D, and Murray M (2003) Transmission Dynamics and Control of Severe Acute Respiratory Syndrome. Science, 300(5627), pp. 1966-1970.
SEBASTIAN B and Hoffmann C (2003) SARS Reference. Flying Publisher.
WHO (WORLD HEALTH ORGANIZATION) (2003) Consensus document on the epidemiology of severe acute respiratory syndrome (SARS), http://www.who.int/csr/sars/en/WHOconsensus.pdf.
 Return to Contents of this issue
© Copyright Journal of Artificial Societies and Social Simulation, [2004]