Actor Behaviour and Robustness of Industrial Symbiosis Networks: An Agent-Based Modelling Approach

, ,
and
aAmsterdam University of Applied Sciences and Delft University of Technology, Netherlands; bDelft University of Technology, Netherlands
Journal of Artificial
Societies and Social Simulation 24 (3) 8![]()
<https://www.jasss.org/24/3/8.html>
DOI: 10.18564/jasss.4635
Received: 01-May-2020 Accepted: 27-May-2021 Published: 30-Jun-2021
Abstract
Industrial Symbiosis Networks (ISNs) consist of firms that exchange residual materials and energy locally, in order to gain economic, environmental and/or social advantages. In practice, ISNs regularly fail when partners leave and the recovery of residual streams ends. Regarding the current societal need for a shift towards sustainability, it is undesirable that ISNs should fail. Failures of ISNs may be caused by actor behaviour that leads to unanticipated economic losses. In this paper, we explore the effect of these behaviours on ISN robustness by using an agent-based model (ABM). The constructed model is based on insights from both literature and participatory modelling in three real-world cases. It simulates the implementation of synergies for local waste exchange and compost production. The Theory of Planned Behaviour (TPB) was used to model agent behaviour in time-dependent bilateral negotiations and synergy evaluation processes. We explored model behaviour with and without TPB logic across a range of possible TPB input variables. The simulation results show how the modelled planned behaviour affects the cash flow outcomes of the social agents and the robustness of the network. The study contributes to the theoretical development of industrial symbiosis research by providing a quantitative model of all ISN implementation stages, in which various behavioural patterns of entrepreneurs are included. It also contributes to practice by offering insights on how network dynamics and robustness outcomes are not only related to context and ISN design, but also to actor behaviour.Introduction
Within the context of the circular economy, self-organised Industrial Symbiosis Networks (further abbreviated as ISNs) have gained a lot of interest in science and practice as a means to increase social, environmental and economic sustainability (Ghisellini et al. 2015). Firms within ISNs exchange information, materials and energy to primarily create economic benefits, while also contributing to sustainability (Chertow 2000; Lombardi & Laybourn 2012).
ISNs consist of social entities and technical objects, such as waste streams, contracts and technologies, which are interdependent and evolving over time (Mannino et al. 2015). Technologies, business models, policies and actor behaviour affect the emergence, growth and decay of ISNs. Only a few types of ISNs can be successfully sustained (Yap & Devlin 2016) and for example, small networks are particularly vulnerable to falling apart (Tudor et al. 2007). The most successful ISNs are generally self-organising networks (Chertow & Ehrenfeld 2012).
Understanding the behaviour of firms improves the effectiveness of decision making in the transition towards circular systems (Verzijl et al. 2019). Behaviour of firms is therefore increasingly being studied in the context of ISNs, e.g., by Spekkink et al. (2016).
This study aims to explore under which conditions, how and to what extent the robustness of ISNs is influenced by actor behaviour during implementation of by-product exchanges in ISNs. It is built upon key elements that determine ISN dynamics and survival: this concerns all stages of industrial symbiosis implementation from the perspective of each firm in the network, including actor behaviour.
Since real-world experimentation is impracticable for exploring many parameters and actor behaviours, we have used agent-based modelling to explore this relationship. Compared to other methods, agent-based modelling is particularly suitable for studying complex cooperation dynamics among firms (Bonabeau 2002; Giannoccaro 2015). To properly capture real-world dynamics of interactions among ISN firm representatives, we have utilized a participatory modelling process in multiple real-world case studies.
Background
Following the key elements indicated above, this section discusses the importance of each firm’s perspective, the importance of modelling all stages of industrial symbiosis implementation and the importance of understanding how actor behaviour affects network performance.
The firm’s perspective
In self-organising industrial symbiosis, companies are the key players determining implementation dynamics (Tao et al. 2019). Each company plays at least one, but possibly more roles, such as waste supplier or processor (Mulder et al. 2018). Economic costs and benefits firstly accrue to the firms, and then to the network (Chertow 2000). When costs for individual firms are too high, or their benefits too low, they tend to pull out, resulting in a higher probability for other firms to leave the network. This failure phenomenon has a serious negative impact on survival probabilities of ISNs (Wang et al. 2017; Zeng et al. 2013). ISN dynamics are strongly determined by the decisions of individual firms (Tao et al. 2019). Hence, reasoning from the individual firm’s perspective is crucial to shape ISNs towards a robust state.
Modelling all ISN implementation stages
The literature suggests that the development of ISNs should be considered as a process based on broad economic, environmental and social aspects (Chertow & Ehrenfeld 2012; Lambert & Boons 2002). Based on the experience of ISN firms, Tao et al. (2019) developed such a broad ISN implementation framework from the perspective of firms. According to this framework, ISN firms go through the following stages: [1] awareness, [2] planning, [3] negotiation, [4] implementation and [5] evaluation. Existing studies that model ISNs, however, address the implementation stages only partially. Zhu & Ruth (2013, 2014) explored ISN evolution under different external disruptions and institutional settings. Mantese & Amaral (2017, 2018) used an ABM to study ISN indicators. Bichraoui et al. (2013) explored several cooperation and learning scenarios in the context of ISNs. Albino et al. (2016) explored the role of contracts. These papers all touch upon ISN implementation stages 2, 4 and 5, excluding the awareness and negotiation stages. Zheng & Jia (2017) explore opportunities for closing loops through using innovation diffusion theory in their model. This work includes the awareness stage but excludes negotiation.
Some existing ABMs regarding ISN development include negotiation but exclude other stages such as the awareness and/or evaluation stage. Examples of these studies are the energy system model by Batten (2009), the industrial coal system model by Gang et al. (2014), the biogas network model of Yazan et al. (2018), the strategic cooperation model by Yazan et al. (2020), and the construction material recycling network model by Knoeri et al. (2014).
Actor behaviour
The behaviour of actors in firms plays an important role in ISN formation, development and survival. Among others, Krueger Jr. et al. (2000) show that representatives of firms that engage in industrial symbiosis act as entrepreneurs and tend to behave in a planned and informed way. The Theory of Planned Behaviour (TPB) proposes a model that describes how individual actors can make informed decisions (Ajzen 1991). In TPB, actors show a behaviour which is described by three variables: the Attitude (abbreviated as \(A\)), the belief of other actors’ approval called the Subjective Norm (SN), and the perception of being able to implement their intentions, the Perceived Behavioural Control (\(PBC\)). According to Ajzen (1991), the Behavioural Intention (\(BI\)) of an actor, encapsulates \(PBC\), \(A\) and \(SN\). In addition, \(BI\) is an indicator of behavioural performance (\(B\)), if the behaviour can be decided as planned (Ajzen 1991). TPB is regarded as a significant predictor of entrepreneurial intentions and behaviour (Iakovleva & Kolvereid 2009; Kautonen et al. 2013), and has therefore been used in many studies to clarify this behaviour (e.g., Iakovleva & Kolvereid 2009; van Asselt et al. 2012). It is also used to study the firm’s efforts to take environmental measures (Sánchez-Medina et al. 2014), and to explore the firm’s readiness towards the circular economy (Singh et al. 2017). Ghali et al. (2017) show that TPB can be used to model the development of self-organised industrial symbiosis as randomly pre-defined synergies between pairs of actors.
Knowledge gap, study objectives and contribution
Interest in the effect of actor behaviour on the ISN evolution is growing among ISN practitioners and researchers. Echoing the recommendations in research by Ghali et al. (2017), there is a need for comprehensive models that enable us to study ISN dynamics and failure mechanisms from both behavioural as well as contextual perspectives.
Our study brings together theory from the fields of behavioural sciences and industrial symbiosis into an agent-based model (ABM). Since ISNs involve real world stakeholders, the ABM is not only grounded on literature findings, but also on discussions with stakeholders in our case studies to increase the realism and verifiability of the model narrative, the chosen variables and inputs. Thus, we show how an agent-based modelling and simulation approach allows us to study the effect of behaviour across all ISN implementation stages of Tao et al. (2019).
Conceptualising a Model Using Case Studies
We executed three in-depth case studies with stakeholders in ISNs in Amsterdam, the Netherlands. Each case involves the exchange and processing of organic waste within collectives of companies. Organic waste treatment is particularly interesting for our study, since it entails a changing seasonal supply quantity, physical degradation of the waste, and a heterogeneous chemical composition. This all imposes a dynamic supply in terms of quantity and suitability for the transformation process from waste to product. In each initiative, the participants not only wanted to know how their waste could be turned into valuable resources, they also wanted to know to what extent the behaviour of potential partners in the ISN would increase or decrease the robustness of the ISN.
The first case involves a large-scale symbiosis network of around 700 hectares of agricultural area, situated directly in the polders at the outskirts of Amsterdam. The participating companies consist of 16 firms, such as small-scale arable farmers, livestock farmers, fruit growers, gardeners, allotment gardens, hospitality businesses, and offices in a nearby business park. The publicly owned land is maintained by companies in the area. Annually, thousands of tonnes of organic material, mainly grass, reed and leaves, are removed from the area as waste. The companies are members of a business association, which aims for sustainable entrepreneurship. Some prominent members of the association set up a composting collective during the time we performed our research. Since then, the collective allows for the storage and processing of \(600\) \(m^{3}\) of organic materials (Mulder et al. 2018).
The second case involves a small-scale urban agriculture area focusing on sustainable food production and recreation. The area is situated in a former sports park area at the north side of Amsterdam. Along with other firms, small scale hospitality businesses, urban farmers, a beer brewer, a consultancy firm, a beekeeper, a carpenter and a day care centre are in the area. The firms are part of a foundation that aims to be an example of circular economy practices. In the area, yearly tens of tonnes of organic materials, consisting mainly of leafy greens, pruning residuals, and brewers’ grains leave the area. Some small compost heaps have been set up to handle these residual streams and to produce soil improvement material for their own use (Mulder et al. 2018).
The third case involves a business park in the former wharf area at the north side of Amsterdam’s waterfront, the IJ. In the area, a foundation represents a few hundreds of SMEs in the creative and hospitality industry. A smaller number of companies is also represented by an energy cooperation, aiming for local and renewable energy production. A few years ago, the foundation performed a study to explore the possibilities of setting up a network for anaerobic digestion (or bio-digestion), to process the organic residuals into biogas. However, the biogas network never took off. The involved participants considered the network to be too small to establish a robust network (Mulder et al. 2020).
In all cases, we gathered information about waste streams, needs and motivations through stakeholder interviews. In the first two case studies, we developed a serious game in which stakeholders played their own role in the network, and in which they had to set up new ways of connecting residual waste streams with their needs. We used the game and interview data to create the model narrative, describing how stakeholder awareness was raised, how possible synergies were planned, how negotiations took place, how deals were closed, and how the synergy was implemented (Mulder et al. 2018). The game was also used to cross-check the interview data concerning demand and supply, which was used to parameterize the simulation. We iteratively conceptualized, formalized, implemented and verified the model, using the participatory method as proposed in earlier work (Lange et al. 2017). In addition to the case study data, we used literature regarding the ISN implementation stages, bilateral negotiation tactics and planned behaviour to set up the model narrative, which was calibrated with stakeholders, market experts and peers in participatory workshops and interviews. Data from the first case study was used to define the moderating variables for this paper’s experiments regarding TPB.
Model
In this section, we briefly present our conceptual model and the agent-based model. An extensive description using the ODD protocol by Grimm et al. (2020), including source codes, flowcharts, input data, results and analysis information can be found in the repository (Lange et al. 2021): https://doi.org/10.25937/dt95-xk35.
Conceptual model
Figure 1 shows an overview of the conceptual model and how it is related to the ISN implementation stages as proposed by Tao et al. (2019).
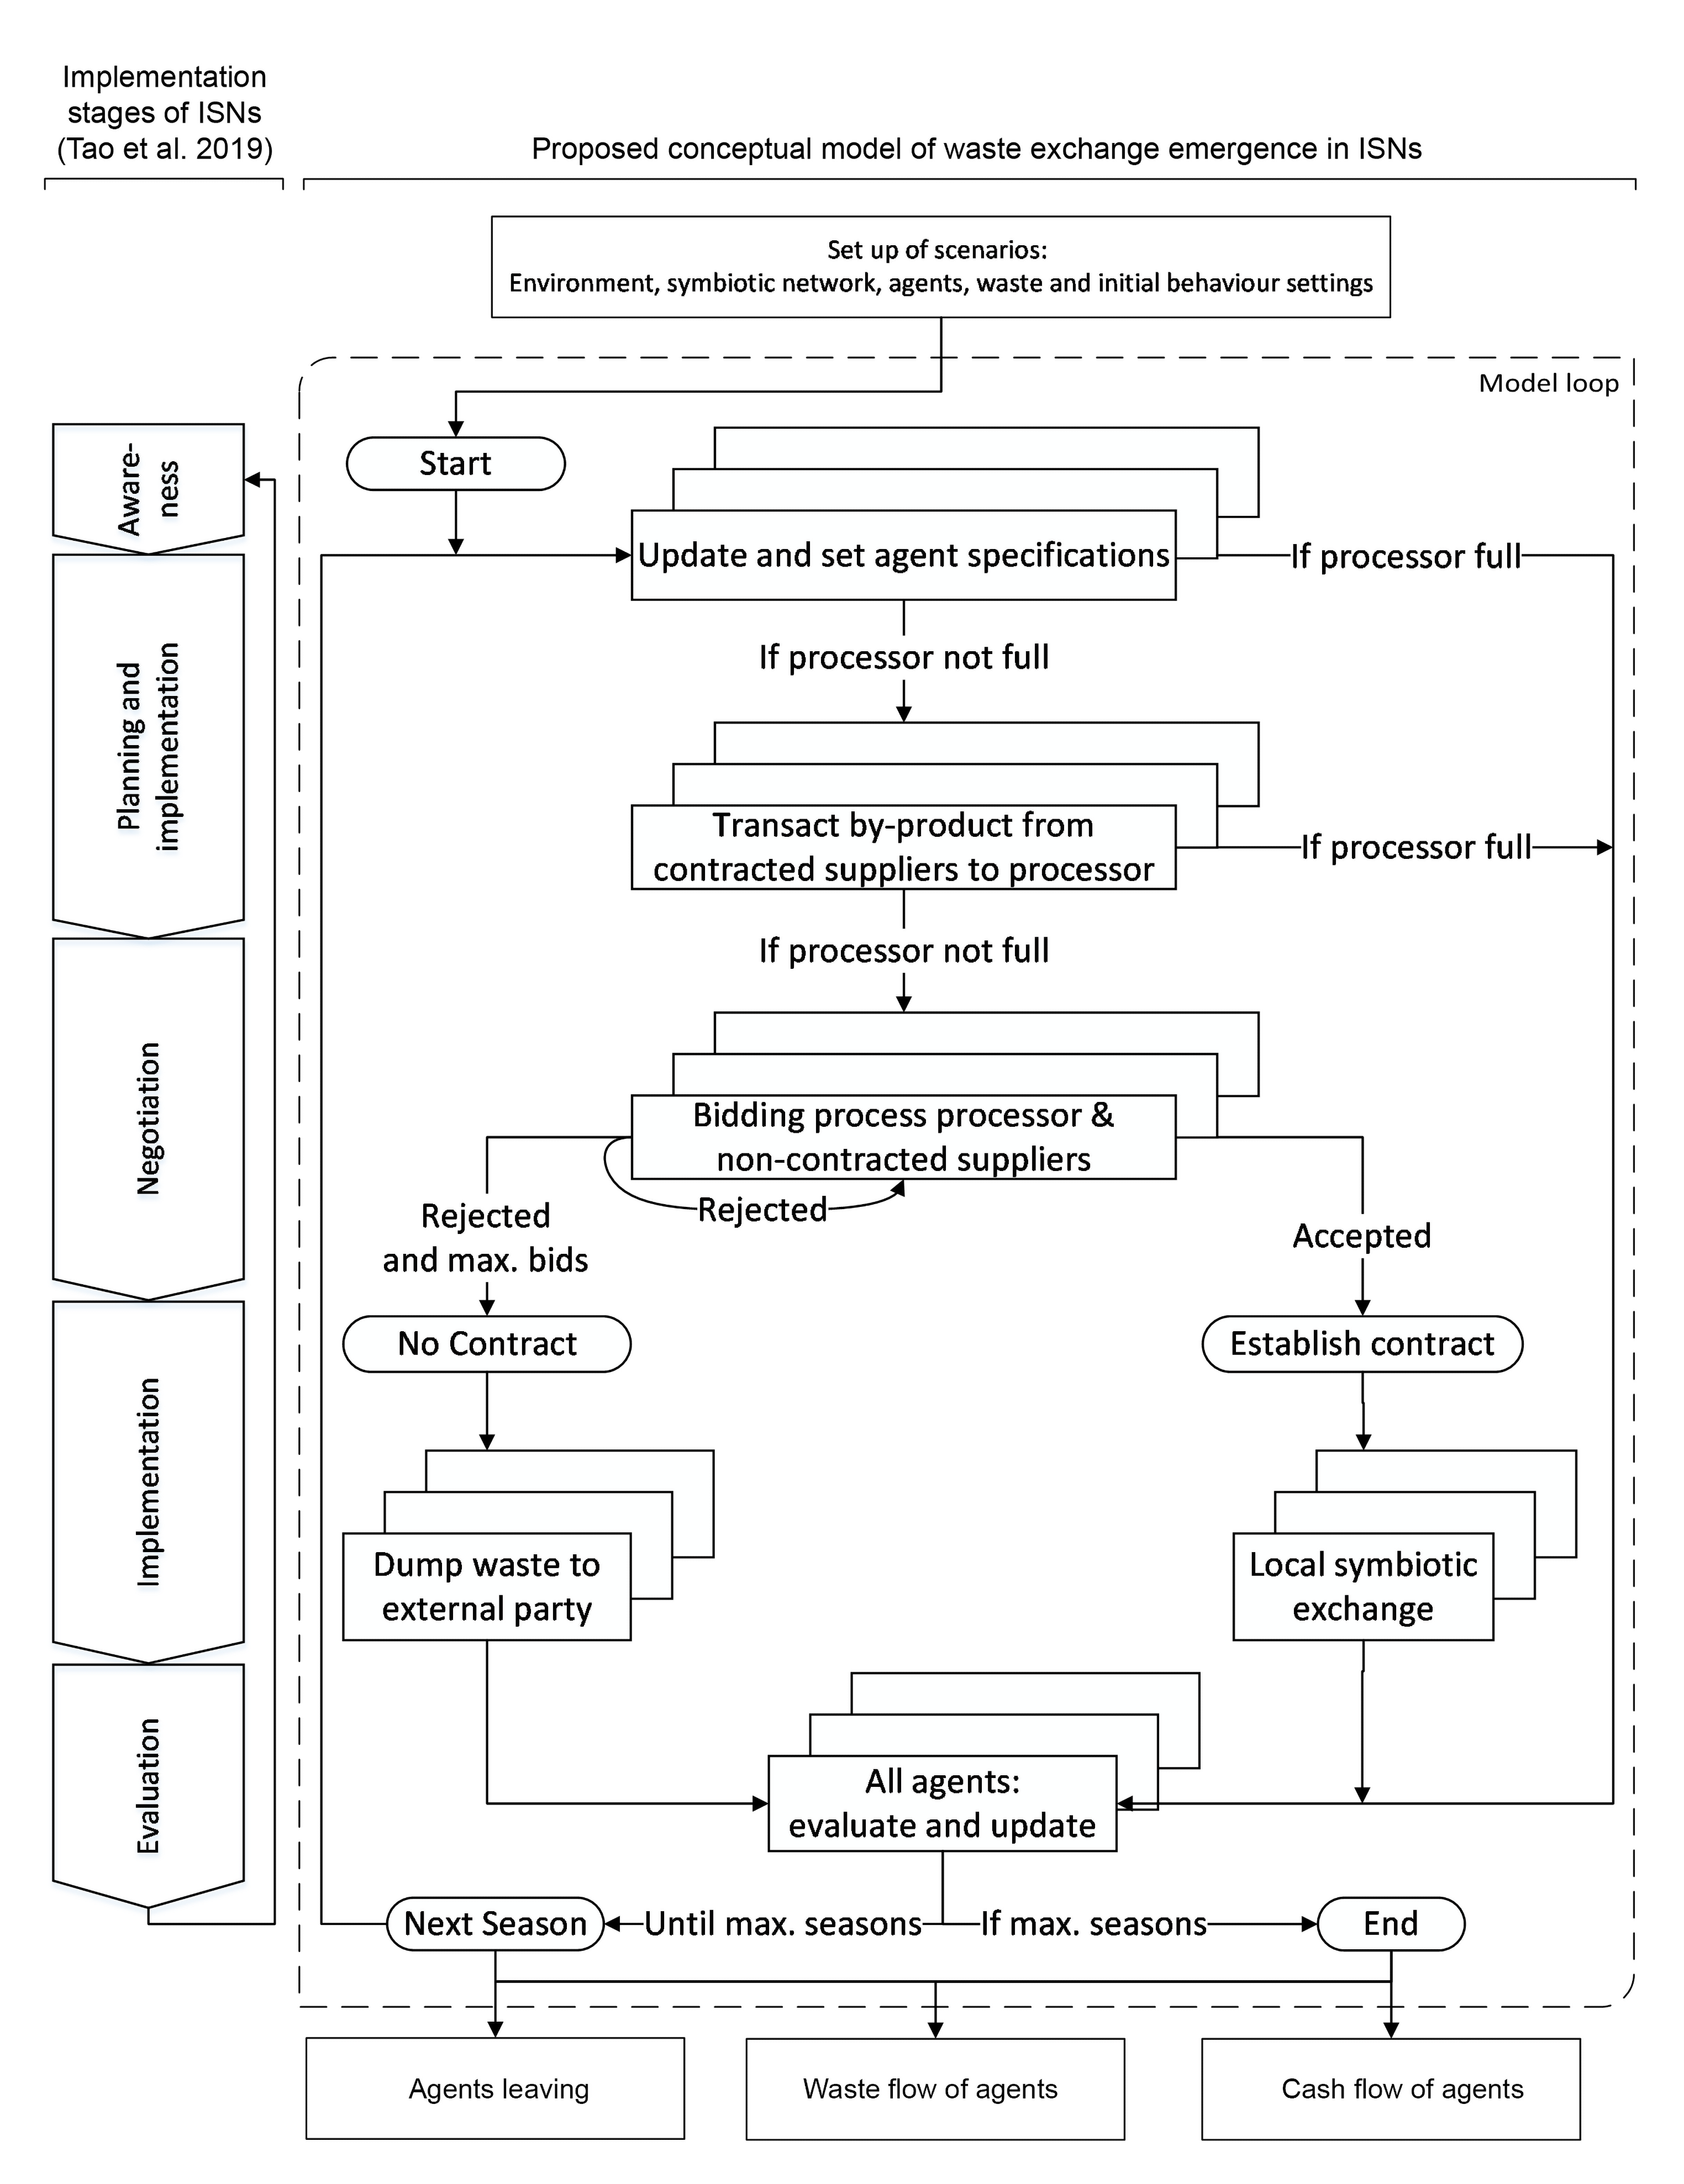
The case studies involved local exchanges and processing as opposed to bringing waste to a centralised incinerator. Hence, three types of social agents are implemented in the model: the waste suppliers (WS), the local waste processor (WP) and the external waste incinerator (WI). The social agents interact during (de-)implementation of symbiosis.
The awareness stage consists of waste creation by the suppliers, and determination of the value of the waste. The planning stage comprises composting and selling compost by the waste processor. In addition, the suppliers that already have a contract with the local processor deliver the waste according to the contract. An important restriction in the model is the maximum capacity of the local processor, which may for example be imposed by a hygiene policy. If the processor is not full yet, the waste processor agent invites supplier agents to negotiate for a new contract. If an agreement is concluded, this new contract directly results in waste exchanges between the waste supplier and the processor during the implementation stage. Another important factor is waste quality, in our model defined as “the fitness to process the waste”. Only when the waste quality is high enough, the processor agent decides to use the waste for composting. In the final stage, evaluation, the waste supplier agents and the processor agent evaluate the outcomes and update their technical and behavioural parameters.
Model assumptions (based on the cases):
- Each social agent represents one actor role. This means that in our model, the actors cannot be represented by different agents.
- Negotiations are bilateral.
- Communication between suppliers and processor is honest and transparent.
- Both parties agree upon the quality and quantity of the waste. However, the value of the waste is perceived differently.
- There are no intruders from outside the ISN. Hence, there is no network growth.
- WP and WS are allowed to leave the network. They do so, when they consider the operational or economic results of symbiosis to be insufficient. External factors, such as bankruptcies, do not play a role in leaving the network.
- Since the physical distances are less than 5 km, we assume that these distances are negligible. Transportation costs or other boundary conditions that may occur by logistics are therefore not modelled.
- After breaking open a fixed contract with WI, the waste supplier is allowed to negotiate and establish a contract with WP at any time.
- Transaction of waste to WI and WP is unhindered and flawless according to the contract. The contract between WS and WP allows WS to deliver a flexible amount of waste each season, up to a maximum agreed amount of waste. This maximum amount is based upon the amount of accepted waste at the time the contract was established.
- When a contract is established, WP always accepts the agreed amount of waste. Based on capacity and waste quality WP may redirect the waste to the incinerator.
- If WS is able to deliver more waste than agreed upon in the contract with WP, WS may enter another round of negotiations to try to establish an additional contract.
- After the contract between WS and WP expires, WS has to renegotiate a new contract with WP.
- Contracts with WI make use of the waste market price.
- Contracts with WI do not include a maximum agreed amount of waste.
- All ripe compost is sold at a fixed market price.
The model allows for simulating this process with or without Theory of Planned Behaviour (TPB) algorithms to study the effect of planned behaviour. The behaviour of interest in this particular case is described according to Ajzen’s TACT elements (Ajzen 2002 p. 2): implementing a symbiotic link to exchange waste for composting during the next season(s), preferably for the creation of one’s own economic benefits. Figure 2 shows how the different TPB elements should be interpreted for this case.
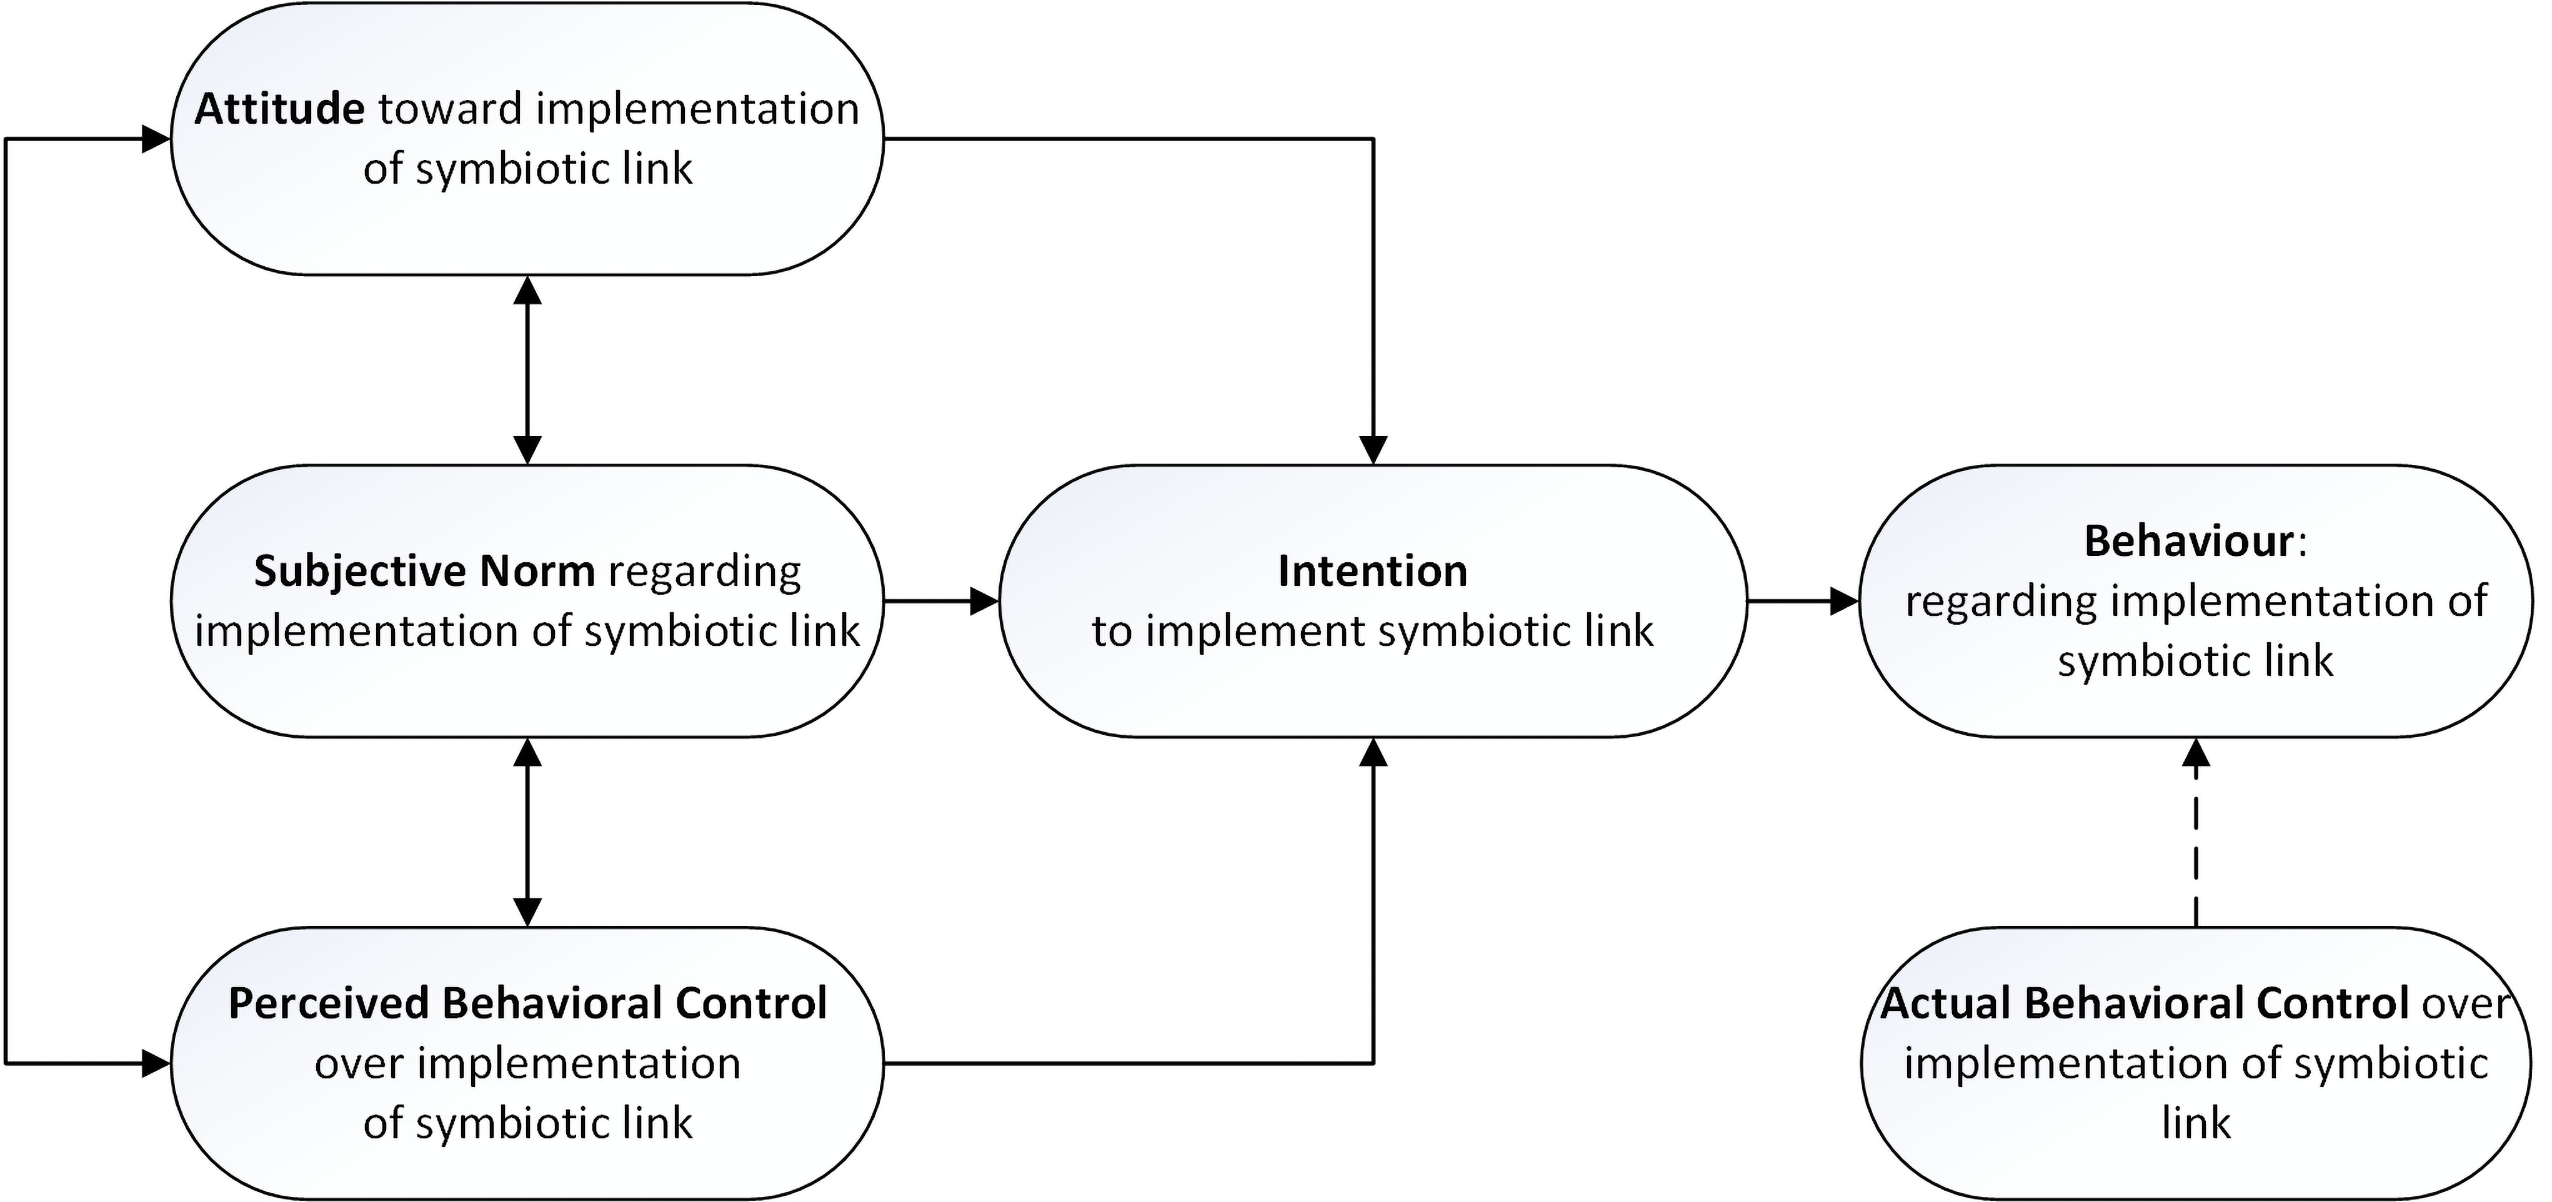
Based upon interviews with case study participants and from the literature, i.e., Chertow (2000), we assumed that symbiosis primarily aims to create competitive advantage. Thus, the model focuses on the effect of TPB on the economic results, and vice versa, i.e., the effect of evaluating the economic outcomes on the behaviour of interest. In the model, each agent’s attitude, control belief and subjective norm value therefore affects the intention and actual behaviour of actors during the negotiation stage. In addition, the individual economic outcomes are assumed to influence the agent’s attitude, control beliefs and subjective norm during the evaluation stage.
Agent-Based Model
Based on the conceptual model, the ABM was constructed and verified according to van Dam et al. (2013 p. 98).
Given the purpose of this study, the TPB parameters can be adjusted freely to test different types of agent behaviour, and we also allow for model runs without this TPB implementation. The waste incinerator (WI) acts as the infinite sink of all waste flows in the external environment, so the social behaviour of WI is not included.
The model dynamics and outcomes are also affected by contextual factors and organisational design (Lange et al. 2017). The organisational design is modelled as technological and operational parameters, such as quality control, quantity control, or contract conditions.
Performance indicators in this study are the cash flows of WS and WP, and the network survival. Based on the experience of the case study participants, we considered a network to be robust, when it sustains for a minimum of 10 years.
Waste supplier and processor agents that leave the network may cause a network to fail. Agents leave the network after many cumulative negative cash flows. The processor agent can also leave the network when the input is too low for half a year. Cumulative losses shape agent memory in our model: when an agent makes profit due to local waste exchanges, the chance of leaving reduces over time, since the agent ‘remembers’ that it previously made profit.
The recursive model narrative, based on the implementation stages in Figure 1, and including the TPB implementation, is as follows:
- Awareness stage: waste suppliers first produce waste and determine the waste value. This depends on the type of organisational design, which is set either to waste-as-waste, or waste-as-by-product. When waste is treated as waste, the local waste value is determined by the global waste market price, the waste quality and the local availability during the season. We assume that when waste is treated as a by-product, it is seen as a source of income for the supplier. In that case, the price of a substitute product is used instead of the waste market price and efforts are made by WS to increase the waste quality, resulting in an overall increase of economic value. Waste quality and quantity are set as normally distributed values based on the case studies.
- Planning & implementation stage:
- The waste processor produces compost and sells it, see Equation 1:
in which \(CF_{WP}\) is the cash flow for WP, \(P_{Compost}\) is the market price for compost per mass unit [Euro/tonne], \(\sum M_{CB}\) is the sum of masses of ripe compost batches (heaps), \(\sum C_{Proc}\) is the processing costs per mass unit [Euro/tonne] and \(A_{IO}\) is the mass input-output ratio of conversion process. Each period, the compost heap ripens. Since part of the mass in the composting process is turned into gasses that are emitted into the air (Dhamodharan et al. 2019), the mass of the heap decreases according to a set input-output ratio. When the age of the compost batch (CB) is equal to the retention time, the batch is ripe and sold at the market price.\[ CF_{WP} = (\sum M_{CB} * P_{Compost}) - (\sum M_{CB}* \frac{C_{Proc}}{A_{IO}})\] \[(1)\] - Transaction processes from contracted suppliers. WS is allowed to deliver less waste than agreed upon in the contract, but not more. Therefore, WP asks contracted suppliers if and how much they can deliver according to the contract. WP then checks the quality of the waste offered. To do so, WP compares the waste of the contracted suppliers, by calculating which transaction leads to the highest economic waste stock value as perceived by WP (\(WV_{WP}\)). \(WV_{WP}\) is determined by the actual waste quality (\(Q_{WS}\)) and quantity (\(M_{WS}\)) each WS can offer at that point in time, see Equation 2:
The contracted supplier with the highest \(WV_{WP}\) is allowed to make the first transaction. Next, the contracted WS with the second highest \(WV_{WP}\) is allowed to transact waste to WP. This process continues until all contracted suppliers deliver their waste according to the contract. The cash flow for WS is then calculated, see the transaction process equations in Table 1. Revenues and avoided costs are calculated as relative cash flows, compared to bringing waste to the incinerator. During model setup, the cash flows are set at 0.\[ WV_{WP} = Q_{WS} * M_{WS}\] \[(2)\]
In Table 1, \(A_{IO}\) is the processor mass input-output ratio, \(CF_{WP}\) is the cash flow of WP in Euros, \(CF_{WS}\) is the cash flow of WS in Euros, \(CS_{WS}\) is the cost share ratio assigned to WS [-], \(M_{WS}\) is the waste mass quantity from WS in tonnes, \(M_{WS,WP}\) is the waste mass flow from WS to WP in tonnes, \(M_{WP,WI}\) is the waste mass flow from WP to WI in tonnes, \(P_{contract}\) is the agreed price for local waste treatment per mass unit in Euros/tonnes, \(P_{waste}\) is the market price for waste treatment per mass unit in Euros/tonnes and \(RS_{WP}\) is the revenue share ratio assigned to WP [-].Table 1: Cash flow equations during waste transaction for the two different organisational designs. Agent Organisational Design Contract with incinerator Eq.nr. Cash flow calculation Waste processor Waste-as-waste WI payment per mass unit (3) \(CF_{WP} = M_{WS}* P_{contract} - \\ M_{WS} * P_{contract} * A_{IO} * (1 - RS_{WP}) + \\ M_{WS,WP}* P_{waste} * (1- CS_{WS}) - \\ M_{WP,WI} * P_{waste}\) WI payment per season (4) \(CF_{WP} = M_{WS} * P_{contract} - \\ M_{WS} * P_{contract} * A_{IO} * (1-RS_{WP})\) Waste-as-by- product WI payment per mass unit (5) \(CF_{WP} = - (M_{WS} * P_{contract}) - \\ M_{WS} * P_{contract} * A_{IO} * (1 -RS_{WP}) + \\ M_{WS,WP}* P_{waste} * \\ (1- CS_{WS}) - M_{WP,WI} * P_{waste}\) WI payment per season (6) \(CF_{WP} = - (M_{WS} * P_{contract})- \\ M_{WS} * P_{contract} * A_{IO} * (1-RS_{WP})\) Waste supplier Waste-as-waste WI payment per mass unit (7) \(CF_{WS} = -(M_{WS} * P_{contract}) + \\ M_{WS} * P_{contract} * A_{IO} * (1 - RS_{WP}) + \\ M_{WS,WP}* P_{waste} * CS_{WS}\) WI payment per season (8) \(CF_{WS} = -(M_{WS} * P_{contract}) + \\ M_{WS} * P_{contract} * A_{IO} * (1 - RS_{WP})\) Waste-as-by- product WI payment per mass unit (9) \(CF_{WS} = M_{WS} * P_{contract} + \\ M_{WS} * P_{contract} * A_{IO} * (1-RS_{WP}) + \\ M_{WS,WP}* P_{waste} * CS_{WS}\) WI payment per season (10) \(CF_{WS} = M_{WS} * P_{contract} + \\ M_{WS} * P_{contract} * A_{IO} * (1-RS_{WP})\) - All transacted waste is accepted by WP. WS does not make (deliberate) mistakes in the delivery and WP does not reject any waste of contracted suppliers. However, not all accepted waste is necessarily used for processing. During the waste acceptance process, WP first makes two decisions:
- WP determines whether the quality of the transacted waste exceeds a given threshold. If the quality is too low, the waste is redirected to the waste incinerator (WI).
- Next, WP determines whether its capacity is expected to be exceeded. WP only fills the compost heap up to the maximum capacity. If there is still some waste left, WP redirects it to WI.
- At the end of this step, WP’s cash flow is calculated, see the transaction process equations in Table 1. The revenues and avoided costs are calculated as relative cash flows, as these are compared to transactions with WI.
- The waste processor produces compost and sells it, see Equation 1:
- Negotiation stage:
- Based on its capacity, WP determines whether new suppliers are required. If so, WP checks which suppliers might potentially be interesting partners to negotiate with. The suppliers that are not bound to a fixed contract with the incinerator, are asked how much waste they have available, and at what quality. Again, WP determines which supplier is most suitable by calculating the potential economic value of the supplier’s waste stock, see Equation 2.
- A bilateral negotiation is started with the supplier with the best waste stock value. The negotiation process consists of two parties making alternating offers. Bidding occurs according to time-dependent negotiation, with a linear concession curve (Hou 2004). In the waste-as-waste design, the model treats the waste supplier as buyer, and the processor as seller of a waste collection service. In the waste-as-by-product design, the model treats the waste supplier as seller, and the processor as a buyer of resource materials, see Table 2.
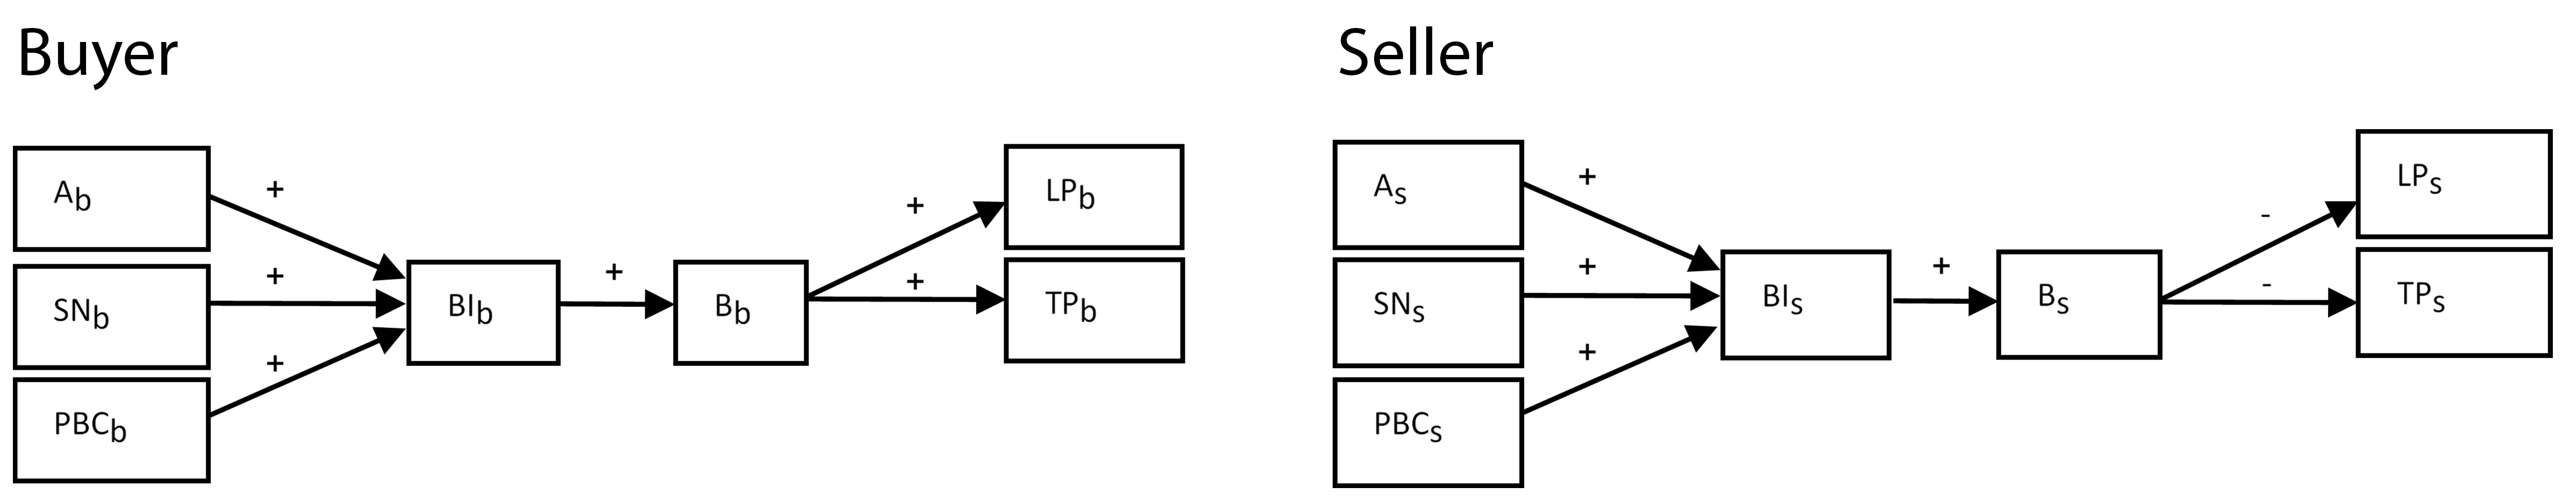
During negotiations, both buyer and seller determine their limit price, which is based on the best alternative to a negotiated agreement (BATNA). When TPB is turned on, the behaviour value (\(B\)) modifies the limit price, see Figure 3 and Table 3. With \(B \geq 0.5\), a negotiating agent behaves more in favour of the opponent, trying to positively influence the achievement of local waste exchanges. With \(B < 0.5\), the agent negotiates more firmly, negatively influencing the achievement of local waste exchanges. The target price depends on the limit price. We assumed that the target price of sellers is 50% higher than the limit price, aiming for higher income. For buyers, the target price is assumed to be 50% lower than the limit price, aiming for lower purchasing costs.Table 2: Different agent roles and model algorithms for the waste-as-waste and waste-as-by-product designs. Waste-as-waste Waste-as-by-product Waste processor Role Seller (of waste management services) Buyer (of resources for production process) Aim Target price as high as possible Target price as low as possible Waste supplier Role Buyer (of waste management services) Seller (of resources for production process) Aim Target price as low as possible Target price as high as possible Negotiation process 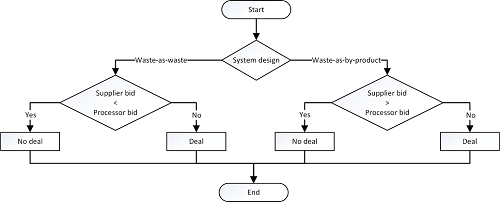
After the first bid, the opponent decides to accept or reject the offer by comparing it to its own bid. If there is no deal, both agents make a new offer, which is one step closer to the limit price. WS and WP continue to negotiate until either the maximum number of bids is reached, or a contract is established.Table 3: How the Theory of Planned Behaviour is integrated in the model’s time-dependent negotiation. Eq.nr Main variable Code or equation Values Explanation (11) Behavioural Intention
(\(BI\))\(BI = (A * W_{A} ) +(PBC * \\ W_{PBC}) + (SN * W_{SN})\) \(0 \leq A \leq 1; \\ 0 \leq PBC \leq 1;\\ 0 \leq SN \leq 1\) Inspired by Ajzen (2002) (12) Behaviour
(\(B\))If else \(BI \geq 0.5\)
[let A ((10 + random 11)/10)
set B \(((A * (BI - 0.5) ^ {2}) + 0.5)\)]
[let A-2
set B ((\(A * (BI - 0.5)^{2}\)) + 0.5))]\(0 \leq BI \leq 1\) Sheeran (2002) points out that here is a difference between intentions and behaviour. To address this gap, Webb & Sheeran (2006) showed that a medium-to-large change in intention leads to a small-to-medium change in behaviour. A small change in intention hardly leads to behaviour change. Negative intentions are more correlated to negative behaviour, than positive intentions to positive behaviour. Therefore, we modelled the relationship between \(BI\) and \(B\) as a randomized quadratic equation for positive \(BI\) values and a quadratic equation for negative values. (13) Buyer Limit Price
\((LP_{B})\)\(LP_{B}= V_{W} + (V_{W} * (B_{B}-0.5))\) \(0 \leq B_{B} \leq 1\) \(VW\): Market value of waste or by-product (Euro/tonne)
\(B_{B}\): Behaviour value of buyer, inspired by Ajzen (1991)(14) Buyer Target Price
(\(TP_{B})\)\(TP_{B} = LP_{B}-0.5LP_{B}\) Assumption (15) Seller Limit Price
(\(LP_{S}\))\(LP_{S}= V_{W}-(V_{W}*\\ (B_{S}-0.5))\) \(0 \leq B_{S} \leq 1\) \(B_{S}\) Behaviour value of seller, inspired by Ajzen (1991) (16) Seller Target Price
(\(TP_{S}\))\(TP_{S}=LP_{S} + 0.5 LP_{S}\) Assumption - The negotiation process is repeated for all potential WS partners, unless the compost heap is full.
- Implementation stage:
- When WP and WS reach an agreement, they establish a contract. The contract stipulates an agreed maximum waste delivery, price per mass unit and a contract duration.
- After establishing the contract, waste is transacted according to the contract. After this, monetary transactions take place. This process is the same as with contracted suppliers, see steps above and Table 1.
- All available waste that is not processed locally is sent to the waste incinerator WI.
- Evaluation stage:
- WS and WP evaluate the economic and operational outcomes (cash flows and use of the processor) and update TPB variables, based on evaluation variables (E), see Tables 4 and 5.
- Based on the outcomes, WS and WP decide whether they are still willing to participate in the ISN or not. WS and WP can leave the ISN when they lose too much money, which is set by input parameters WSStepOutMoney and WPStepOutMoney. WP can also leave when the amount of input waste remains too low for a certain period of time (input parameter WPStepOutEmpty). With TPB algorithms turned on, WS and WP do not directly leave the initiative: they first adjust their TPB behaviour value as a result of the aforementioned economic or operational outcomes. This is done by lowering the behaviour value (using parameters WSEBFailure for WS and WPEBFailure for WP). The resulting behaviour value is then compared to a behaviour threshold of each agent(WSStepOutB for WS and WPStepOutB for WP).
- If WP leaves, the ISN fails entirely.
- Existing contracts expire after a set period. We assume that a new contract can only be established after acceptance in a new bidding process.
| Agent | Evaluation of periodic outcome per agent | New TPB value after evaluation | Eq. nr. | |
|---|---|---|---|---|
| Waste supplier | No local waste exchange contract AND profit | \(A_{WS}= A_{WS} - E_{A,WS}\) | (17) | |
| \(BC_{WS} = PBC_{WS}+ E_{PBC_{WS}}\) | (18) | |||
| No local waste exchange contract AND loss | \(A_{WS} = A_{WS} + E_{A,WS}\) | (19) | ||
| \(PBC_{WS} = PBC_{WS} - E_{PBC, WS}\) | (20) | |||
| Local waste exchange contract AND profit | \(A_{WS} = A_{WS} + E_{A,WS}\) | (21) | ||
| \(PBC_{WS} = PBC_{WS}+ E_{PBC,WS}\) | (22) | |||
| Local waste exchange contract AND loss | \(A_{WS}= A_{WS} - E_{A,WS}\) | (23) | ||
| \(PBC_{WS} = PBC_{WS} - E_{PBC,WS}\) | (24) | |||
| Avg \(B_{Actors \in ISN} \geq SN_{WS}\) | \(SN_{WS} = SN_{WS} + E_{SN,WS}\) | (25) | ||
| Avg \(B_{Actors \in ISN} < SN_{WS}\) | \(SN_{WS} = SN_{WS} - E_{SN,WS}\) | (26) | ||
| Waste processor | Enough waste in processor | \(PBC_{WP} = PBC_{WP} + E_{PBC, WP}\) | (27) | |
| Not enough waste in processor | \(PBC_{WP} = PBC_{WP} - E_{PBC, WP}\) | (28) | ||
| Profit | \(A_{WP} = A_{WP} + E_{A, WP}\) | (29) | ||
| Loss | \(A_{WP} = A_{WP} - E_{A, WP}\) | (30) | ||
| Avg. \(B_{Actors \in ISN} \geq SN_{WP}\) | \(SN_{WP} = SN_{WP} + E_{SN, WP}\) | (31) | ||
| Avg. \(B_{Actors \in ISN} < SN_{WP}\) | \(SN_{WP} = SN_{WP} - E_{SN, WP}\) | (32) | ||
Simulation Experiments
We posed three questions to the model, to explore how and to what extent planned behaviour theory affects the model outcomes in terms of network robustness, and cash flow outcomes for the social agents:
- How does the modelled planned behaviour affect the network robustness?
- How does the modelled planned behaviour affect the cash flows for each individual ISN actor?
- How does the modelled planned behaviour affect the overall cash flow for the ISN as a whole?
In this section, we explain the input and output values in detail. In the next sections the experiment results, discussion and conclusions can be found.
Independent variables: Planned behaviour
We executed simulations with two types of independent input variable sets, see Table 5. The first input set does not employ the TPB algorithm (TPB OFF). The second input set includes the TPB algorithm to regulate the agents’ behaviour (TPB ON).
Given the scope of this study, and for the sake of conciseness, we only show experiments from the waste-as-waste design. We repeated each simulation 500 times to obtain statistical significance.
| Independent variable | Input set TPB OFF |
Input set TPB ON |
\(\sigma\) | Description |
| TPB? | FALSE | TRUE | n.a. | Determines whether to follow TPB algorithms or not |
| WSRNorm | 2 | n.a. | Standard deviation \(\sigma\) for randomizing \(PBC_{WS}\), \(A_{WS}\) and \(SN_{WS}\) | |
| initWSPBC | 0.5 | WSRNorm | Perceived behavioural control value of \(WS(PBC_{WS})\) | |
| initWSWFPBC | Random 1 to 7 | n.a. | Weight factor for \(PBC_{WS}\) | |
| initWSEPBC | 0.04 | 0.01 | Evaluation variable \(E_{PBC,WS}\), see Table 4 | |
| initWSAtt | 0.5 | WSRNorm | Attitude value of \(WS (A_{WS})\) | |
| initWSWFAtt | Random 1 to 7 | n.a. | Weight factor for \(A_{WS}\) | |
| initWSEAtt | 0.04 | 0.10 | Evaluation variable \(E_{A,WS}\), see Table 4 | |
| initWSSN | 0.5 | WSRNorm | Subjective norm value of \(WS (SN_{WS})\) | |
| initWSWFSN | Random 1 to 7 | n.a. | Weight factor for \(SN_{WS}\) | |
| initWSESN | 0.4 | 0.01 | Evaluation variable \(E_{PCB,WS}\), see Table 4 | |
| WSStepOutB | 0.25, 0.45 | n.a. | Behaviour based leaving threshold for \(WS\) to leave the \(ISN\) | |
| WSEBFailure | 0.3 | 0.1 | Agent behaviour reduction value | |
| WPRNorm | 2 | n.a. | Standard deviation \(\sigma\) for randomizing \(PBC_{WS}\), \(A_{WS}\) and \(SN_{WS}\) | |
| InitWPPBC | 0.5 | WSRNorm | Perceited behavioural control value of \(WP (PBC_{WP})\) | |
| InitWPWFPBC | Random 1 to 7 | n.a. | Weight factor for \(PBC_{WP}\) | |
| InitWPEPBC | 0.04 | 0.01 | Evaluation variable \(E_{PBC,WS}\), see Table 4 | |
| initWPAtt | 0.5 | WSRNorm | Attitude value of \(WP (A_{WP})\) | |
| initWPWFAtt | Random 1 to 7 | n.a. | Weight factor for \(A_{WP}\) | |
| initWPEAtt | 0.04 | 0.01 | Evaluation variable \(E_{A,WP}\), see Table 4 | |
| initWPSN | 0.5 | WSRNorm | Subjective norm value of \(WP(SN_{WP})\) | |
| initWPWFSN | Random 1 to 7 | n.a. | Weight factor for \(SN_{WP}\) | |
| initWPESN | 0.04 | 0.01 | Evaluation variable \(E_{SN,WP}\), see Table 4 | |
| WPStepOutB | 0.25; 0.45 | n.a. | Behaviour based leaving threshold for \(WP\) to leave the \(ISN\) | |
| WPEBFailure | 0.3 | 0.1 | Agent behaviour reduction value | |
In the TPB OFF input set, all TPB behaviour values are not applicable, since the model bypasses TPB algorithms.
In the TPB ON input set, the model simulates variations in initial agent behaviour with undetermined causes. Thus, we approximated a uniform distribution of the widest range of initial behaviour values (initWSB and initWPB) possible: between 0 and 1. We did so by setting PBC, A and SN at 0,5 and randomising these values with \(\sigma = 2\), and by randomly altering the accompanying weight factors from 1 to 7.
The chosen average values and standard deviations for evaluation parameters (initWSESN and initWPESN ) and leaving parameters (WSStepOutB, WPStepOutB, WSEBFailure and WPEBFailure) were determined by performing a sensitivity analysis and calibrating the outcomes based on information from case participants.
Moderating variables: Design and context
The moderating variables consist of organisational design (Table 1) and context variables (Table 5). The effect of changing the organisational design is not explored in this paper, and therefore the accompanying input variables were fixed. These values were based on the interviews with case participants.
| Variable | Value | Unit | Remark |
| Residue treatment | |||
| Waste-as-by-product? | False | [-] | Model assumption |
| Quality control | |||
| WSWQualRNorm | 0.3 | ||
| WPQualThresholdPerc | 0.5 | [-] | Model assumptions |
| WSQualPenalty? | false | ||
| Quantity control | |||
| WPMinProcThresholdPerc | 0.1 | [-] | Model assumption |
| WPProcThresholdPerc | 0.95 | [-] | Model assumption |
| MaxQuantityAllowed | 480 | [Tonnes] | Mulder et al. (2018 p. 54) |
| Leaving the network | |||
| WSStepOutMoney | -1500 | [Euro] | |
| WPStepOutMoney | -1500 | [Euro] | Model assumptions |
| WPStepOutEmpty | 2 | [Seasons] | |
| Contractual agreements ISN | |||
| Contract length | 1 | [Seasons] | |
| PercAvoidedWasteCosts2WS | 1 | [-] | Model assumptions |
| PercProductYield2WP | 1 | [-] | |
| Process technology | |||
| Compost retention time | 2 | [Seasons] | van der Wurff et al. (2016 p. 53) |
| I/Oratio active composting | 0.5 | [-] | Vlaco (2009 p. 5) |
| Composting costs per tonne | 33 | [Euro/tonne] | LCA-LCC tool by Mulder et al. (2020) |
| Negotiations | |||
| MaxOfferCounter | 5 | [Bids] | Model assumption |
| Variable | Value | Unit | Remark | |
| Existing contracts with incinerator | ||||
| WSWIMaxfixed | ||||
| ContactLenght | Random 0 to 4 | [Seasons] | Suez (2020) | |
| Contractual agreements with incinerator | ||||
| FlexMassWIContract? | True | [-] | Model assumption; WI charges per mass unit waste (Euro/Tonne) | |
| Market prices | ||||
| Cprice | 15* | Bruins en Kwast (2019) | ||
| BPprice | 0* | [Euro/tonne] | Model assumption | |
| Wprice | 40* | Bruins en Kwast (2019); Vereniging Afvalbedrijven (2013) | ||
| Waste supplier quantity | ||||
| Each waste supplier | Varying** | [Tonne/season] | Determined per waste supplier. From CVS, waste quantities from: Mulder et al. (2018) | |
| Waste quality variables | ||||
| Ditch cuttings | 0.55*** | [-] | ||
| Farmland Waste | 0.9*** | [-] | Model assumptions, based on type of waste in: Mulder et al. (2018) | |
Uncertain conditions were included in the simulations by randomising the context variables. Here, we explain why and how.
Some waste suppliers do not enter the ISN before their existing contract with the incinerator ends. Some suppliers are at the end of this contract, others halfway or at the beginning. To address this, the agents obtain a randomised contract duration with a maximum of 1 year during setup (Suez 2020). After that period, the contracts are terminable, and the supplier starts participating in the ISN negotiations.
Market prices are set according to a randomised normal distribution based on recent market prices (Bruins en Kwast 2019; Vereniging Afvalbedrijven 2013) to account for realistic market prices in the simulation runs.
The waste quantity and quality of each supplier is based on measurements and estimations by participants in the case studies of Mulder et al. (2018). To account for quantity variations, these values are used as an average value, and randomized according to a normal distribution with a standard deviation equal to 10% of the quantity at the beginning of every new season. The waste quality values are also randomized each calculation step (between 0, worst quality and 1, best quality). These values were based on qualitative data from our case study (Mulder et al. 2018), using a normal distribution (\(\sigma = 0.3\)). We would like to stress that these assumptions on waste quantity and quality fluctuations only apply to these cases.
Dependent variables: Network robustness and cash flows
ISN Robustness. In our simulation results, we define a network to be robust, when it is able to run for 10 years, without falling apart due to leaving agents. Thus, the experiments were run over 40 steps (1 step per season).
Individual cash flows. We have measured the cash flow outcomes of each supplier and processor. Every agent deals with different amounts of exchanged waste, and therefore we normalized the outcomes to cash flow per tonne of waste.
Average total cash flow for the ISN as a whole. To make a fair comparison among different network sizes, we expressed the total cash flow by normalizing it to average cash flow per tonne of waste per agent. The average cash flows in the TPB OFF runs were used as a benchmark. The average cash flow difference was calculated according to:
| \[ \Delta CF = CF_{TPB,ON} - CF_{TPB, OFF}\] | \[(33)\] |
By using this equation, we are able to compare the extent to which the TPB ON runs affect each agent’s average economic outcomes.
Results
Effect of planned behaviour on the network robustness
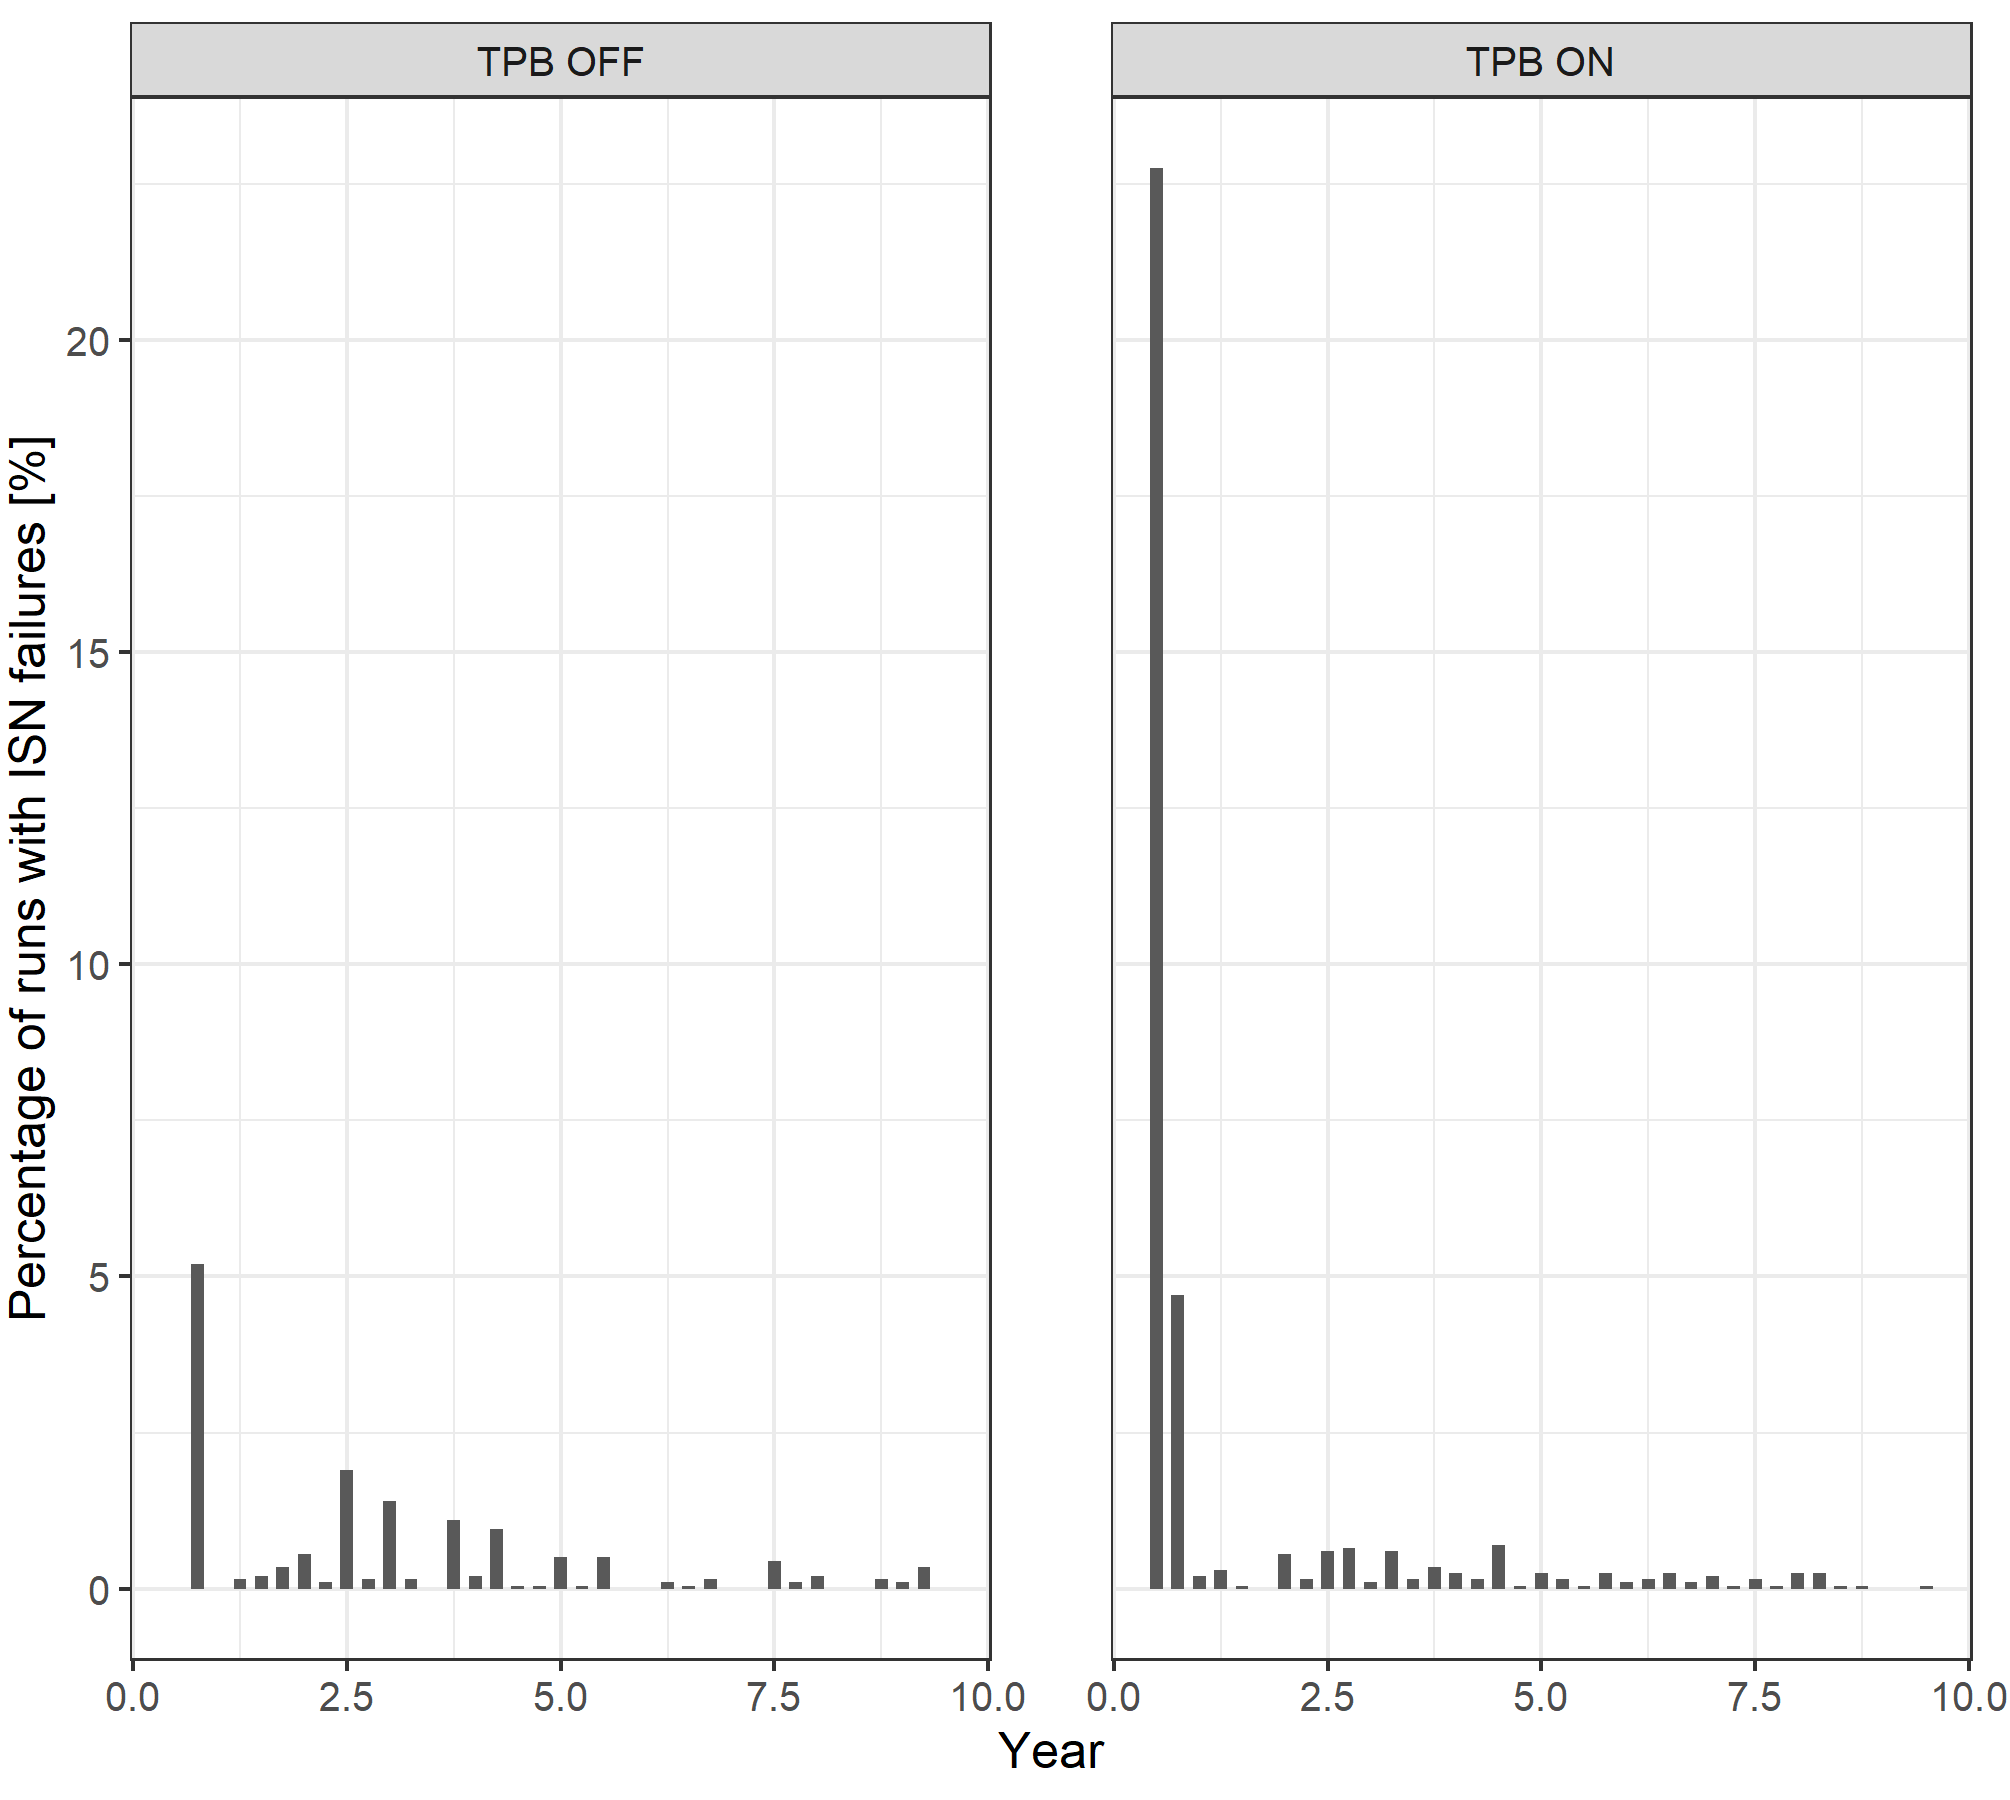
Figure 4 shows that the network has a higher chance of failure during the first seasons, and a lower chance of failure afterwards. This is particularly true for when TPB logic is applied.
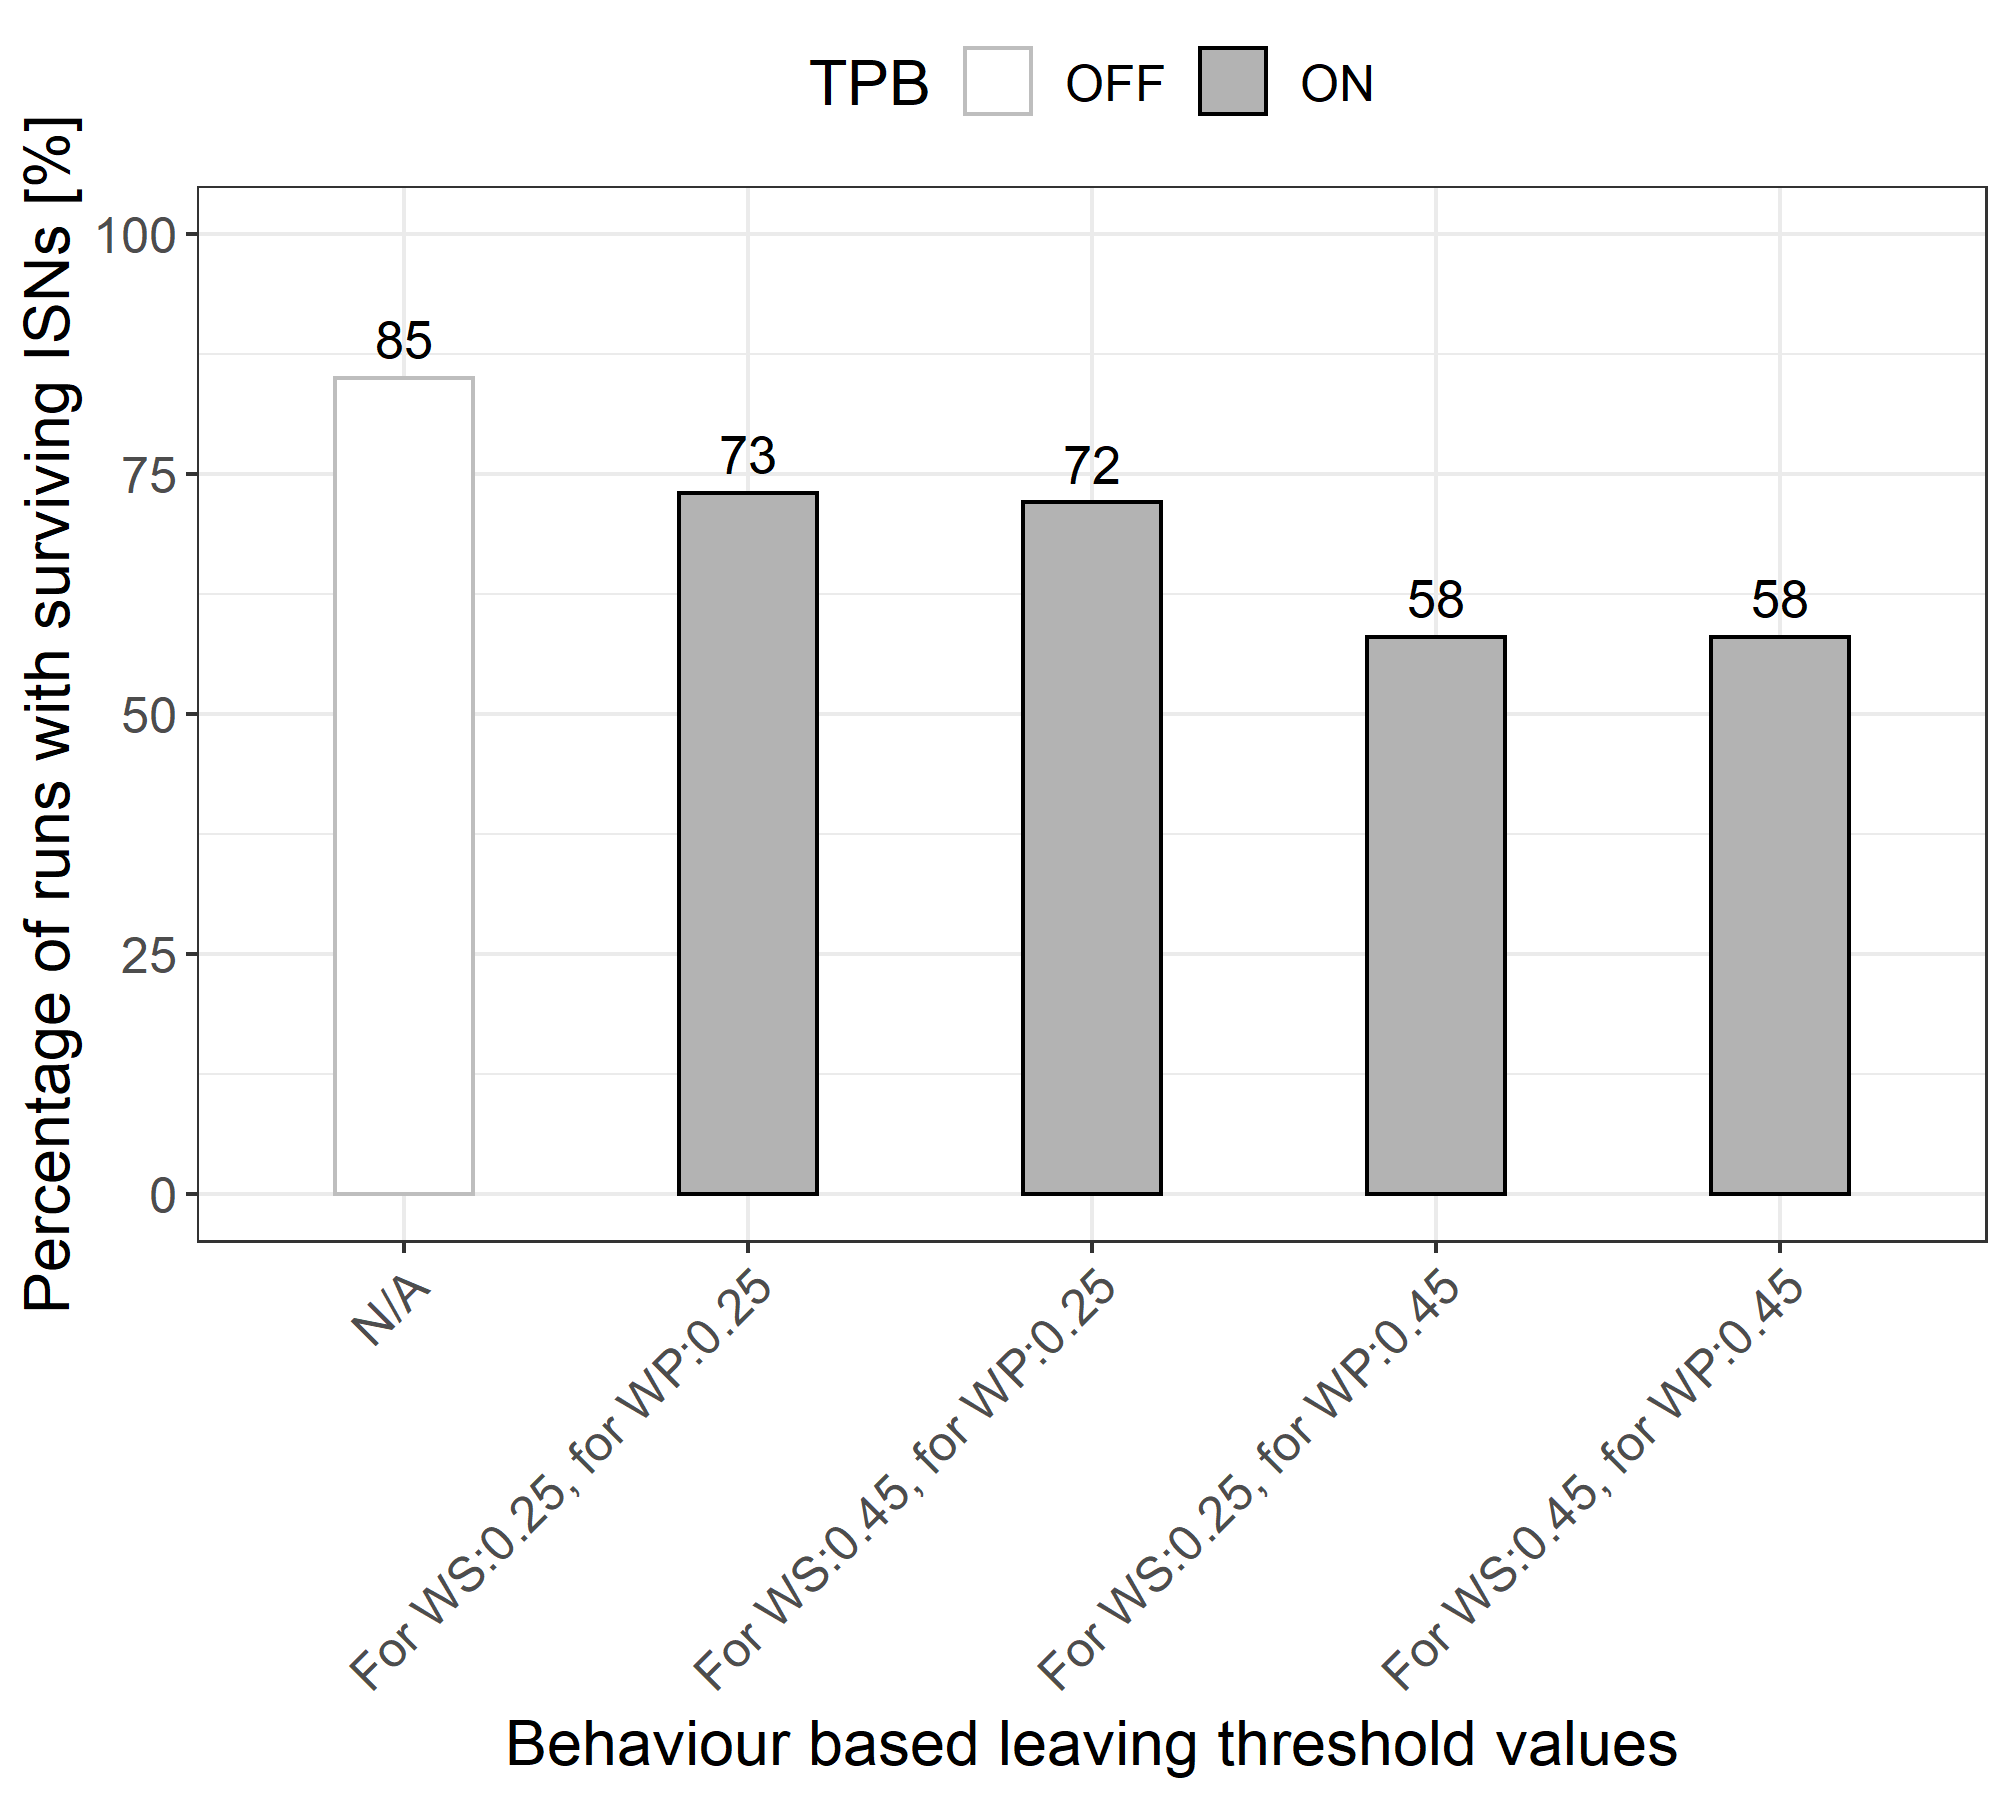
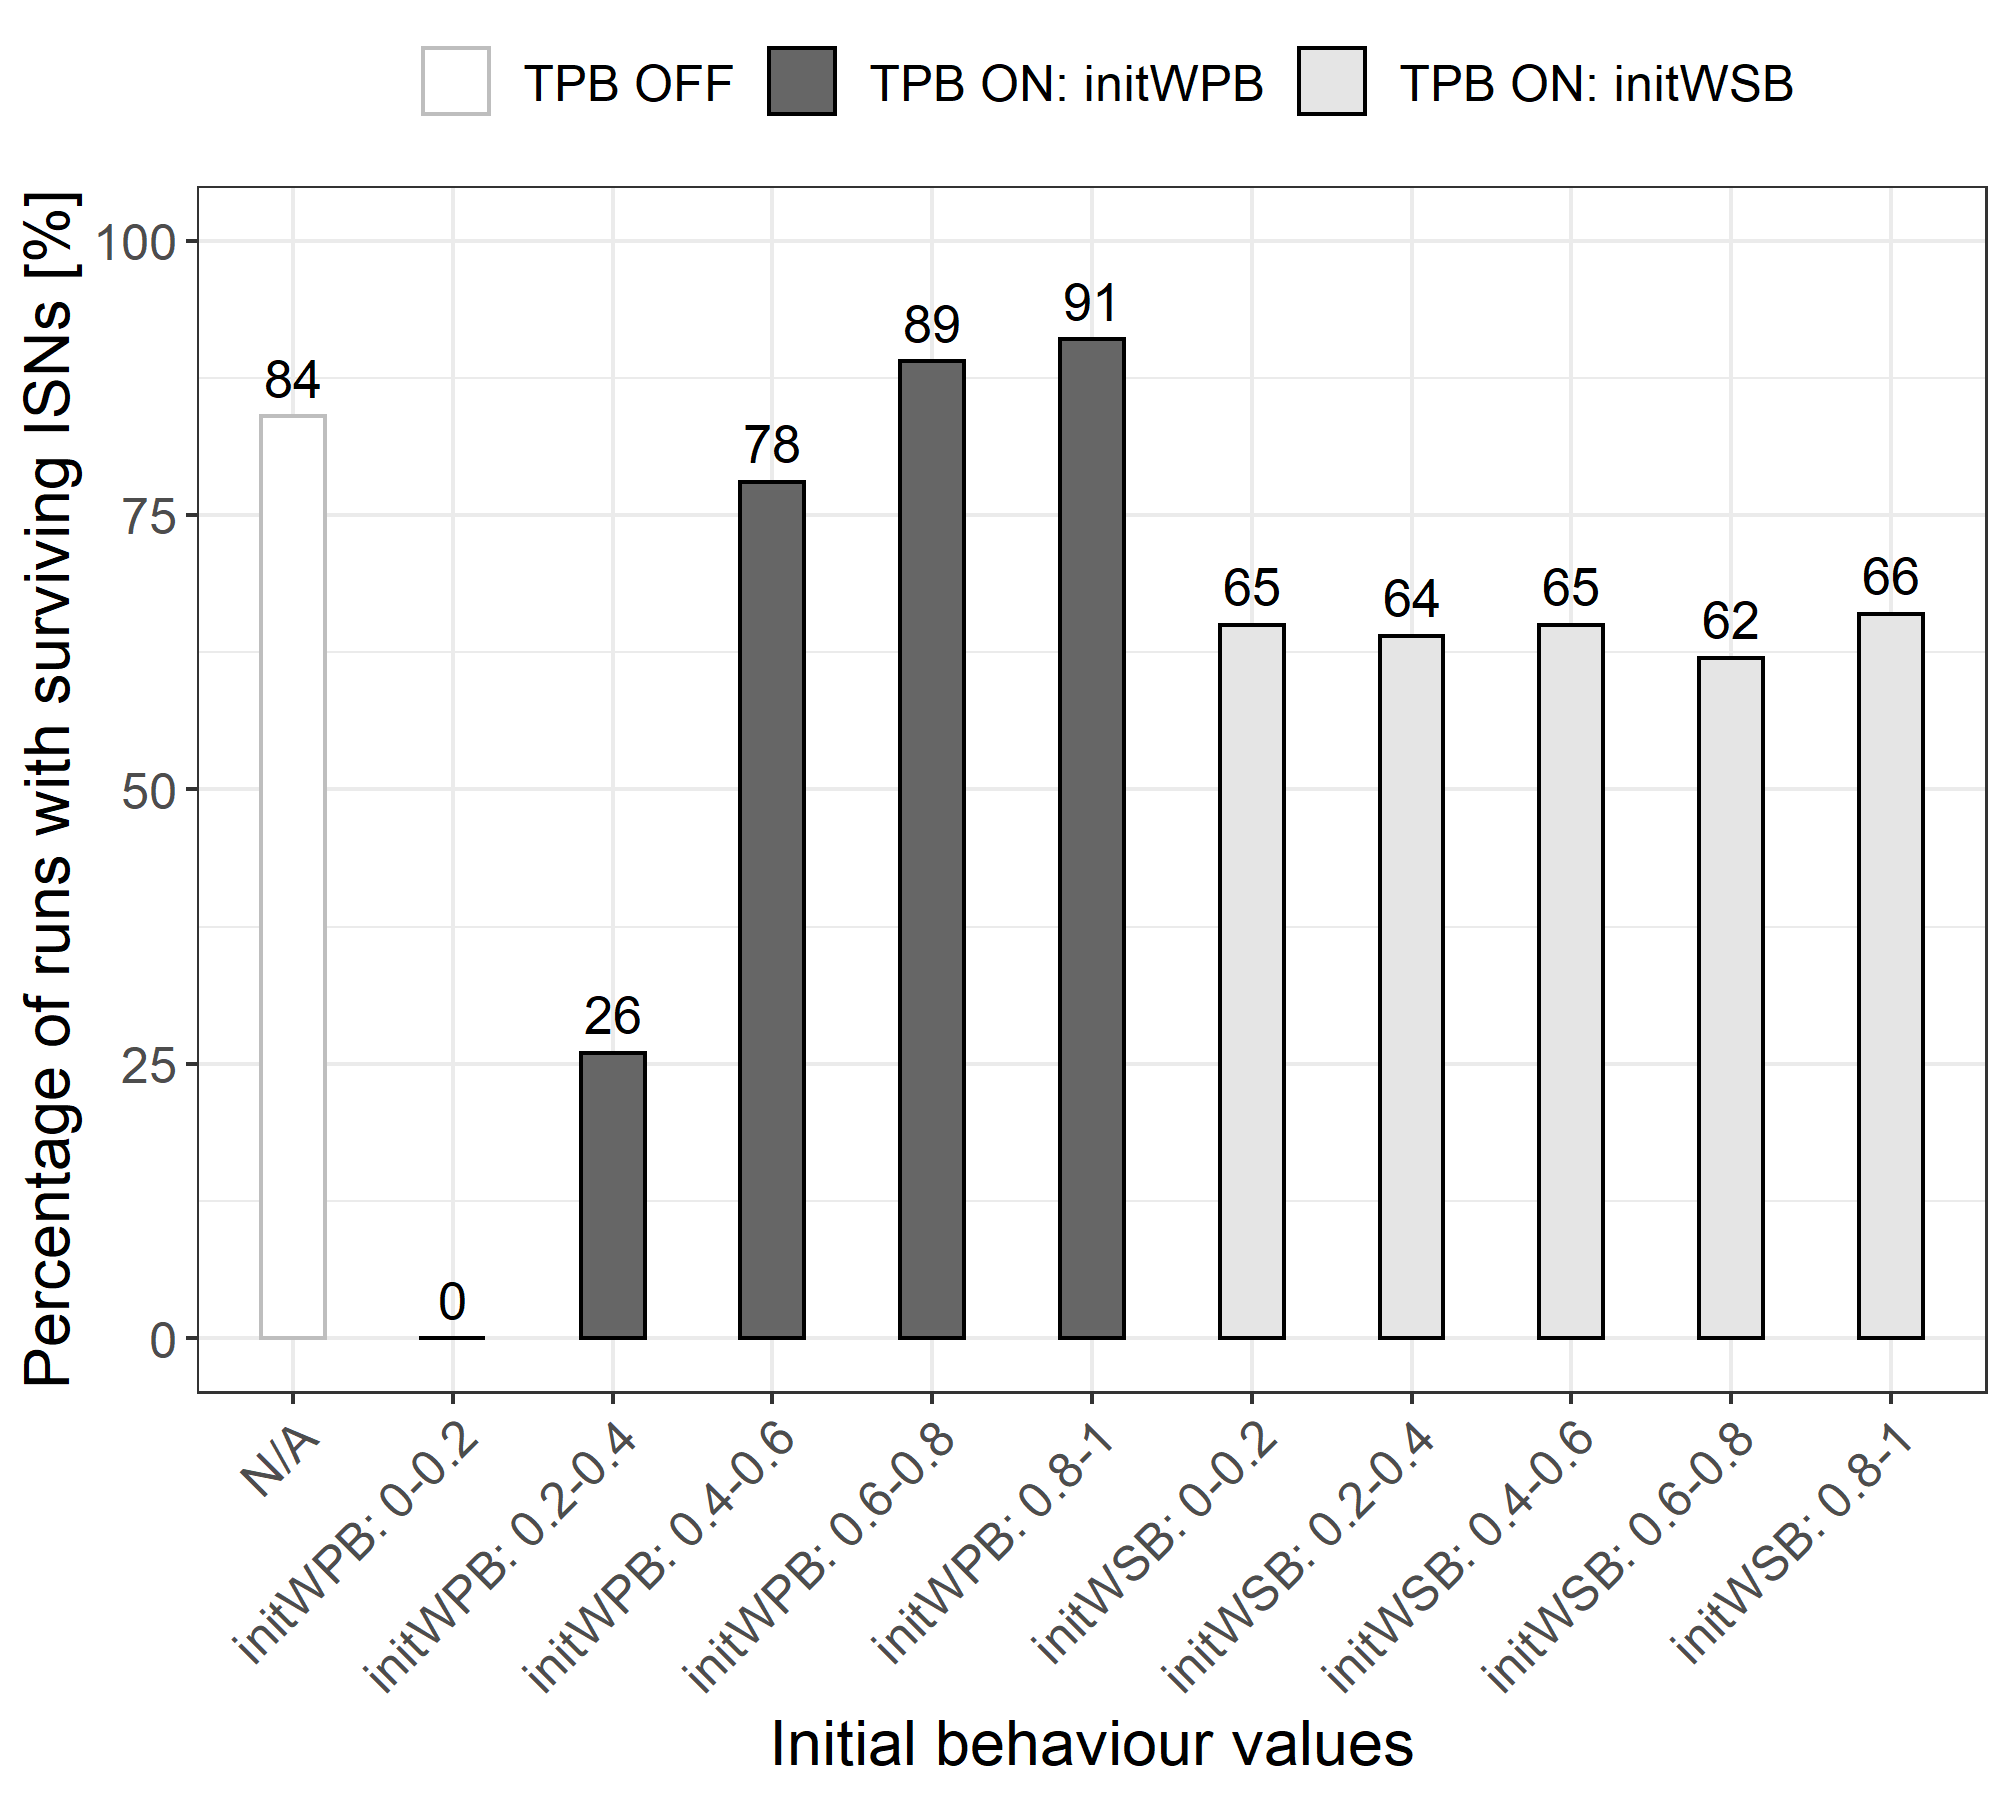
Figures 5 and 6 show the percentage of runs with surviving networks after running both TPB OFF and TPB ON input sets. For the sake of conciseness, here we discuss two types of TPB variables that affect the survival of the network: the initial behaviour values and the behaviour based leaving thresholds. Both figures show that particularly the waste processor behaviour parameters determine the robustness of the network.
Thus, in TPB OFF runs influential mechanisms regarding ISN survival outcomes are lacking.
Effect of planned behaviour on individual cash flows
The initial behaviour value and the accompanying cash flows of the supplier and processor can be found in Figures 7 and 8 respectively. Both boxplots follow standard Tukey representations. The results of accompanying Wilcoxon rank-sum tests - for not all samples can be assumed to be normally distributed - can be found in the repository (Lange et al. 2021).
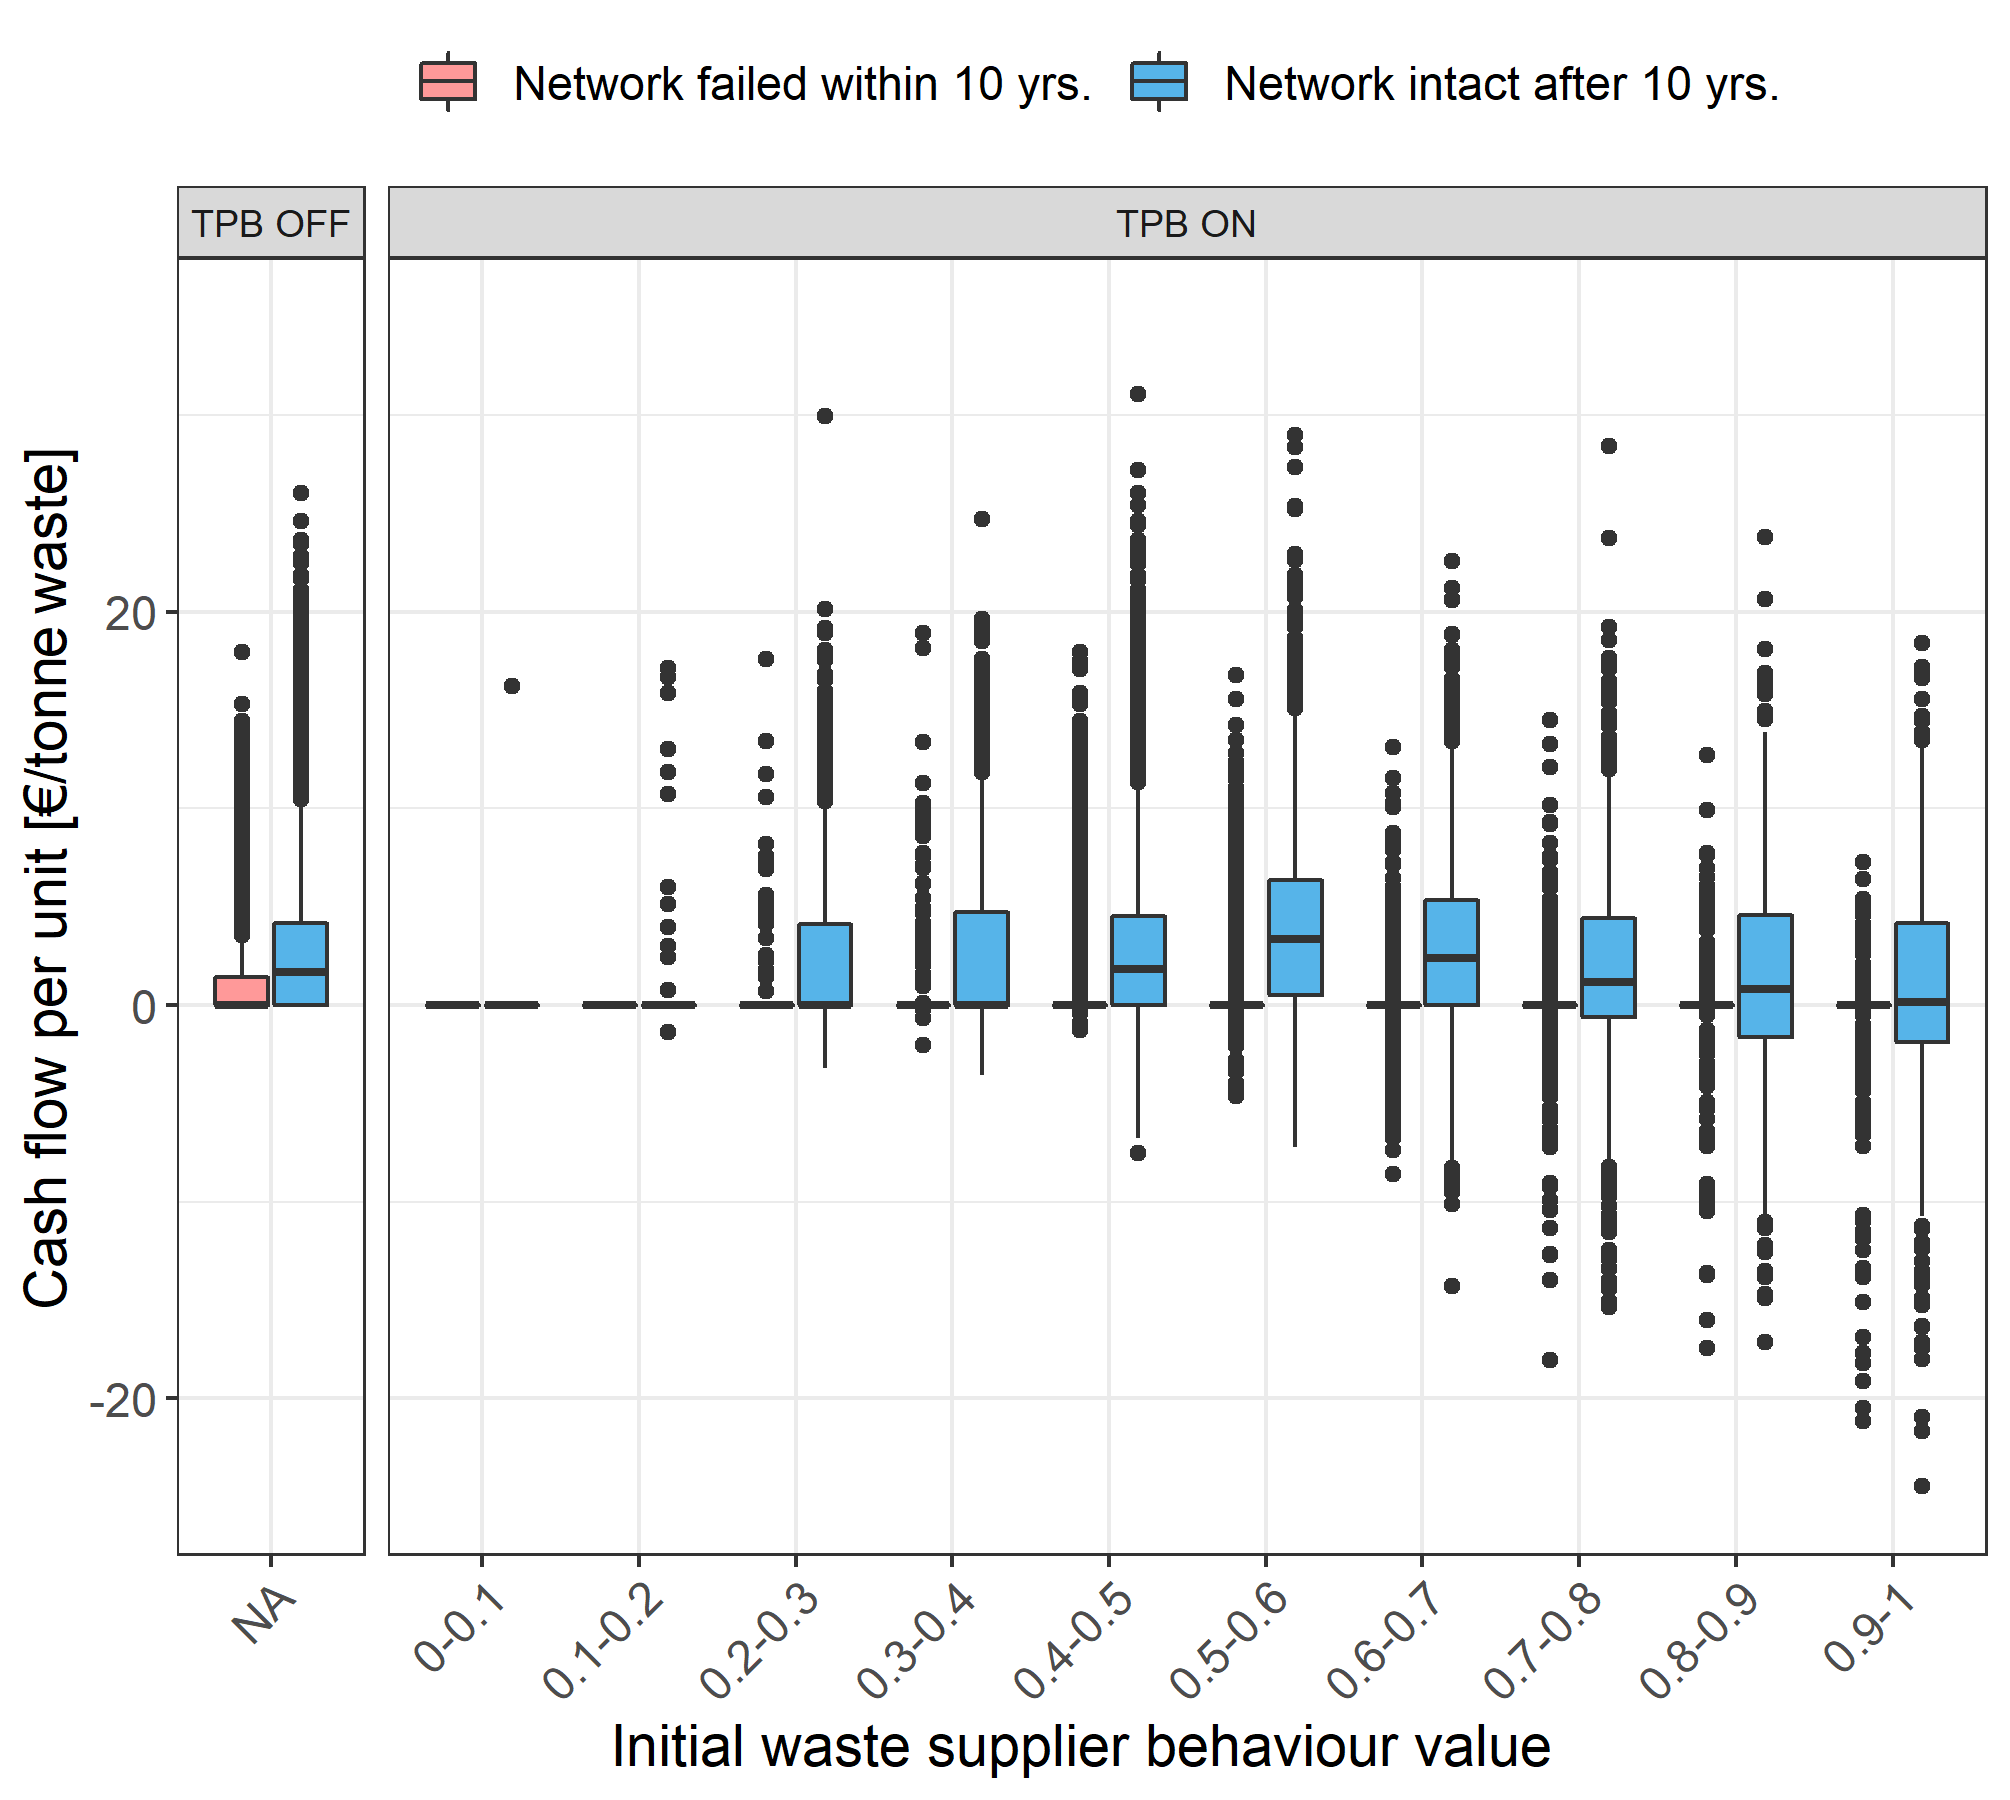
Concerning the waste supplier, the results in Figure 7 allow us to make three comparisons (i.e. the differences between cash flow outcomes for p \(\leq\) 0.05):
- There is a significant difference in cash flow outcomes between intact and failed networks.
- TPB ON model runs show a wide range of positive and negative cash flow outcomes, whereas TPB OFF model runs only show positive results.
- InitWSB between 0.5 and 0.6 is correlated with the highest cash flows. At initWSB \(>\) 0.9, the average WS plays even.
Similarly, the waste processor results in Figure 8 show that:
- There is a difference in cash flow outcomes between intact and failed networks. The failed networks show a wider variance in the TPB OFF runs, compared to TPB ON runs.
- TPB OFF and TPB ON runs with intact networks show quite similar cash flows, except for the runs with the lowest initWPB values.
- Failed networks show a tipping point at the InitWPB value of 0.5.
- All networks failed at initWPB between 0 and 0.1.
Thus, TPB OFF runs lack mechanisms that affect individual cash flow outcomes.
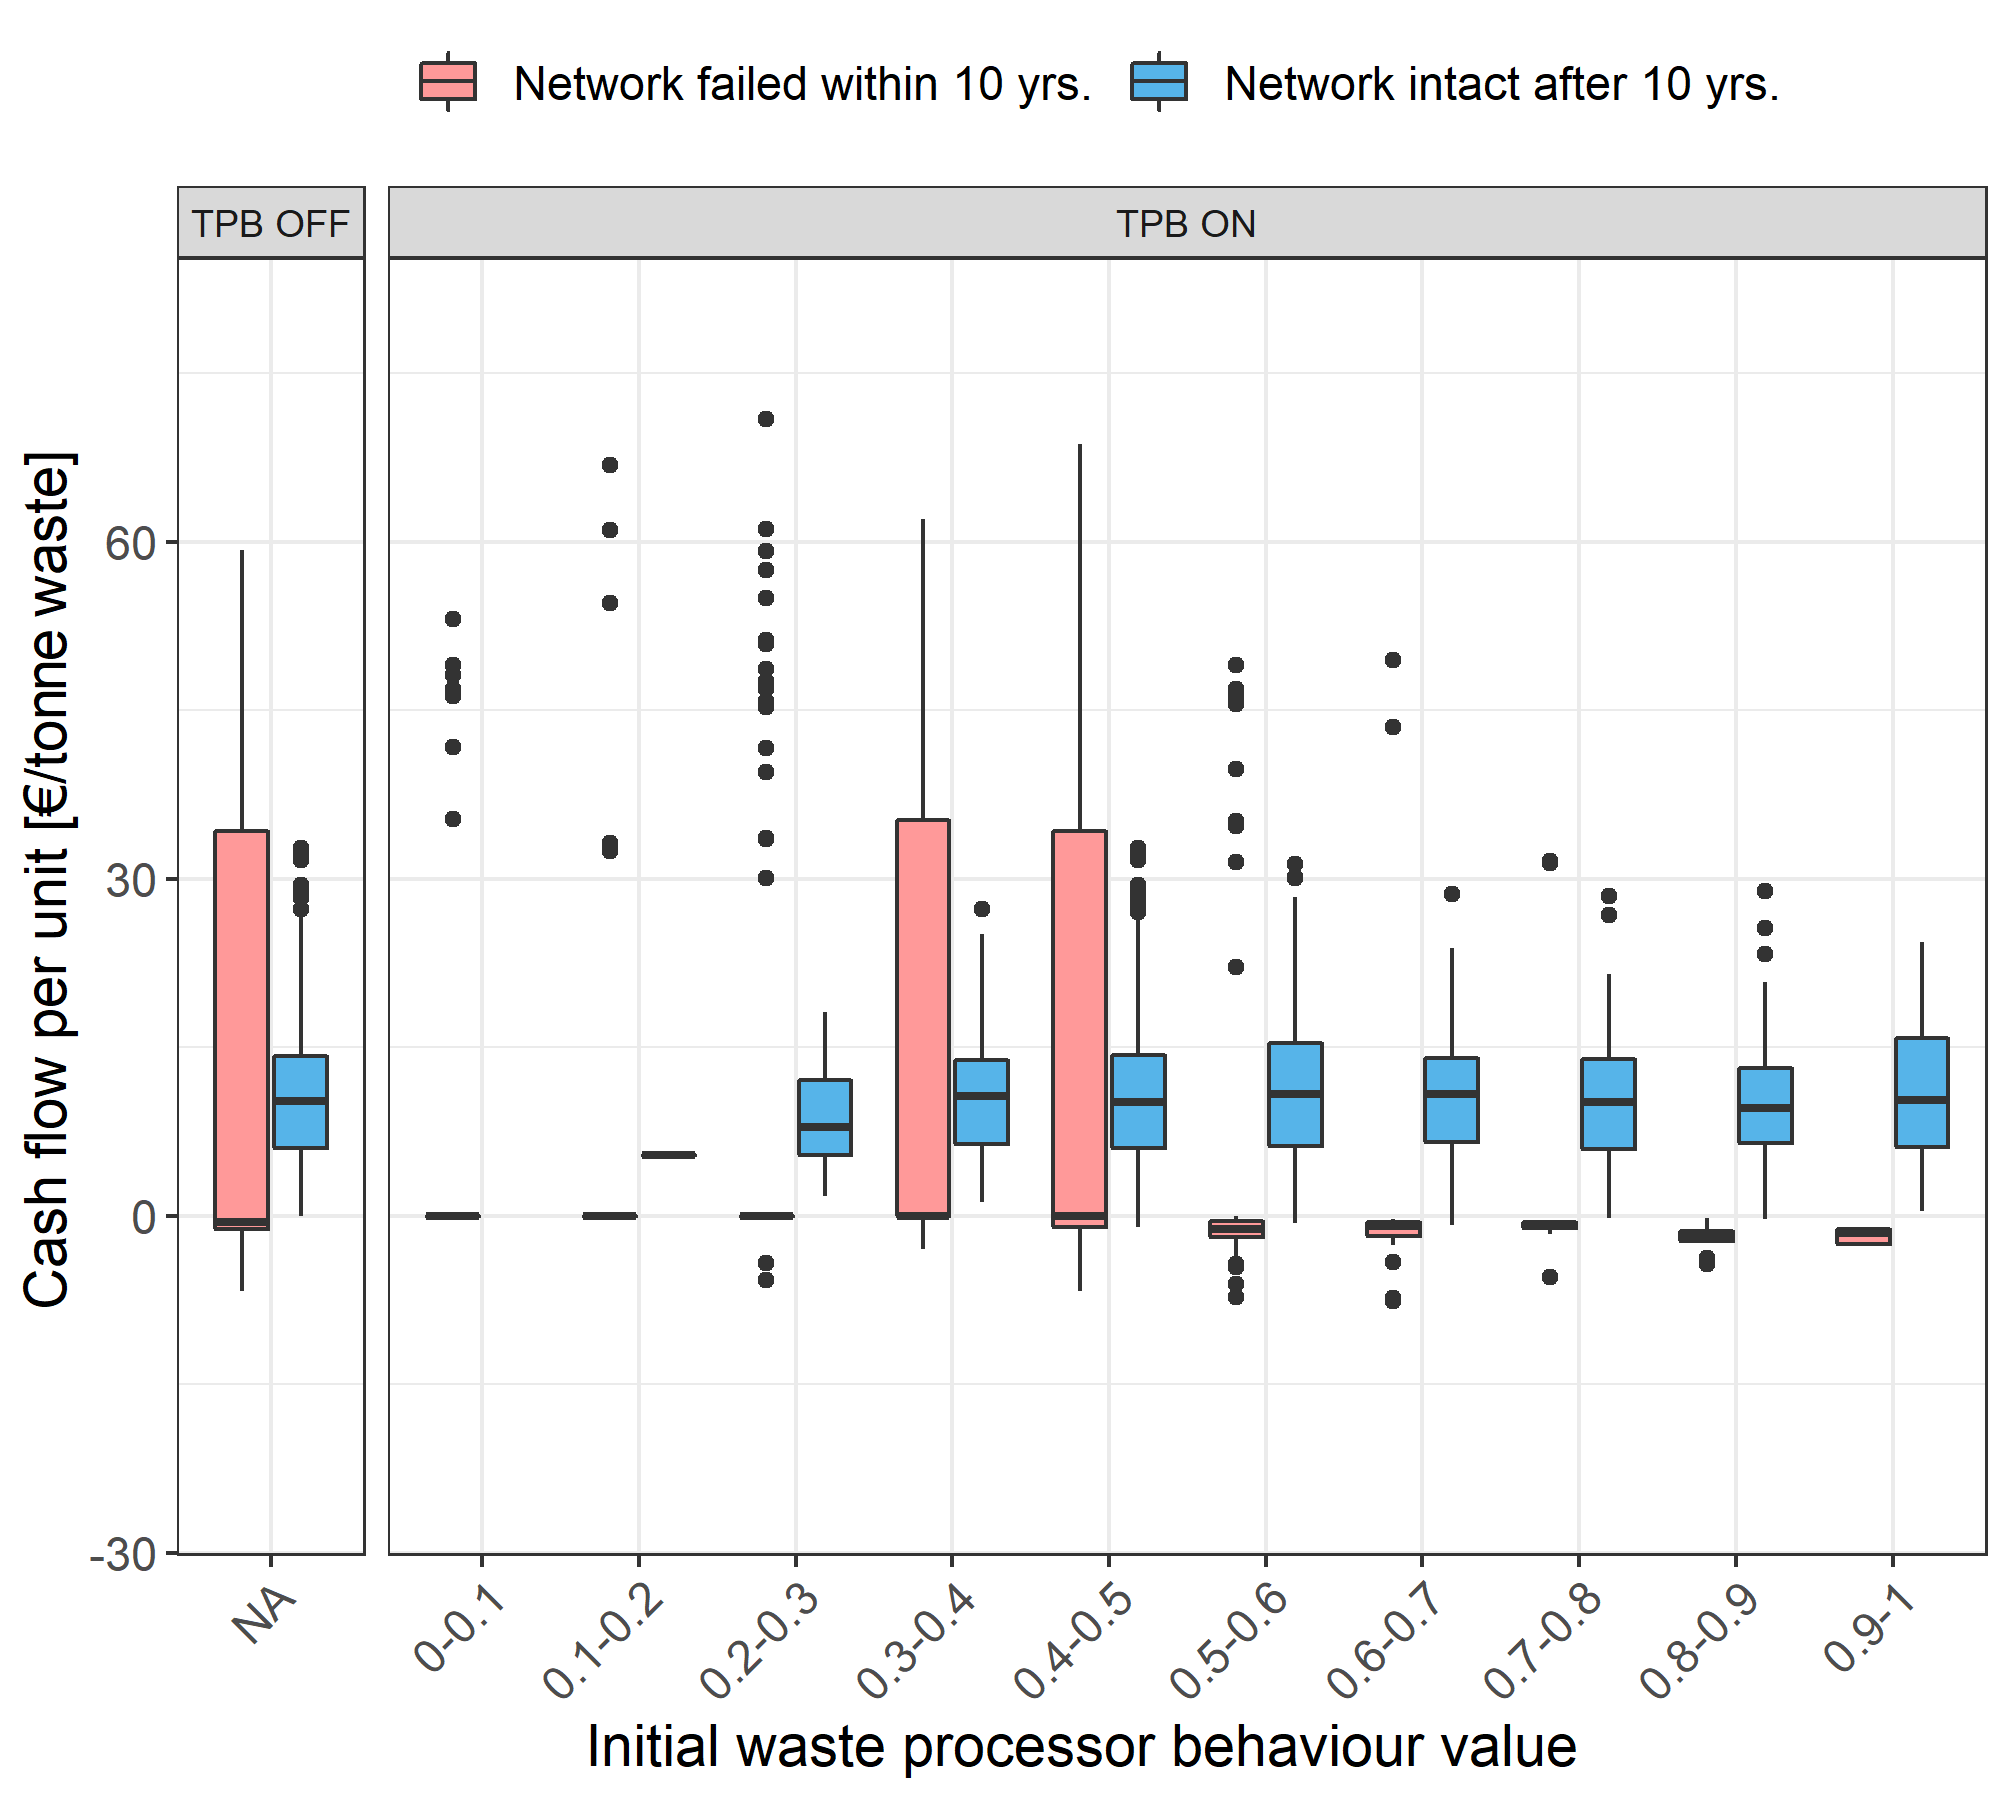
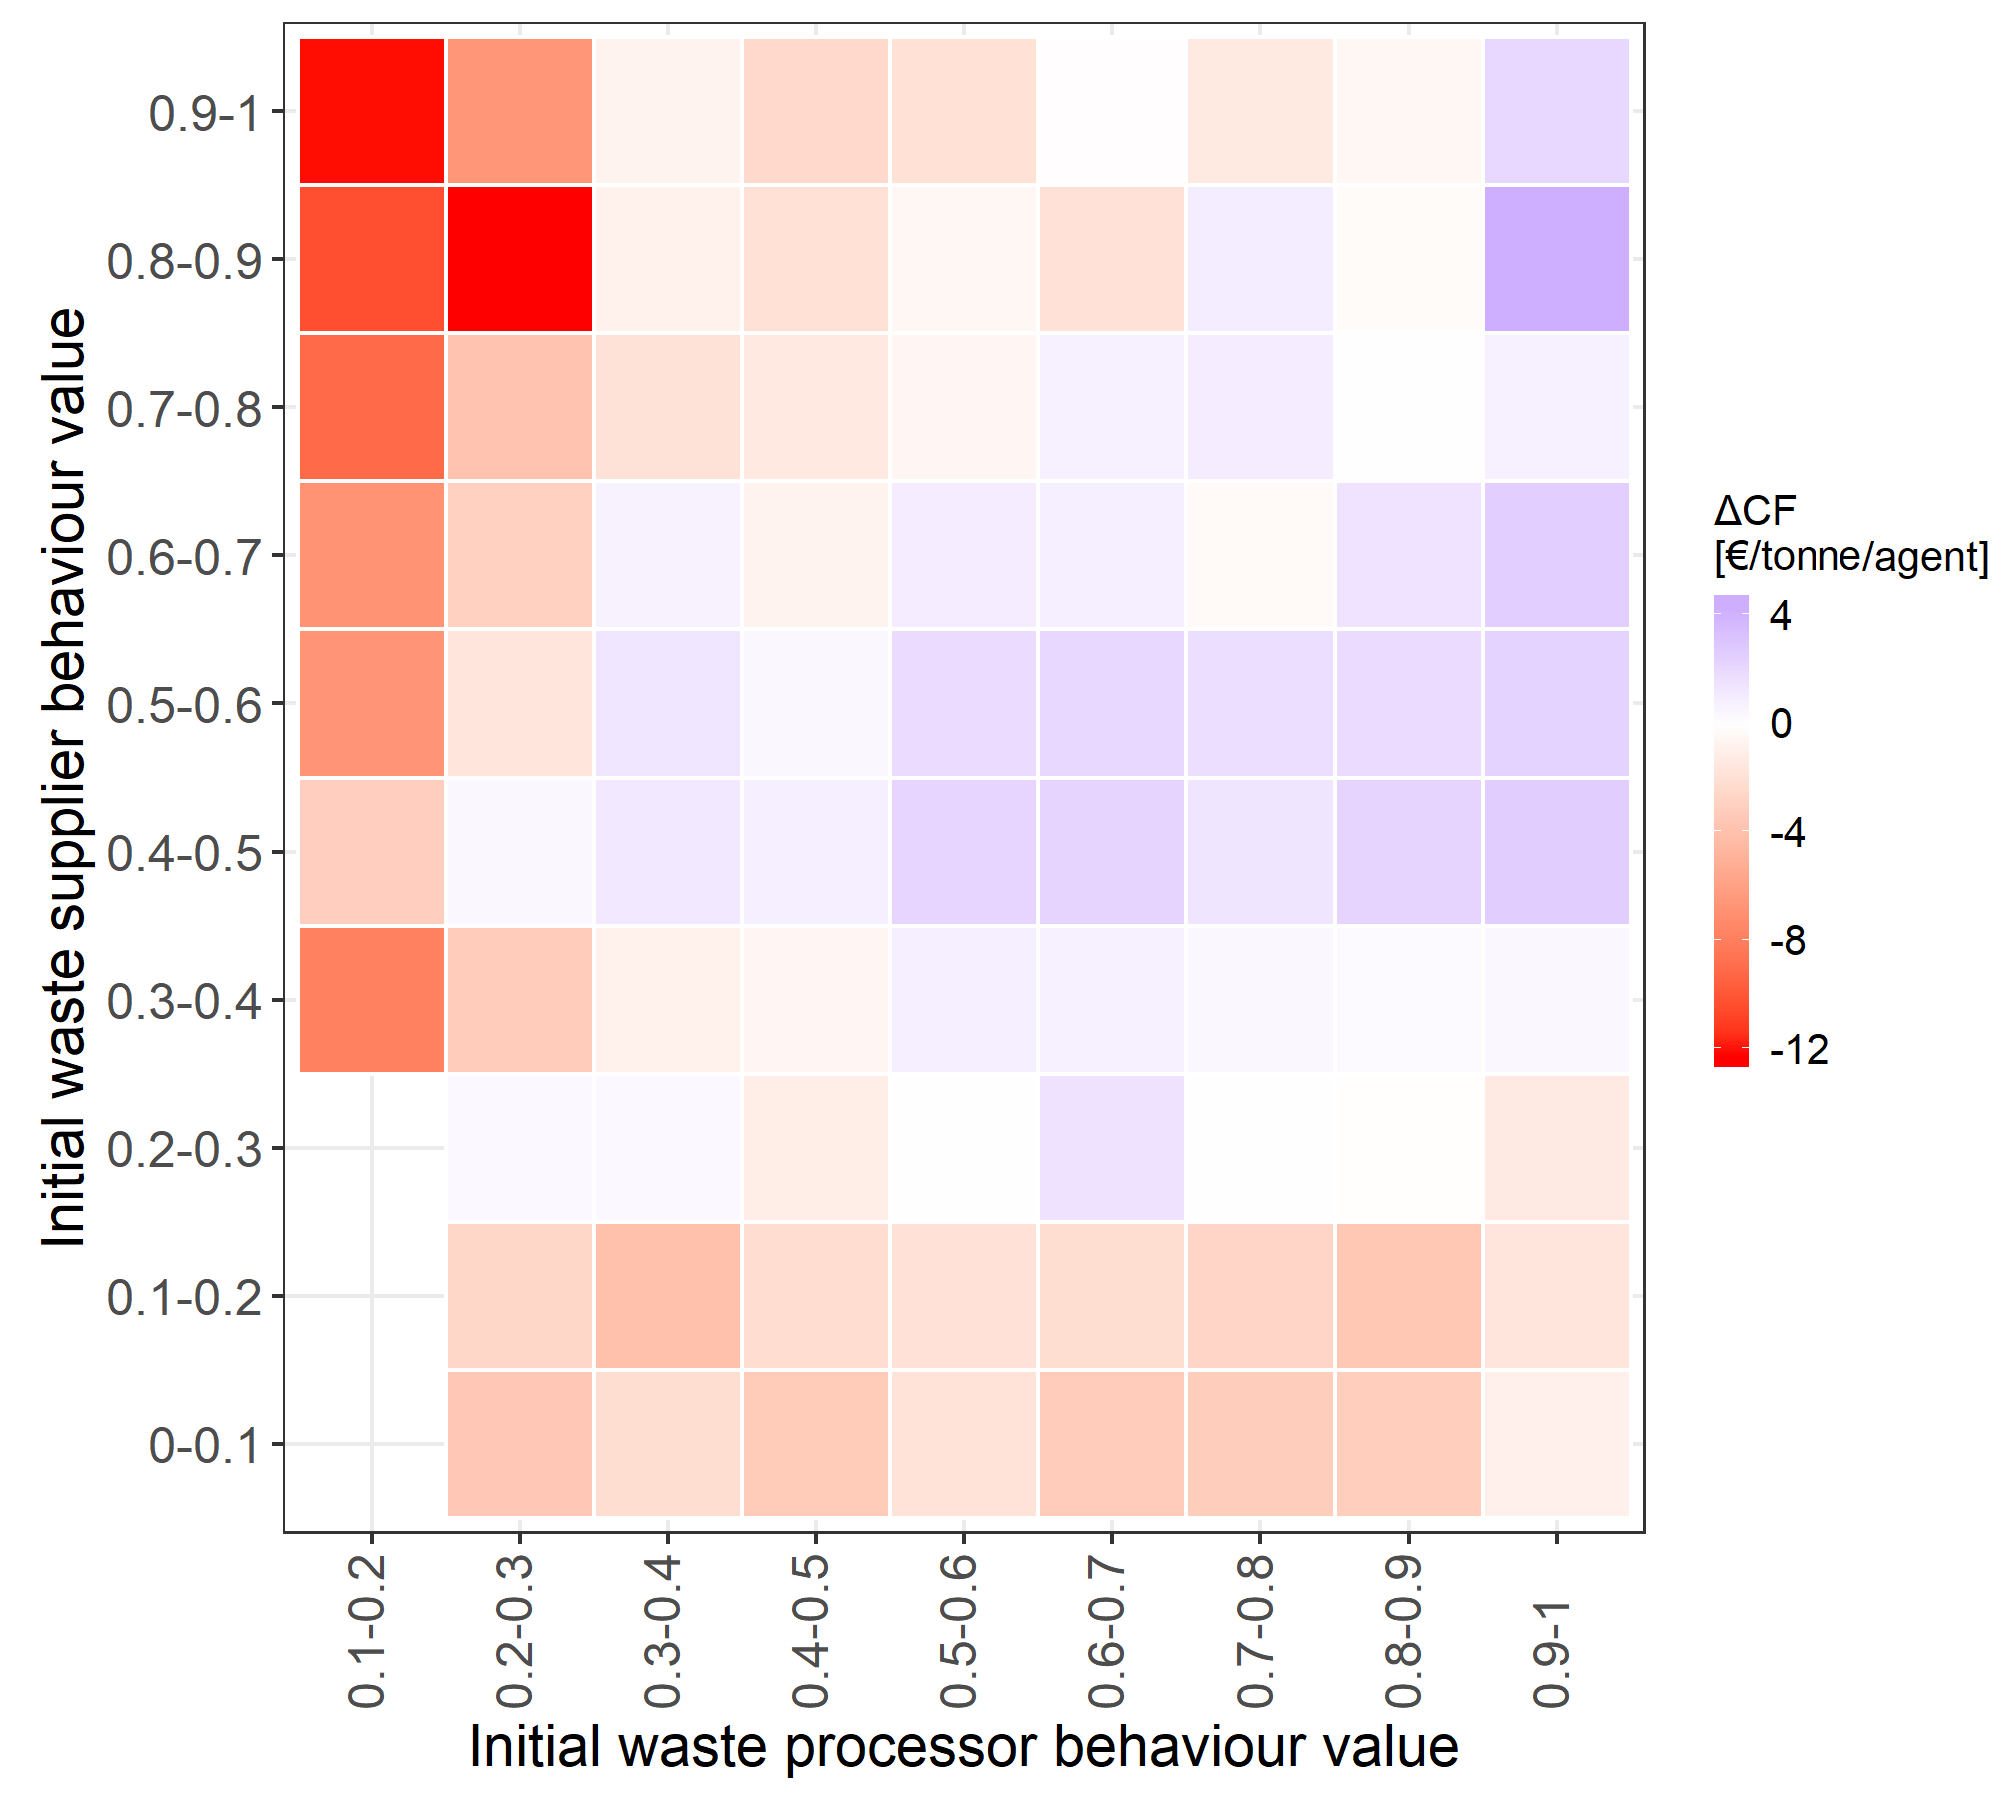
Figure 9 shows how TPB ON runs affect the normalised average cash flow outcomes for each ISN actor (surviving networks only). Four areas can be identified in this figure:
- Red areas show which initial behaviour values correlate to economic disadvantages compared to TPB OFF runs.
- In purple areas there are higher economic benefits compared to TPB OFF runs.
- In white areas there is almost no difference between TPB ON and TPB OFF runs.
- Empty areas: there are no surviving networks in the lowest combinations of initial behaviour values.
Thus, if the model does not include TPB algorithms, significant information regarding cash flow outcomes on the network level is lacking.
Discussion, Conclusions and Future Work
Validation of mechanisms and outcomes
The model represents a sociotechnical system, which implies that insights from the model affect the modelled system itself (Hodges 1991). Classical validation - in the sense of generating a model prediction and validating it with an empirical experiment - is not possible, since the simulation outcomes represent possible futures. The purpose of the model and its simulations is therefore to explore and not to predict. However, we used two methods to increase external validity of the model outcomes: expert validation and literature comparison (van Dam et al. 2013 p. 127). In repeated consultation sessions with domain experts and case participants, we systematically went through the model assumptions, the simulation mechanisms and the outcomes. The results concerning ISN robustness corroborate observations by Chertow & Ehrenfeld (2012 p. 24); they observed that ISNs often fail to grow beyond their initial set of synergies. In addition, the costs and benefits outcomes are found to be in line with the business reports and policy documents as referred to in Tables 1 and 7.
Discussion
General contribution
The current model describes the planned behaviour of waste suppliers and processors in the context of all stages of industrial symbiosis implementation. By building the model, structural, transactional and link characteristics (Doménech & Davies 2009) of the case were disclosed. The model includes network size, physical transfers of waste and money, information exchanges regarding the waste quantity and quality, and frequent negotiation and communication for setting up local collaborations. We described the agents from their specific symbiosis roles, i.e., waste supplier and processor. This allowed us to model agents that act and evaluate outcomes according to their intentions and behaviour regarding synergy creation or ending.
The model is generic and comprehensive in a way that all ISN implementation stages for firms in free-market waste management systems were included. The model was built up using a comprehensive set of data on collaborative composting by including three cases. Organic flows have a relatively high quantitative and qualitative heterogeneity. Processor capacity and supply dynamics are therefore included. In addition, the quality of the waste was modelled as ‘fitness for processing’. By doing so, the model can also be applied to analyse other types of residuals and conversion processes with relatively small efforts and without significant change of model behaviour.
The purpose of the model was to ask ‘what if’ questions about sensitivities regarding agent behaviour, combined with the ISN’s organisational design and context. In our experimental design, we used Monte-Carlo simulations in which we repeatedly manipulated the non-controllable behavioural inputs, combined with randomized contextual inputs, which were based on empirical data. This allowed us to assess the impact of TPB variables in the model.
Waste processor perspective
Planned behaviour of the waste processor affected the network’s survival and economic benefits or losses. In some simulation runs, the leaving threshold of the waste processor played a very important role for the survival of the network. The leaving threshold can be considered an indicator of actor persistence as defined by Agarwal & Strachan (2006 p. 23); it causes the waste processor to respond more or less eager to negative outcomes. Our results indicate that persistence of the waste processor influences the network robustness. This may be explained by the fact that the waste processor is able to choose between multiple waste suppliers. Only when too many waste suppliers decided to withdraw, was the processor also forced to quit due to insufficient waste deliveries. These results are in line with for example Vurro et al. (2009), who state that an organisation with a relatively high degree of centrality is able to influence the network. A waste processor that is willing and acting to implement symbiosis from the start (modelled as \(initWPB>0.5\)), can expect higher network survival chances. When the waste processor acts unwillingly, it tends to overcharge the suppliers, leading to waste suppliers leaving, resulting in network failures. If an ISN survives, the waste processor’s cash flow outcomes are not correlated with its initial planned behaviour. This is because the actions of the modelled processor are considerably determined by choosing who to negotiate with, based on the highest potential economic value of the waste stock. Hence, in case of ISN survival, economic behaviour dampens the influence of planned behaviour.
Waste supplier perspective
The modelled planned behaviour of the waste supplier does not affect the network’s survival significantly, but it does affect its economic benefits or losses. Planned behaviour of the waste suppliers causes some agents to cooperate in ISNs without making profit. This differs from the experiments without planned behaviour, in which waste suppliers never obtain negative cash flow outcomes. Waste suppliers that are slightly willing to cooperate in ISNs (initWSB close to 0.6) obtain the most economic benefit per tonne of waste. For all waste suppliers, but particularly the ones with large quantities, these benefits can make quite a difference in the low margin compost market.
ISN perspective. The modelled planned behaviour of both social actors affects the network robustness and cash flow outcomes. The simulation results show that motivating and supporting the processor as a key player are important to improve both ISN robustness and economic outcomes on the network level. This indicates that future research on policy interventions for improvement of processor behaviour is warranted.
Modeller and practitioner perspectives
This study shows that if an ISN model does not include behaviour, important mechanisms may be lacking. In practice, modelled TPB values of suppliers and processors can be measured before and during implementation of ISNs, for example by means of questionnaires (Ajzen 2002). Combined with data regarding economic outcomes, emerging synergies and disappearing synergies, this allows us to calibrate our model further and increase its informative power. Eventually, this helps practitioners to decide about joining an ISN or changing the organisational and technological design. Based on the model outcomes, we also advise stakeholders to implement interventions that encourage the waste processor to stay in the network.
Study limitations
The model and simulation study also have their limitations. One limitation concerns the case study context. The modelled Dutch market for industrial and commercial waste management is a free market, and therefore waste suppliers can choose which processor to partner with. The model cannot be used for implementation of ISNs in government planned or non-market waste management contexts. In many cases negotiation takes the form of open auction rather than the modelled bilateral negotiations. In addition, the negotiation tactics can be modelled differently, for example by implementing imitative negotiation tactics (Faratin et al. 2002). Another limitation is that the modelled behaviour is focussed on joining ISNs for competitive advantage, and other drivers for behaviour, such as personal attitude and trust towards potential partners are not yet included in the model. The model allows for testing two organisational designs, i.e., waste-as-waste and waste-as-by-product. However, since this article focuses on the behaviour of actors, only the waste-as-waste design was used in this study’s simulations. Given the emergence of circular economy research and practices, the efficacy of various organisational designs should be studied. Although the model allows for studying the effect of external disruptions, for the sake of conciseness we did not include external events in our experiments. External disruptions should be considered when more realistic insights into long-term performance of the system are required.
Conclusions
This study aims to understand how the behaviour of firms affects the implementation and robustness of symbiotic collaborations. It presents the first agent-based model that combines all ISN implementation stages of Tao et al. (2019) with planned behaviour of agents. The modelled network evolves through local by-product transactions after a series of individual decisions, communication between agents and bilateral negotiations. Adding the theory of planned behaviour as our behavioural model allows for modelling agent negotiation and self-evaluation. The model shows that adding such behavioural theory provides significantly different and more detailed insights regarding network robustness and cash flow outcomes. If behaviour was not modelled using TPB, important behavioural mechanisms would be lacking in the model, although this behaviour is measurably present in the real world.
Participatory modelling of behaviour not merely increases the external validity of industrial symbiosis network models. It also provides stakeholders insights on how ISNs can be implemented, and what factors are important to consider. The process of modelling has thus become part of the implementation of industrial symbiosis, since it facilitated social learning among participants, affecting their behavioural intention.
For practitioners, this study shows that human behaviour variables, such as the attitude, control beliefs and norms are important to include in preparing, implementing and evaluating closed loops in ISNs. Behavioural scientists can facilitate project leaders by measuring these variables. If the combination of behaviour values is unfavourable for the ISN robustness, the project leader can either rethink the system design to encourage stakeholders or engage new ISN participants.
Future research
The limitations of this study provide us with directions for future research.
More evidence from other cases should be collected to develop generic design rules for policies, business models and technology implementations. In future research we will therefore integrate more case evidence. In addition, other organisational designs, such as waste-as-by-product or policy interventions will be studied to support practitioners in ISN initiatives. To test interventions that are significantly affected by agent behaviour, future research may also include questionnaires to determine TPB values, e.g., from Ajzen (2002). To explore long-term performance and resilience of the modelled system, it is required to study the effects of external disruptions, including the behaviour of actors. Finally, we suggest comparing and integrating the proposed model with other models, to increase its contribution to understanding the complexity of real-world industrial symbiosis.
Acknowledgements
The authors would like to thank the editor and anonymous reviewers for their highly valuable comments on the previous versions of the article. In addition, we thank Janne van den Akker, Maarten Mulder, Yannick Schrik, Marco van Hees, Jan Willem Verloop, Erik Essen, Krispijn Faddegon, Simon de Rijke and Inge Oskam of AUAS for the fruitful discussions during modelling and writing the paper. We also thank the students of AUAS and TUD, who supported data collection. Finally, we sincerely thank the participants and contributors in our case studies. The case studies in the project ‘Re-Organise’ were funded by the RAAK-mkb subsidy of Stichting Innovatie Alliantie (SIA, project number 2015-03-03M), a Dutch national subsidy organisation for applied research. The case study in RAAK-mkb project ‘Re-StORe’ was funded by SIA as well (project number RAAK-MKB MKB 2017-7 SIA). This open access publication was financed by The Netherlands Organisation for Scientific Research (NWO, project number 023.009.037) and Amsterdam University of Applied Sciences (AUAS).Author Contributions
Kasper Lange contributed to conception of the work, data collection, analysis and interpretation, model development, drafting and writing the article. Gijsbert Korevaar contributed to model development, data interpretation, critical revisions of the article, and final approval of the version to be published. Igor Nikolic contributed to software implementation, data analysis and interpretation, critical revisions of the article, and final approval of the version to be published. Paulien Herder contributed to model development, data interpretation, critical revisions and final approval.Conflict of Interest Statement
The authors declare no conflict of interest. The funding sponsors had no role in the design of the study; in the collection, analyses, or interpretation of data; in the writing of the manuscript, and in the decision to publish the results.References
AGARWAL, A., & Strachan, P. (2006). NISP: Towards developing a new and integrative methodology to evaluate industrial symbiosis networks. In D. R. Lombardi & P. Laybourn (Eds.), Industrial Symbiosis in Action (pp. 21–24). New Haven, CT: Yale FES Publication Series.
AJZEN, I. (1991). The theory of planned behavior. Organizational Behavior and Human Decision Processes, 50, 179–211. [doi:10.1016/0749-5978(91)90020-t]
AJZEN, I. (2002). Constructing a TpB Questionnaire: Conceptual and methodological considerations.
ALBINO, V., Fraccascia, L., & Giannoccaro, I. (2016). Exploring the role of contracts to support the emergence of self-organized industrial symbiosis networks: An agent-based simulation study. Journal of Cleaner Production, 112(5), 4353–4366. [doi:10.1016/j.jclepro.2015.06.070]
BATTEN, D. F. (2009). Fostering industrial symbiosis with agent-based simulation and participatory modeling. Journal of Industrial Ecology, 13(2), 197–213. [doi:10.1111/j.1530-9290.2009.00115.x]
BICHRAOUI, N., Guillaume, B., & Halog, A. (2013). Agent-based modelling simulation for the development of an industrial symbiosis - Preliminary Results. Procedia Environmental Sciences, 17, 195–204. [doi:10.1016/j.proenv.2013.02.029]
BONABEAU, E. (2002). Agent-based modeling: Methods and techniques for simulating human systems. Proceedings of the National Academy of Sciences, 99(3), 7280–7287. [doi:10.1073/pnas.082080899]
BRUINS en Kwast. (2019). Markovian random walk modeling and visualization of the epidemic spread of COVID-19. Tarieven - Bruins & Kwast. Available at: https://web.archive.org/web/20210323084028/http://www.bruinsenkwast.nl/wp-content/uploads/2019/01/Tarievenlijst-2019.pdf.
CHERTOW, M. (2000). Industrial symbiosis: Literature and taxonomy. Annual Review of Energy and the Environment, 25(1), 313–337. [doi:10.1146/annurev.energy.25.1.313]
CHERTOW, M., & Ehrenfeld, J. (2012). Organizing self-Organizing systems: Toward a theory of industrial symbiosis. Journal of Industrial Ecology, 16(1), 13–27. [doi:10.1111/j.1530-9290.2011.00450.x]
DHAMODHARAN, K., Varma, V. S., Veluchamy, C., Pugazhendhi, A., & Rajendran, K. (2019). Emission of volatile organic compounds from composting: A review on assessment, treatment and perspectives. Science of the Total Environment, 695, 133725. [doi:10.1016/j.scitotenv.2019.133725]
DOMÉNECH, T., & Davies, M. (2009). The social aspects of industrial symbiosis: The application of social network analysis to industrial symbiosis networks. Progress in Industrial Ecology, 6(1), 68–99. [doi:10.1504/pie.2009.026583]
FARATIN, P., Sierra, C., & Jennings, N. R. (2002). Using similarity criteria to make issue trade-offs in automated negotiations. Artificial Intelligence, 142(2), 205–237. [doi:10.1016/s0004-3702(02)00290-4]
GANG, W., Xiao, F., Chu, K. H., Wang, G., Feng, X., & Hoong, K. C. (2014). Symbiosis analysis on industrial ecological system. Chinese Journal of Chemical Engineering, 22(6), 690–698. [doi:10.1016/s1004-9541(14)60084-7]
GHALI, M. R., Frayret, J. M. M., & Ahabchane, C. (2017). Agent-Based model of self-Organized industrial symbiosis. Journal of Cleaner Production, 161, 452–465. [doi:10.1016/j.jclepro.2017.05.128]
GHISELLINI, P., Cialani, C., & Ulgiati, S. (2015). A review on circular economy: The expected transition to a balanced interplay of environmental and economic systems. Journal of Cleaner Production, 114, 11–32. [doi:10.1016/j.jclepro.2015.09.007]
GIANNOCCARO, I. (2015). Adaptive supply chains in industrial districts: A complexity science approach focused on learning. International Journal of Production Economics, 170, 576–589. [doi:10.1016/j.ijpe.2015.01.004]
GRIMM, V., Railsback, S. F., Vincenot, C. E., Berger, U., Gallagher, C., DeAngelis, D. L., Edmonds, B., Ge, J., Giske, J., Groeneveld, J., Johnston, A. S. A., Milles, A., Nabe-Nielsen, J., Polhill, G. J., Radchuk, V., Rohwäder, M. S., Stillman, R. A., Thiele, J. C., & Ayllón, D. (2020). The ODD protocol for describing agent-based and other simulation models: A second update to improve clarity, replication, and structural realism. Journal of Artificial Societies and Social Simulation, 23(2), 7: https://www.jasss.org/23/2/7.html. [doi:10.18564/jasss.4259]
HODGES, J. S. (1991). Six (or so) things you can do with a bad model. Operations Research, 39(3), 355–365. [doi:10.1287/opre.39.3.355]
HOU, C. (2004). Predicting agents tactics in automated negotiation. Proceedings of the EEE/WIC/ACM International Conference on Intelligent Agent Technology, 2004.6
IAKOVLEVA, T., & Kolvereid, L. (2009). An integrated model of entrepreneurial intentions. International Journal of Business and Globalisation, 3(1), 66. [doi:10.1504/ijbg.2009.021632]
KAUTONEN, T., van Gelderen, M., & Tornikoski, E. T. (2013). Predicting entrepreneurial behaviour: A test of the theory of planned behaviour. Applied Economics, 45(6), 697–707. [doi:10.1080/00036846.2011.610750]
KNOERI, C., Nikolic, I., Althaus, H. J., & Binder, C. R. (2014). Enhancing recycling of construction materials: An agent based model with empirically based decision parameters. Journal of Artificial Societies and Social Simulation, 17(3), 6: https://www.jasss.org/17/3/6.html. [doi:10.18564/jasss.2528]
KRUEGER Jr., N. F., Reilly, M. D., & Carsrud, A. L. (2000). Competing models of entrepreneurial intentions. Journal of Business Venturing, 15(5), 411–432. [doi:10.1016/s0883-9026(98)00033-0]
LAMBERT, A. J. D., & Boons, F. A. (2002). Eco-industrial parks: Stimulating sustainable development in mixed industrial parks. Technovation, 22(8), 471–484. [doi:10.1016/s0166-4972(01)00040-2]
LANGE, K. P. H., Korevaar, G., Nikolic, I., & Herder, P. M. (2021). Industrial symbiosis network implementation ABM. CoMSES Computational Model Library. [doi:10.25937/dt95-xk35]
LANGE, K. P. H., Korevaar, G., Oskam, I. F., & Herder, P. M. (2017). Developing and understanding design interventions in relation to industrial symbiosis dynamics. Sustainability, 9(5), 826. [doi:10.3390/su9050826]
LOMBARDI, D. R., & Laybourn, P. (2012). Redefining industrial symbiosis: Crossing academic-Practitioner boundaries. Journal of Industrial Ecology, 16(1), 28–37. [doi:10.1111/j.1530-9290.2011.00444.x]
MANNINO, I., Ninka, E., Turvani, M., & Chertow, M. (2015). The decline of eco-industrial development in Porto Marghera, Italy. Journal of Cleaner Production, 100, 286–296. [doi:10.1016/j.jclepro.2015.03.054]
MANTESE, G. C., & Amaral, D. C. (2017). Comparison of industrial symbiosis indicators through agent-based modeling. Journal of Cleaner Production, 140, 1652–1671.
MANTESE, G. C., & Amaral, D. C. (2018). Agent-based simulation to evaluate and categorize industrial symbiosis indicators. Journal of Cleaner Production, 186, 450–464. [doi:10.1016/j.jclepro.2018.03.142]
MULDER, M., Lange, K. P. H., Schrik, Y., Faddegon, K., de Rijke, S. J., & Oskam, I. F. (2020). Re-store: Duurzaamheidsimpact bepalen en vergroten voor stedelijke initiatieven die voedselresten verwerken. Available at: https://www.hva.nl/kc-techniek/gedeelde-content/projecten/projecten-algemeen/re-store.html
MULDER, M., van den Akker, J., Lange, K. P. H., van Hees, M., Verloop, J. W., Schrik, Y., & Oskam, I. F. (2018). Re-organise - sluiten van stedelijke kringlopen door decentrale verwerking van organisch bedrijfsafval. Available at: https://research.hva.nl/en/publications/re-organise-sluiten-van-stedelijke-kringlopen-door-decentrale-ver.
SÁNCHEZ-MEDINA, A. J., Romero-Quintero, L., & Sosa-Cabrera, S. (2014). Environmental management in small and medium-sized companies: An analysis from the perspective of the theory of planned behavior. PLoS ONE, 9(2), e88504.
SHEERAN, P. (2002). Intention-behavior relations: A conceptual and empirical review. European Review of Social Psychology, 12(2), 1–36. [doi:10.1080/14792772143000003]
SINGH, M. P., Chakraborty, A., & Roy, M. (2017). Developing an extended theory of planned behavior model to explore circular economy readiness in manufacturing MSMEs, India. Resources, Conservation and Recycling, 135, 313–322. [doi:10.1016/j.resconrec.2017.07.015]
SPEKKINK, W., Teisman, G. R., & Boons, F. A. A. (2016). Industrial symbiosis as a social process: Developing theory and methods for the longitudinal investigation of social dynamics in the emergence and development of industrial symbiosis. Available at: https://repub.eur.nl/pub/79520/. [doi:10.5553/bk/092733872017026003008]
SUEZ. (2020). Algemene voorwaarden. Available at: https://web.archive.org/web/*/https://www.suez.nl/-/media/suez-nl/files/certificaten/algemeen/suez-algemene-voorwaarden-april2019.pdf.
TAO, Y., Evans, S., Wen, Z., & Ma, M. (2019). The influence of policy on industrial symbiosis from the firm’s perspective: A framework. Journal of Cleaner Production, 213, 1172–1187. [doi:10.1016/j.jclepro.2018.12.176]
TUDOR, T., Adam, E., & Bates, M. (2007). Drivers and limitations for the successful development and functioning of EIPs (eco-industrial parks): A literature review. Ecological Economics, 61(2-3), 199–207. [doi:10.1016/j.ecolecon.2006.10.010]
VAN Asselt, E., Osinga, S., Asselman, M., & Sterrenburg, P. (2012). Agent based modeling: Het simuleren van nalevingsgedrag. [doi:10.5553/beleidsonderzoek.000015]
VAN Dam, K. H., Nikolic, I., & Lukszo, Z. (2013). Agent-Based modelling of socio-Technical systems. In K. H. VAN Dam, I. Nikolic, & Z. Lukszo (Eds.), Agent-Based modelling of socio-Technical systems (pp. 21–24). Berlin/Heidelberg: Springer Science; Business Media.
VAN der Wurff, A. W. G., Fuchs, J. G., Raviv, M., & Termorshuizen, A. (2016). Handbook for Composting and Compost Use in Organic Horticulture.Available at: https://edepot.wur.nl/375218. [doi:10.18174/375218]
VERENIGING Afvalbedrijven. (2013). Groene groei met gft is grondstof. Report. Available at: https://web.archive.org/web/20210319110507/
https://www.verenigingafvalbedrijven.nl/userfiles/files/VA_Groene_groei_met_gft_als_grondstof_juni_2013.pdf.
VERZIJL, D., Warmenhoven, B., van Dijk, B., & Dirkmaat, T. (2019). Gedragsinzichten maken beleid voor bedrijven beter. Available at: https://esb.nu/esb/20052710/gedragsinzichten-maken-beleid-voor-bedrijven-beter.
VLACO. (2009). Ecologische en economische voordelen gft - En groencompost. Available at: https://web.archive.org/web/20210319110711/https://www.vlaco.be/sites/default/files/generated/files/page/ecologische-en-economische-waardering-compost-eindversie-1.pdf.
VURRO, C., Russo, A., & Perrini, F. (2009). Shaping sustainable value chains: Network determinants of supply chain governance models. Journal of Business Ethics, 90(4), 607–621. [doi:10.1007/s10551-010-0595-x]
WANG, D., Li, J., WANG, Y., Wan, K., Song, X., & Liu, Y. (2017). Comparing the vulnerability of different coal industrial symbiosis networks under economic fluctuations. Journal of Cleaner Production, 149, 636–652. [doi:10.1016/j.jclepro.2017.02.137]
WEBB, T. L. & Sheeran, P. (2006). Does changing behavioral intentions engender behavior change? A metaanalysis of the experimental evidence. Psychological Bulletin, 132(2), 249–268. [doi:10.1037/0033-2909.132.2.249]
YAP, N. T., & Devlin, J. F. (2016). Explaining industrial symbiosis emergence, development, and disruption: A multilevel analytical framework. Journal of Industrial Ecology, 21(1), 6–15. [doi:10.1111/jiec.12398]
YAZAN, D. M., Fraccascia, L., Mes, M., & Zijm, H. (2018). Cooperation in manure-based biogas production networks: An agent-based modeling approach. Applied Energy, 212, 820–833. [doi:10.1016/j.apenergy.2017.12.074]
YAZAN, D. M., Yazdanpanah, V., & Fraccascia, L. (2020). Learning strategic cooperative behavior in industrial symbiosis: A game‐theoretic approach integrated with agent‐based simulation. Business Strategy and the Environment, 29(5), 2078–2091. [doi:10.1002/bse.2488]
ZENG, Y., Xiao, R., & Li, X. (2013). A resilience approach to symbiosis networks of ecoindustrial parks based on cascading failure model. Mathematical Problems in Engineering, 2013, 1–11. [doi:10.1155/2013/372368]
ZHENG, K., & Jia, S. (2017). Promoting the opportunity identification of industrial symbiosis: Agent-Based modeling inspired by innovation diffusion theory. Sustainability, 9(5), 765. [doi:10.3390/su9050765]
ZHU, J., & Ruth, M. (2013). Exploring the resilience of industrial ecosystems. Journal of Environmental Management, 122, 65–75. [doi:10.1016/j.jenvman.2013.02.052]
ZHU, J., & Ruth, M. (2014). The development of regional collaboration for resource efficiency: A network perspective on industrial symbiosis. Computers, Environment and Urban Systems, 44, 37–46. [doi:10.1016/j.compenvurbsys.2013.11.001]